
Contraceptive Method Information and Method Switching in India
by
 , , ,
, , ,
Md. Juel Rana
1,* ,
,
Srinivas Goli
2 ,
,
Rakesh Mishra
3 ,
,
Abhishek Gautam
4,
Nitin Datta
4, 
Priya Nanda
5 and
Ravi Verma
4 1
International Institute for Population Sciences, Mumbai 400001, India
2
Australia India Institute (AII), Perth, WA 6000, Australia
3
United Nations Children’s Fund (UNICEF), New Delhi 110001, India
4
International Center for Research on Women (ICRW), New Delhi 110001, India
5
Bill & Melinda Gates Foundation, India Country Office, New Delhi 110001, India
*
Author to whom correspondence should be addressed.
Sustainability 2021, 13(17), 9831; https://0-doi-org.brum.beds.ac.uk/10.3390/su13179831
Submission received: 29 June 2021
/
Revised: 14 August 2021
/
Accepted: 23 August 2021
/
Published: 1 September 2021
(This article belongs to the Special Issue Health in All: Global Health and Sustainable Development Goals)
Abstract
:The stagnation in the unmet need for family planning and rise in contraceptive discontinuation rates are major concerns among researchers and policymakers in India. This study attempts to investigate the association between method information received by the users at the time of initiation and the switching of contraceptive methods in India. Using the fourth round of National Family Health Survey (NFHS) data (2015–2016), a multinomial logistic regression model has been applied to assess the net effects of method information received by the users on switching of contraceptive methods. The reuse of contraceptive methods is higher among those who were not provided any method information. The reuse is also higher among those who were informed only about the side effects. Overall, the users who received comprehensive method information are more likely to switch. Particularly, the users who were informed about how to manage side effects either alone or along with other method information have a higher likelihood of switching especially to long-acting reversible contraceptives (LARC). The findings call for program intervention to provide comprehensive method information to the users because it gives them the freedom to switch to more suitable methods. Thus, it would help in achieving the sustainable development goal (3.7) of informed choice of contraceptive methods.
1. Introduction
Currently, the stagnation in the unmet need for family planning in some of the major states of India and the rise in contraceptive discontinuation rates are major concerns among researchers and policymakers in the country [1]. Information about contraceptive methods received by the users is an essential aspect of quality of care in family planning [FP] which is essential to safeguard individuals’ or couples’ reproductive health and rights [2,3]. Further, it helps to improve the contraceptive continuation and switching. Globally, several studies attempted to measure the quality of care in FP and to find its association with contraceptive continuation and switching [4,5,6,7,8,9,10,11]. However, limited studies comprehensively focused on assessing the relationship between information received by users and contraceptive use dynamics in India.
Worldwide, previous studies have applied different datasets and methodologies to quantify the quality of care in FP. Some of those studies have also investigated the association between quality of care in FP, contraceptive continuation, and switching. In particular, a study using the evidence from Egypt Demographic and Health Surveys (DHS) suggested that the lack of health personnel training, unavailability of a female doctors in health facilities, and unavailability of large method-mix led to a higher risk of discontinuation of the pill [4]. Another study from Egypt showed that counseling and follow-up check-ups among the users increased the insertion and continuation of intrauterine devices (IUD) [12]. In urban Kenya, the provider’s cooperation with method selection, providing information about side effects and good behavior with clients was positively related to the use of modern contraception [5]. An analysis from panel data in Morocco observed that both supply and demand-side environments considerably influence the future intention of contraceptive use [6]. An investigation using cross-sectional data im Peru showed that the contraceptive prevalence is higher in the clusters of the high quality of care in FP than their counterpart [7]. In rural Tanzania, the probability of contraceptive use is higher among those who had been informed about the methods along with other components of quality of care [8]. Prospective survey data from the Philippines and Bangladesh show that the adoption and continuation of contraceptive methods increased with an increasing quality of care in FP [10,11].
Using the evidence from India, several studies have been carried out focusing on the contraceptive use dynamics and its socioeconomic and demographic determinants. For instance, a comprehensive report on FP documents an assessment of contraceptive method discontinuation and switching using the data from the first and second rounds of NFHSs [13]. An investigation on socioeconomic and demographic determinants of contraceptive discontinuation has been analyzed using the evidence from the third round of NFHS conducted during 2005–2006 [14]. Using the data from the District Level Household Survey (DLHS), a study assessed the key determinants of not using any contraceptive methods and future intention of use [15]. All these previous studies from India did not touch upon contraceptive switching. Also, none of them analyzed its association with the method information received by the users or any components of quality of care. According to our knowledge, only one study has attempted to assess the relationships between the Method Information Index (MII) as a component of quality of care and contraceptive prevalence rate at the macro level in India which found a weak positive relationship [16]. Thus, in the previous literature, a comprehensive assessment of the relationship between method information received by the users and switching is not established.
In the past decade (from 2005–2006 to 2015–2016), the contraceptive discontinuation rate has increased from 25% to 28% for modern spacing methods and 14% to 16% for traditional spacing methods [1,17]. These high levels of contraceptive discontinuation rates and their rising trend draw concerns from the quality of care in FP in India. A study using the evidence from Nepal found that detailed information received by the users can significantly influence the method continuation, while merely giving them information about other contraceptive methods and group counseling has meager effects [9]. Thus, the contraceptive use dynamics of an individual may be conditional to the information that they receive. In a country where a large share of contraceptive users discontinues their previous methods, an investigation on the association of method information received by the users and their method switching needs to be studied. Therefore, this study focuses on the relationship between information received by users and the switching of contraception in India.
The mechanism of the relationship of reuse and switching of contraceptive methods could be closely associated with the method information provided to the contraceptive users. For instance, due to a lack of information on the availability of other methods, users may reuse the same methods which they discontinued earlier. The users having information about only side effects and not knowing how to manage side effects may lead to the discontinuation of methods if they do not know other methods they could have switched to. In this background, this study provides insights into the association between method information received by the users and the method switching in India.
2. Materials and Methods
2.1. Data Source and Sample Selection
The fourth round of the National Family Health Survey (NFHS) of India conducted in 2015–2016 has been used for a statistical investigation of the stated research objective in the study. This survey collects the contraceptive behaviors in the last five years, and the data provides scope to calculate the contraceptive initiation, discontinuation, reuse, switching to other methods. The survey also collects the information exchanged about contraceptive methods between service providers and the clients at the time of initiation of the currently using contraceptive method. The time of initiation of the contraceptive method refers to the months in which the users begin to use the current contraceptive method within the last five years. During the survey, the three method-related questions were asked to those whose current contraceptive methods were an oral pill, IUD, injectable and female sterilization. Female sterilization is excluded from the study because those who have undergoene it do not have the option of switching. So, the analyses of the present study restrict the sample to those who are currently using the three modern spacing methods of contraceptives (viz. pill, IUD, and injectables) as well as those who have discontinued any methods previously in the last five years (n = 8525).
2.2. Study Variables
The outcome variable for the study is switching to modern contraceptive methods for those who discontinued their previous methods in the last five years. As the method-related information is available only on certain currently used modern contraceptive methods (viz. pill, IUD, and injectables), the reuse and switching from the previous methods (both modern and traditional methods) is possible to these three modern methods. The pill, injectables, and IUD are considered short-acting and long-acting reversible modern contraceptive methods, respectively. However, the injectable users have been merged with the IUD due to the small sample size and categorized as long-acting reversible contraceptives (LARC) in this paper. Also, both the methods (IUD and injectable) need similar program support unlike the pill [18]. Thus, the method switching has been categorized into five groups viz. (1) reuse of the previously discontinued method, (2) ‘other modern methods’ to pill, (3) traditional methods to pill, (4) ‘other modern methods’ to LARC and (5) traditional methods to LARC (for detailed categorisation, please see Table 1). The categorization of modern and traditional methods of contraception also varies among the researchers particularly for Lactational Amenorrhea Method (LAM) and Standard Daily Method (SDM) [18,19]. In this study, both the method such as LAM and SDM were included in the traditional methods because these methods only help to identify the fertile period and suggest that couples avoid sex, but they do not prevent pregnancy after sex [19].
The main predictor variable for the study is method information received by contraceptive users about side effects, how to manage side effects, and other methods. The responses to these questions have been recorded in binary form (‘no’ and ‘yes’). A possible eight combinations of ‘no’ and ‘yes’ of these three methods related information have been made for investigating the differentials in the association between variation in the information received by the users and switching behaviors. Besides, a range of socioeconomic and demographic variables which have possible effects on method switching have been controlled in the multivariate analysis (Table A1). These variables could have potential effects on the reuse or switching of contraceptive methods because these variables have been identified in the previous literauture as potential determinants of contraceptive use dynamics [14,20].
2.3. Statistical Analyses
For bivariate analyses, the percentage distribution of the reuse of contraceptive methods and switching behaviors by method information has been estimated. The outcome measure of the study as identified in the previous section is a polytomous variable with five mutually exclusive and exhaustive categories. Considering the nature of the response variable, a multinomial logistic regression has been applied to assess the net effect of information received by the users on the contraceptive method switching. Multinomial logistic regression is an extension of binary logistic regression for variable with more than two categories. It utilizes Maximum likelihood approach to fit the model described below [21].
where j = 1, 2, 3, …, (k − 1) and i = 1, 2, …, n, i’ is the category indicating the reference category and i is the identified category of the response variable.
ln [{P(Yj = i)|Xi}/{P(Yk = i’)|Xi}]= α0i + β1j x1i + β2j x2i + β3jx3i+ … + βpixpi
Since, sum of all Pi’s equals to unity.
In the present study the model is describes as follows,
where Y is the outcome variable which has five categories namely reuse (Y = 1), modern method to pill (Y = 2), traditional method to pill (Y = 3), modern method to LARC (Y = 4) and traditional method to LARC (Y = 5). α0i’s are the intercepts for the category of switching namely modern method to pill, traditional method to pill, modern method to LARC, and traditional method to LARC respectively. Also, βpis are the regression coefficents.
ln [{P(Yi = 2)|Xi}/{P(Yi = 1)|Xi}]= α01 + β11 method_information + β21 women_education + β31 age_group + β41 mass_media + β51 parity + β61 residence + β71 wealth quintile + β81 religion + β91 caste + β101 duration
ln [{P(Yi = 3)|Xi}/{P(Yi = 1)|Xi}]= α02 + β21 method_information + β22 women_education + β32 age_group + β42 mass_media + β52 parity + β62 residence + β72 wealth quintile + β82 religion + β92 caste + β102 duration
ln [{P(Yi = 4)|Xi}/{P(Yi = 1)|Xi}]= α03 + β13 method_information + β23 women_education + β33 age_group + β43 mass_media + β53 parity + β63 residence + β73 wealth quintile + β83 religion + β93 caste + β103 duration
ln [{P(Yi = 5)|Xi}/{P(Yi = 1)|Xi}]= α04 + β14 method_information + β24 women_education + β34 age_group + β44 mass_media + β54 parity + β64 residence + β74 wealth quintile + β84 religion + β94 caste + β104 duration
3. Results
Table 1 presents the distribution of previously discontinued methods by switching to modern contraceptive spacing methods in India. It shows that the reuse of the same contraceptive methods is about 83%, 15%, and 2% for the pill, IUD, and injectable users, respectively. Among those who switched from modern methods to the pill, a major share of them is from condoms (81%), IUD (14%), and injectables (4%) users. The users who switched to the pill from traditional methods are mainly those who previously discontinued withdrawal (47%) and rhythm or periodic abstinence (43%) methods. The share of switchers from other modern methods to LARC is mostly from condoms (64%) and pill (33%) users. Among the switchers from traditional methods to LARC, the majority of them are from those who discontinued rhythm or periodic abstinence (56%) and withdrawal (40%) methods.
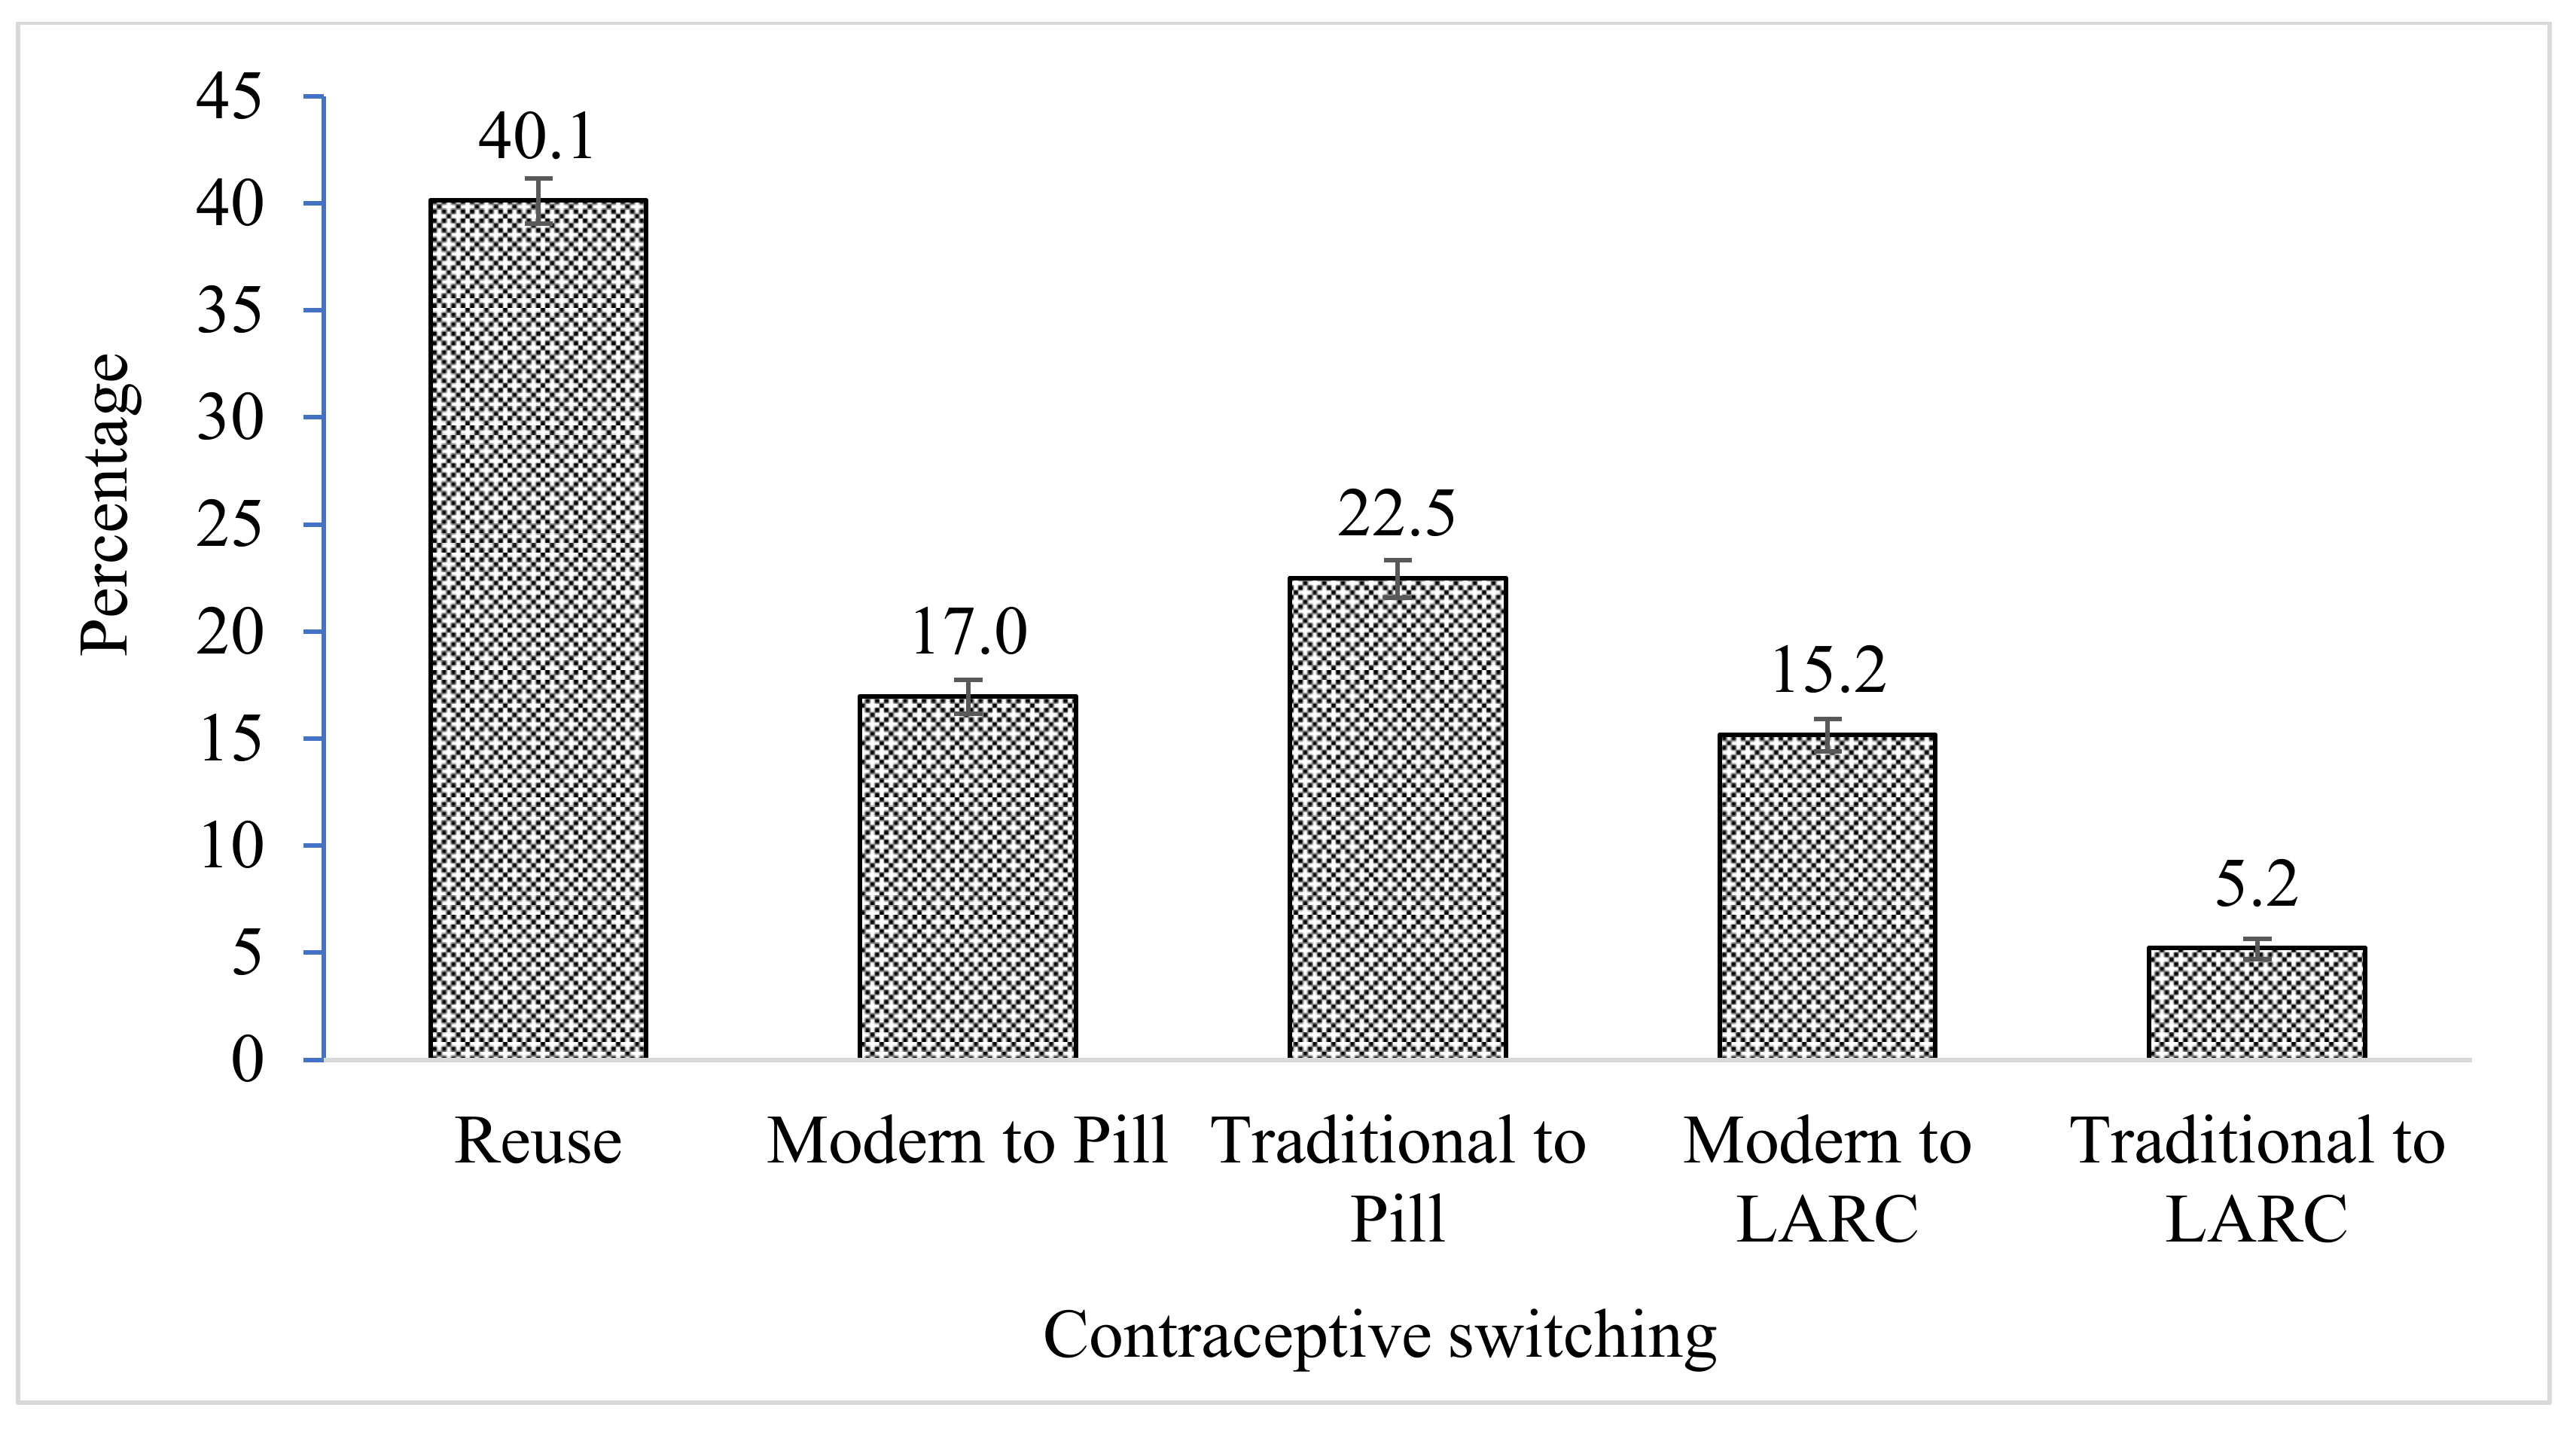
Figure 1 displays the percentage share of users who reuse and switched to modern contraceptive spacing methods in the selected sample. It shows that about 40% of the total users reuse their methods (pill, IUD, and injectables) which they discontinued earlier in the last five years. At the same time, about 39% and 21% of the users switched to the pill and LARC respectively. Among those who switched to the pill, about 17% and 22% previously discontinued any other modern and traditional methods, respectively. Among those who switched to LARC, the percentage of switchers from other modern and traditional methods is 15% and 5% respectively.
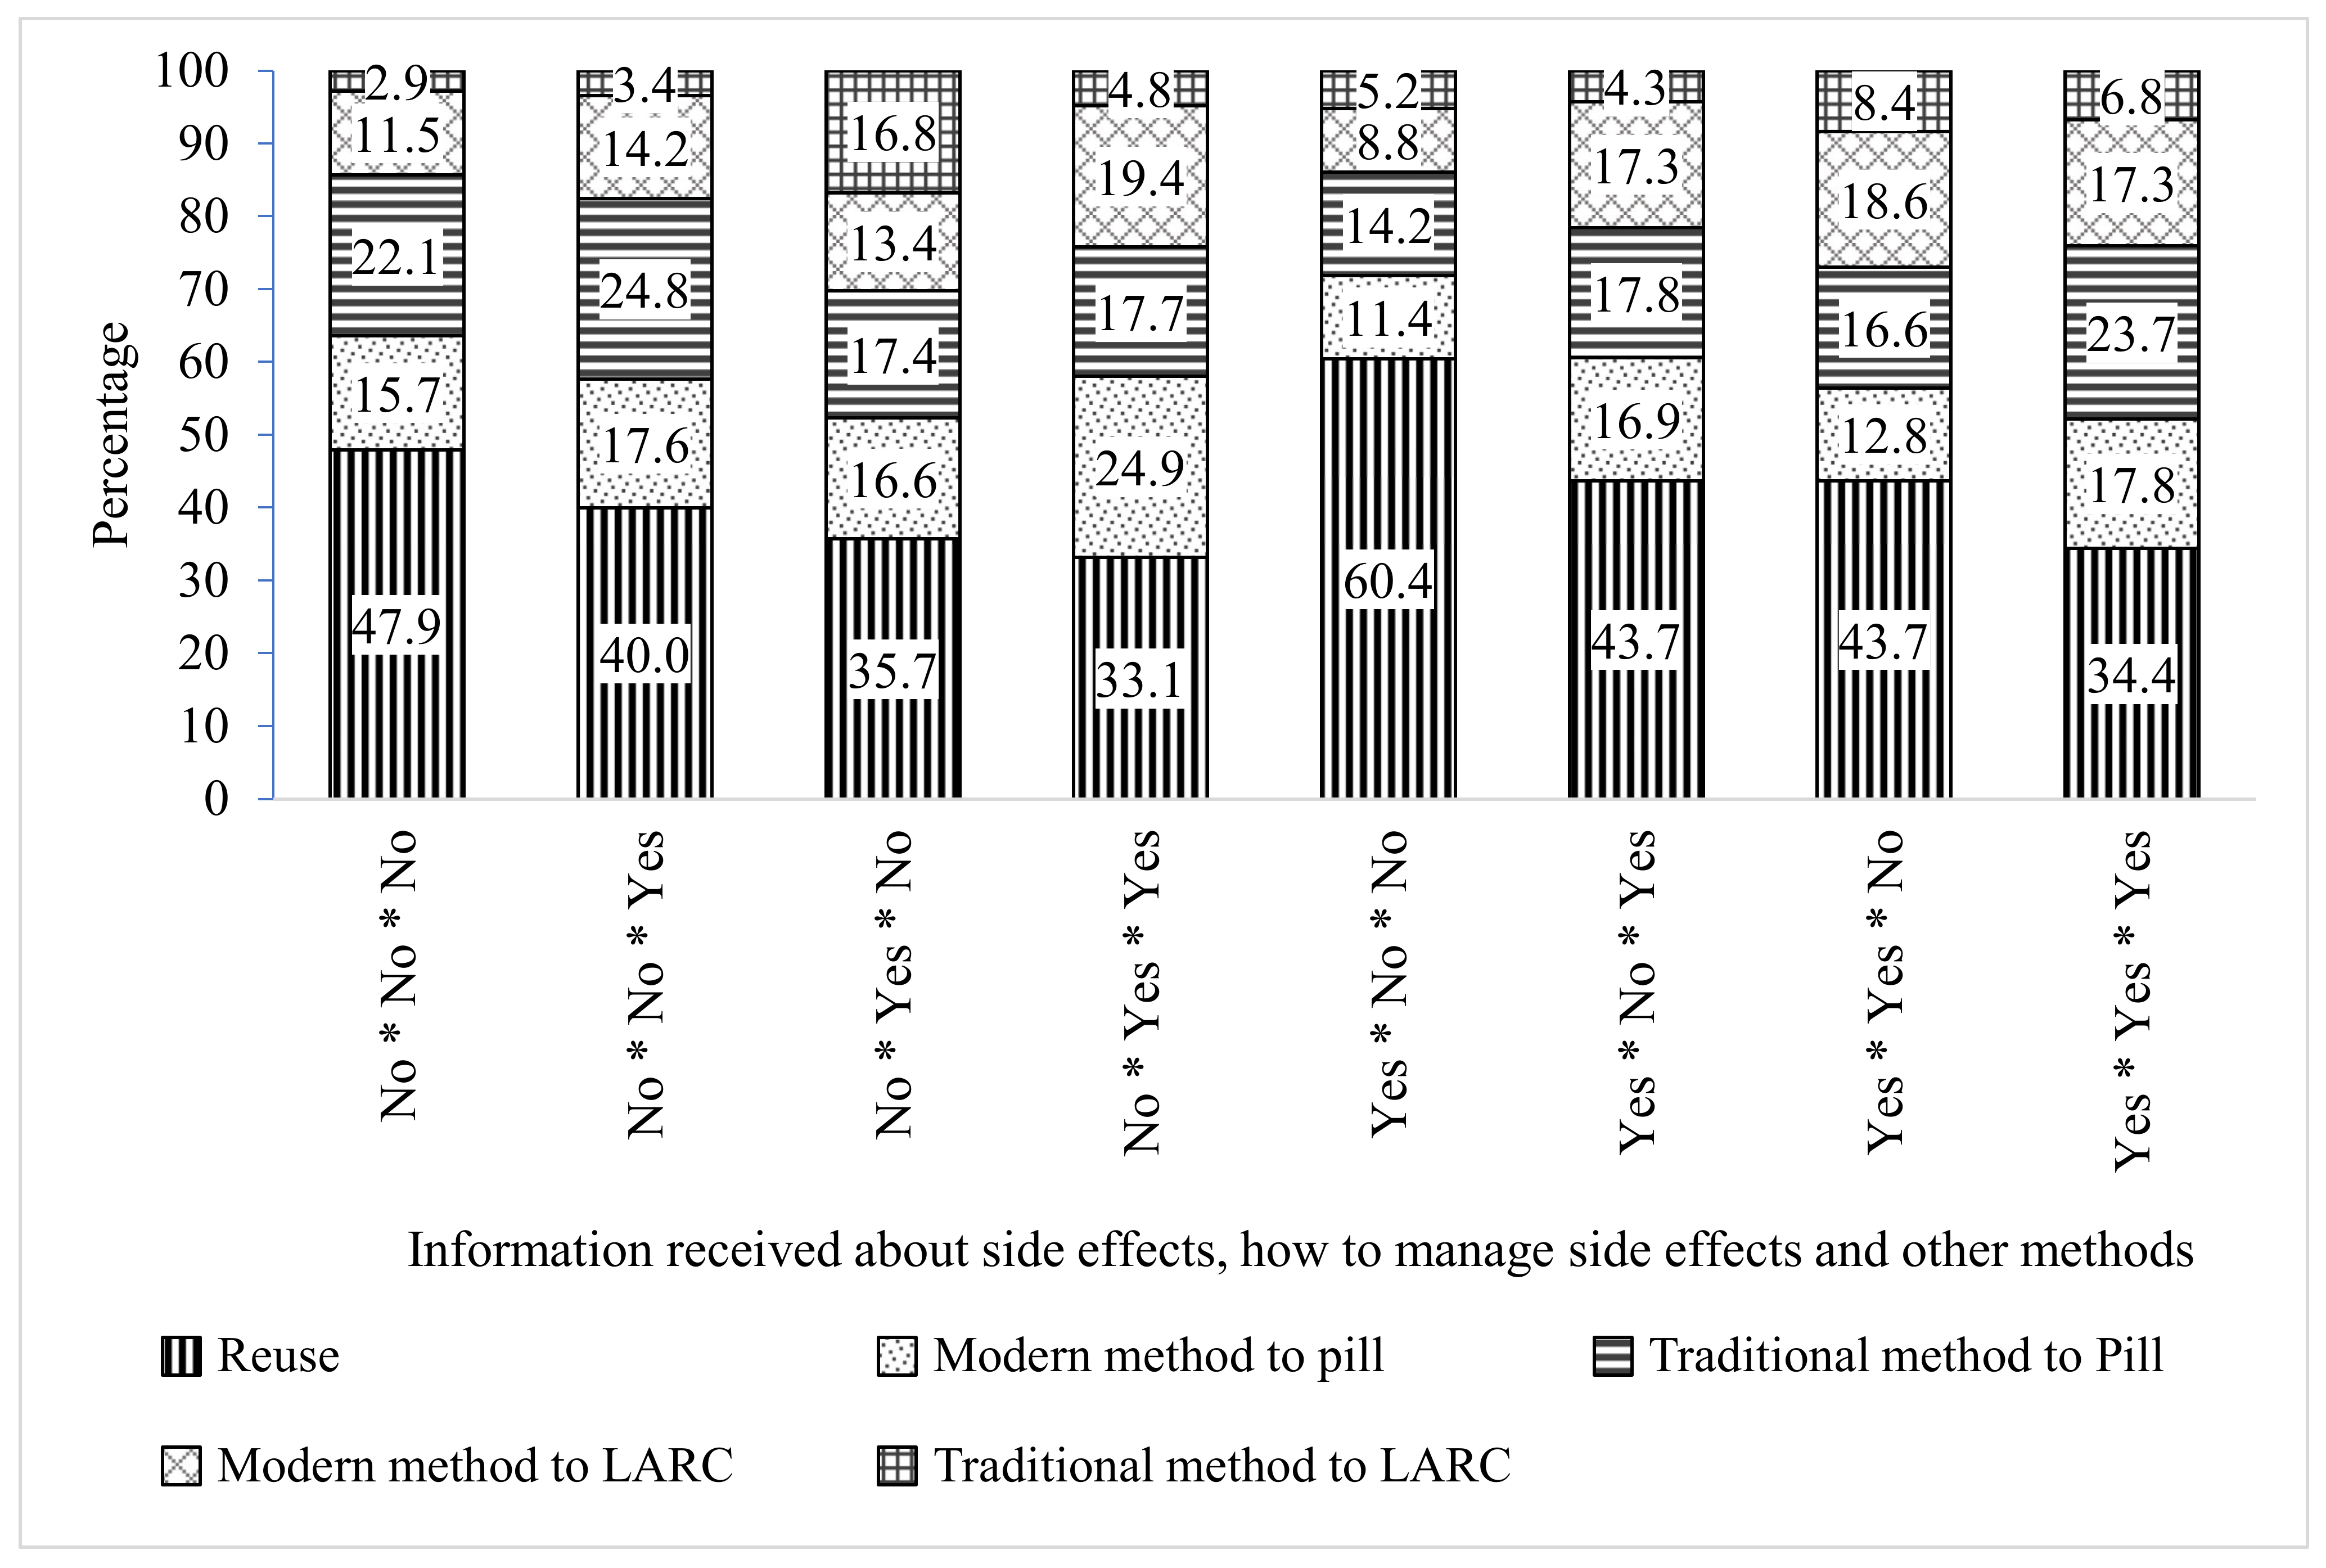
Figure 2 shows the percentage distribution of reuse and switching of methods by the combinations of method information. The figure indicates that the reuse of the same contraceptive methods is highest among those who were informed about only side effects (60%) and followed by not informed at all (48%), which is lowest among those who were informed about how to manage side effects as well as other methods (33%) and the infromaton regarding all three methods (34%). The percentage of users who switch from other modern methods to LARC is almost twice among those who were informed about all the three method information (17%), side effects as well as how to manage the side effects (17%), side effects, and other methods (19%) and how to manage side effects and other methods (19%) as compared to that of those who were not informed at all (11%) and informed about only side effects (9%). Similarly, as compared to those who were not given any information (3%), the share of switchers from the traditional methods to LARC is considerably higher among those who were informed about how to manage side effects (17%), side effects as well as how to manage side effects (8%) and all the three method information (7%). Besides, the percentage distribution of reuse and switching of methods by the socioeconomic and demographic variables have been shown in Table A1.
Table 2 presents the adjusted relative risk ratios (RRR) from the multinomial logistic regression model showing the association between method information received by the users and switching to modern spacing methods from the previously discontinued methods. The results show that compared to the reuse of the contraceptive method, the likelihood of switching is significantly higher to pill from other modern methods (RRR: 1.41, CI: 1.14–1.75), pill from traditional methods (RRR: 1.45, CI: 1.20–1.76) and LARC from other modern methods (RRR: 1.38, CI: 1.07–1.76) among users who were informed about only other methods than those who did not receive any information. The probability of switching from traditional to LARC is almost seven times higher (RRR: 6.80, CI: 2.83–16.4) among the users who were informed about only how to manage side effects than those who were not given any method information. The women who were informed about both how to manage side effects and other methods, the odds of switching from other modern methods to pill (RRR: 2.21, CI: 1.47–3.32), other modern methods to LARC (RRR: 2.37, CI: 1.50–3.76), and traditional methods to LARC (RRR: 2.27, CI: 1.07–4.82) are considerably higher than those who did not receive any information. As compared to the same reference group, the likelihoods of switching from other modern methods to pill (RRR: 0.59, CI: 0.38–0.93), traditional methods to pill (RRR: 0.52, CI: 0.35–0.79), and other modern methods to LARC (RRR: 0.57, CI: 0.34–0.97) are substantially lower among the users who were given information about only side effects. Among the users who were given the information about side effects as well as how to manage side effects, the probability of switching to LARC is considerably higher from both other modern methods (RRR: 1.51, CI: 1.04–2.19) and traditional methods (RRR: 2.74, CI: 1.65–4.57) than for those who were not given any information. As compared to the users who did not receive any information, the odds of switching for all users viz. other modern methods to pill (RRR: 1.45, CI: 1.24–0.69), traditional methods to pill (RRR: 1.41, CI: 1.22–1.62), other modern methods to LARC (RRR: 1.58, CI: 1.32–1.88) and traditional methods to LARC (RRR: 2.45, CI: 1.84–1.27) are significantly higher among those who were given information regarding all three methods. More information on switching contraceptive method behaviors by the selected socioeconomic and demographic characteristics are given in Table 3.
4. Discussion
In the context of the rising discontinuation rate and declining contraceptive prevalence rate in India, the method information provided to the users and contraceptive use dynamics is an important aspect of investigation [1]. The reuse of contraceptive methods is higher among the users who were not informed about the management of side effects and other contraceptive methods. Users who were informed only about the side effects but not about alternative contraceptive methods are more likely to reuse the same method discontinued before. The reuse of the methods is possible because of two reasons. First, the lack of information among the users’ end at the time of initiation of methods may lead to reuse. Second, the users may develop a specific affinity towards the method because they may have already adopted coping mechanisms related to the adversities of a specific method, although this is beyond the scope of this study.
Overall, a higher level of switching from both other modern methods and traditional methods among the users who were informed about all the three methods indicates that comprehensive information received by the users helps them to switch to more suitable and comfortable methods. The findings also suggest that the users who were informed about how to manage side effects, as well as various available methods, are more likely to switch to both pill and LARC. These findings indicate that if the users are well informed regarding the side effects related to methods, they can make better choices against the alternatives either through managing the side effects or by switching to another method.
Further, for the users who were informed how to manage side effects either alone or along with the information about side effects, switching to the LARC particularly from traditional methods is considerably high. This finding indicates that the information about how to manage side effects is crucial for switching to the more effective LARC especially from less effective traditional methods. The users who were informed about only other methods have a higher chance of switching to both the pill and LARC. Although method switching is higher for those who were informed about only other contraceptive methods, the provision of information about only other methods should not be encouraged from the policy perspective because the limited information may further enhance the discontinuation of the method later. A previous study using evidence from Nepal found that comprehensive method information provided to the users help them to continue using the same methods, but the information only about alternative methods does not help in the continuation of the same method [9]. Therefore, comprehensive information regarding contraceptive methods has to be provided to the users.
As mentioned earlier, the recent decline in contraceptive prevalence rate and the increase in the contraceptive discontinuation rates in India immediately call for program intervention. In India, although information received by the users have been considerably increased in the last decade, only about 30% of them have been informed about side effects, how to manage side effects, and other methods which are quite low as compared to many developing countries [1,16,17]. From the policy perspective, the emphasis is required to provide comprehensive method information to the clients.
In the wake of the 2012 London summit, the government of India has considerably emphasized the informed choice of contraceptive methods which is documented in the ‘Vision FP 2020’ [22]. From the programme perspective, the newly launched ‘Mission Parivar Vikas’ also entails several provisional and promotional schemes focusing on 145 districts in the states of empowered action groups that still have high fertility rates [23]. In the programme guidelines, though the quality of care is an important aspect such as follow-up check-ups for spacing methods like IUDs has been incorporated, the protocols still lack focus when it comes to providing information about the side effects, how to deal with the side effects, and other possible methods. India has a huge potential to enhance the number, knowledge, and skills of Frontline Health Workers (FHWs) to help the clients with method information alongside access to contraceptives given that their interaction, especially with women, is happening at various levels during adolescence and the reproductive yeas [24].
This study has a few limitations. The study is limited to the sample who were using three spacing methods of contraception (pill, IUD, and injectables) as the questions about method information were asked only to respondents who were using these methods at the time of the interview. Thus, the results cannot be compared with those of people who were either not using any methods of contraception or using any other methods of contraception. The inclusion of these three information-related questions in the survey schedule for all the users can help researchers and policymakers make a comprehensive assessment of method information. In addition, a proper question on the sources of information received by the users will aid in a better understanding of method information among the users. The users can also receive method information from other sources except for the service providers, which has not been captured due to data limitation, although a variable of mass media exposure has been controlled in the multivariate regression model which can be a proxy for other sources of information. Sometimes, misinformation received by the users leads to a change in contraceptive use dynamics [25]. The study also does not incorporate misinformation about the contraceptive methods which may affect reuse or switching. However, in this study, the information on the method discontinuation has been taken from the last contraceptive methods of the users. It is free from the recall lapse generally encountered in the studies based on calendar data.
5. Conclusions
This is the first comprehensive study that investigates the association between method information provided to the contraceptive users and the switching of the contraceptive methods in India. The findings call for program interventions to provide comprehensive method information to the users at the time of initiation because it gives them freedom to choose and switch to more suitable methods. The reuse of the method is possible because choice or compulsion needs to be understood more comprehensively. Little information provided about contraceptive methods delimits the progression to other methods, hand in hand, restricts users to a fixed method even if the method is risky and causes dissatisfaction to the user. Thus, this may create a vicious cycle for users having little or no information regarding the three information-related indicators. Emphasis needs to be given to providing information about how to deal with the side effects to the users who want to space their childbearing for a longer time. As a consequence, they can use LARC such as IUD and injectables. In turn, the informed choice of contraceptive methods to the clients would help to protect reproductive health and rights and thereby to achieve the sustainable development goal—3.7. A large number of Accredited Social Health Activists (ASHA) and other peripheral frontline health workers serving across India have a great potential to provide the method information to the clients if their role can be improved to providing comprehensive method information.
This, the cycle of reuse and discontinuation can be turned into switching to other methods if users are informed about other methods. Comprehensive information about side effects, how to manage side effects, and other methods received by clients gives them a choice to select a more suitable and comfortable method freely and thus may enhance the possibility of switching.
Author Contributions
Conceptualization, M.J.R., and S.G.; methodology, M.J.R.; software, M.J.R.; validation, S.G., and R.M.; formal analysis, M.J.R.; investigation, M.J.R.; resources, P.N.; data curation, M.J.R., and R.M.; writing—original draft preparation, M.J.R.; writing—review and editing, S.G., R.M., A.G., N.D., P.N. and R.V.; visualization, M.J.R.; supervision, S.G.; project administration, S.G., A.G., N.D., P.N. and R.V. All authors have read and agreed to the published version of the manuscript.
Funding
Bill & Melinda Gates Foundation, India country Office, Ndew Delhi; Grant Number: OPP1142874.
Institutional Review Board Statement
Not applicable.
Informed Consent Statement
Not applicable.
Data Availability Statement
The data used in this study is drawn from the openly accessed data Demographic and Health Survey which is available from this url: https://dhsprogram.com/data/available-datasets.cfm (accessed on 10 October 2018).
Conflicts of Interest
The authors declare no conflict of interest.
Appendix A

Table A1.
Percentage distribution of users who reuse or switch to modern spacing methods by the categories of study variables in India.
Table A1.
Percentage distribution of users who reuse or switch to modern spacing methods by the categories of study variables in India.
| Variables | n | Reuse | Modern Method to Pill | Traditional Method to Pill | Modern Method to LARC | Traditional Method to LARC |
|---|---|---|---|---|---|---|
| Side effects * Manage to side effects * Other methods | ||||||
| No * No * No | 2414 | 47.9 (45.8, 49.9) | 15.7 (14.3, 17.3) | 22.1 (20.4, 23.8) | 11.5 (10.3, 12.8) | 2.9 (2.3, 3.6) |
| No * No * Yes | 1021 | 40.0 (37.1, 43.0) | 17.6 (15.4, 20.0) | 24.8 (22.3, 27.5) | 14.2 (12.2, 16.4) | 3.4 (2.5, 4.7) |
| No * Yes * No | 65 | 35.7 (23.7, 49.8) | 16.6 (8.6, 29.6) | 17.4 (9.2, 30.6) | 13.4 (6.4, 26.0) | 16.8 (8.7, 29.9) |
| No * Yes * Yes | 215 | 33.1 (26.7, 40.2) | 24.9 (19.2, 31.7) | 17.7 (12.9, 23.9) | 19.4 (14.4, 25.8) | 4.8 (2.5, 9.0) |
| Yes * No * No | 259 | 60.4 (53.7, 66.7) | 11.4 (7.8, 16.4) | 14.2 (10.1, 19.5) | 8.8 (5.7, 13.3) | 5.2 (2.9, 9.1) |
| Yes * No * Yes | 372 | 43.7 (38.6, 48.9) | 16.9 (13.4, 21.2) | 17.8 (14.1, 22.2) | 17.3 (13.7, 21.7) | 4.3 (2.6, 7.0) |
| Yes * Yes * No | 325 | 43.7 (38.1, 49.4) | 12.8 (9.4, 17.1) | 16.6 (12.7, 21.3) | 18.6 (14.5, 23.5) | 8.4 (5.7, 12.2) |
| Yes * Yes * Yes | 3854 | 34.4 (32.9, 35.9) | 17.8 (16.6, 19.0) | 23.7 (22.4, 25.1) | 17.3 (16.2, 18.6) | 6.8 (6.0, 7.6) |
| Women’s education | ||||||
| No education | 1716 | 44.5 (41.9, 47.1) | 14.4 (12.7, 16.3) | 24.8 (22.6, 27.1) | 10.5 (9.0, 12.2) | 5.8 (4.7, 7.1) |
| Primary | 1159 | 48.3 (45.7, 51.0) | 13.1 (11.3, 15.0) | 25.1 (22.8, 27.5) | 9.6 (8.1, 11.3) | 3.9 (3.0, 5.1) |
| Secondary | 4689 | 39.3 (37.9, 40.7) | 18.3 (17.2, 19.4) | 23.4 (22.2, 24.6) | 14.4 (13.4, 15.4) | 4.7 (4.1, 5.4) |
| Higher | 961 | 27.7 (25.0, 30.5) | 19.8 (17.5, 22.3) | 12.0 (10.1, 14.1) | 32.3 (29.6, 35.2) | 8.2 (6.7, 10) |
| Age groups (years) | ||||||
| 15–24 | 1756 | 42.9 (40.9, 45.0) | 17.0 (15.5, 18.7) | 28.5 (26.6, 30.4) | 8.1 (7.1, 9.3) | 3.4 (2.7, 4.3) |
| 25–29 | 2892 | 42.9 (41.1, 44.7) | 16.7 (15.4, 18.2) | 19.6 (18.1, 21.1) | 15.6 (14.3, 17.0) | 5.2 (4.5, 6.1) |
| 30–34 | 2098 | 38.8 (36.6, 41.0) | 16.7 (15.1, 18.4) | 19.7 (18.0, 21.6) | 19.0 (17.3, 20.8) | 5.8 (4.8, 6.9) |
| >34 | 1779 | 32.7 (30.4, 35.1) | 17.8 (15.9, 19.8) | 22.8 (20.8, 25.0) | 19.8 (17.8, 21.8) | 7.0 (5.8, 8.4) |
| Access to Mass media | ||||||
| No | 2518 | 48.4 (46.6, 50.3) | 13.3 (12.0, 14.6) | 27.2 (25.6, 28.9) | 7.6 (6.6, 8.6) | 3.5 (2.9, 4.3) |
| Yes | 6007 | 36.2 (35.0, 37.4) | 18.8 (17.8, 19.8) | 20.2 (19.2, 21.3) | 18.8 (17.8, 19.8) | 6.0 (5.4, 6.6) |
| Parity | ||||||
| 1 | 2166 | 31.6 (29.9, 33.4) | 20.8 (19.3, 22.4) | 28.3 (26.6, 30.1) | 14.5 (13.2, 15.8) | 4.8 (4.1, 5.7) |
| 2 | 3409 | 43.0 (41.3, 44.7) | 15.5 (14.3, 16.7) | 19.1 (17.8, 20.5) | 16.8 (15.6, 18.1) | 5.6 (4.9, 6.5) |
| 3 | 1613 | 45.5 (42.9, 48.2) | 14.2 (12.5, 16.2) | 20.8 (18.7, 23.0) | 13.4 (11.7, 15.3) | 6.0 (4.9, 7.4) |
| 4 | 1242 | 46.2 (43.1, 49.3) | 14.3 (12.2, 16.6) | 19.6 (17.3, 22.2) | 15.6 (13.5, 18.0) | 4.3 (3.2, 5.8) |
| 4+ | 95 | 35.7 (27.9, 44.3) | 28.9 (21.7, 37.3) | 31.6 (24.2, 40.1) | 3.7 (1.5, 8.8) | _ |
| Place of residence | ||||||
| Urban | 2396 | 34.9 (33.2, 36.6) | 18.3 (17.0, 19.8) | 17.0 (15.7, 18.4) | 23.6 (22.1, 25.1) | 6.2 (5.4, 7.1) |
| Rural | 6129 | 42.9 (41.6, 44.2) | 16.3 (15.3, 17.3) | 25.4 (24.3, 26.5) | 10.8 (10.0, 11.6) | 4.7 (4.2, 5.3) |
| Wealth quintiles | ||||||
| Poorest | 1302 | 51.8 (49.2, 54.4) | 13.1 (11.4, 14.9) | 28.6 (26.3, 31.0) | 3.8 (2.9, 5.0) | 2.7 (2.0, 3.7) |
| Poorer | 2033 | 46.6 (44.4, 48.8) | 14.0 (12.5, 15.6) | 29.0 (27.0, 31.0) | 7.2 (6.1, 8.4) | 3.3 (2.6, 4.2) |
| Middle | 1764 | 40.3 (37.9, 42.7) | 17.4 (15.6, 19.4) | 28.6 (26.5, 30.9) | 9.3 (8.0, 10.9) | 4.3 (3.4, 5.4) |
| Richer | 1589 | 35.2 (33.0, 37.5) | 21.7 (19.8, 23.7) | 20.0 (18.2, 21.9) | 17.7 (16, 19.6) | 5.4 (4.4, 6.6) |
| Richest | 1837 | 28.8 (26.8, 30.9) | 18.4 (16.7, 20.3) | 7.9 (6.8, 9.3) | 35.1 (33, 37.3) | 9.7 (8.4, 11.2) |
| Religion | ||||||
| Hindu | 5180 | 39.2 (37.9, 40.4) | 17.4 (16.4, 18.4) | 23.0 (21.9, 24.1) | 15.3 (14.3, 16.2) | 5.2 (4.6, 5.8) |
| Muslims | 1856 | 49.8 (47.6, 52.0) | 16.9 (15.3, 18.6) | 21.0 (19.3, 22.8) | 9.3 (8.1, 10.6) | 3.0 (2.3, 3.9) |
| Other | 1489 | 22.6 (19.8, 25.6) | 14.2 (11.9, 16.8) | 22.4 (19.7, 25.5) | 29.7 (26.7, 33.0) | 11.1 (9.1, 13.4) |
| Caste | ||||||
| General | 3390 | 40.8 (39.3, 42.4) | 17.0 (15.9, 18.2) | 22.9 (21.6, 24.2) | 14.3 (13.2, 15.4) | 5.0 (4.3, 5.7) |
| SC/ST | 2862 | 37.9 (36.0, 39.9) | 18.2 (16.7, 19.8) | 26.2 (24.5, 28.1) | 13.0 (11.7, 14.5) | 4.7 (3.9, 5.6) |
| OBC | 2273 | 41.2 (39.2, 43.2) | 15.7 (14.3, 17.3) | 18.0 (16.5, 19.6) | 18.9 (17.4, 20.6) | 6.2 (5.2, 7.2) |
| The duration between initiation of contraception and interview (year) | ||||||
| 1 | 3462 | 43.4 (41.8, 45.1) | 17.8 (16.5, 19.1) | 20.4 (19.1, 21.8) | 14.3 (13.1, 15.5) | 4.1 (3.5, 4.8) |
| 2 | 2249 | 43.1 (41.1, 45.1) | 15.4 (14.0, 16.9) | 23.2 (21.6, 25.0) | 13.4 (12.0, 14.8) | 4.9 (4.1, 5.9) |
| 3 | 1598 | 36.4 (34.1, 38.7) | 16.2 (14.5, 18.1) | 24.3 (22.3, 26.4) | 16.1 (14.5, 18.0) | 7.0 (5.9, 8.3) |
| 4 | 930 | 33.0 (30.0, 36.2) | 17.0 (14.7, 19.6) | 25.1 (22.4, 28.1) | 18.2 (15.8, 20.9) | 6.6 (5.2, 8.5) |
| 5 | 286 | 17.8 (13.5, 23.2) | 26.6 (21.4, 32.6) | 22.4 (17.6, 28.1) | 27.8 (22.5, 33.8) | 5.3 (3.1, 8.9) |
| Total | 8525 | 40.1 (39.1, 41.2) | 17.0 (16.2, 17.8) | 22.5 (21.6, 23.4) | 15.2 (14.4, 16.0) | 5.2 (4.8, 5.7) |
Note: 95% confidence interval is given in the parentheses; LARC denotes long-acting reversible contraceptives which includes IUD and injectables.
References
- International Institute for Population Sciences (IIPS) and ICF. National Family Health Survey (NFHS-4), 2015–2016; IIPS: Mumbai, India, 2017. [Google Scholar]
- Bruce, J. Fundamental Elements of the Quality of Care: A Simple Framework. Stud. Fam. Plan. 1990, 21, 61–91. [Google Scholar] [CrossRef]
- Jain, A.K. Fertility reduction and the quality of family planning services. Stud. Fam. Plan. 1989, 20, 1–16. [Google Scholar] [CrossRef]
- Ali, M.M. Quality of care and contraceptive pill discontinuation in rural Egypt. J. Biosoc. Sci. 2001, 33, 161–172. [Google Scholar] [CrossRef] [PubMed]
- Tumlinson, K.; Pence, B.W.; Curtis, S.L.; Marshall, S.W.; Speizer, I.S. Quality of Care and Contraceptive Use in Urban Kenya. Int. Perspect. Sex. Reprod. Health 2015, 41, 69–79. [Google Scholar] [CrossRef] [PubMed] [Green Version]
- Magnani, R.J.; Hotchkiss, D.R.; Florence, C.S.; Shafer, L.A. The impact of the family planning supply environment on contraceptive intentions and use in Morocco. Stud. Fam. Plan. 1999, 30, 120–132. [Google Scholar] [CrossRef] [PubMed]
- Mensch, B.; Arends-Kuenning, M.; Jain, A. The impact of the quality of family planning services on contraceptive use in Peru. Stud. Fam. Plan. 1996, 27, 59–75. [Google Scholar] [CrossRef]
- Arends-Kuenning, M.; Kessy, F.L. The impact of demand factors, quality of care and access to facilities on contraceptive use in Tanzania. J. Biosoc. Sci. 2007, 39, 1–26. [Google Scholar] [CrossRef] [PubMed]
- Gubhaju, B. Barriers to sustained use of contraception in Nepal: Quality of care, socioeconomic status, and method-related factors. Biodemography Soc. Biol. 2009, 55, 52–70. [Google Scholar] [CrossRef] [PubMed]
- RamaRao, S.; Lacuesta, M.; Costello, M.; Pangolibay, B.; Jones, H. The Link between Quality of Care and Contraceptive Use. Int. Perspect. Sex. Reprod. Health 2003, 29, 76. [Google Scholar] [CrossRef]
- Koenig, M.A.; Hossain, M.B.; Whittaker, M. The influence of quality of care upon contraceptive use in rural Bangladesh. Stud. Fam. Plan. 1997, 28, 278–289. [Google Scholar] [CrossRef]
- Hong, R.; Montana, L.; Mishra, V. Family planning services quality as a determinant of use of IUD in Egypt. BMC Health Serv. Res. 2006, 6, 79–87. [Google Scholar] [CrossRef] [PubMed] [Green Version]
- Santhya, K.G. Changing Family Planning Scenario in India: An Overview of Recent Evidence; Population Council: New Delhi, India, 2003. [Google Scholar]
- Agrahari, K.; Mohanty, S.K.; Chauhan, R.K. Socio-Economic Differentials in Contraceptive Discontinuation in India. SAGE Open 2016, 6, 2158244016646612. [Google Scholar] [CrossRef] [Green Version]
- Rai, R.K.; Unisa, S. Dynamics of contraceptive use in India: Apprehension versus future intention among non-users and traditional method users. Sex. Reprod. Healthc. 2013, 4, 65–72. [Google Scholar] [CrossRef] [PubMed]
- Jain, A.K. Information about methods received by contraceptive users in India. J. Biosoc. Sci. 2017, 49, 798–810. [Google Scholar] [CrossRef] [PubMed] [Green Version]
- International Institute for Population Studies (IIPS) & Macro International. National Family Health Survey (NFHS-3), 2005–2006; IIPS: Mumbai, India, 2007; Volume I. [Google Scholar]
- Festin, M.P.R.; Kiarie, J.; Solo, J.; Spieler, J.; Malarcher, S.; Van Look, P.F.; Temmerman, M. Moving towards the goals of FP2020 —Classifying contraceptives. Contraception 2016, 94, 289–294. [Google Scholar] [CrossRef] [PubMed] [Green Version]
- Hubacher, D.; Trussell, J. A definition of modern contraceptive methods. Contraception 2015, 92, 420–421. [Google Scholar] [CrossRef] [PubMed]
- Curtis, S.L.; Blanc, A.K. Determinants of Contraceptive Failure, Switching, and Discontinuation: An Analysis of DHS Contraceptive Histories (No. 6); Macro International: Calverton, MD, USA, 1997. [Google Scholar]
- Retherford, R.D.; Choe, M.K. Statistical Models for Causal Analysis; John Wiley & Sons: Hoboken, NJ, USA, 2011. [Google Scholar]
- Government of India. India’s Vision FP 2020; Ministry of Health and Family Welfare (MOHFW): New Delhi, India, 2014; Available online: https://advancefamilyplanning.org/sites/default/files/resources/FP2020-Vision-Document%20India.pdf (accessed on 17 August 2018).
- Government of India; Ministry of Health and Family Welfare. Mission Parivar Vikas. 2016. Available online: http://www.nhmmp.gov.in/WebContent/FW/Scheme/Scheme2017/Mission_Parivar_Vikas.pdf (accessed on 18 August 2018).
- Government of India. Update on ASHA Programme. 2017. Available online: http://nhsrcindia.org/sites/default/files/Update%20on%20ASHA%20Programme-%20January-2017.pdf (accessed on 10 October 2018).
- Staveteig, S.; Shrestha, N.; Gurung, S.; Kampa, K.T. Barriers to Family Planning Use in Eastern Nepal: Results from a Mixed Methods Study; DHS Qualitative Research Studies No. 21; ICF: Rockville, MD, USA, 2018. [Google Scholar]
Figure 1.
Percentage share of reuse and switching of contraception by modern and traditional methods in India, 2015–2016. Note: 95% confidence interval is shown in the error bar at the top of each pillar.
Figure 1.
Percentage share of reuse and switching of contraception by modern and traditional methods in India, 2015–2016. Note: 95% confidence interval is shown in the error bar at the top of each pillar.

Figure 2.
Percentage share of reuse and switching of contraception of modern and traditional methods by different combinations of method information received by the users in India, 2015–2016. Note: LARC denotes long-acting reversible contraceptives which include IUD and injectables; Three ‘no’ or ‘yes’ separated by star mark (*) in each pillar have been given. Here, the first word either ‘no’ or ‘yes’ is for side effects, the second one is for how to manage side effects and the third one stands for other methods.

Table 1.
The percentage of discontinued methods by reuse or switching to the modern spacing method in India, 2015–2016.
Table 1.
The percentage of discontinued methods by reuse or switching to the modern spacing method in India, 2015–2016.
| Discontinued Methods | Reuse | Other Modern Methods to Pill | Traditional Methods to Pill | Other Modern Methods to LARC | Traditional Methods to LARC |
|---|---|---|---|---|---|
| Pill | 83.4 (82.1, 84.6) | ─ | ─ | 33.4 (30.8, 36.0) | ─ |
| IUD | 14.6 (13.4, 15.8) | 14.0 (12.3, 15.9) | ─ | ─ | ─ |
| Injectables | 2.0 (1.6, 2.6) | 3.8 (2.9, 4.9) | ─ | ─ | ─ |
| Diaphragm | ─ | 0.08 (0.01, 0.50) | ─ | ─ | ─ |
| Condom | ─ | 81.5 (79.4, 83.4) | ─ | 64.1 (61.5, 66.7) | ─ |
| Rhythm/Periodic | ─ | ─ | 43.3 (41.1, 45.5) | ─ | 55.6 (50.9, 60.2) |
| Withdrawal | ─ | ─ | 46.7 (44.5, 49) | ─ | 40.1 (35.6, 44.7) |
| Other traditional methods | ─ | ─ | 0.2 (0.1, 0.5) | ─ | ─ |
| Lactational Amenorrhea | ─ | ─ | 9.8 (8.5, 11.2) | ─ | 4.3 (2.8, 6.7) |
| Female condom | ─ | 0.15 (0.04, 0.61) | ─ | 1.6 (1.0, 2.4) | ─ |
| Other modern methods | ─ | 0.40 (0.18, 0.91) | ─ | 0.9 (0.5, 1.7) | ─ |
| Number of observations | 3422 | 1318 | 1695 | 1478 | 612 |
Note: 95% confidence interval is given in the parentheses; LARC denotes long-acting reversible contraceptives which includes IUD and injectables.
Table 2.
Results from multinomial logistic regression model showing the association between information received by users and contraceptive switching after discontinuation.
Table 2.
Results from multinomial logistic regression model showing the association between information received by users and contraceptive switching after discontinuation.
| Combinations of Method Information | Reuse vs. Modern Method to Pill | Reuse vs. Traditional Method to Pill | Reuse vs. Modern Method to LARC | Reuse vs. Traditional Method to LARC |
|---|---|---|---|---|
| SE-No * MSE-No * OM-No (Ref.) | 1.00 | 1.00 | 1.00 | 1.00 |
| SE-No * MSE-No * OM-Yes | 1.41 (1.14, 1.75) ** | 1.45 (1.20, 1.76) *** | 1.38 (1.07, 1.76) * | 1.35 (0.88, 2.07) |
| SE-No * MSE-Yes * OM-No | 1.24 (0.54, 2.88) | 0.89 (0.39, 2.02) | 1.34 (0.53, 3.42) | 6.80 (2.83, 16.4) *** |
| SE-No * MSE-Yes * OM-Yes | 2.21 (1.47, 3.32) *** | 1.10 (0.70, 1.71) | 2.37 (1.50, 3.74)*** | 2.27 (1.07, 4.82) * |
| SE-Yes * MSE-No * OM-No | 0.59 (0.38, 0.93) * | 0.52 (0.35, 0.79) ** | 0.57 (0.34, 0.97) * | 1.35 (0.69, 2.64) |
| SE-Yes * MSE-No * OM-Yes | 1.14 (0.82, 1.59) | 0.87 (0.63, 1.21) | 1.35 (0.95, 1.93) | 1.42 (0.78, 2.58) |
| SE-Yes * MSE-Yes * OM-No | 0.89 (0.60, 1.32) | 0.83 (0.59, 1.19) | 1.51 (1.04, 2.19) * | 2.74 (1.65, 4.57) *** |
| SE-Yes * MSE-Yes * OM-Yes | 1.45 (1.24, 1.69) *** | 1.41 (1.22, 1.62) *** | 1.58 (1.32, 1.88) *** | 2.45 (1.84, 3.27) *** |
Note: The model fit statistics have been shown in Table 3; 95% confidence interval is given in the parentheses; Ref. stands for the reference category; LARC denotes long-acting reversible contraceptive methods which includes IUD and injectables; In the first column, each row has three ‘no’ or ‘yes’ separated by star mark (*). Here, the first word (either ‘no’ or ‘yes’) is for side effects (SE), the second one is for how to manage side effects (MSE) and the third one stands for other methods (OM). *** p < 0.001, ** p < 0.01, * p < 0.05.
Table 3.
Results from multinomial logistic regression model showing the association between socioeconomic and demographic and contraceptive switching after discontinuation.
Table 3.
Results from multinomial logistic regression model showing the association between socioeconomic and demographic and contraceptive switching after discontinuation.
| Variables | Reuse vs. Modern Method to Pill | Reuse vs. Traditional Method to Pill | Reuse vs. Modern Method to LARC | Reuse vs. Traditional Method to LARC |
|---|---|---|---|---|
| Women’s education | ||||
| No education (Ref.) | 1.00 | 1.00 | 1.00 | 1.00 |
| Primary | 0.78 (0.61, 0.99) * | 0.94 (0.77, 1.14) | 0.72 (0.54, 0.95) * | 0.53 (0.36, 0.77) ** |
| Secondary | 1.01 (0.82, 1.25) | 1.01 (0.85, 1.21) | 0.83 (0.65, 1.06) | 0.50 (0.36, 0.70) *** |
| Higher | 1.12 (0.84, 1.51) | 0.95 (0.71, 1.28) | 1.33 (0.98, 1.81) | 0.75 (0.49, 1.15) |
| Age groups | ||||
| 15–24 (Ref.) | 1.00 | 1.00 | 1.00 | 1.00 |
| 25–29 | 1.11 (0.93, 1.33) | 0.95 (0.81, 1.11) | 1.28 (1.03, 1.59) * | 1.11 (0.81, 1.52) |
| 30–34 | 1.24 (1.01, 1.52) * | 1.18 (0.98, 1.43) | 1.35 (1.07, 1.72) * | 1.17 (0.83, 1.65) |
| >34 | 1.59 (1.27, 2.01) *** | 1.81 (1.47, 2.23) *** | 1.44 (1.11, 1.88) ** | 1.48 (1.02, 2.14) * |
| Access to Mass media | ||||
| No (Ref.) | 1.00 | 1.00 | 1.00 | 1.00 |
| Yes | 1.40 (1.20, 1.64) *** | 1.01 (0.89, 1.15) | 1.46 (1.21, 1.76) *** | 1.30 (0.99, 1.7) |
| Parity | ||||
| 1 (Ref.) | 1.00 | 1.00 | 1.00 | 1.00 |
| 2 | 0.52 (0.44, 0.61) *** | 0.43 (0.37, 0.50) *** | 0.94 (0.78, 1.12) | 0.91 (0.70, 1.19) |
| 3 | 0.49 (0.40, 0.62) *** | 0.43 (0.35, 0.53) *** | 0.95 (0.75, 1.22) | 1.04 (0.74, 1.48) |
| 4+ | 0.52 (0.40, 0.68) *** | 0.35 (0.27, 0.45) *** | 1.76 (1.31, 2.36) *** | 0.93 (0.59, 1.47) |
| Not reported | 1.42 (0.90, 2.24) | 1.17 (0.75, 1.83) | 0.33 (0.13, 0.87) * | - |
| Place of residence | ||||
| Urban (Ref.) | 1.00 | 1.00 | 1.00 | 1.00 |
| Rural | 1.09 (0.93, 1.27) | 0.95 (0.82, 1.11) | 0.83 (0.71, 0.98) * | 1.14 [0.89, 1.45) |
| Wealth quintiles | ||||
| Poorest (Ref.) | 1.00 | 1.00 | 1.00 | 1.00 |
| Poorer | 1.12 (0.90, 1.40) | 1.07 (0.91, 1.28) | 2.12 (1.51, 2.98) *** | 1.45 (0.95, 2.22) |
| Middle | 1.52 (1.20, 1.92) ** | 1.16 (0.96, 1.41) | 2.88 (2.03, 4.10) *** | 2.21 (1.43, 3.44) *** |
| Richer | 2.01 (1.56, 2.58) *** | 0.84 (0.67, 1.05) | 5.86 (4.12, 8.34) *** | 3.32 (2.10, 5.25) *** |
| Richest | 1.80 (1.36, 2.40) *** | 0.33 (0.24, 0.43) *** | 10.37 (7.2, 15.0) *** | 5.56 (3.44, 8.98) *** |
| Religion | ||||
| Hindu (Ref.) | 1.00 | 1.00 | 1.00 | 1.00 |
| Muslims | 1.17 (0.99, 1.39) | 0.76 (0.65, 0.89) ** | 0.76 (0.62, 0.94) ** | 0.69 (0.50, 0.95) * |
| Other | 1.38 (1.06, 1.78) * | 1.79 (1.42, 2.25) *** | 3.14 (2.49, 3.96) *** | 2.92 (2.15, 3.96) *** |
| Caste | ||||
| General (Ref.) | 1.00 | 1.00 | 1.00 | 1.00 |
| SC/ST | 1.43 (1.20, 1.70) *** | 1.05 (0.90, 1.23) | 1.46 (1.21, 1.78) *** | 1.19 (0.9, 1.57) |
| OBC | 0.89 (0.76, 1.05) | 0.74 (0.64, 0.87) *** | 1.31 (1.11, 1.55) ** | 1.15 (0.9, 1.48) |
| The duration between initiation of contraception and interview (year) | ||||
| 1 (Ref.) | 1.00 | 1.00 | 1.00 | 1.00 |
| 2 | 0.87 (0.74, 1.02) | 1.10 (0.95, 1.26) | 0.93 (0.78, 1.11) | 1.18 (0.90, 1.54) |
| 3 | 1.06 (0.89, 1.27) | 1.42 (1.21, 1.67) *** | 1.24 (1.03, 1.51) * | 1.85 (1.41, 2.44) *** |
| 4 | 1.27 (1.01, 1.60) * | 1.71 (1.39, 2.10) *** | 1.35 (1.06, 1.71) * | 1.67 (1.18, 2.36) ** |
| 5 | 3.48 (2.31, 5.25) *** | 2.67 (1.75, 4.08) *** | 3.34 (2.17, 5.15) *** | 2.23 (1.14, 4.36) * |
| Constant | 0.20 (0.14, 0.29) *** | 0.80 (0.59, 1.07) | 0.03 (0.02, 0.05) *** | 0.02 (0.01, 0.04) *** |
| Number of observation | 8525 | |||
| Log-likelihood ratio | −11135.1 | |||
| LR chi2(124) | 2276.7 | |||
| P-value | <0.001 | |||
Note: 95% confidence interval is given in the parentheses; Ref stands for reference categories of the variables; LARC denotes long-acting reversible contraceptives which include IUD and injectables. *** p < 0.001, ** p < 0.01, * p < 0.05. Hyphen (-) indicates not relevant for this category.
Publisher’s Note: MDPI stays neutral with regard to jurisdictional claims in published maps and institutional affiliations. |
© 2021 by the authors. Licensee MDPI, Basel, Switzerland. This article is an open access article distributed under the terms and conditions of the Creative Commons Attribution (CC BY) license (https://creativecommons.org/licenses/by/4.0/).
Share and Cite
MDPI and ACS Style
Rana, M.J.; Goli, S.; Mishra, R.; Gautam, A.; Datta, N.; Nanda, P.; Verma, R. Contraceptive Method Information and Method Switching in India. Sustainability 2021, 13, 9831. https://0-doi-org.brum.beds.ac.uk/10.3390/su13179831
AMA Style
Rana MJ, Goli S, Mishra R, Gautam A, Datta N, Nanda P, Verma R. Contraceptive Method Information and Method Switching in India. Sustainability. 2021; 13(17):9831. https://0-doi-org.brum.beds.ac.uk/10.3390/su13179831
Chicago/Turabian StyleRana, Md. Juel, Srinivas Goli, Rakesh Mishra, Abhishek Gautam, Nitin Datta, Priya Nanda, and Ravi Verma. 2021. "Contraceptive Method Information and Method Switching in India" Sustainability 13, no. 17: 9831. https://0-doi-org.brum.beds.ac.uk/10.3390/su13179831
Note that from the first issue of 2016, this journal uses article numbers instead of page numbers. See further details here.