Article

Sustainable Smart Cities and Industrial Ecosystem: Structural and Relational Changes of the Smart City Industries in Korea

1
Department of Urban Engineering, Hanbat National University, Daejeon 34158, Korea
2
School of Built Environment, Faculty of Arts, Design & Architecture, University of New South Wales, Sydney, NSW 2052, Australia
*
Author to whom correspondence should be addressed.
Sustainability 2021, 13(17), 9917; https://0-doi-org.brum.beds.ac.uk/10.3390/su13179917
Submission received: 28 July 2021 / Revised: 26 August 2021 / Accepted: 31 August 2021 / Published: 3 September 2021

Abstract

:
This paper examines the changing industrial ecosystem of smart cities in Korea using both input–output and structural path analysis from 1960 to 2015. The industry type of the input–output tables used in the Bank of Korea was reclassified into nine categories: Agriculture and Mining, Traditional Manufacturing, IT Manufacturing, Construction, Energy, IT Services, Knowledge Services, Traditional Services and other unclassified. The paper identified the changing patterns of an industrial ecosystem of smart cities in Korea. The study found that smart industries such as smart buildings and smart vehicles are anchor industries in Korean smart cities, and they are positively correlated with three other industries: IT Manufacturing, IT Services and Knowledge Services. The results of the input–output and structural path analysis show that the conventional industrial structure of labor-intensive manufacturing and diesel and petroleum cars has been transformed to the emerging high-tech industries and services in smart cities. Smart industries such as IT Manufacturing, IT Services and Knowledge Services have led to sustainable national economic growth, with greater value-added than other industries. The underlying demand for smart industries in Korea is rapidly growing, suggesting that other industries will seek further informatization, automatization and smartification. Consequently, smart industries are emerging as anchor industries which create value chains of new industries, serving as accelerators or incubators, for the development of other industries.

1. Introduction

The technological innovation of the steam and internal combustion engines from the first and second industrial revolutions significantly influenced mass production, urbanization and economic agglomeration, and the third industrial revolution applied information and communication technologies (ICTs) to manufacturing, while also leading to the emergence of virtual space [1,2,3].
The current fourth industrial revolution with artificial intelligence (AI) and the Internet of Things (IoT) is leading the global economy and accelerating the convergence of business, industries and IT to create new business models, including a hyper-connected society [4]. In particular, smart cities are leading industrial innovation in the fourth industrial era, instigating a knowledge industries’ boom.
Korea has developed ICT-driven smart cities to reinforce the national competitiveness and enhance industry value chains and production path chains through industrial ecosystems [5]. The development of smart cities has received public attention as a global city model to foster new value creation, technological innovation and sustainable development. Smart cities perform an increasingly important role in physical infrastructure management such as transport, security and safety, power supply, sewage treatment and water supply and management in cities [6,7,8]. Smart cities provide a new industrial paradigm based on the convergence of the built environment and ICTs [9].
Recently, smart cities have significantly affected changes in the industrial ecosystem with new forms of living and working environments such as smart homes, smart offices, smart mobility and living lab facilities in convergence with disruptive technologies and knowledge-based industries [10,11,12]. Furthermore, a smart city strategy focuses on urban sustainability in response to the recent fourth industrial revolution, climate change and economic recession [13,14,15]. Countries that did not respond to the needs of the industrial revolution will meet challenges to sustainable development [16].
Recently, researchers have tried to understand the industrial ecosystem within smart cities such as smart city industry ecosystems [5] and smart city governance/service/data ecosystems [17,18,19]. These studies investigated how to measure economic efficiency rather than empirical research focusing on the mechanism of the smart city industry. Despite many studies on smart cities, there is a lack of research on the evolving industrial ecosystem within smart cities.
Thus, this study aims to examine the structural changes in the industrial ecosystem in Korea’s smart cities over 60 years. Moreover, this study performed the following procedures to confirm the sustainable smart city industry. First, we defined smart city industries based on an international literature review. Second, we quantitatively measured structural changes in smart city industries. Input–output analysis is used to quantify structural changes through technical coefficients and Leontief inverse coefficients. Finally, we analyzed the relational changes in the production path of smart industries and industrial convergence using a structural path analysis model.

2. Literature Review

2.1. Concept of Smart City

A smart city is a concept of the city of the future that applies ICTs to urban services, infrastructure and governance, providing a range of ubiquitous, affordable and smart services to enhance citizens’ quality of life [14,20,21,22]. The smart city was first introduced as a concept of ubiquitous computing, which aims to create a built environment in which computers are embedded in physical objects so that users cannot recognize the computers, known as the Internet of Things, and yet at the same time can use the objects [23]. Smart city researchers have tried to translate the ubiquitous computing environment to the city level [8]. Spin-off research on the ubiquitous city has been conducted in Korea with studies on cutting-edge technologies or successful technology implications for smart cities and communities. Most researchers agreed that smart cities should aim to improve the quality of life by using ICTs and provide integrated urban services across various fields such as local economy, health, security, education, culture and society [24,25,26,27].
Albino et al. [28] summarized the smart city into four dimensions: a city’s networked infrastructure that enables social and cultural development; an emphasis on business-led urban development and creative activities for the promotion of urban growth; social inclusion of various urban residents and social capital in urban development; and preservation of the natural environment as a strategic component for the future. Neirotti et al. [24] classified the smart city concept into hardware and software domains. Smart cities focused on hardware use sensors and wireless technology to collect, store and analyze big data. In contrast, smart cities focused on software include education, culture, innovation and administration as well as communication with citizen participation. This study defines a smart city as one in which ICTs and eco-technologies (EcoTs) such as sensors, devices, artifacts and algorithms are linked, integrated and embedded with the traditional, physical city. ICTs and EcoTs are technologies such as sensors, devices, artifacts and algorithms, and a traditional city indicates the physical city. In other words, smart cities work only when there is a convergence of physically traditional cities with IT-related manufacturing business such as sensors, devices and artifacts, as well as knowledge services such as knowledge algorithms [5].
A smart city considers not only the technological aspect but also the sustainable development aspect. The United Nation’s Sustainable Development Goals (SDGs) also point out the direction of achieving sustainability in every aspect of life [29]. Smart cities provide economic, cultural and social environments for residents to improve their quality of life. The primary aim of the sustainable smart city is to provide a mechanism for fulfilling the requirements of the present as well as the future generation inhabitants [30]. Nevertheless, it is debatable whether a simple implementation of the smart city could lead to a sustainable city for an improved quality of life [31,32]. Some researchers point out the negative aspects of smart cities as follows: territorial colonization in the digital age [33], the widening of inequality in technology (digital divide) [34], smart city plans that focus on corporate interests rather than citizens [35] and the negative impact within cities of new technologies, networks and infrastructure [36].
As such, various discussions in terms of smart cities are being conducted. Among these various discussions, this study focuses on a sustainable smart city from technical, industrial and economic perspectives.

2.2. Smart City Industries

Previous literature was reviewed to define smart industries. There are no clear definitions and classifications for smart industries, and they are diversely classified depending on the research objectives and subjective views of researchers. Early studies on smart city industries include Cho et al. [37], Kim et al. [38] and Jeong [39].
Cho et al. [37] classified smart industries into 15 industries, including personal life (5), equipment (7) and public administration and services (3), to analyze how the ripple effects of adopting smart cities impact the Korean economy. Kim et al. [38] analyzed the ripple effects of Hwaseong and Dongtan smart cities in Korea on the regional economy through regional input–output tables. Smart city industries were sorted into 13 main categories of the input–output table, classified and defined as personal life (social and other services and 3 others), industry and economy (electrical and electronic equipment and 6 others) and public administration (electricity, gas and water supply and 1 other).
Jeong [39] focused on services in Asan cities in Korea to analyze the economic ripple effect of smart city development and identified four smart industries: electrical and electronic equipment; construction; communications and broadcasting; and others. Early studies on smart city industries defined them based on cities with smart services and defined construction and communication as key smart city industries.
As the smart city concept was further developed, studies defined smart city industries focusing on a new framework. Since 2010, smart city industries in Korea have been defined by focusing on operation and management as well as supply and demand, reflecting the views of experts.
Lim et al. [40] examined Seoul and divided smart industries into smart city infrastructure and utilization sectors to set the policy direction for smart cities. Industries were classified into eight main categories such as electrical and electronic equipment, construction, real estate and business services. Based on an expert survey to examine the characteristics of smart city industries, Lim et al. selected six industries such as construction and transport as smart city industries. Kim et al. [41] used a Delphi survey of experts to analyze how IoT sensors are related to smart city industries, deriving 30 subcategories of smart city industries.
Recent studies include Jo and Lee [5]. This study defined smart city industries as construction businesses based on IT manufacturing (precision instruments, electrical and electronic equipment), IT services (communications and broadcasting) and knowledge services (six fields such as finance and insurance, real estate and lease, professional, scientific and technical services). Unlike other studies, Jo and Lee focused on interpreting the relationship between smart city industries and other industries. IT manufacturing is hardware such as electrical and electronic equipment (sensors), and knowledge services are software such as specialized algorithms. IT services are defined as the communications and broadcasting industry, provided for people with the convergence and integration of IT manufacturing with knowledge services and construction.
Overall, studies on classifying smart industries have been conducted by consulting with smart city experts, meaning smart industries were classified differently depending on the smart city concept defined at the time of the research. Based on the main categories, smart industries were classified into IT manufacturing such as computers, electronic and optical devices and electrical equipment, IT services such as communications and broadcasting services, and knowledge services such as finance and insurance, professional, scientific and technical services, education, health and welfare and culture and sports.
Based on previous studies that defined the smart city concept and classified smart industries, this study investigated the cases related to any major smart industries, denoted by smart-X, to determine how the technologies and industries applied to actual smart cities are connected. This study selected three smart industries, smart cars (e.g., autonomous vehicle) [42] and buildings (e.g., zero-energy building) [43]. These smart-X industries anticipate an exponential growth in production by 2025 [44,45,46].
The following procedures were carried out to map the technologies and services of smart-X cases with the industries. First, elements that comprise smart-X cases such as services, technologies and infrastructures were identified. Second, the elements were mapped again based on the Harmonized Classification System of ICTs developed by the Telecommunications Technology Association in Korea. Third, the mapped industries were reclassified according to the Korea Standard Industrial Classification of Statistics Korea and were finally applied to the input–output tables from the Bank of Korea [47].
By the industry analysis of smart cars, buildings and factories, it is possible to determine the detailed structure of the industries that form smart-X. Based on the subcategories of the input–output tables, smart-X industries had 20 common industries classified into IT manufacturing, IT services and knowledge services (Table 1). Based on the definitions of smart cities in the previous studies, this study defines smart city industries as IT manufacturing such as electrical and electronic equipment, precision instruments, IT services such as communication services and knowledge services such as professional, scientific and technical services.

2.3. Industrial Ecosystem Analysis

The literature on the industrial ecosystem was reviewed, focusing on studies using structural path analysis. Defourny and Thorbecke [48] used a structural path analysis model to analyze the path spread of economic activities (the industrial ecosystem structure) using Leontief inverse coefficients apart from the economic ripple effect that can be analyzed using input–output tables. This study used the Korean Social Accounting Matrix (SAM) data for 1968 and classified and analyzed three ecosystems: the effects of production activities on factor income, the effects of production activities on households with different social and economic characteristics and the effects of households with different social and economic characteristics on production activities.
Oh and Lee [49] used structural path analysis to analyze the ripple effect of the communications sector on other industries as well as the industrial ecosystem. The data used were the 1980–1985–1990 input–output tables of the Bank of Korea. A total of 405 industries in the input–output tables were reclassified into 7 industries: communications sectors such as communication devices, communication facilities and communication services and non-communications sectors such as agriculture, forestry and fisheries and manufacturing, construction and services. Up to four structural paths (ecosystems) of the industries were analyzed. The results indicated that the ripple effect of the communications sector was increasing. The ecosystem of the communications sector was not only expanding in terms of demand, but also showing a greater change due to increased output rather than structural change.
Basu and Johnson [50] used a structural path analysis model to analyze the intersectoral connectivity of Virginia, US, and created an index. The intersectoral industrial ecosystem was analyzed to test the hypothesis that “urban connectivity becomes more complex with economic development” [51]. Intersectoral connectivity was analyzed with a focus on the number of paths, the number of arcs that form the paths and path multipliers. The results revealed that the growing influence of an industry does not necessarily lead to an increase in its paths and arcs.
Lee and Leem [11] examined the effects of ICTs on other industries. The results of the structural path analysis model showed that knowledge-based cities are most related to ICTs and are creating new production paths and value chains. Using the 2000 and 2010 input–output tables as the research data, 28 main categories were reclassified into 5 industries, and up to 4 structural paths to estimate the ecosystem were presented. The results revealed that the demand for the ICT industry continued to grow and that the industry was an intermediary for other industries.
Jo and Lee [5] analyzed how the ecosystem of smart city industries in Korea was being merged. Smart city industries were defined as construction based on IT manufacturing, IT services and knowledge services. Using the 1980 and 2014 input–output tables as the research data, 403 industries in the basic sector were reclassified into 9 industries. This study analyzed the change in the ecosystem, focusing on the structural and convergent change of smart city industries. The results showed that smart city industries exhibited remarkable growth. The industry convergence was led by smart city industries, and the ecosystem was becoming stronger around these industries. However, in the industrial aspect, traditional industries such as agriculture, mining and manufacturing held a greater position than smart city industries, showing that smart cities were yet to emerge.
Industrial ecosystem studies analyzed the ecosystem by considering both the impact exchanged among industries and also micro aspects such as the industrial structure. Previous studies focused on production, technical coefficients and multipliers in the input–output analysis and on distinct and new paths in the structural path analysis. As well as the analysis of the ecosystem, our study also analyzed catchment coverage and inter-industry convergence.

3. Model and Data

3.1. Model

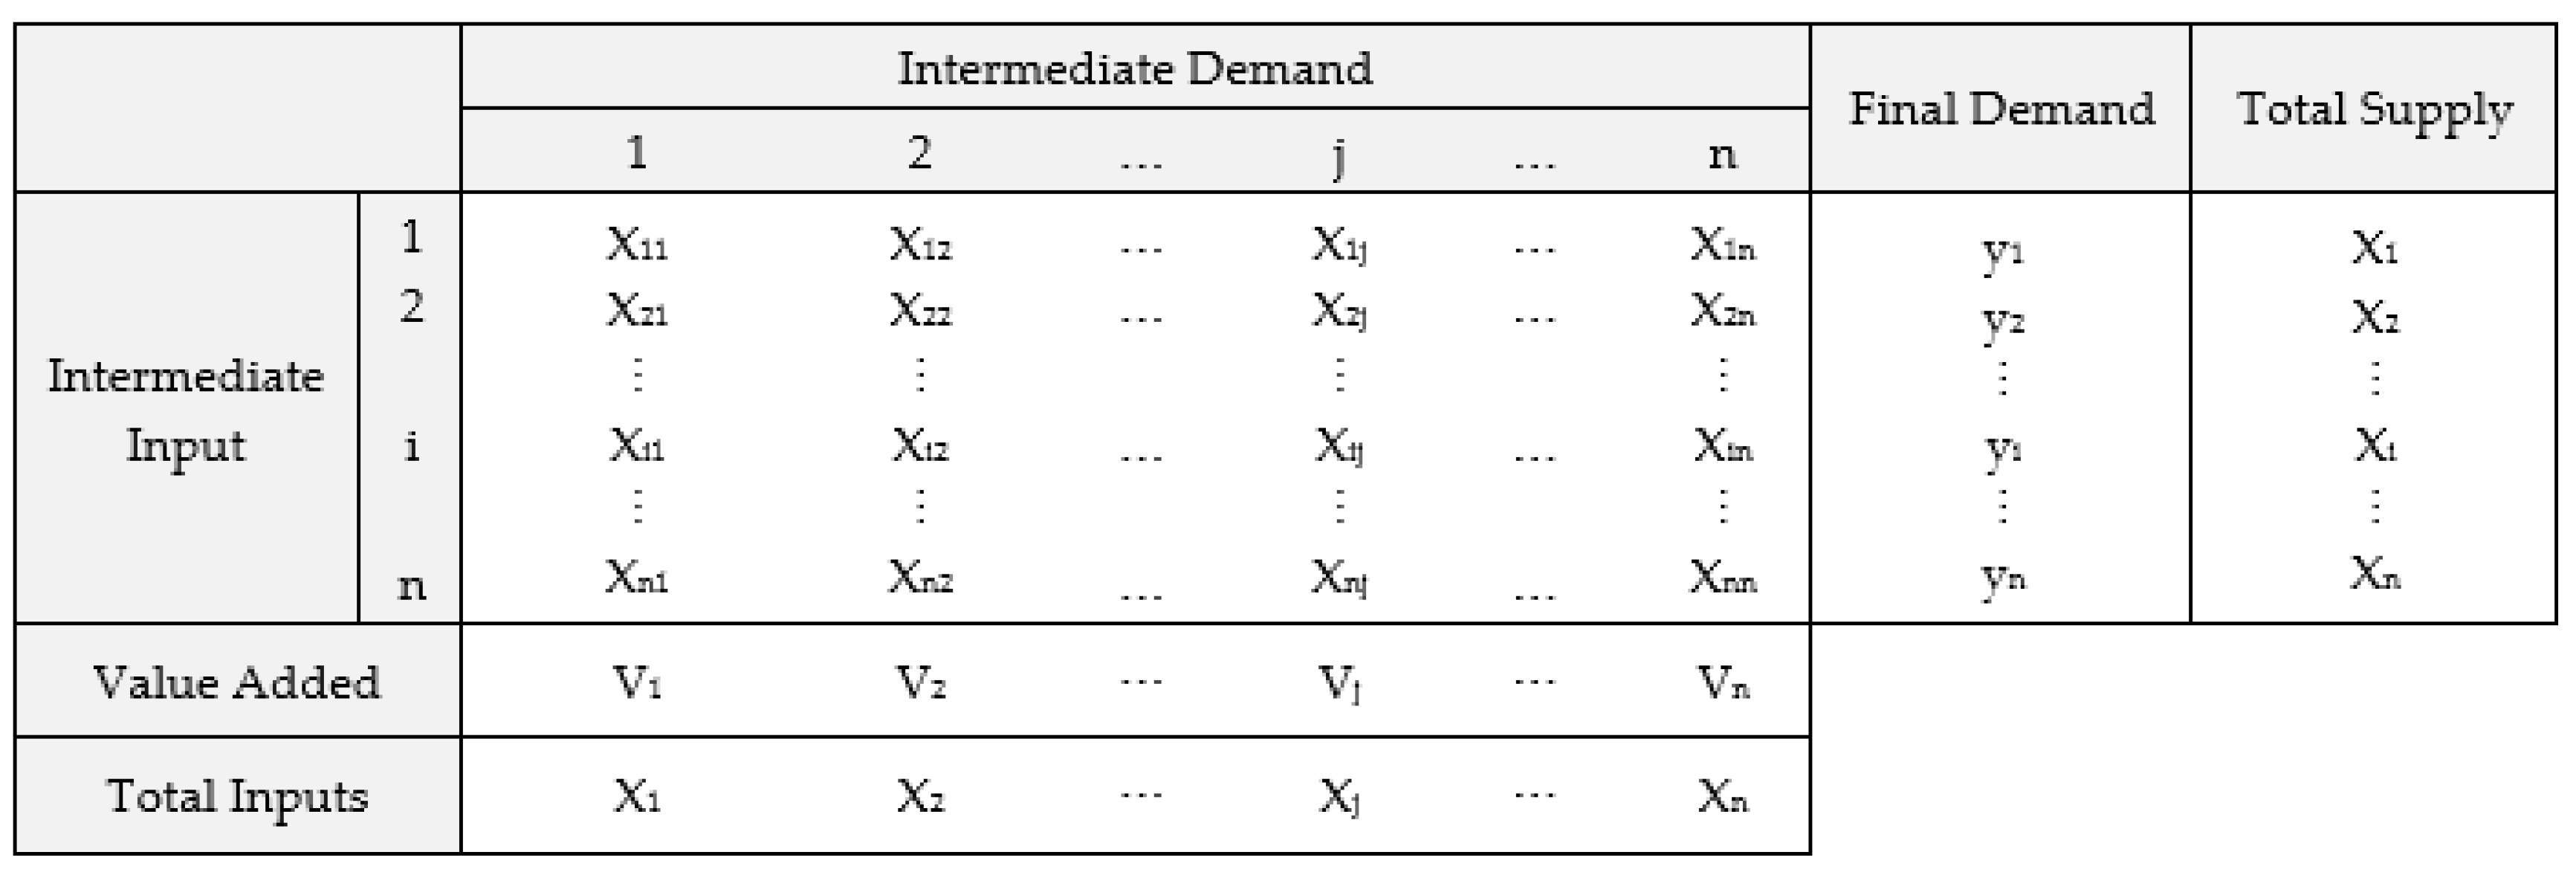
3.1.1. Input–Output Model for Structural Changes in Industrial Ecosystem

The analytical model used here is the input–output model and structural path analysis. Input–output analysis is a methodology presented by Leontief to analyze the flows of all goods and services in the economy [52]. The basic structure of input–output tables is in the form of a matrix, divided into endogenous and exogenous sectors.
Endogenous sectors represent transactions of goods and services, shown in intermediate demand and intermediate input. Exogenous sectors represent final demand and value-added. A column of an input–output matrix depicts the cost of purchasing the product from industry i to manufacture a single product in industry j. The purchase structure of industry j is divided into intermediate inputs that represent the purchase of raw materials and value-added, and the total is represented as total input.
A row of an input–output table shows the product in industry i sold to industry j. The sales structure is divided into intermediate and final demand. The total demand is the sum of intermediate and final demand, and the total output is income deducted from the total amount of demand (Figure 1).
Input–output analysis uses input coefficients calculated from the input–output tables. A technical coefficient is the intermediate input in each sector divided by total input and can be depicted as shown in Equation (1). The technical coefficient aij represents the input of industry i necessary for industry j to produce a single unit. Equation (1) is expressed as follows;
aij = xij/xj
where,
aij is technical coefficient of (i, j);
xij is intermediate input of j industry;
xj is total input of j industry.
Production inducement coefficients can be calculated through input coefficients. A Leontief inverse coefficient represents the effect on industry i when the final demand of industry j increases by a unit. The production inducement coefficient is as shown in Equations (1) and (2):
bij = [IA]−1
where,
bij is Leontief inverse coefficient of (i, j);
I is identity matrix;
A is matrix of technical coefficient (aij).

3.1.2. Structural Path Analysis for Relational Changes in the Industrial Ecosystem

While inter-industry linkage is explained by simple production inducement coefficients in input–output analysis, structural path analysis can decompose multipliers of input–output tables in detail [53]. This analytical model can backtrack the entire process in which the multiplier effect is calculated and analyze the path of inter-industry linkages. The ripple effects of structural path analysis are classified into direct and indirect effects depending on whether there is a multiplier in each path and transfer path (Table 2).
Direct effects indicate the variance of industry j that changes along the basic path when industry i has changed by a unit and can be depicted as I(i-x-y-j) = axi · ayx · ajy. Indirect effects represent the effects from being included in the direct path and going through the intermediate stage and the effects of feedback. A related equation can be depicted as I(i-x-y-j) (x-y-z-x) = (axi  · ayx  · ajy) · [1 − ayx (axy + axz  · azz)]−1. Total effects not only indicate the basic path from industry i to industry j, but also include indirect effects within the path and can be calculated by I(i-x-y-j) (x-y-z-x) = (axi  · ayx  · ajy) · [1 − ayx (axy  + axz  · azz)]−1. I(i-x-y-j) (x-y-z-x) (i-s-j) (i-v-j) = (axi  · ayx  · ajy) · [1 − ayx  (axy  + axz  · azz)]−1 + asi · ajs + avi · ajv (1 − avv)−1 represent global effects, which refer to all effects spread out to industry j when the demand of industry i has changed by a unit.

3.2. Data

This study used input–output tables, based on current market prices in the relevant year, for 1960, 1975, 1995 and 2015 from the Bank of Korea [54]. To compare the 4-year input–output tables, this study eliminated the nominal increment by inflation by applying the GDP deflator using the index with 2015 as the base year provided by the Bank of Korea (Table 3). To analyze the ecosystem of smart city industries with the 4-year input–output tables applying the GDP deflator, sub-subcategories that are the minimum unit of each industry were reclassified into nine industries: Agriculture and Mining (AM), Traditional Manufacturing (TM), IT Manufacturing (ITM), Construction (C), Energy Supply (E), IT Services (ITS), Knowledge Service (KS), Traditional Services (TS) and other unclassified (ETC).
Agriculture and Mining (AM) was reclassified around primary industries. Traditional Manufacturing (TM) was classified around secondary industries. IT Manufacturing was separated from Traditional Manufacturing based on the key indicators of previous studies and smart-x cases. IT Manufacturing had 11 sub-subcategories, such as semiconductors, electronic display devices, circuit boards, electronic components, computers and communications equipment.
Construction (C) was classified around building construction and civil engineering, and energy supply (E) included electricity, gas, water supply and renewable energy. IT Services included wired and wireless communications, information services and software. Knowledge Services were classified based on previous studies and included finance and insurance, professional, scientific and technical services, education, health and culture [55,56]. Knowledge Services is an industry that includes IT Services, but these were separated to specifically examine the ecosystem of smart city industries. The industry titled other included businesses that are not clearly classified such as residuals and office supplies, but this study did not include others in the interpretation of the ecosystem of smart city industries. Traditional Service (TS) was classified into food and accommodation, real estate, business support and other services. Other unclassified industries (ETC) included businesses that are not clearly classified such as residuals and office supplies. This study did not include ETC in interpretation related to the ecosystem of smart city industries.

4. Results

4.1. Quantitative Ecosystem of Smart City Industries

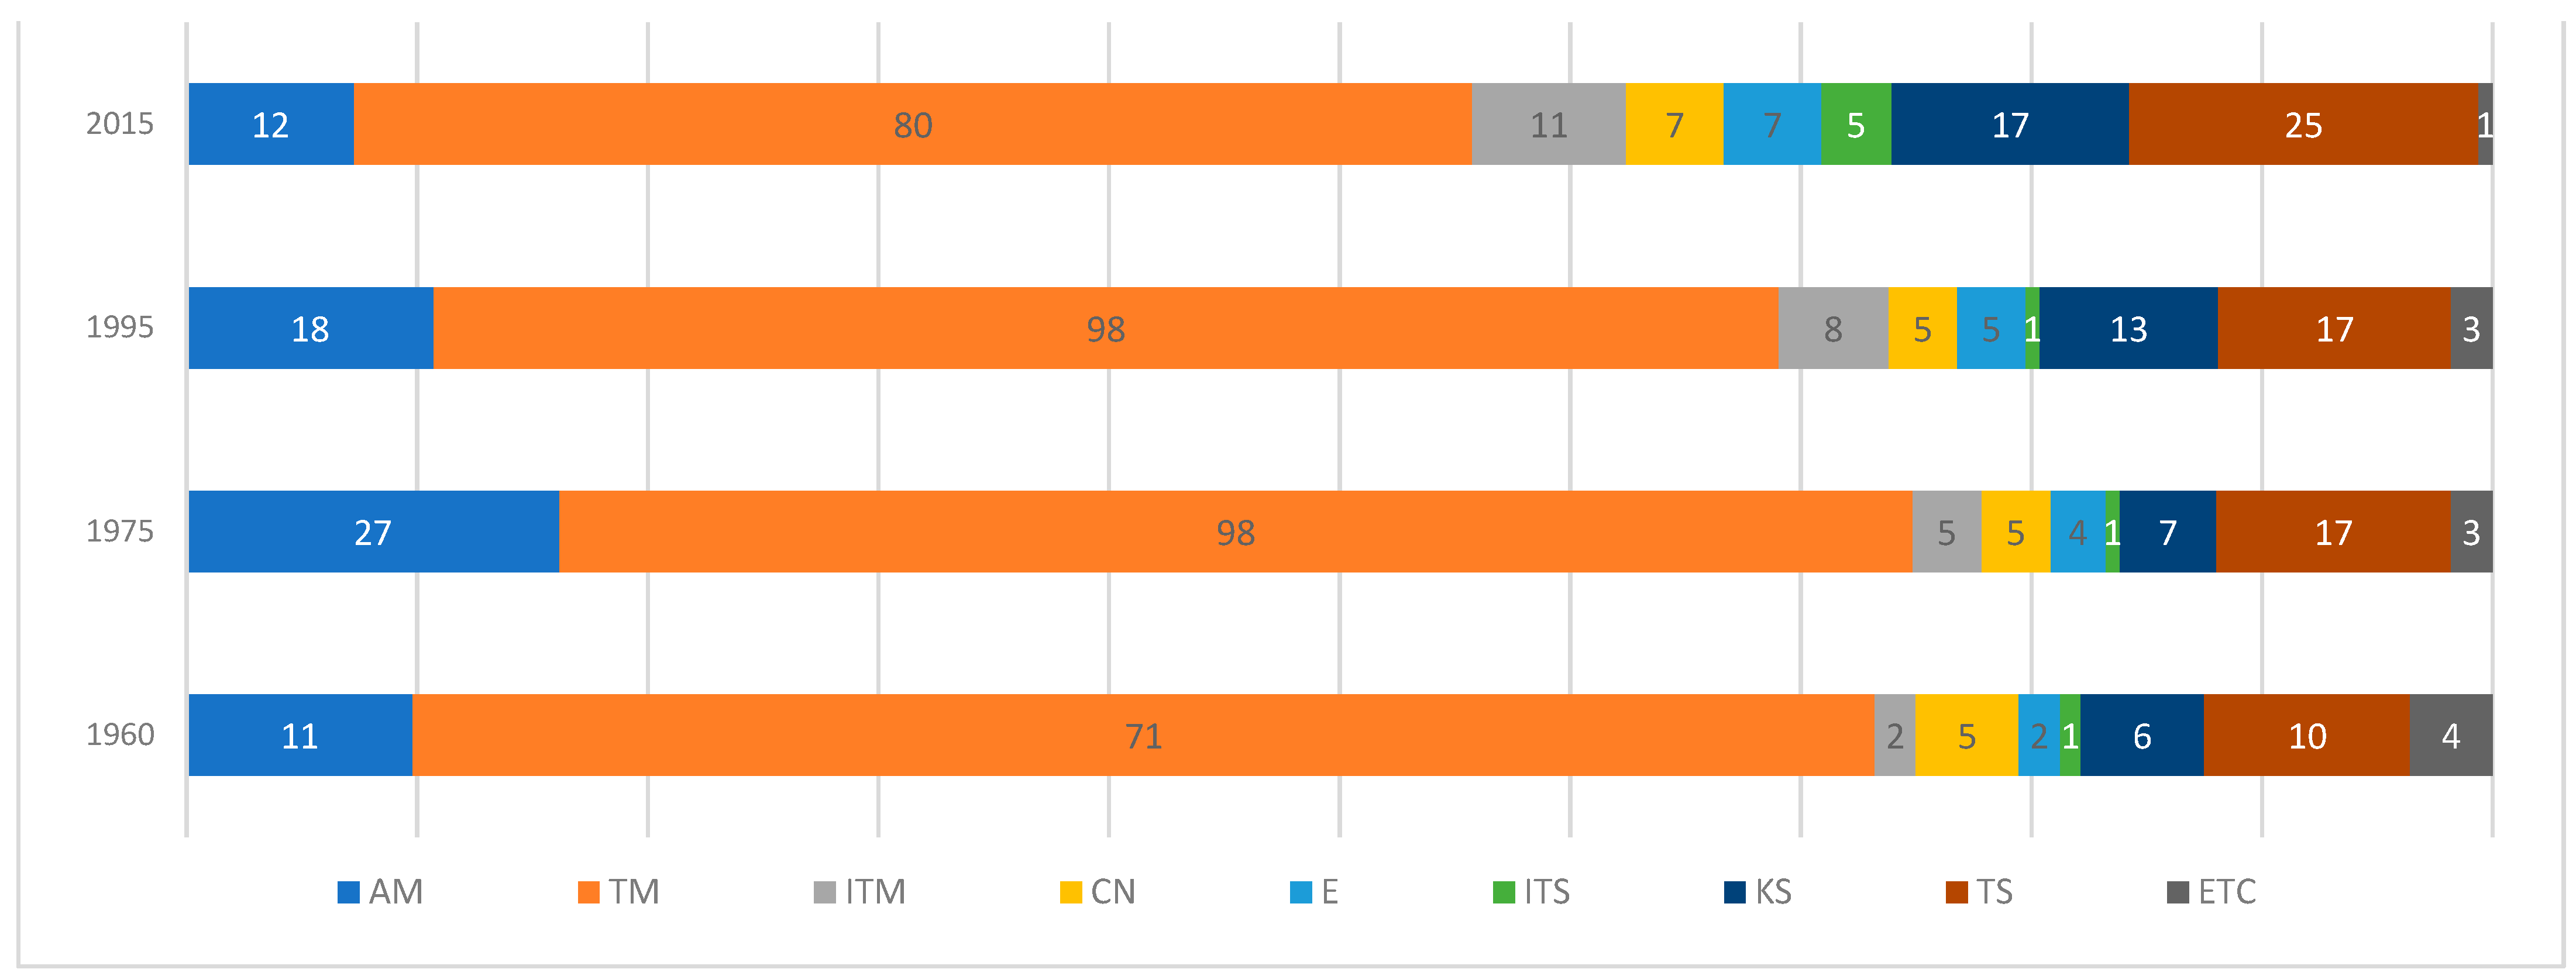
4.1.1. Changes in the Industry Spectrum of Smart City

The industry spectrum refers to the relative proportion that a particular industry occupied in the entire industry at a given time. The spectrum analysis of smart city industries reveals the growth in the number of smart city industries among the total number of industries from 1960 to 2015 (see Figure 2 and Table 4). The spectrum coverages of smart city industries are growing, increasing from 112 in 1960 to 165 in 2015, while those of traditional industries are declining. Agriculture and Mining and Traditional Manufacturing showed a simultaneous decline in both catchment coverages and shares starting from 1975.
The three smart city industries showed a constant increase from 1960 to 2015 as their shares in all industries increased by 4.9% for IT Manufacturing, 2.1% for IT Services and 4.9% for Knowledge Services, meaning the spectrum coverages of the smart city industries are becoming broader. In particular, IT Manufacturing and Knowledge Services showed a rapid increase in spectrum coverages compared to other smart city industries.
The industry spectrum analysis showed that smart city industries are being increasingly subdivided. In 2015, IT Services broadened its catchment coverages. However, Traditional Manufacturing still has many spectrum coverages, which implies that the Korean ecosystem of smart city industries is still in its initial stage.

4.1.2. Production Changes

Changes in industrial production are analyzed to examine the changes in the sum of intermediate inputs, and the results are reported in Table 5. All industrial production constantly increased from 1960 to 2015. In 1960–1975, Agriculture and Mining and Traditional Manufacturing had more production than the total average. However, Agriculture and Mining were replaced by Traditional Services in 1995. Increasing urbanization weakened agriculture and fisheries while increasing transport and real estate. The production ratios of Agriculture and Mining (−16.8%) and Construction (−1.6%) decreased from 1960 to 2015, whereas those of other industries increased. In particular, IT Manufacturing and Knowledge Services showed a remarkable increase. The average rate of increase in the amount of production was greatest for IT Manufacturing (241,311%), followed by Knowledge Services (93,082%), Traditional Manufacturing (51,829%) and IT Services (42,854%).

4.2. Qualitative Ecosystem of Smart City Industries

4.2.1. Changes in Technical Coefficient

Structural changes in the input–output coefficients were analyzed by the sum of the input–output coefficients of intermediate input in each year ( j = 1 9 a i j ). The input–output coefficient refers to the amount of goods and services that must be input by each industry when all industries produce a single-unit product. The results not only reveal that smart city industries are growing continuously but also how much value-added is produced at the same time.
Table 6 shows that Traditional Manufacturing had a remarkably higher input than other industries. Although its ratio is decreasing, it is still a key industry in Korea. The smart city industries of IT Manufacturing (146%), IT Services (114%) and Knowledge Services (171%) had more growth, showing that smart city industries are important for other industries.
Other industries are in constant need of smart city industries, and the value-added of these smart city industries is increasing. From the perspective of input (considering the ratio of all), the three smart city industries were growing; however, they still had a lower ratio than traditional industries of Agriculture and Mining, Traditional Manufacturing and Traditional Services. Energy showed a constant increase in input to other related industries such as smart energy, smart grid and smart energy monitoring.

4.2.2. Changes in Leontief Inverse Coefficient

Changes in the production inducement coefficients were analyzed by the sum of the production inducement coefficients of intermediate demand by year ( i = 1 9 b i j ) and the results are reported in Table 7. The results represent the direct and indirect effects on all industries when each industry increases by one production unit. The industries with the largest ripple effect were Traditional Manufacturing, IT Manufacturing, Construction and Energy. Manufacturing industries showed higher production inducement coefficients than service industries because they have more input of domestically produced raw materials.
IT Manufacturing including sensors, computers and networks can maximize the value-added in convergence with other industries (e.g., smart building), thereby showing high production inducement coefficients. The smart city industries of IT Services (14%) and Knowledge Services (14%) had a growing influence on all industries. The multiplier effect of 30.4% of smart city industries in 2015 was one percentage point more than 29.7% in 1960, representing approximately one-third of all industries.

4.3. Ecosystem of Smart City Industries

4.3.1. Relational changes in Industrial Path

Input–output analysis can be used to calculate the effect of the final demand change on each industry. However, input–output analysis has limitations in detailed correlation analysis. Structural path analysis can decompose and analyze the multiplier effect in detail [52]. The increase in the number of structural paths is the increase in the production inducement coefficient, which indicates that an industry’s demand is growing and its scope of influence is expanding.
This study shows that the number of paths decreased from 141 in 1960 to 117 in 2015 because the ripple effect of direct paths became greater than that of indirect paths. Inter-industry linkage showed a greater ripple effect in simplified paths than complicated paths [55]. The number of paths through which IT Manufacturing affects other industries decreased in 2015 compared to 1960. There was a decrease in direct paths, paths that go through one industry and paths that go through three industries.
This also implies that other industries in need of IT Manufacturing also decreased. IT Services showed an increase in the number of paths through which it affects other industries from 1960 to 2015. The path type with the largest increase was “via two paths” (from 13 in 1960 to 27 in 2015), which suggests that the linkage between IT Services and other industries is being reinforced.
This result shows that IT Services play an accelerator role for other industries. In particular, the paths from IT Services to other industries and Knowledge Services to other industries have increased via three paths from 1995 to 2015 (Table 8), which means that the value chain of new industries increased. Knowledge Services showed an increase of 18 paths in 2015 compared to 1960. The number increased in all path types, which proves that the increasing demand of Knowledge Services results in distribution to other industries. The extinct paths were identified most in “via two paths”. This means that the link of industrial paths in “via two paths” is weak. Therefore, the smart city industry influences other industries in a greater scale in “direct paths” and “via one path” than in “via two paths”.

4.3.2. Changes in Industrial Convergence: Multiplier Effects

Table 9 presents how smart city industries converge in the structural paths of all industries, directly showing how many industries and value chains are created through smart city industries. For instance, the convergence of IT Services and Knowledge Industry could lead to new IT manufacturing industries such as smart factories. Analyzing structural paths in all industries shows there were 83 single paths in 1960, growing to 277 single paths in 2015 involving IT Manufacturing, IT Services and Knowledge Services. Knowledge Services showed more convergence with other industries than IT Manufacturing and IT Services.
However, in 2015, IT Services showed a rapid change in convergence, demonstrating that the industry is becoming an important element in convergence with other industries. IT Manufacturing was constantly increasing. Based on the single path average, the convergence ratio was highest in Knowledge Services (56.9%), followed by IT Manufacturing (31.6%) and IT Services (11.5%), and the year-on-year increase was highest in Knowledge Services, followed by IT Services and IT Manufacturing.
Analyzing double paths showed 27 paths with IT Manufacturing and Knowledge Services, 11 with IT Services and Knowledge Services and 6 with IT Services and IT Manufacturing. This result implies that IT Manufacturing and Knowledge Services are creating more value chains than other double paths. Paths with IT Services and Knowledge Services first appeared in 2015, showing that the two industries are becoming converged into new industries. Triple paths are not yet shown, indicating that the convergence of smart city industries is still at an early stage.

5. Conclusions and Discussion

This study analyzed the innovation ecosystem of smart city industries in Korea using input–output models and structural path analysis on data from 1960, 1975, 1995 and 2015 input–output tables and applying Korea’s GDP deflator. The industries were classified into nine industries through minimum units of input–output tables by year: Agriculture and Mining, Traditional Manufacturing, IT Manufacturing, Energy, Construction, IT Services, Knowledge Services, Traditional Services and Other unclassified.
The spectrum of primary and secondary industries such as Agriculture and Mining and Traditional Manufacturing decreased over time, whereas those of smart city industries such as IT Manufacturing, IT Services and Knowledge Services are relatively increasing. This indicates that the external industrial structure is changing toward smart city industries. The smart city ecosystem analyzed with a focus on production showed an explosive quantity growth in IT Manufacturing, which showed approximately 10 times higher growth than the industry showing the lowest growth, and 2.5 times higher growth than the industry showing the second-highest growth. Typical examples of IT Manufacturing as a smart city element are semiconductors, computers, internet network and sensors. The rapid growth of IT Manufacturing as a smart element industry has great implications for the entire economic structure, indicating that the value-added is greater than other industries.
Growth rates for industries in which goods and services are input in terms of technical coefficients were relatively higher in smart city industries such as IT Manufacturing, IT Services and Knowledge Services than others. This indicates that the demand for smart city industries is rapidly increasing, which means that other industries took informatization and smartification with a focus on IT Manufacturing, IT Services and Knowledge Services industries and that smart city industries are replacing others. By the analysis of production inducement coefficients, manufacturing industries such as IT Manufacturing were found to have a greater ripple effect than service industries such as IT Services and Knowledge Services. The average increase rate of production inducement coefficients was highest in IT Services and Knowledge Services, which indicates that the potential for the ripple effect in these two industries was growing, and they create greater value-added than other industries.
The number of paths in structural path analysis indicates the complexity and connectivity of the entire ecosystem. The path analysis found the structure of the smart city industry ecosystem had complexity and connectivity and was evolving. Unlike analysis of production, technical coefficients and production inducement coefficients, the structural paths from IT Manufacturing to other industries decreased due to the stronger direct paths of IT Manufacturing, indicating that direct transactions between IT Manufacturing and other industries are increasing. IT Services and Knowledge Services showed an increase in all structural paths, indicating that they are emerging as key industries that create value chains of new industries and are serving as accelerators for the development of other industries.
Smart city industries are at the center of industry convergence and reinforce transactions among other industries. The number of paths needing the intermediary role of smart city industries is increasing. Paths including two or more of the three smart industries are also increasing in a highly significant result. In particular, paths with IT Services and IT Manufacturing or paths with IT Services and Knowledge Services, which had not existed before 1995, first appeared in 2015, consistent with industry convergence. IT Services creates value chains of new industries. Overall, the ecosystem of smart city industries showed convergence and evolution, creating value chains of new industries. IT Manufacturing, IT Services and Knowledge Services are growing as important industries. The qualitative, quantitative and convergence path analysis results presented in this study show sustained growth in the smart city industry.
This paper makes several contributions. First, we have defined smart city industries based on actual smart cities such as smart cars and smart buildings. Our study classified industries with a focus on smart-X cases and technologies directly related to the fourth industrial revolution. Second, we provide a rigorous set of evidence about the link between smart cities and the industrial ecosystem and found that smart city industries of IT Manufacturing, IT Services and Knowledge Services have transformed Korean smart cities over a period of 60 years. Smart city industries in Korea have sustained growth through the interaction of these three industries. In addition, the results of this study further suggest policy implications and industrial development direction for smart cities as a new growth engine of the country in the future.
There is no international standard for smart industries. Existing studies arbitrarily classified the smart city industries based on their industrial code. This study actively reviewed the classification of existing studies and classified the smart city industry through smart-X cases such as smart cars and smart buildings. Nevertheless, this study has limitations in the classification of the smart city industry. Furthermore, the input–output model and structural path analysis methods that include specific characteristics of the input–output table have limitations. There are restrictions in the particular analysis of the rapid changes in economic conditions because of the analysis on the macro aspects of the smart city industry.
For a future study, it is necessary to analyze the industrial ecosystem of the smart city by reclassifying the nine industries into sub-categories and to analyze its convergence impact in a consistent manner. It is necessary to examine how much smartization each industry (e.g., agriculture, manufacturing, automobile and finance, etc.) are progressing through the smart industry.

Author Contributions

Conceptualization, S.-H.L. and S.-S.J.; methodology, S.-H.L. and S.-S.J.; data curation, S.-S.J.; formal analysis, S.-S.J.; writing—original draft, S.-S.J.; writing—review and editing, H.H., S.-H.L. and Y.L.; supervision, S.-H.L.; validation, S.-H.L., H.H. and Y.L. All authors have read and agreed to the published version of the manuscript.

Funding

This work was supported by the National Research Foundation of Korea grant funded by the Korea government (Ministry of Science and ICT) (No. 2019R1F1A1062708 and 2021R1F1A1049301).

Institutional Review Board Statement

Not applicable.

Informed Consent Statement

Not applicable.

Data Availability Statement

Not applicable.

Conflicts of Interest

The authors declare no conflict of interest.

References

  1. Lucas, R.E. Lectures on Economic Growth; Harvard University Press: Cambridge, MA, USA, 2002. [Google Scholar]
  2. Mokyr, J. The second industrial revolution, 1870–1914. In Storia dell’Economia Mondiale; Citeseer: Princeton, NJ, USA, 1998; pp. 219–245. Available online: http://citeseerx.ist.psu.edu/viewdoc/download?doi=10.1.1.481.2996&rep=rep1&type=pdf (accessed on 19 August 2021).
  3. Rifkin, J. The Third Industrial Revolution: How Lateral Power is Transforming Energy, the Economy, and the World; Macmillan: New York, NY, USA, 2011. [Google Scholar]
  4. Park, S.J.; Kim, B.W. 4 th Industrial Revolution and Open Access Network for Smart City. In Proceedings of the 2018 Portland International Conference on Management of Engineering and Technology (PICMET), Honolulu, HI, USA, 19–23 August 2018; pp. 1–10. [Google Scholar]
  5. Jo, S.S.; Lee, S.H. An Analysis on the Change of Convergence in Smart City from Industrial Perspectives. J. Korean Reg. Sci. Assoc. 2018, 34, 61–74. [Google Scholar]
  6. Lee, S.H.; Yigitcanlar, T.; Han, J.H.; Leem, Y.T. Ubiquitous urban infrastructure: Infrastructure planning and development in Korea. Innovation 2008, 10, 282–292. [Google Scholar] [CrossRef] [Green Version]
  7. Yigitcanlar, T.; Han, H.; Kamruzzaman, M.; Ioppolo, G.; Sabatini-Marques, J. The making of smart cities: Are Songdo, Masdar, Amsterdam, San Francisco and Brisbane the best we could build? Land Use Policy 2019, 88, 104187. [Google Scholar] [CrossRef]
  8. Leem, Y.; Han, H.; Lee, S.H. Sejong Smart City: On the Road to Be a City of the Future. In International Conference on Computers in Urban Planning and Urban Management; Springer: Cham, Germany, 2019; pp. 17–33. [Google Scholar]
  9. Lee, S.H.; Han, J.H.; Leem, Y.T.; Yigitcanlar, T. Towards ubiquitous city: Concept, planning, and experiences in the Republic of Korea. In Knowledge-Based Urban Development: Planning and Applications in the Information Era; Igi Global: Hershey, PA, USA, 2008; pp. 148–170. [Google Scholar]
  10. Lee, S.H.; Leem, Y. Identification of Knowledge Driven Production Path through ICTs Industry as a Tool of Knowledge Sharing and Knowledge Management in Knowledge City. J. Korean Urban Manag. Assoc. 2015, 28, 409–434. [Google Scholar]
  11. Jo, S.S.; Baek, H.J.; Han, H.; Lee, S.H. An Analysis on the Expert Opinions of Future City Scenarios. J. Korean Reg. Sci. Assoc. 2019, 35, 59–76. [Google Scholar]
  12. Hawken, S.; Hoon Han, J. Innovation districts and urban heterogeneity: 3D mapping of industry mix in downtown Sydney. J. Urban Des. 2017, 22, 568–590. [Google Scholar] [CrossRef]
  13. Cretu, L.G. Smart cities design using event-driven paradigm and semantic web. Inform. Econ. 2012, 16, 57. [Google Scholar]
  14. Guan, L. Smart steps too a better city. Gov. News 2012, 32, 24–27. [Google Scholar]
  15. Jo, S.S.; Lee, S.H.; Leem, Y. Temporal Changes in Air Quality According to Land-Use Using Real Time Big Data from Smart Sensors in Korea. Sensors 2020, 20, 6374. [Google Scholar] [CrossRef]
  16. Pomeranz, K. The Great Divergence; Princeton University Press: Princeton, NJ, USA, 2021. [Google Scholar]
  17. Gupta, A.; Panagiotopoulos, P.; Bowen, F. An orchestration approach to smart city data ecosystems. Technol. Forecast. Soc. Chang. 2020, 153, 119929. [Google Scholar] [CrossRef]
  18. Rotună, C.; Gheorghiță, A.; Zamfiroiu, A.; Anagrama, D.S. Smart City Ecosystem Using Blockchain Technology. Inform. Econ. 2019, 23, 41–50. [Google Scholar] [CrossRef]
  19. Pellicano, M.; Calabrese, M.; Loia, F.; Maione, G. Value co-creation practices in smart city ecosystem. J. Serv. Sci. Manag. 2018, 12, 34–57. [Google Scholar] [CrossRef] [Green Version]
  20. Bakıcı, T.; Almirall, E.; Wareham, J. A smart city initiative: The case of Barcelona. J. Knowl. Econ. 2013, 4, 135–148. [Google Scholar] [CrossRef]
  21. Caragliu, A.; Del Bo, C.; Nijkamp, P. Smart cities in Europe. J. Urban Technol. 2011, 18, 65–82. [Google Scholar] [CrossRef]
  22. Chen, T.M. Smart grids, smart cities need better networks [Editor’s Note]. IEEE Netw. 2010, 24, 2–3. [Google Scholar] [CrossRef]
  23. Weiser, M. Some computer science issues in ubiquitous computing. Commun. ACM 1993, 36, 75–84. [Google Scholar] [CrossRef]
  24. Eger, J.M. Smart growth, smart cities, and the crisis at the pump a worldwide phenomenon. I-WAYS-J. E-Gov. Policy Regul. 2009, 32, 47–53. [Google Scholar] [CrossRef]
  25. Chia, J.; Lee, J.B.; Han, H. How Does the Location of Transfer Affect Travellers and Their Choice of Travel Mode?—A Smart Spatial Analysis Approach. Sensors 2020, 20, 4418. [Google Scholar] [CrossRef] [PubMed]
  26. Han, H.; Lee, S.H.; Leem, Y. Modelling Interaction Decisions in Smart Cities: Why Do We Interact with Smart Media Displays? Energies 2019, 12, 2840. [Google Scholar] [CrossRef] [Green Version]
  27. Han, J.H.; Hawken, S.; Williams, A. Smart CCTV and the management of urban space. In Smart Technologies: Breakthroughs in Research and Practice; IGI Global: Hershey, PA, USA, 2018; pp. 508–526. [Google Scholar]
  28. Albino, V.; Berardi, U.; Dangelico, R.M. Smart cities: Definitions, dimensions, performance, and initiatives. J. Urban Technol. 2015, 22, 3–21. [Google Scholar] [CrossRef]
  29. Pedersen, C.S. The UN sustainable development goals (SDGs) are a great gift to business! Procedia Cirp 2018, 69, 21–24. [Google Scholar] [CrossRef]
  30. Ahad, M.A.; Paiva, S.; Tripathi, G.; Feroz, N. Enabling technologies and sustainable smart cities. Sustain. Cities Soc. 2020, 61, 102301. [Google Scholar] [CrossRef]
  31. Höjer, M.; Wangel, J. Smart Sustainable Cities: Definition and Challenges. In ICT Innovations for Sustainability; Advances in Intelligent Systems and Computing; Hilty, L., Aebischer, B., Eds.; Springer: Cham, Germany, 2015; Volume 310. [Google Scholar]
  32. Hollands, R.G. Will the real smart city please stand up? Intelligent, progressive or entrepreneurial? City 2008, 12, 303–320. [Google Scholar] [CrossRef]
  33. Datta, A.; Odendaal, N. Smart cities and the banality of power. Environ. Plan. D Soc. Space 2019, 37, 387–392. [Google Scholar] [CrossRef] [Green Version]
  34. Woyke, E. Smart cities could be lousy to live in if you have a disability. MIT Technol. Rev. 9 January 2019. [Google Scholar]
  35. Greenfield, A. Against the Smart City: A Pamphlet. This is Part I of “The City is Here to Use”; Do Projects: New York, NY, USA, 2013. [Google Scholar]
  36. Sennett, R. No one likes a city that’s too smart. Guardian, 4 December 2012. [Google Scholar]
  37. Jeong, S.Y. Economic Impact Analysis on the u-City Development. Master’s Thesis, University of Seoul, Seoul, Korea, 2008. [Google Scholar]
  38. Cho, B.S.; Jeong, W.S.; Kim, P.R. An Analysis on the Economic Effects for launching the ubiquitous City. In Proceedings of the Korea Technology Innovation Society Conference, Portland, OR, USA, 5–9 August 2006; pp. 273–286. [Google Scholar]
  39. Kim, P.R.; Cho, B.S.; Jeong, W.S. The propagation effects on the regional economy induced by u-City construction in Wha-sung and Dong-tan city. J. Korean Inst. Commun. Inf. Sci. 2006, 31, 1087–1098. [Google Scholar]
  40. Lim, S.Y.; Lim, Y.M.; Hwang, B.J.; Lee, J.Y. A study on the characteristics of the U-CITY industry using the IO tables. Spat. Inf. Res. 2013, 21, 37–44. [Google Scholar]
  41. Sun, J.; Zhang, Y.; He, K. Providing context-awareness in the smart car environment. In Proceedings of the 2010 10th IEEE International Conference on Computer and Information Technology, Bradford, UK, 29 June–1 July 2010; pp. 13–19. [Google Scholar]
  42. Kim, K.; Jung, J.K.; Choi, J.Y. Impact of the smart city industry on the Korean national economy: Input-output analysis. Sustainability 2016, 8, 649. [Google Scholar] [CrossRef] [Green Version]
  43. Thomas, W.D.; Duffy, J.J. Energy performance of net-zero and near net-zero energy homes in New England. Energy Build. 2013, 67, 551–558. [Google Scholar] [CrossRef]
  44. Markets and Markets. Market Research Report. 2019. Available online: https://www.marketsandmarkets.com/PressReleases/smart-building.asp (accessed on 19 August 2021).
  45. Markets and Markets. Market Research Report. 2019. Available online: https://www.marketsandmarkets.com/Market-Reports/smart-factory-market-1227.html?gclid=CjwKCAjwY8BRBiEiwA5MCBJupK5L5DQ-7j0mCUsqztan-WT3a4KOL6-vFLDuLoEN8qU17HuG9hoCjI kQAvD_BwE (accessed on 19 August 2021).
  46. Markets and Markets. Market Research Report. 2020. Avaliable online: https://www.marketsandmarkets.com/Market-Reports/connected-car-market-102580117.html?clid=CjwKCAjwY8BRBiEiwA5MCBJjpuNcMnddDSRB2lsq6I2EInPWcrc1XEj2JpSU226ph-WWarPNTu BoCiFIQAvDBwE (accessed on 19 August 2021).
  47. The Bank of Korea. Input-Output Statistics. In The Executive Summary of the 2015 Input-Output Tables; The Bank of Korea Press: Seoul, Korea, 2019; Available online: https://www.bok.or.kr/portal/bbs/P0000559/view.do?nttId=10050567&menuNo=200690 (accessed on 19 August 2021).
  48. Defourny, J.; Thorbecke, E. Structural path analysis and multiplier decomposition within a social accounting matrix framework. Econ. J. 1984, 94, 111–136. [Google Scholar] [CrossRef]
  49. Oh, B.H.; Lee, S.H. The Estimation of Telecommunication Demand and Analysis of the Structure Changes. J. Korea Plan. Assoc. 1995, 30, 123–140. [Google Scholar]
  50. Basu, R.; Johnson, T.G. The development of a measure of intersectoral connectedness by using structural path analysis. Environ. Plan. A 1996, 28, 709–730. [Google Scholar] [CrossRef]
  51. Hirschman, A.O. The Strategy of Economic Development; Yale University Press: New Haven, CT, USA, 1958. [Google Scholar]
  52. Leontief, W. Input-Output Economics; Oxford University Press: New York, NY, USA, 1986. [Google Scholar]
  53. Lewis, B.D.; Thorbecke, E. District-level economic linkages in Kenya: Evidence based on a small regional social accounting matrix. World Dev. 1992, 20, 881–897. [Google Scholar] [CrossRef]
  54. The Bank of Korea. 1960, 1975, 1995 and 2015 Input-Output Tables, The Bank of Korea: Seoul, South Korea. Available online: https://ecos.bok.or.kr/ (accessed on 19 August 2021).
  55. Organisation for Economic Co-Operation and Development. The Knowledge-Based Economy: A Set of Facts and Figures; Organisation for Economic Co-Operation and Development: Paris, France, 1999. [Google Scholar]
  56. Ronnie, J.; Neto, J.V.; Quelhas, O.L.G.; de Matos Ferreira, J.J. Knowledge Intensive Business Services (KIBS): Bibliometric analysis and their different behaviors in the scientific literature: Topic 16–Innovation and services. RAI Rev. De Adm. E Inovação 2017, 14, 216–225. [Google Scholar]
Figure 1. Structure of the input–output table. Source: Bank of Korea (2014), Revision.
Sustainability 13 09917 g001
Figure 2. Result of industrial spectrum changes (unit: the number of industries).
Sustainability 13 09917 g002
Table 1. Components of the smart-X industry.
Industries of Input–Output TableSmart
Car
Smart
Building
Classification
Semiconductor ManufacturingIT Manufacturing
Electronic Display Manufacturing
Printed Circuit Board Manufacturing
Other Electronic Components Manufacturing
Computers and Peripherals Manufacturing
Communications and Broadcasting Equipment Manufacturing
Medical and Measuring Devices Manufacturing
Generator and Motor Manufacturing
Electrical Conversion and Supply Control Unit Manufacturing
Battery Manufacturing
Wire and Cable Manufacturing
Other Precision Instruments Manufacturing
Wired, Wireless and Satellite Communications ServicesIT Services
Other Telecommunications Services
Information Service
Software Development Supply Services
Other IT Services
Research & DevelopmentKnowledge Services
Building and Civil Engineering Services
Scientific and Technical Services
Other Professional Service
Table 2. Calculation in structural path analysis.
EffectsPath TypeCalculation
Direct Effect Sustainability 13 09917 i001I(i-x-y-j)= axi · ayx · ajy
Indirect Effect(red) Sustainability 13 09917 i002I(x-y-z-x)= [1 − ayx (axy + azy · axz)]−1
Total Effect Sustainability 13 09917 i003I(i-x-y-j) (x-y-z-x)= (axi · ayx · ajy) · [1 − ayx (axy + axz · azz)]−1
Global Effect Sustainability 13 09917 i004I(i-x-y-j) (x-y-z-x) (i-s-j) (i-v-j)= (axi · ayx · ajy) · [1 − ayx (axy + axz · azz)]1 + asi · ajs + avi · ajv (1 − avv)1
Source: Defourny and Thorbecke (1984), Revision.
Table 3. Classification of smart city industries.
1960 Year
Industries No
1975 Year
Industries No
1995 Year
Industries No
2015 Year
Industries No
9 Industries
1–71–161–111–8Agriculture and Mining (AM)
8–1117–2712–189–12
12–4328–6919–5613–35Traditional Manufacturing
(TM)
44–5570–9357–7536–51
56–6894–11076–9352–67
69–74111–11694–10183–93
78–81124–127115–12194–100
76, 82–83117, 120, 128–130107, 110–111, 113–114, 122–12474, 76, 81–82, 101–103
75, 77118–119, 121–123102–106, 108–109, 11268–73, 75, 77–80IT Manufacturing (ITM)
90, 93136–138, 157125–128, 161104–110Energy Supply (E)
85–89131–135129–133111–117Construction (C)
94149145131–132, 134–136IT Services (ITS)
--146137–138Knowledge
Services
(KS)
91150–151147–149139–142
--153–154146–150
99155156157
100156159–160158–159
104160162160–161
--134118Traditional Services
(TS)
98139–141135–136129–130
95–97142–148137–144119–128
92152–153150143–145
102–103159152151–154
101154155155–156
105158, 161163–165162–164
106–109162–164166–168165other unclassified (ETC)
Source: The Bank of Korea (1960, 1975, 1995, 2015).
Table 4. Result of industrial spectrum changes (unit: the number of industries, %).
Industries1960197519952015
AM11 (9.8)27 (16.2)18 (10.7)12 (7.3)
TM71 (63.4)98 (58.7)98 (58.3)80 (48.5)
ITM2 (1.8)5 (3.0)8 (4.8)11 (6.7)
CN5 (4.5)5 (3.0)5 (3.0)7 (4.2)
E2 (1.8)4 (2.4)5 (3.0)7 (4.2)
ITS1 (0.9)1 (0.6)1 (0.6)5 (3.0)
KS6 (5.4)7 (4.2)13 (7.7)17 (10.3)
TS10 (8.9)17 (10.2)17 (10.1)25 (15.2)
ETC4 (3.6)3 (1.8)3 (1.8)1 (0.6)
Sum.112 (100)167 (100)168 (100)165 (100)
Table 5. Result of production changes (unit: million Korean won, %).
Industries1960 Year1975 Year1995 Year2015 YearAvg.
Growth Rate (%)
AM268
(24.6)
188,109
(18.4)
24,320,968
(8.2)
170,481,650
(7.8)
27,840
TM441
(40.5)
566,736
(55.3)
150,823,687
(50.7)
998,062,109
(45.4)
51,829
ITM5
(0.5)
32,936
(3.2)
21,299,216
(7.2)
179,571,645
(8.2)
241,311
CN22
(2.1)
7679
(0.7)
4,424,448
(1.5)
11,441,286
(0.5)
30,827
E30
(2.8)
23,183
(2.3%)
7,917,369
(2.7)
89,307,901
(4.1)
37,419
ITS10
(0.9)
7321
(0.7)
3,970,270
(1.3)
56,467,957
(2.6)
42,854
KS17
(1.6)
25,492
(2.5)
32,842,130
(11.0)
249,525,295
(11.4)
93,082
TS197
(18.1)
133,394
(13.0)
39,973,548
(13.4)
437,109,558
(19.9)
32,824
ETC98
(9.0)
39,782
(3.9)
11,988,052
(4.0)
4,144,011
(0.2)
23,487
Total1088
(100)
1,024,631
(100)
297,559,688
(100)
2,196,111,412
(100)
-
Avg.121113,84833,062,188244,012,379-
Table 6. Result of changes in technical coefficient (unit: %).
Industries1960 Year1975 Year1995 Year2015 YearAvg.
Growth Rate
AM0.5261
(13.3)
0.4002
(8.5)
0.3264
(7.0)
0.4477
(8.4)
−2
TM1.5184
(38.5)
2.3823
(50.7)
1.9877
(42.9)
1.7936
(33.7)
10
ITM0.0943
(2.4)
0.5040
(10.7)
0.4534
(9.8)
0.5195
(9.8)
146
CN0.0704
(1.8)
0.0419
(0.9)
0.0813
(1.8)
0.0271
(0.5)
−4
E0.1087
(2.8)
0.0899
(1.9)
0.1916
(4.1)
0.2699
(5.1)
46
ITS0.0220
(0.6)
0.0326
(0.7)
0.0776
(1.7)
0.1994
(3.7)
114
KS0.0472
(1.2)
0.1269
(2.7)
0.5681
(12.3)
0.5476
(10.3)
171
TS0.9726
(24.7)
0.8719
(18.6)
0.7687
(16.6)
1.4858
(27.9)
24
ETC0.5853
(14.8)
0.2472
(5.3)
0.1767
(3.8)
0.0315
(0.6)
−56
Total3.9452
(100.0)
4.6970
(100.0)
4.6315
(100.0)
5.3221
(100.0)
-
Table 7. Changes in Leontief inverse coefficient (unit: %).
Industries1960 Year1975 Year1995 Year2015 YearAvg.
Growth Rate
Avg. of b i j
AM1.2971
(8.0)
1.5872
(7.8)
1.8057
(9.1)
2.1990
(10.0)
191.7223
TM2.1481
(13.2)
2.7158
(13.3)
2.7067
(13.7%)
2.9295
(13.4)
112.6250
ITM2.5753
(15.8)
2.9985
(14.7)
2.5779
(13.0)
2.7922
(12.7)
42.7360
CN2.2264
(13.7)
2.6165
(12.8)
2.4182
(12.2)
2.5255
(11.5)
52.4466
E1.7965
(11.0)
2.5853
(12.7)
2.0790
(10.5)
2.4100
(11.0)
132.2177
ITS1.3172
(8.1)
1.4941
(7.3)
1.3949
(7.0)
1.8897
(8.6)
141.5240
KS1.3587
(8.4)
1.6591
(8.1)
1.7110
(8.6)
1.9938
(9.1)
141.6806
TS1.4372
(8.8)
1.6241
(8.0)
1.8246
(9.2)
1.9892
(9.1)
111.7188
ETC2.1070
(13.0)
3.1260
(15.3)
3.2772
(16.6)
3.2045
(14.6)
172.9287
Total16.2635
(100)
20.4067
(100)
19.7952
(100)
21.9334
(100)
--
Table 8. Relational changes in industrial path (unit: no).
1960
Path (NP, EP)
1975
Path (NP, EP)
1995
Path (NP, EP)
2015
Path (NP, EP)
IT Manufacturing →
Other Industry
Direct path8 (-, -)8 (0, 0)8 (0, 0)8 (0, 0)
via 1 path25 (-, -)22 (5, 8)26 (6, 2)23 (3, 6)
via 2 paths28 (-, -)22 (6, 12)29 (14, 7)28 (11, 12)
via 3 paths3 (-, -)1 (1, 3)2 (2, 1)0 (0, 2)
Total64 (-, -)53 (12, 23)65 (22, 10)59 (14, 20)
IT Services →
Other Industry
Direct path7 (-, -)7 (1, 1)7 (0, 0)7 (0, 0)
via 1 path17 (-, -)26 (10, 1)26 (8, 8)26 (5, 5)
via 2 paths13 (-, -)19 (10, 3)18 (9, 10)27 (20, 11)
via 3 paths1 (-, -)1 (0, 0)0 (0, 1)2 (2, 0)
Total38(-, -)53(21, 5)51 (17, 19)62 (27, 16)
Knowledge Services →
Other Industry
Direct path8 (-, -)8 (0, 0)8 (0, 0)8 (0, 0)
via 1 path20 (-, -)27 (9, 2)22 (4, 7)25 (9, 6)
via 2 paths10 (-, -)20 (11, 1)15 (3, 8)22 (16, 9)
via 3 paths1 (-, -)1 (0, 0)0 (0, 1)2 (2, 0)
Total39 (-, -)56 (20, 3)45 (6, 17)58 (27, 14)
Note: NP (New path), EP (Extinct path), Direct path (Industry 1 → Industry 2), via 1 path (Industry 1 → Industry 3 → Industry 2), via 2 paths (Industry 1 → Industry 3 → Industry 4 → Industry 2), via 3 paths (Industry 1 → Industry 3 → Industry 4 → Industry 5 → Industry 2).
Table 9. Changes in convergence (unit: the number of industries, %).
Path Type1960 Year1975 Year
(Ratio, Rate of Increase)
1995 Year
(Ratio, Rate of Increase)
2015 Year
(Ratio, Rate of Increase)
Avg.
(%)
Path type of Including Single IndustryITM5361
(37.7, 15.1)
64
(27.1, 4.9)
83
(30.0, 29.7)
65
(31.6)
ITS1120
(12.3, 81.8)
20
(8.5, 0.0)
38
(13.7, 90.0)
22
(11.5)
KS1981
(50.0, 326.3)
152
(64.4, 87.7)
156
(56.3, 2.6)
102
(56.9)
Total83162
(100)
236
(100)
277
(100)
189
(100)
Path type of Including Double IndustryITS, ITM02046
ITM, KS00111627
ITS, KS0001111
Total02113144
Path type of Including Triple
Industry
ITM, ITS, KS00000
Total00000
Publisher’s Note: MDPI stays neutral with regard to jurisdictional claims in published maps and institutional affiliations.

