
Cognitive Biases in Building Energy Decisions


Laboratory for Building Energy Materials and Components, Empa, Swiss Federal Laboratories for Materials Science and Technology, Überlandstrasse 129, 8600 Dübendorf, Switzerland
*
Author to whom correspondence should be addressed.
Sustainability 2021, 13(17), 9960; https://0-doi-org.brum.beds.ac.uk/10.3390/su13179960
Submission received: 30 July 2021
/
Revised: 27 August 2021
/
Accepted: 31 August 2021
/
Published: 6 September 2021
(This article belongs to the Special Issue Human-Centric Building Energy Efficiency Research for Sustainable Development)
Abstract
:Research on sustainability in the building sector currently focuses mainly on technical solutions while little attention is given to how behaviour influences the uptake of these solutions. Bounded rationality may have a significant impact on the effective implementation of more sustainable technologies that are already available. However, empirical evidence on the effects of bounded rationality in the building sector, such as cognitive biases, is still lacking. Here, we present an empirical investigation of four cognitive biases in the building environment, namely the framing, anchor, default, and decoy effect. For that, energy-related decisions situations were presented to approximately 270 participants in an online survey. Our results show that awareness of greenhouse gas emissions from buildings can be raised through framing that the willingness to pay more for an energy-efficient home can be increased by presenting it as default, and that the choices can be shifted towards more energy-efficient appliances by using a decoy. The hypothesis that anchoring increases the willingness to pay more for the installation of a solar system could not be supported. These findings decrease the lack of empirical data on cognitive biases in the context of buildings and further indicate the potential of choice architecture in the building environment. The influence of cognitive biases in energy-related decisions should be used to increase the adaptation of sustainable technologies.
1. Introduction
Buildings account for about 40% of global energy consumption and for roughly 39% of global material resource use [1]. Efforts to increase sustainability in the building sector focus primarily on technological innovations as well as policy [2]. However, whether these technologies are implemented also depends on how decisions are made in building management, construction, and consumption. Cognitive science has well documented that human decisions are not always rational and has observed systematic deviations from purely rational behaviour, so-called cognitive biases. However, the influence of cognitive biases on sustainability and energy-related decisions in the building sector has been sparsely studied so far.
In recent decades, there have been strong technological developments in building technology that have made better building envelopes, HVAC (heating, ventilation, and air conditioning) systems, and sustainable on-site energy generation much more accessible and affordable. This means that it is technically and economically feasible to design and construct buildings with very low energy consumption and low embodied energy. However, research shows that energy efficient and sustainable solutions and technologies are not always adopted [3]. Wherever an aspect of sustainability such as building envelope U-value or total energy consumption is not enforced by standards, regulations, and legislation, the shift toward sustainability is driven by human decisions in the building design and operation process. Human decisions have cognitive, emotional, and social aspects. For example, the influence of social norms on energy use in buildings [4] and of descriptive norms in engineering design [5] and their ability to drive change has already been demonstrated. However, the findings of cognitive science and behavioural economics in the second half of the last century have made it clear that decisions are indeed not always rational.
The deviation of human behaviour from purely rational behaviour is referred to as bounded rationality (e.g., [6,7,8]) and has three main sources: lack of information availability, the use of heuristics—i.e., rules of thumb—and systematic deviations from rational behaviour, so-called cognitive biases. Dozens of these biases have been documented in the scientific literature in different contexts. One example is the endowment effect, which describes the tendency to attribute a higher value to an object if it is in one’s possession than if it is not [9,10].
Several studies evaluated the effects of bounded rationality in the building sector. Martin and Perry [3] (p. 312) found “…sustainable construction technology adoption to happen serendipitously…” and Christie et al. [11] (p. 457) report that “…if the rate of adoption of energy-efficiency technologies is to increase, then appeals to rationality are unlikely to work for a large proportion of homeowners.” However, the influence and potential of cognitive biases in the building design process have been studied only sporadically. In their review on bounded rationality in engineering design, Klotz et al. [12] (p. 226) report that “…for design, biases, and choice architecture interventions remain underexplored and disconnected across fields of practice and academic disciplines.”
However, several studies point to the potential of systematically exploring cognitive biases in the building sector. In a seminal experiment, Klotz et al. [13] showed an anchor effect for building energy performance goals in a survey of 76 engineers: completing a series of questions regarding a “90% energy reduction” vs. questions with a “30% energy reduction” inspired more ambitious energy reduction goals in the 90% group. In another study, a higher consideration of sustainability was achieved when building design choices were framed in design software as a loss of sustainability—starting from a sustainable variant—rather than a gain [14]. Ebeling and Lotz [15] found an impressive default effect for electricity consumers’ decisions, where an opt-out green power option generated about ten times more actual contract purchases compared to an opt-in scenario for the same green power. Harris et al. [16] examined various cognitive biases in monitoring-based commissioning for the building energy management process used to optimise building energy performance. The data showed that almost 30 percent of the barriers faced by their cohort were caused by diverse cognitive biases. Furthermore, Shealy and co-workers [5] showed empirically that designers for a civil infrastructure system exposed to positive descriptive norms set 28 percent higher sustainable performance goals on average. A recent study by Hancock and colleagues [17] with 261 professional infrastructure designers investigated the effect on future discounting by using a present- and a future-frame. Their work shows that the use of a future-frame for a sustainability request proposal promotes the construction of significantly longer targeted useful life to the community, significantly longer design life, and the willingness of participants to accept a significantly higher number of years for return on investment. In a large survey, Blasch and Daminato [18] found an association between a measure of the strength of the status-quo bias of participants and the age of their appliances and their level of consumption of energy services (dishwasher, washing machine, etc.). In a review paper, Delgado and Shealy discuss the potential of using cognitive biases to improve energy efficiency in facilities via choice architecture, presenting several suitable cognitive biases [19].
These studies show potential for improvements in sustainability through cognitive biases. There are some limitations, however, as previous research has only considered some of the dozens of cognitive biases described in the psychological literature, and empirical evidence for cognitive biases in the field of building energy decisions is still scarce. Furthermore, some parts of the design process have not been studied at all, such as the iterative evaluation of the planned building design by building professionals prior to its construction [12]—which is actually critical to achieving sustainable design. The building design process is crucial, as it is the part of the whole construction process where most decisions with long-term implications are made. However, cognitive biases can be taken accounted for in the design process by deliberately introducing changes in the decision environment. This process is called “choice architecture” and is applied frequently already in everyday life, for example in the form of calorie information on food packages which can give a certain framing to the consumption. The ethical considerations of applying choice architecture for sustainability or more general “green nudges” were considered in detail by Schubert [20], who concluded that they can be an effective and ethical complement to traditional incentive-based measures if they are organised in a transparent way, i.e., so that people can in principle “unmask the manipulation”.
Considering the known cognitive biases, we identified four cognitive biases described in the literature that may be relevant to building sustainability:
- The framing effect describes that different formulations of a message—without changing the content—can change a viewer’s preference [21]. For example, attitudes towards a method may depend on whether it is said: “There is an 80% chance that no error will occur” compared to “There is a 20% chance that an error will occur”. Even when the information conveyed is the same, decision makers tend to behave more risk-seeking when a positive frame such as the first is used, compared to more risk-averse such as in the second frame.
- The anchor effect describes how a decision maker’s judgement can be anchored by information seen before the decision is made. For example, in one of Tversky and Kahneman’s original experiments, participants were presented with a supposedly random number, which however would only take the value of 10 or 65. When subsequently asked to estimate the number of African countries in the United Nations, median estimates were 25% and 45% for the participants who saw the numbers 10 and 65, respectively [22].
- The default effect describes the increased likelihood that an option will be chosen when it is presented as the default response, which will be chosen when the decision maker does not make any changes [23,24]. For example, Johnson and Goldstein showed that the percentage of those agreeing to organ donation can be increased by assigning participants to an opt-out condition (action to decline organ donation) compared to an opt-in condition (action to accept organ donation).
- The decoy effect describes that the preference of a decision maker can be nudged between two options by constructing a decoy that is asymmetrically dominated [25]. An option (decoy) is asymmetrically dominated if it is inferior compared to one option (target), while it is partially inferior and partially superior for the other option (opponent). The inclusion of a decoy increases the proportion of decision makers who choose the target over the opponent. In marketing, the goal is usually to maximise revenue. In the context of building sustainability, however, the decoy effect can also be interesting for the promotion of environmentally friendly products.
These four cognitive biases can be directed at three different levels of energy-related decision-making: (a) general attitude towards building sustainability (framing effect for greenhouse gas emissions from buildings), (b) design decisions at the level of planners, home owners and managers (anchor effect for solar panels and default effect for building design), and (c) consumer decisions of building users (decoy effects for electrical appliances). Based on the described findings on cognitive biases and choice architecture, the goal of the present study was to find effects of bounded rationality in the building context that could be used to increase sustainability in this area. Specifically, we looked at the following research questions, each considering one of the mentioned cognitive biases:
- 1.
- Does the framing effect increase awareness for greenhouse gas emissions from buildings through appropriate framing?
- 2.
- Does the anchor effect increase decision makers’ willingness to pay more for solar systems when a higher anchor is introduced for past prices?
- 3.
- Does the default effect increase the willingness to pay more for an energy-efficient home by offering the energy-efficient options as default?
- 4.
- Does the decoy effect increase the proportion of decision makers who choose a more energy efficient target option in the purchase of an appliance (refrigerator, vacuum cleaner) when an asymmetrically dominated decoy is introduced?
In order to decrease the knowledge gap on cognitive biases in the building sector as well as to identify specific decision contexts that could be optimised towards sustainability, we conducted a behavioural study based on different decision scenarios to answer the above research questions using online surveys. We identified three cognitive biases, namely the framing, default, and the decoy effects that can be utilised to create more sustainable decisions in and around buildings. The decision contexts that we studied here were selected in such a way that they can be transferred to real-life decision situations where they can actually increase sustainability in the building sector.
In the following, we will first describe the general methods, then the methods, results, and discussions of the four research questions individually, followed by a general discussion and the conclusions.
2. General Methods
To answer our research questions, we designed a survey using the online tool LimeSurvey [26]. To enable high performance and quickly available survey data, the survey was offered on the survey platform Prolific [27].
2.1. Ethical Considerations
We consulted with a member of the Empa ethics committee for the proper implementation of the consent form. To ensure fair collaboration with the participants and to counteract the sometimes poor worker protection of crowd-sourcing platforms, we sought the most ethical platform possible, paid workers above the minimum wage, anonymized all data, and had participants read and accept the consent form. The online provider Prolific [27] guarantees worker protection, requires minimum wages, and offers general accessibility to participants as well as cross-stratified representative samples (gender, age, ethnicity) from the UK and US, and niche recruitment. Prolific has a satisfactory reputation for ensuring high quality survey participants [28,29] while protecting their participants.
2.2. Participants
Having selected Prolific for participant recruitment due to the described ethical considerations, the geographic location of the participants was limited to the UK and the US. We decided to recruit participants who were all current UK residents as Prolific has the highest reach in the UK (March 2020: 37,791 UK participants active in the 90 days prior to study start) and, as the UK is similar in terms of climate, culture, and building industry to other Middle and Northern European countries. This makes the studied decision contexts of this study relevant for a number of countries in Europe and likely to Northern America. The effects of cognitive biases are in all likelihood more general than this context and may be applied globally by accounting for cultural and industry differences. We paid participants £h for completing the study, which was above the national minimum wage in the UK at the time of the study (spring 2020). In addition, participants were profiled on Prolific as follows: at least 20 previous study participations on Prolific, acceptance rate of previously submitted surveys on Prolific ≥90%, and no participation in our previous study. To achieve gender balance, we offered participation in the survey to an equal number of women and men. In total, 300 participants completed the survey on Prolific. Four participants read the description but did not open the survey and were therefore not included for analysis. Participants were randomly assigned to two groups with different treatments, groups A and B. Three attention questions were included, which were easy to answer for anyone who actually reads the given texts. Due to insufficient performance in these questions, the answers of 25 participants had to be removed, resulting in a total number of 271 responses (136 group A, 135 group B). Unless otherwise stated, all further analyses were conducted with the remaining participants.
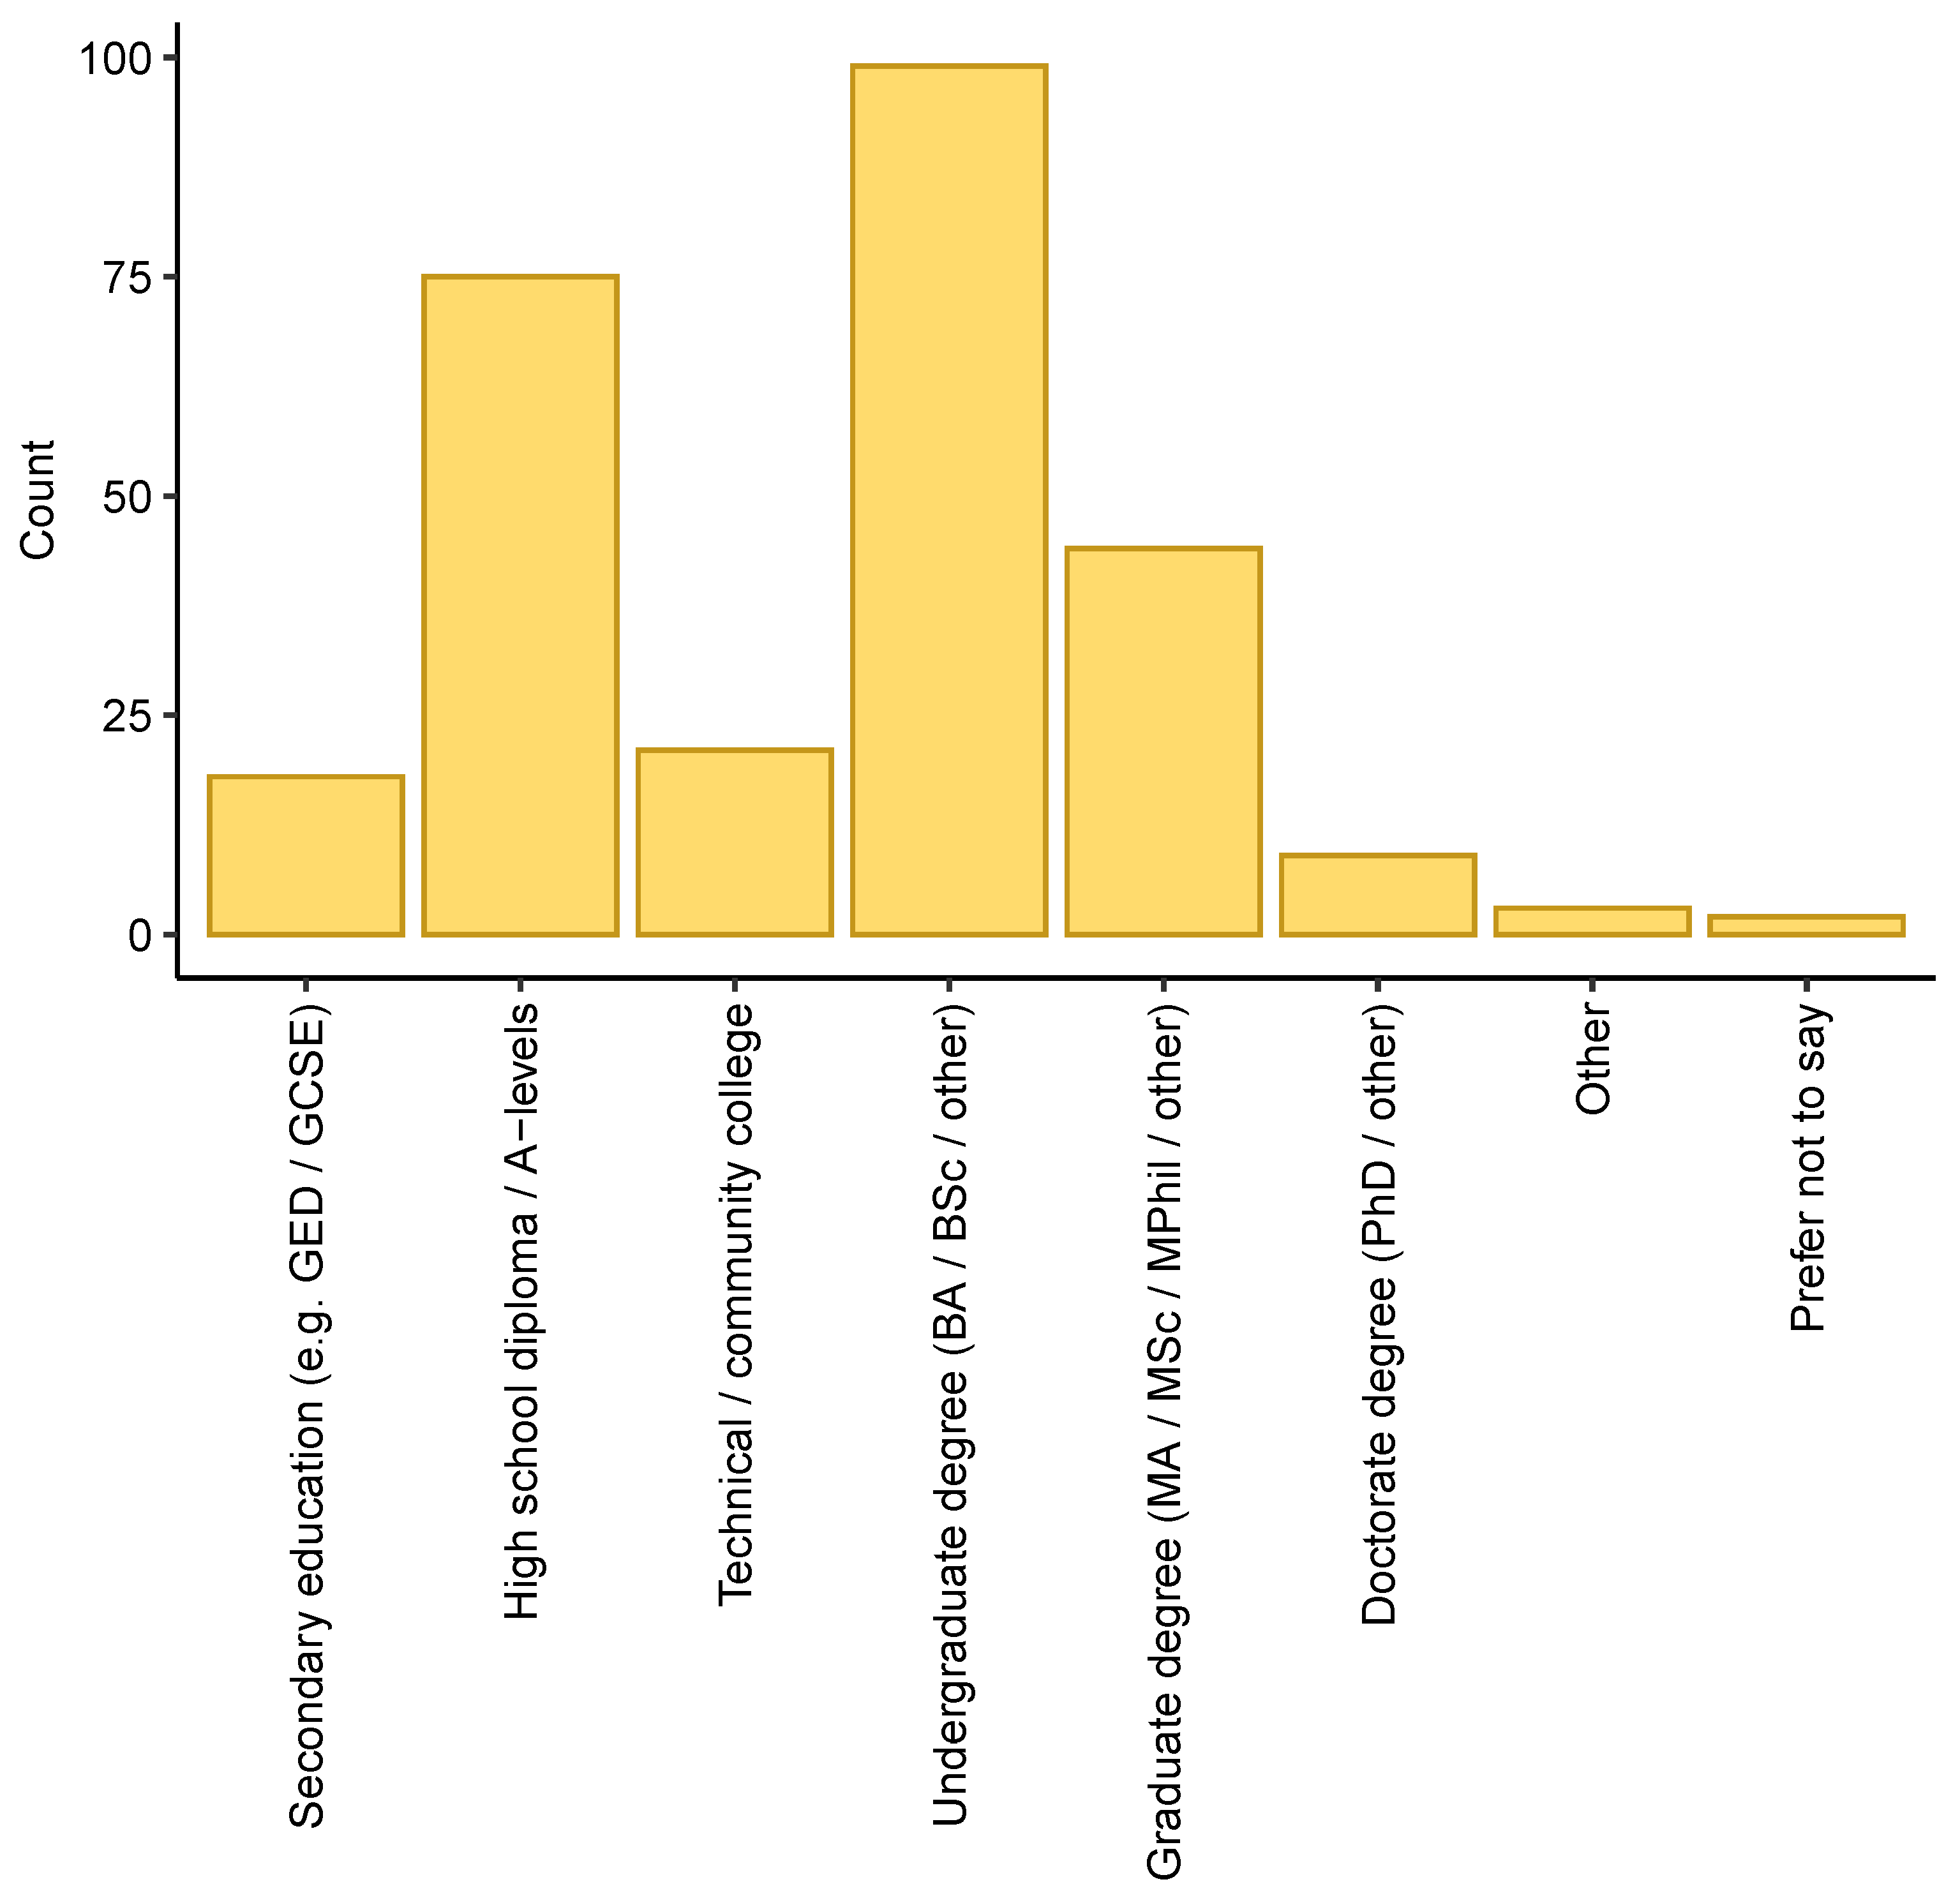
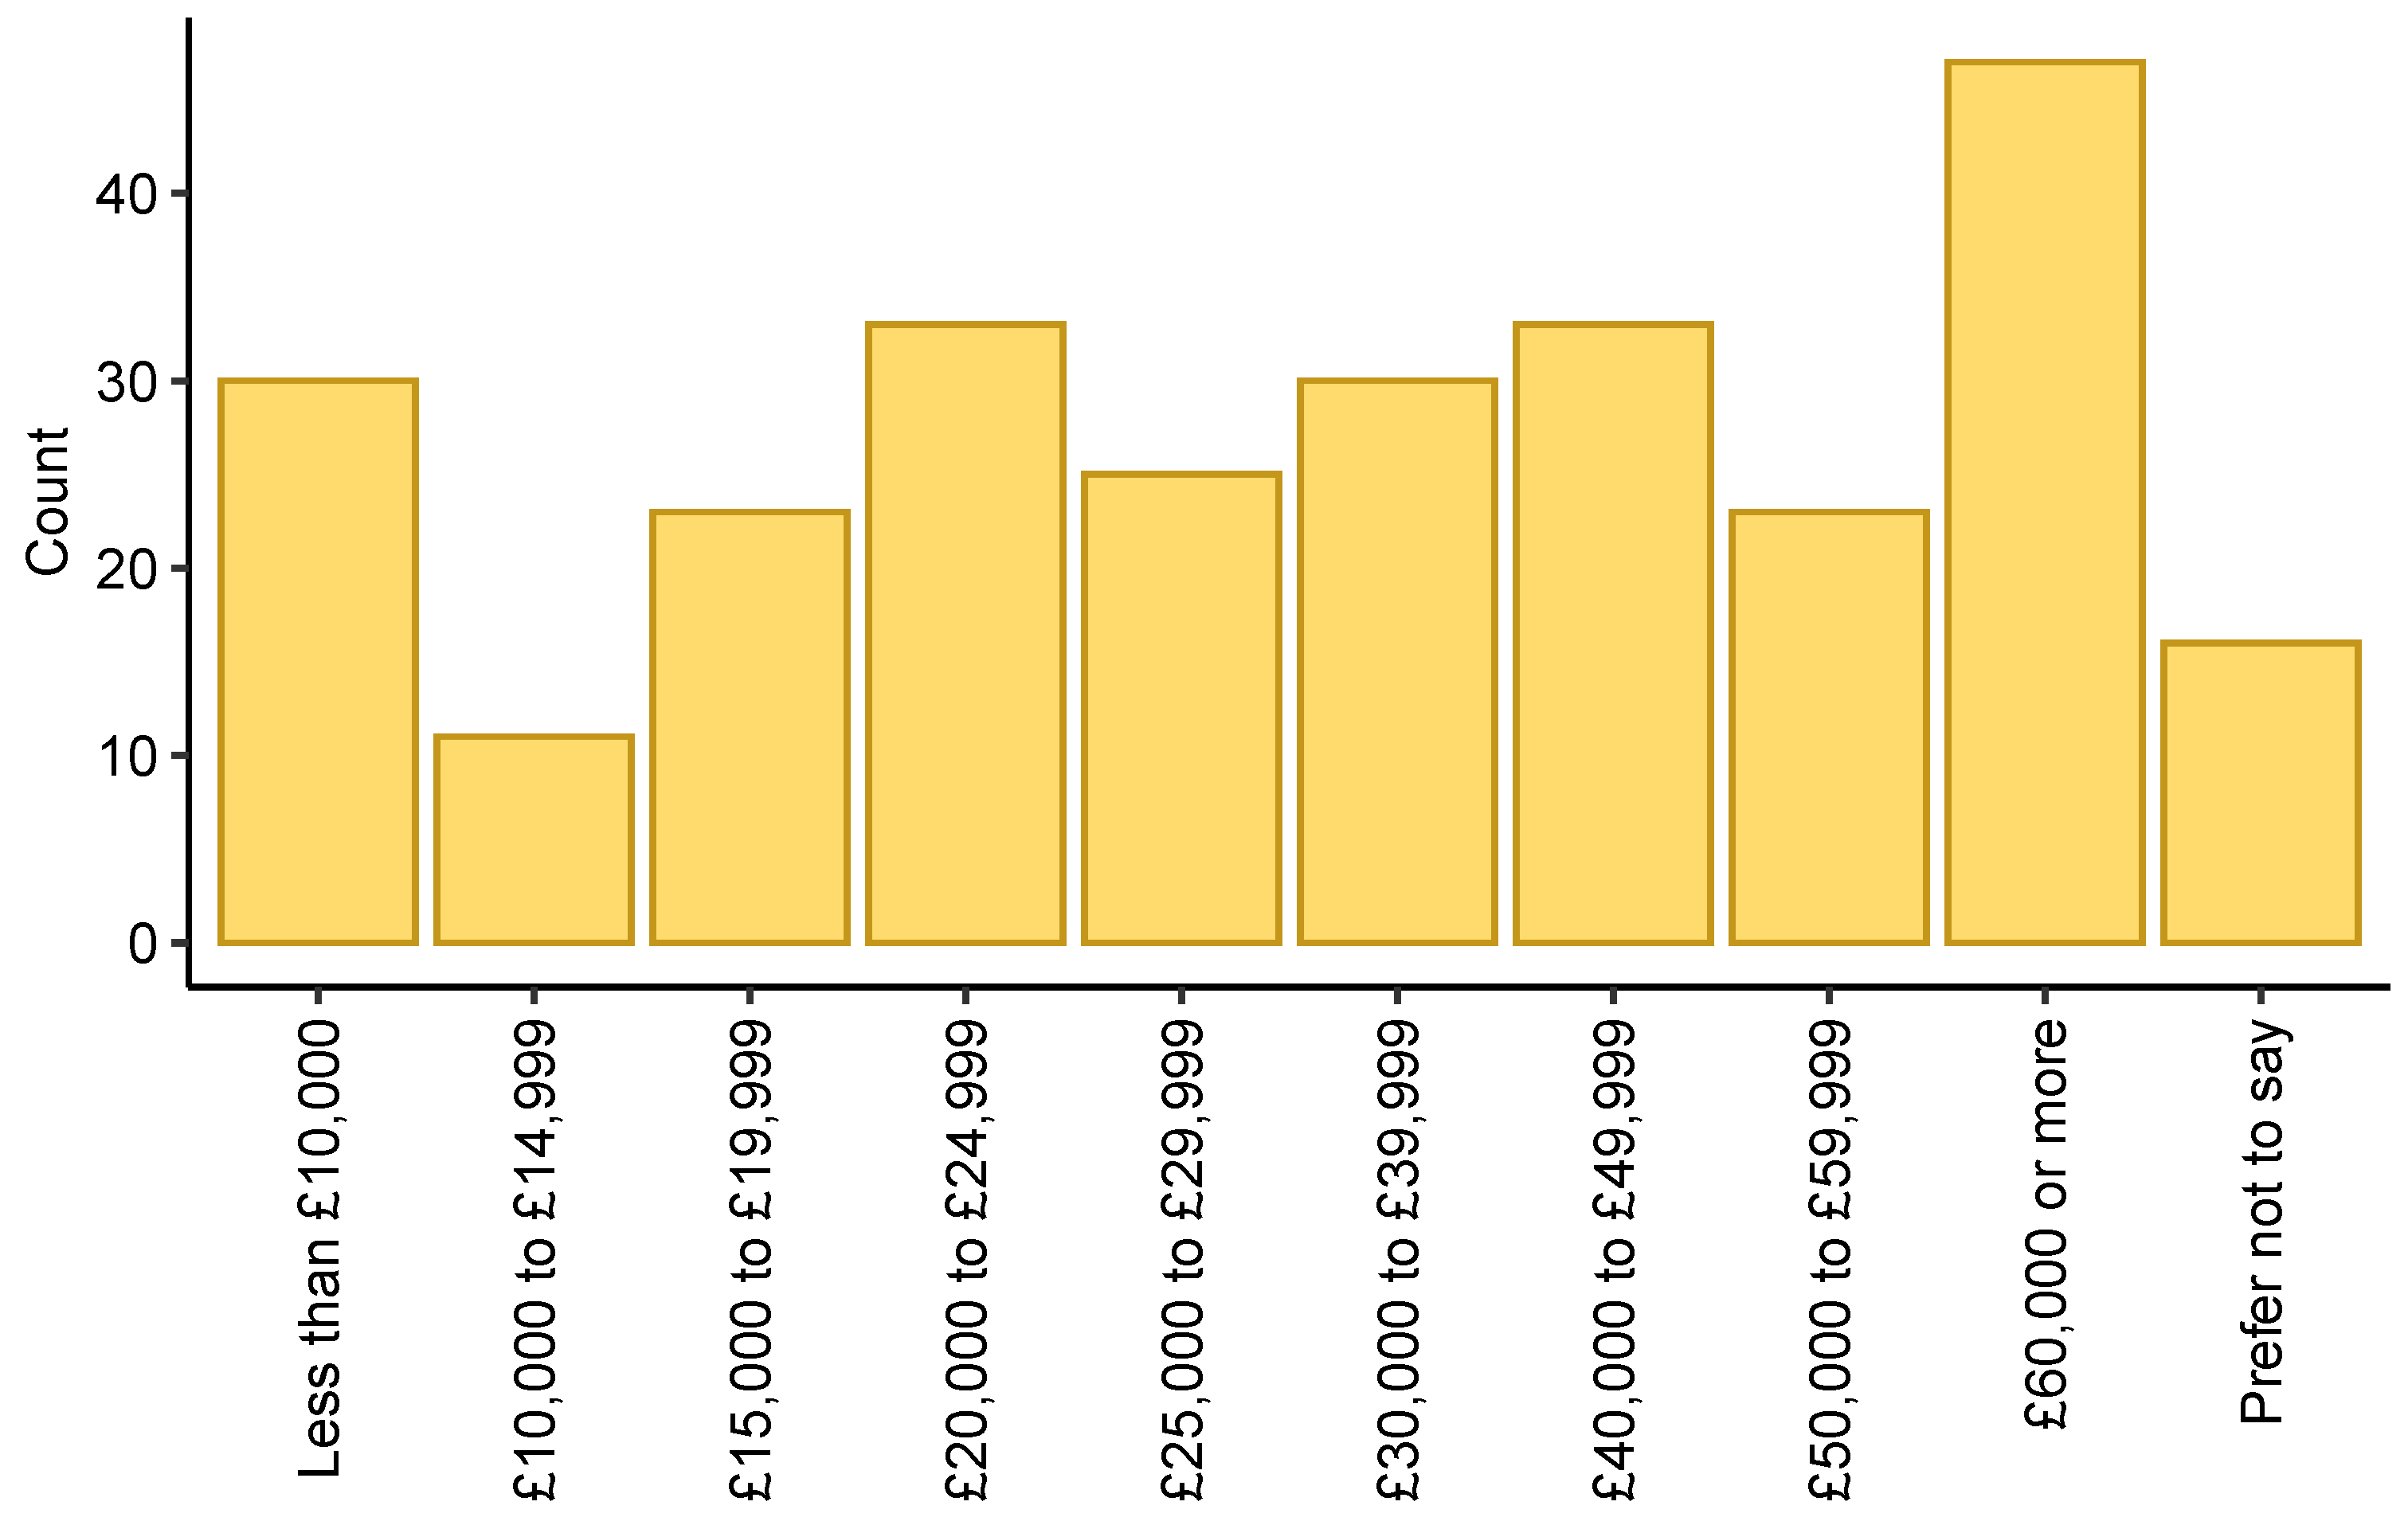
The average survey completion time was 15 min ( min). Prolific provides certain demographic information of its participants directly through their profile (age, gender, student status), while we used additional questions to collect other information (gross household income, homeowner status, highest education, ethnicity, environmental rating). Participants had a mean age of 34 years (). Of the 271 participants, 137 were women and 134 were men; 64 were students. The median of the gross household income was in the range from £30,000 to £39,999, 110 participants were homeowners, as their highest degree the majority of participants (99) had a Bachelor’s degree (BA/BSc/other), and the majority of participants (229) described themselves as white. For more details, additional tables and figures are given in Appendix A.
In addition, participants were assigned points for their answers in three questions rating their environmental attitudes, with more points corresponding to a more environmental-friendly attitude. Out of a total of 15 points, the average environmental attitude was 12.89 (). Furthermore, three cognitive reflection test (CRT) questions were asked. The distribution of correct CRT questions was: 112 zero correct CRT questions, 66 one correct CRT questions, 52 two correct CRT questions, and 41 three correct CRT questions.
2.3. Procedures
Participants were active survey takers on Prolific, where they could browse the survey descriptions of different surveys from different institutions and select the ones that they were interested in. For each survey available, Prolific presents a description page including payment, duration of study, remaining study slots, and a text from the researcher. We described the research team to the participants and that we were interested in their opinions on issues related to energy in buildings and environmental issues. We emphasized that the survey must be given full attention and that attention would be controlled by corresponding questions. Such questions are a standard procedure at Prolific and the question texts were approved by Prolific staff. Participants were also informed that they would be given more time than necessary so that they would not have to rush through the survey. Lastly, contact information was given. By executing the survey, participants consented to our use of the anonymized data collected for publication in a scientific journal. After a brief CAPTCHA test and providing their Prolific ID for participation, we asked our demographic questions described above. The CRT questions were placed at the end of the survey so as not to exhaust participants before the main section. The remainder of the survey consisted of questions about cognitive biases related to building energy decisions, which are explained in the next section. With the exception of the order of the demographic, environmental assessment, and CRT questions, all questions were randomly ordered. That is, the order of all question groups and questions within question groups was randomized. For questions with different answer choices, the order of these was also randomized. The survey questions can be found in Appendix B. It should be noted that there were new pages for questions that were unrelated and participants could not return to a question they had already answered.
2.4. Data Analysis/Data Collection
Data analysis was performed using the statistical programming language R [30]. Responses were either Likert scale, multiple-choice, importance rating scales, or numerical inputs. Standard statistical hypothesis tests were used to compare participants from group A and B (two-sample t-test, two-proportion z-test, Wilcoxon rank sum test). We used an alpha level of 0.05 for all statistical tests.
In addition to the test results, we present effect sizes for interpretation. For a two-sample t-test, we use Cohen’s , where for are the group means and is the pooled standard deviation. For the two-proportion z-test, we use Cohen’s , where for are the group proportions. For the Wilcoxon rank sum test, we use Pearson’s , with sample size n and the W-statistic is standardized to z.
In the following sections, we present the methods, results, and discussion of the four cognitive biases studied: framing, anchoring, default, and decoy effect.
3. Framing Effect
3.1. Methods
In order to examine our first alternative hypothesis—
Hypothesis 1.
The framing effect increases awareness for greenhouse gas emissions from buildings through appropriate framing—
we showed groups A and B two different introductory texts with the same content about greenhouse gas emissions (GGE). Using the framing effect, the text of group A sets “GGE due to the construction and operation of buildings” into focus, while the group B text stresses “GGE from other sectors”. Afterwards, both groups were asked to rank various problem areas in the order of importance, including GGE from buildings (Q1) and to rate the importance of policy incentives to reduce GGE from buildings (Q2). The complete framing effect question can be found in the appendix in Table A2. For Q1, we used a one-tailed t-test to analyse the alternative hypothesis whether the mean rank given to the GGE from buildings was greater in group A than in group B. For Q2, the response was an ordinal Likert scale, and we used a non-parametric Wilcoxon rank-sum test to test for inter-group-differences.
3.2. Results
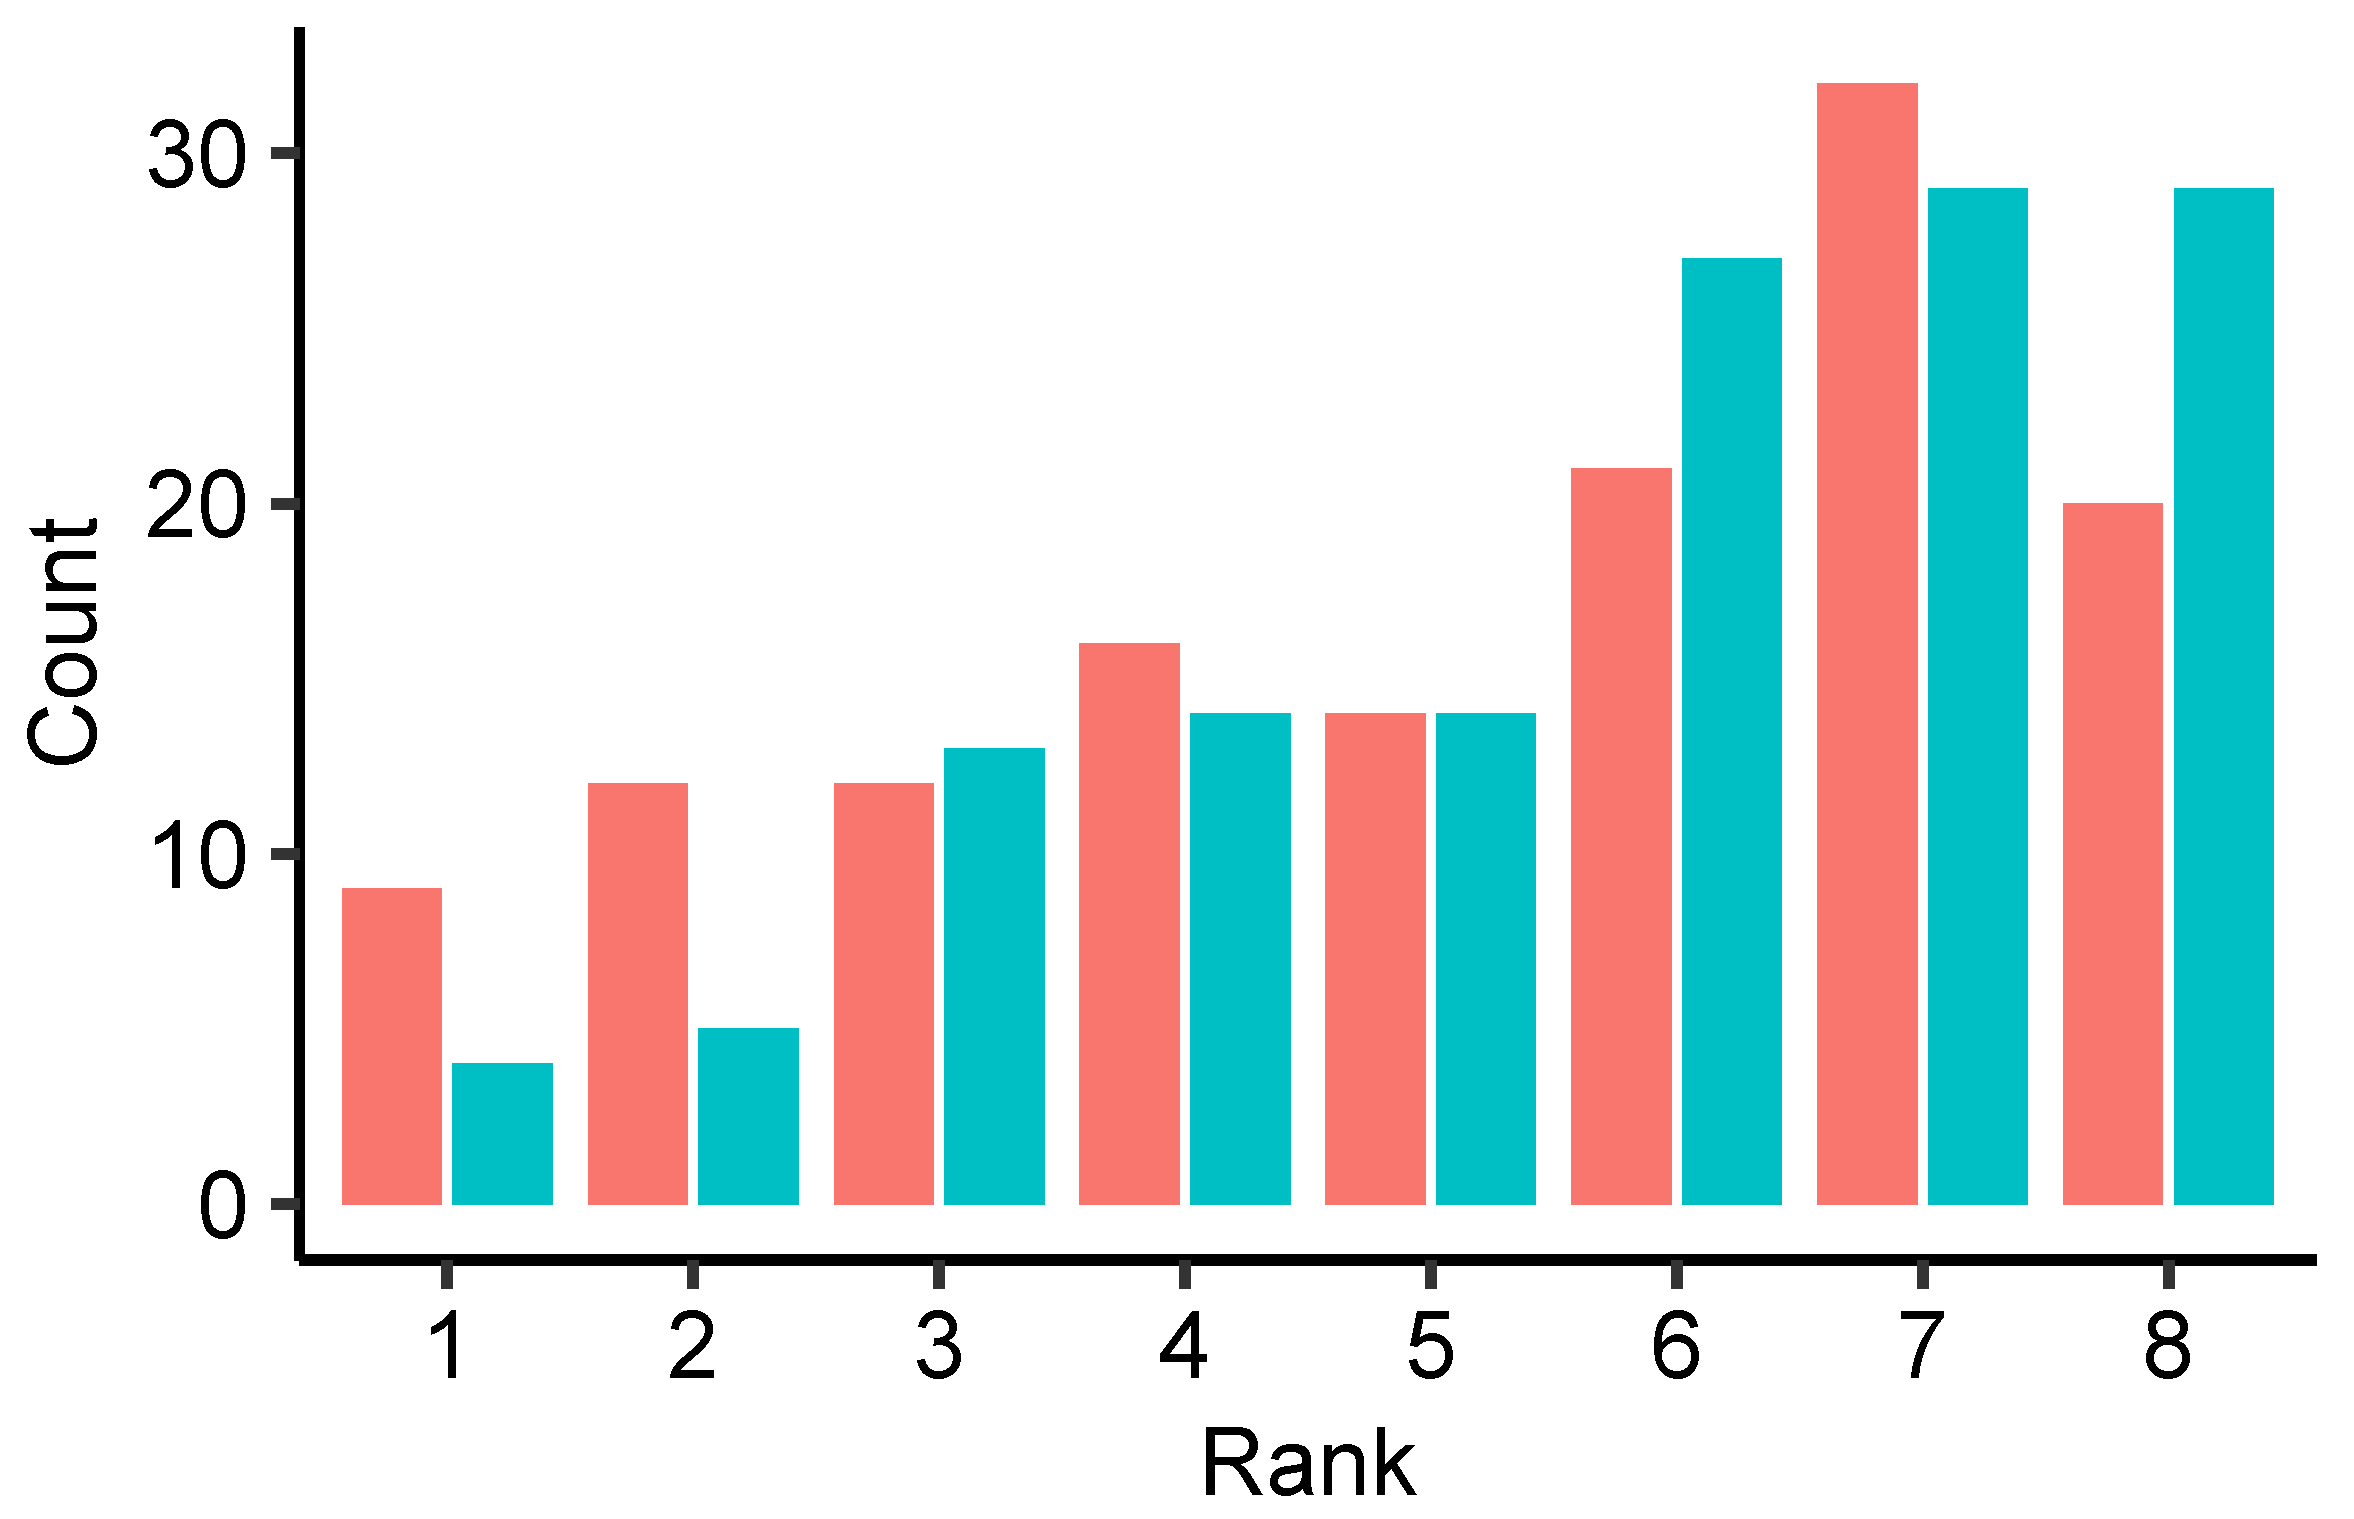
Figure 1 shows the ranking of the problem area of GGEs from buildings in Q1, where one is the highest ranking and eight is the lowest. The mean rank of GGE from buildings in group A was , 95% CI [4.87, 5.61] and in group B , 95% CI [5.42, 6.08]. The mean rank was higher in group A than in group B, . The mean rank difference was ().
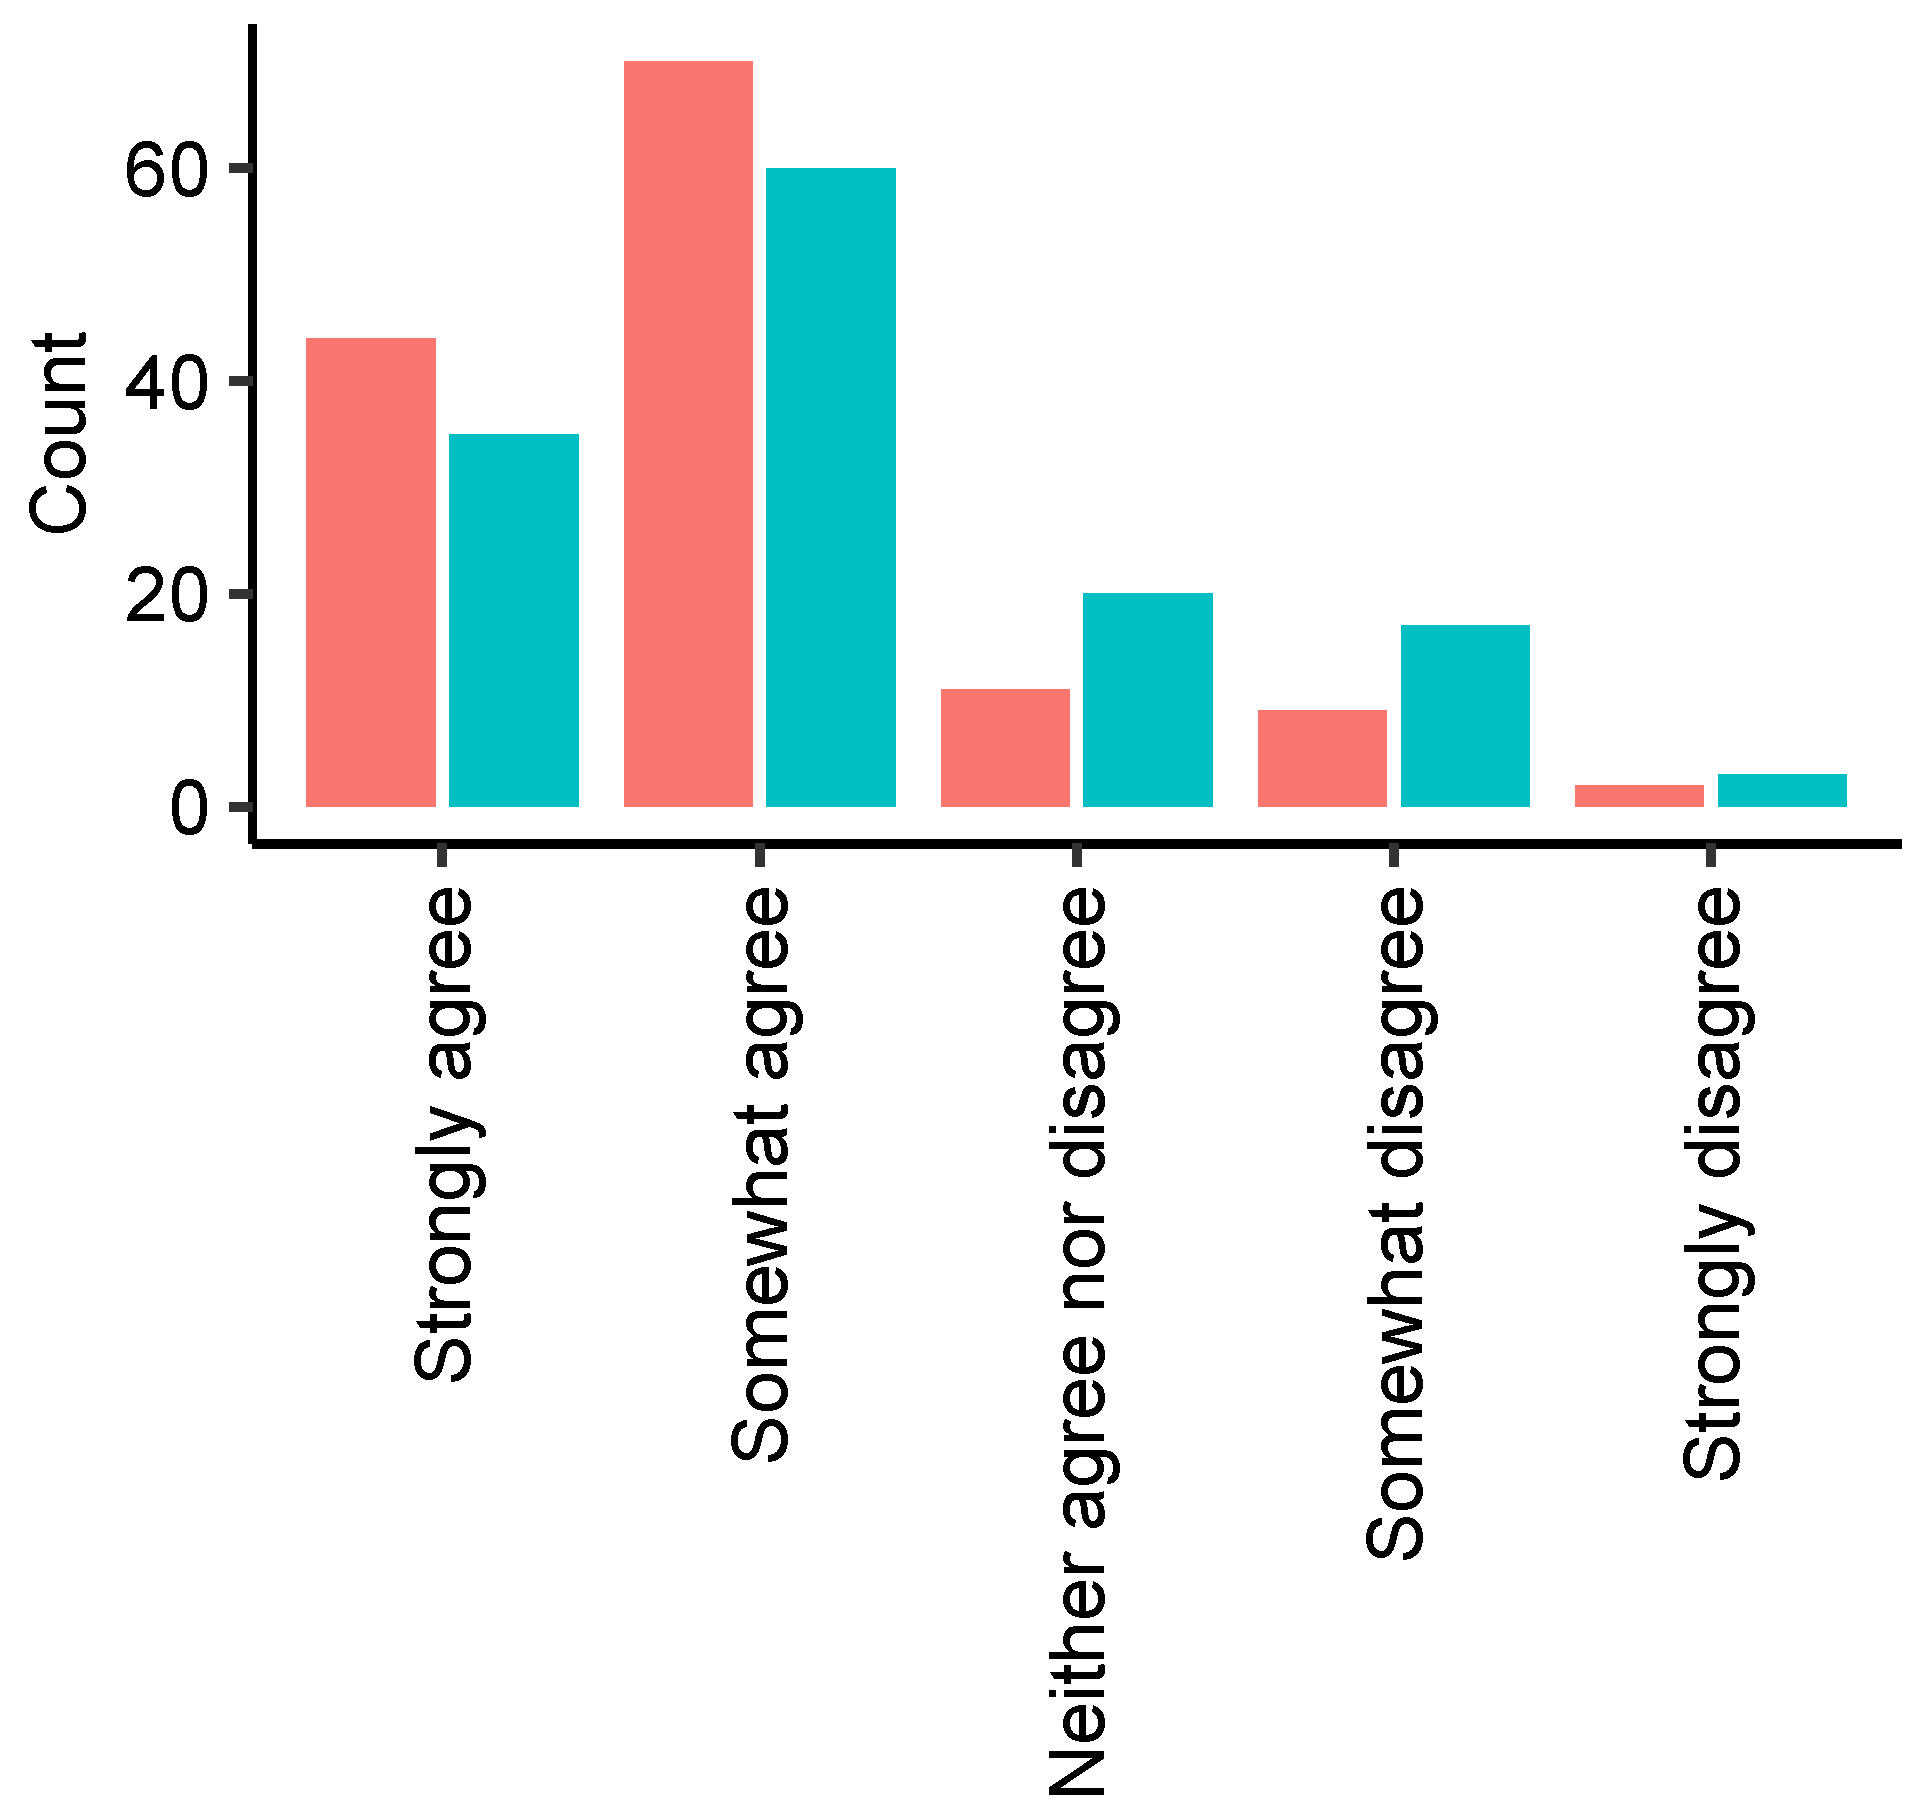
Figure 2 shows the rating of policy incentives to reduce GGE from buildings in Q2. On average, group A gave a slightly higher rating than group B, ; .
3.3. Discussion
The results support our alternative hypothesis by showing a small effect of the framing on decision-makers’ attitudes towards GGE of buildings for Q1 and Q2. Participants with a frame focusing on GGE from buildings ranked the issue slightly higher and agreed slightly more with corresponding policy incentives. These results are consistent with previous empirical evidence on sustainability related framing effects (e.g., Hardisty et al. [31]), but the effect size is less pronounced. Comparing our results with the study of Hardisty et al., the authors had an identified subgroup (political orientation) prior to the study that suggested a possible correlation with a framing effect through taxes, resulting in significantly stronger effects. In terms of future research, it may be useful to create frames that are adapted to subgroups in order to achieve more prominent effects. Nevertheless, our results show a small effect without these “smart frames”.
4. Anchor Effect
4.1. Methods
For the anchor effect, the alternative hypothesis was:
Hypothesis 2.
The anchor effect increases decision makers’ willingness to pay more for solar systems when a higher anchor is introduced for past prices.
To address it, we first gave the participants information about the current and past costs of a 4 kW solar system and then asked them how much they would be willing to spend on one. For both groups, the current cost of the solar system, £6000, was the same. The only difference between the groups was that the anchor—implemented as the past cost of the solar system—for group A was higher, £20,000, than the anchor of group B, £7500. Both were true values but go back in time to different degrees [32]. The complete anchoring effect question can be found in Table A3 in Appendix B. It should be noted that, due to numerical formatting errors in LimeSurvey, 13 responses had to be excluded from the analysis for this question, resulting in 126 participants for group A and 132 for group B. We tested the alternative hypothesis of whether the mean price participants were willing to pay was higher in group A with a higher anchor than in group B with a smaller anchor with a one-tailed t-test.
4.2. Results
Table 1 shows that participants from group A with a higher anchor had a higher mean willingness to spend £5048, 95% CI [4645, 5450], compared to the mean of group B £4643, 95% CI [4352, 4933] with a lower anchor. However, with a mean difference of £405 (, decrease comparing group A to B), the result was not significant, , .
4.3. Discussion
As the results show no evidence of a significant difference between participants’ willingness to pay for a solar system, regardless of whether a high or a small past price anchor was used, we cannot support our hypothesis. This does not align with related findings of highly significant anchor effects for energy decisions in buildings by Klotz et al. [13]. One explanation for the strong influence of the anchor effect in the work of Klotz and co-workers could be the repeated anchor implementation. Anchoring was consolidated through several thought processes with four preliminary questions with the same anchor, whereas our study only relied on a single anchor. Accordingly, it may be of interest to study repeated anchor implementations to increase the effectiveness of the method.
On the other hand, another limitation of our example could be the individual interpretation. The anchor could trigger two opposing trains of thought, namely: “the price was high and has already fallen sharply” versus “there is a downward trend that is continuing”. In this sense, the first train of thought is consistent with our hypothesis, where the high anchor price of the past pulls the value of the solar system upwards, while the second train of thought contradicts it. This inconsistency is a criticism of the constructed example, not of the anchor method itself. However, it illustrates the caution that must be exercised when using choice architecture, as insufficiently clear implementations could have opposite behavioural effects that inadvertently cancel out the cognitive bias of interest. Previous anchor effect research has shown that the anchor does not have to reference the target quantity (e.g., an unrelated random number as anchor for a fraction estimate [22]), while our example might suggest that a relationship can even be harmful, as it can set the stage for unintentional implications. While a simple approach to this issue would be to avoid a misleading anchor, it may be of greater interest to explore this example further by additionally asking participants to write down the accompanying thoughts about their decision.
5. Default Effect
5.1. Methods
For the default effect, the following alternative hypothesis was considered:
Hypothesis 3.
The default effect increases the willingness to pay more for an energy-efficient home by offering the energy-efficient options as default.
Participants were asked to imagine that they were planning to build a house and to decide which features this house should have. Both group A and B were given the same introductory text. Group A was then presented with a default quote for a house that was less expensive (£409,000) but also less energy-efficient, while group B’s default quote was for a more expensive (£436,500) but also more energy-efficient house. Afterwards, the groups had the option to deviate from their initial default option by adding or excluding five features, which were the same in both groups and which would increase and lower the total building cost, respectively. Thus, selecting all additional features in the default quote of group A would result in the default quote of group B (at the corresponding cost) and, vice versa, excluding all features in group B would result in the default quote of group A. In addition, all participants were asked how satisfied they were with their original default quote and the resulting quote after their adaptation. The complete default effect question can be found in the appendix in Table A4 and Table A5. We tested the alternative hypothesis, whether the mean house price participants were willing to pay was higher in group B than in group A with a one-tailed t-test.
5.2. Results
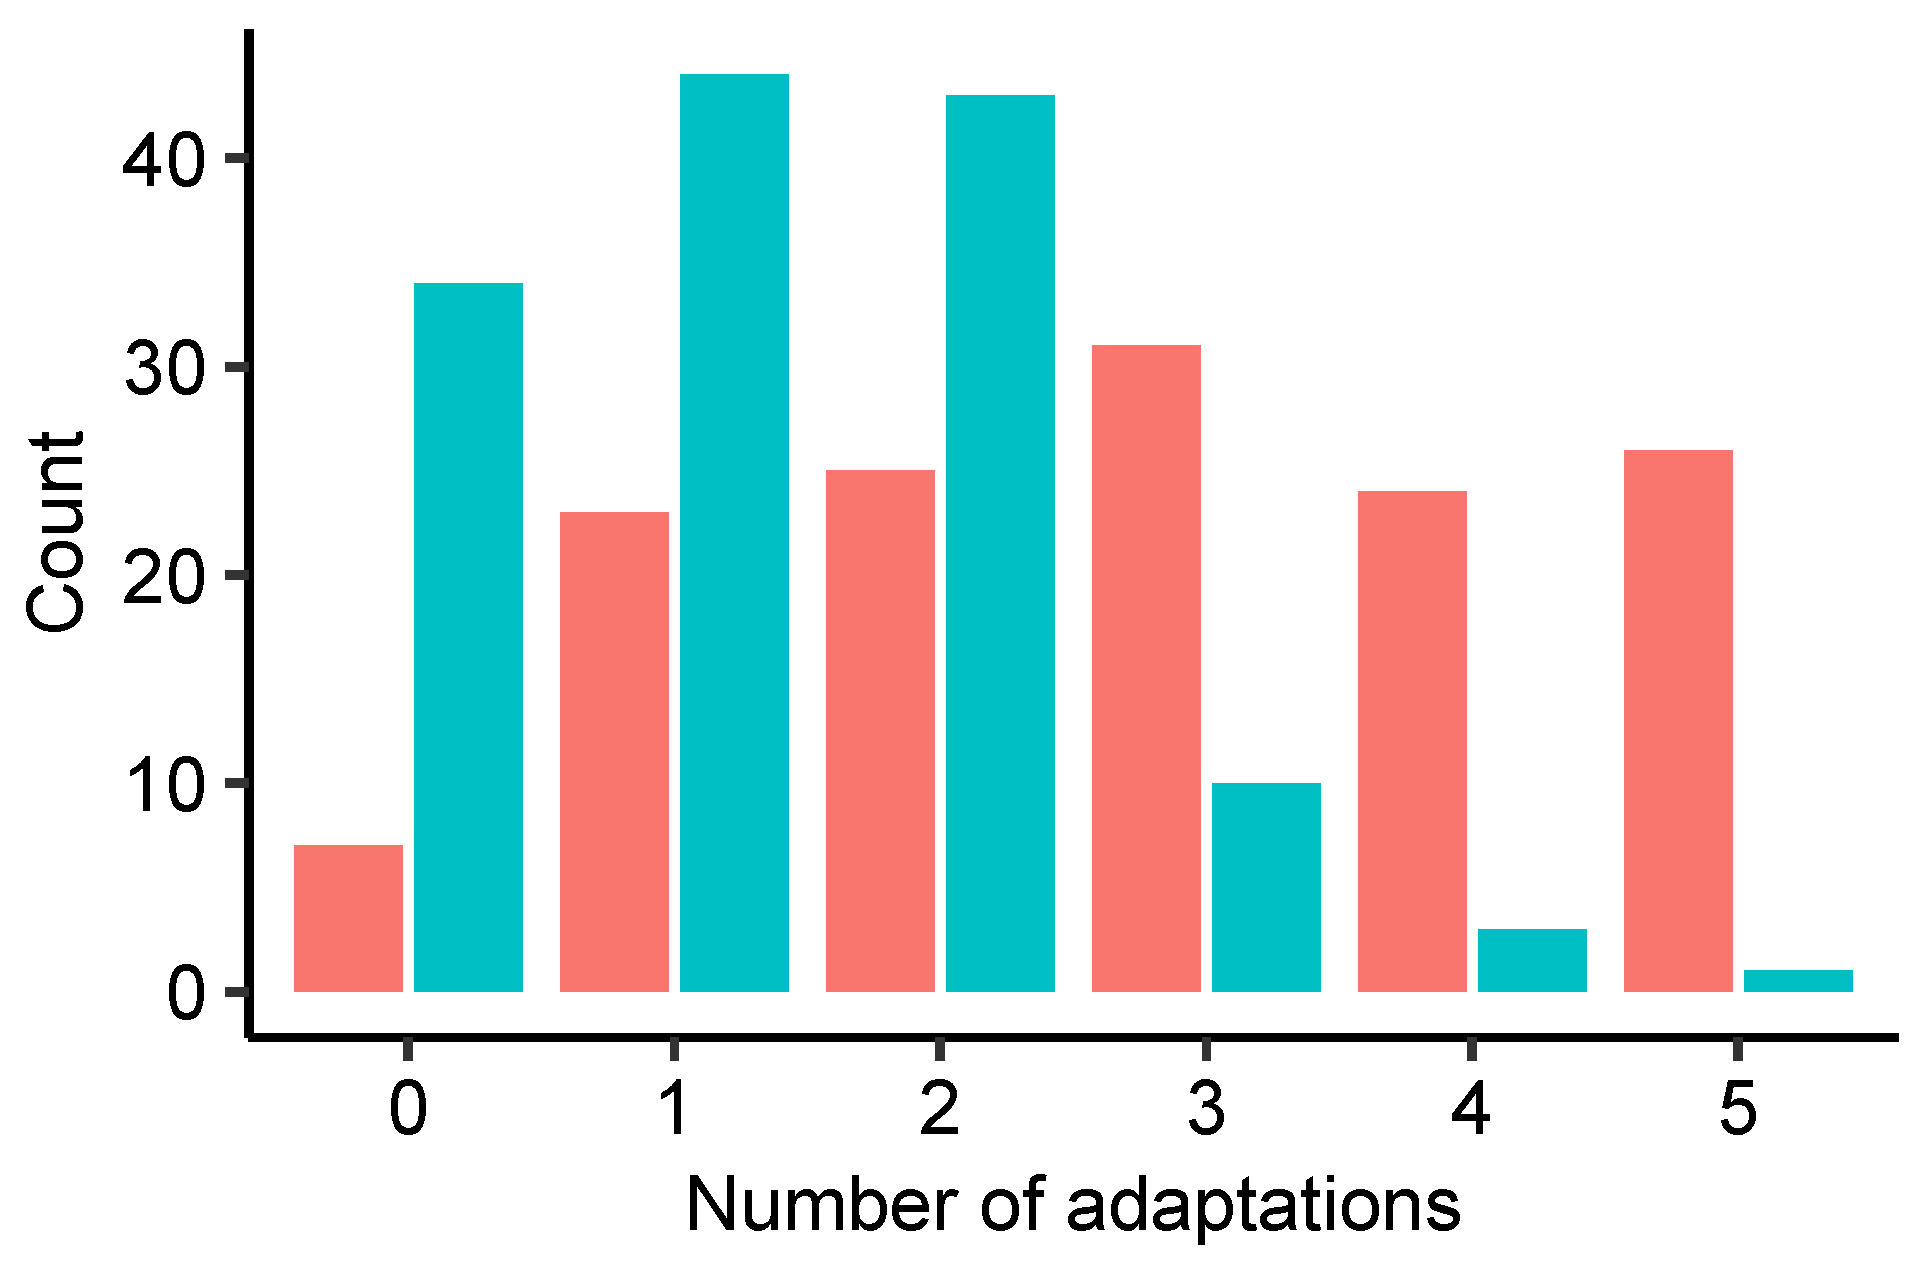
Figure 3 shows the adjustment of the quotes of groups A and B. By the higher number of adaptations in group A, we can see that the majority of participants prefer a more energy-efficient house at the cost of a higher price. However, the initial quote causes a tilt towards the default options. In other words, participants in group B interested in energy efficiency stayed closer to the initial energy-efficient default quote, while the number of adjustments in group A varied more evenly between one and five adjustments.
Considering the total cost of the house, Table 2 shows that participants from group A with lower default had a lower mean cost of £422,879, 95% CI [421,356, 424,402], compared to the mean of group B £428,030, 95% CI [426,781, 429,279] with higher default. With a mean difference of £5151 (), the difference is significant, , . While this is only a one per cent increase relative to full house prices, when the effective possible price tolerance between group A and B of £27,500 from £409,000 to £436,500 is taken into account, the effect is an increase of .
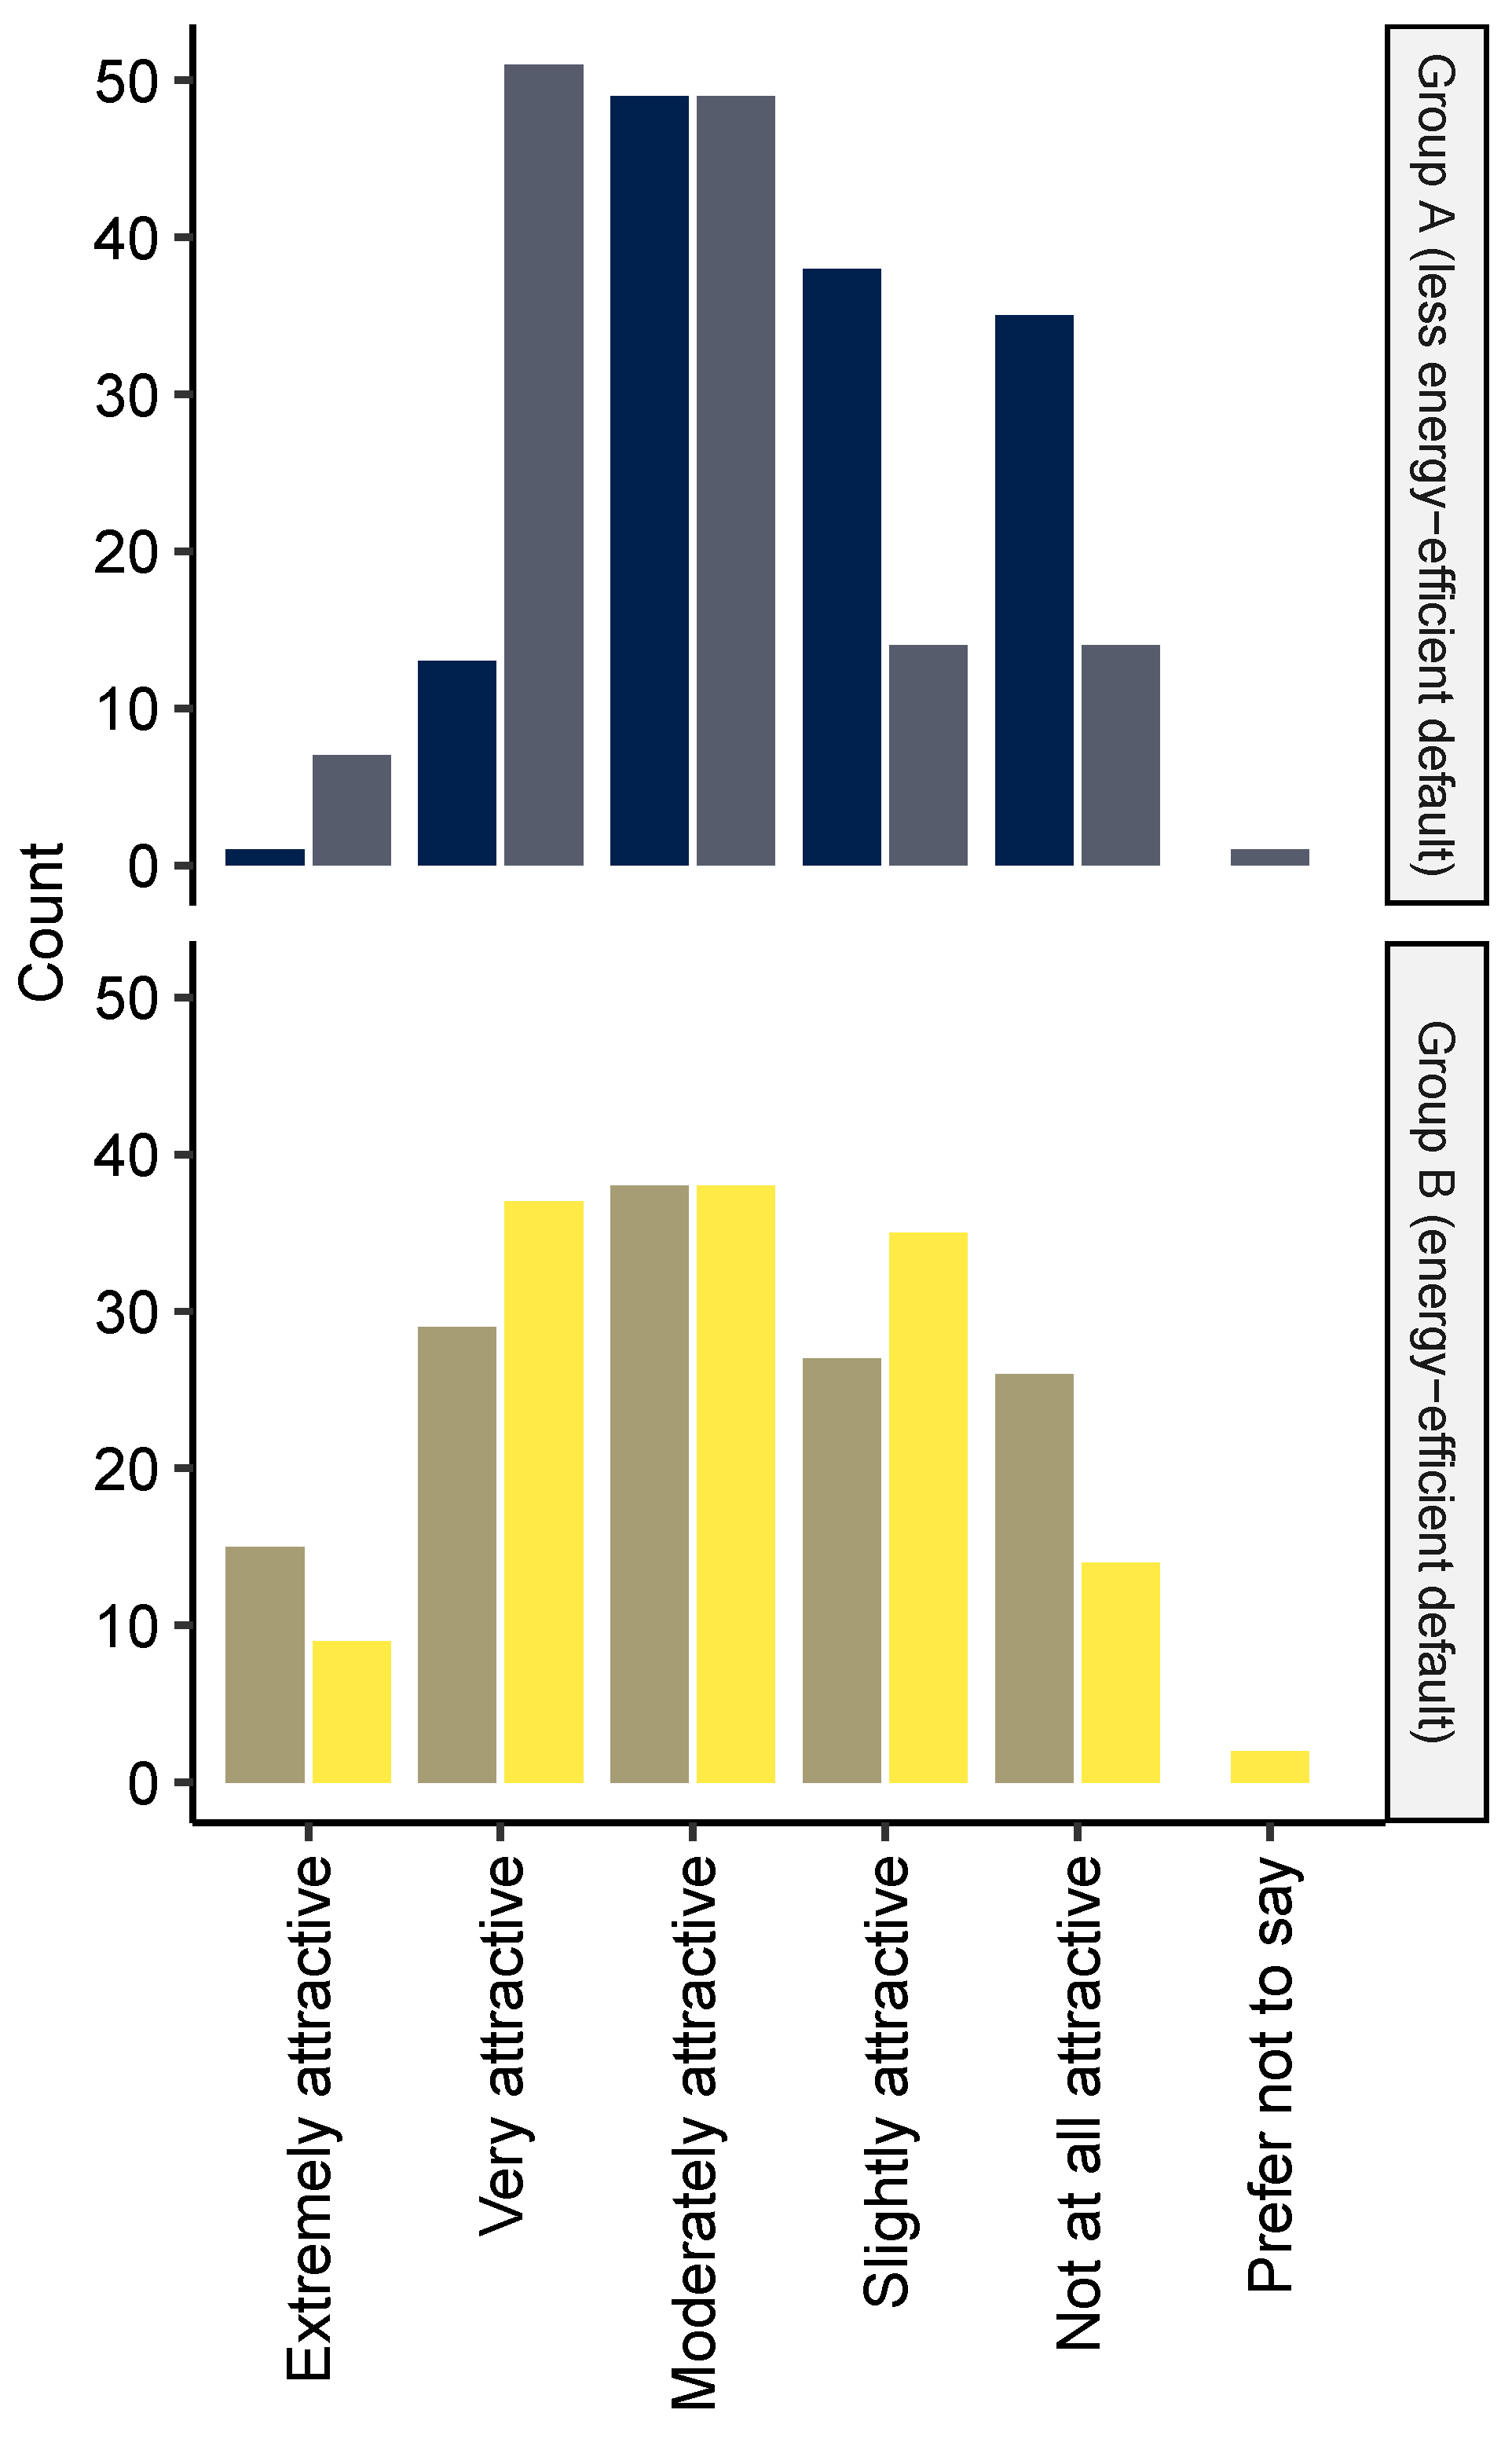
Figure 4 visualises the change in satisfaction of the participants between the initially presented and the adapted quote. Consistent with the observed behaviour, the participants from group A perceived an increase in satisfaction on average after adaptation (Wilcoxon rank-sum test: ; ), while the participants from group B where equally satisfied before and after the adaptation (Wilcoxon rank-sum test: , ; ).
5.3. Discussion
The result supports our alternative hypothesis by showing an effect of medium strength on the total price participants are willing to pay for a house when presented with an energy-efficient compared to an energy-inefficient default quote. The two accompanying satisfaction questions before and after the adaptation of the quote show that participants with an energy-efficient default quote not only made fewer changes, but were also equally satisfied before and after their few adjustments, while participants with a less energy-efficient quote made more changes and thus presumably perceived an increase in satisfaction as a result of their action. We thus observe a trade-off between the willingness to pay more for an energy-efficient house and the self-generated satisfaction from their actions.
In any case, the results imply that architects, planners, and contractors need to be aware of the effects that the design of a quote might have on the potential customer. Possible reasons for the effectiveness of the default are that decision makers might interpret the default quote as a recommendation that adopting a default involves less effort for them, or that the default induces a loss aversion framework that inhibits strong deviation from the default offer [23].
The medium default effect size for the construction example is consistent with other empirical default effect research. Jachimowicz and co-workers [24] found default effects of medium size (, 95% CI [0.53, 0.83]) in a meta-analysis across various domains. While the authors found that defaults are more effective in consumers than in environmental domains, we found a substantial medium effect in our sample. However, a possible limitation of our example is that it is hypothetical and participants did not actually purchase a building for which they needed to spend money. In reality, a prospective home owner is likely to have a given budget that they cannot exceed and an initial decision subject to a default effect—such as in our experiment—may be changed after further conscious deliberation on the decision. Hence, having empirically verified the default effect in this hypothetical scenario, it might be of interest to create an experimental design with participants who are given a small, real amount of money to spend in a default effect setting that is closer to the real decision-making process. Even more preferable would be to implement a default effect scenario in reality, for example with an architectural office, a building contractor or other supplier.
6. Decoy Effect
6.1. Methods
The fourth alternative hypothesis was:
Hypothesis 4.
The decoy effect increases the proportion of decision makers who choose a more energy efficient target option in the purchase of an appliance (refrigerator, vacuum cleaner) when an asymmetrically dominated decoy is introduced.
To examine this hypothesis, we constructed two hypothetical scenarios: the purchase of a new refrigerator with the decision between models with different energy ratings and cost and the purchase of a vacuum cleaner (VC) with the decision between models with different power and cost. In both scenarios, group A had only two response options, the target (more energy efficient and more expensive model) and the opponent. Group B had an additional third response option, a decoy. The complete decoy effect questions can be found in the appendix in Table A6. As introduced, decoy options are characterised by induced asymmetric dominance: their performance quality (in our scenarios energy efficiency in form of energy rating and power) lies between the first two options, while their price is higher than both. Consumers usually consider not only the price and energy efficiency of an appliance purchase, but also other attributes such as appearance, size, or functionality. However, the scenarios presented here posit that every appliance offered is available in all three energy-efficiency versions, so that the difference in decision is based solely on the relationship between price and energy efficiency. Furthermore, to construct the offers, in a preliminary study, participants were asked how much they were willing to pay for the target and the opponent based on the same introductory text. The alternative hypothesis of whether the proportion of decision-makers choosing the target option is greater in group B with the decoy was tested with a one-tailed z-test.
6.2. Results
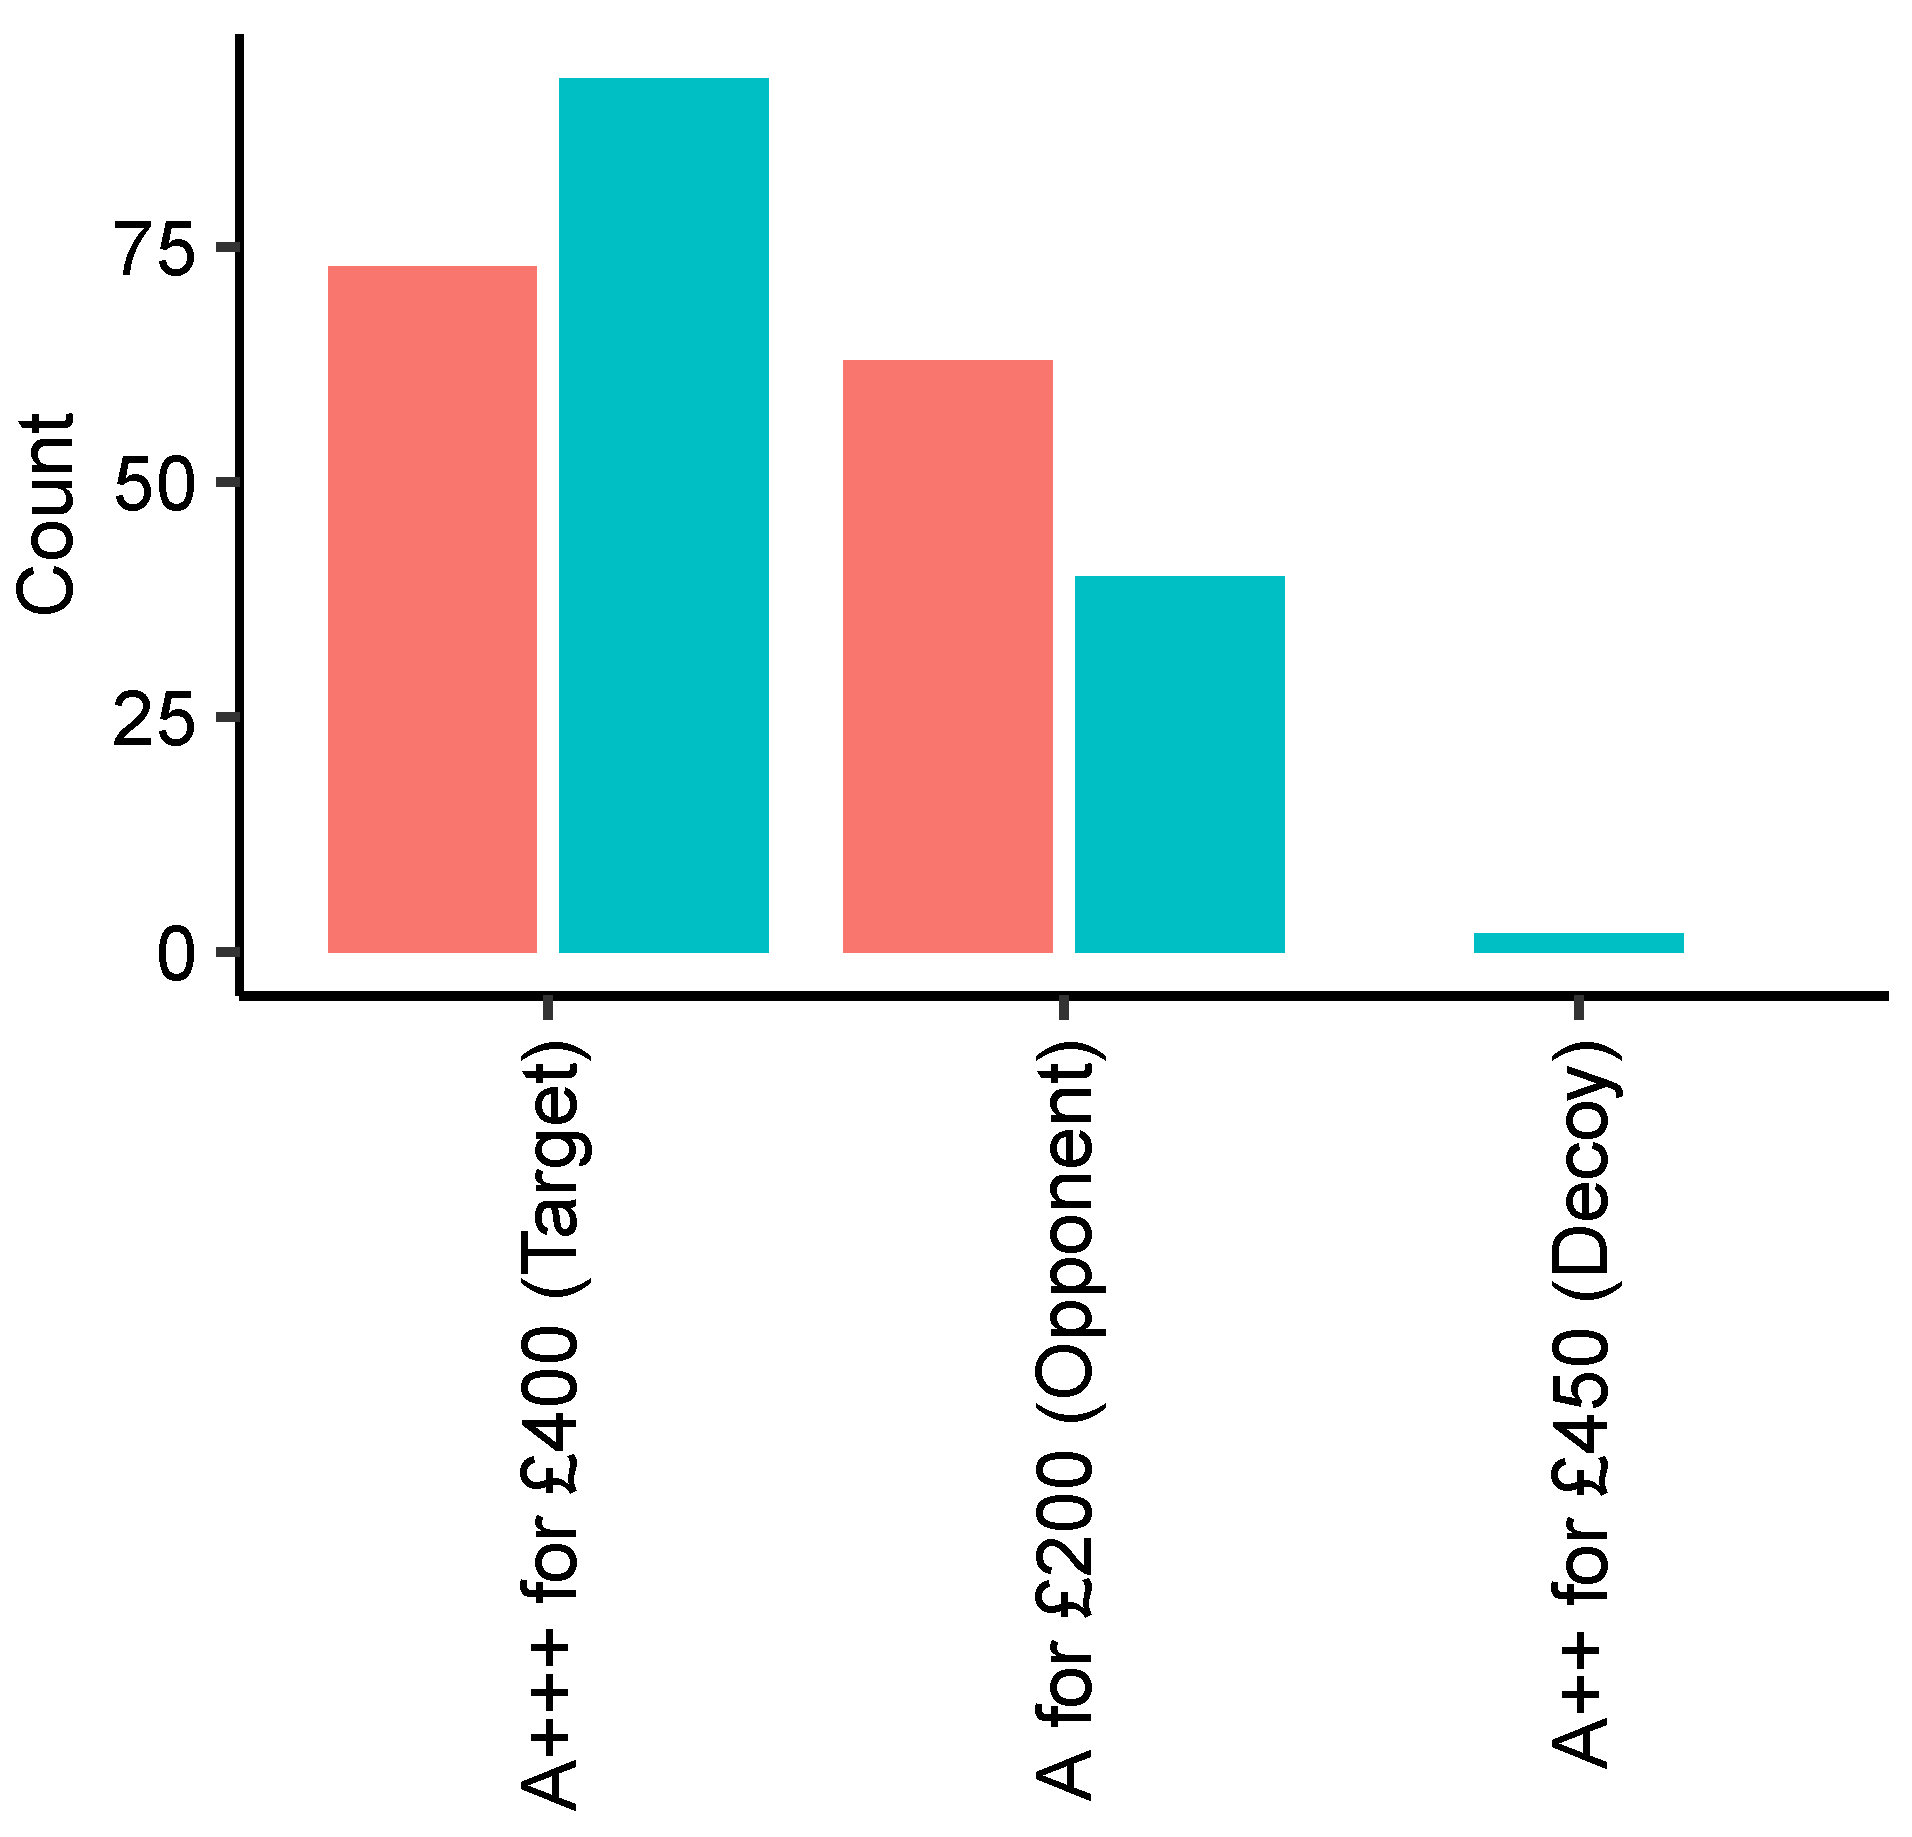
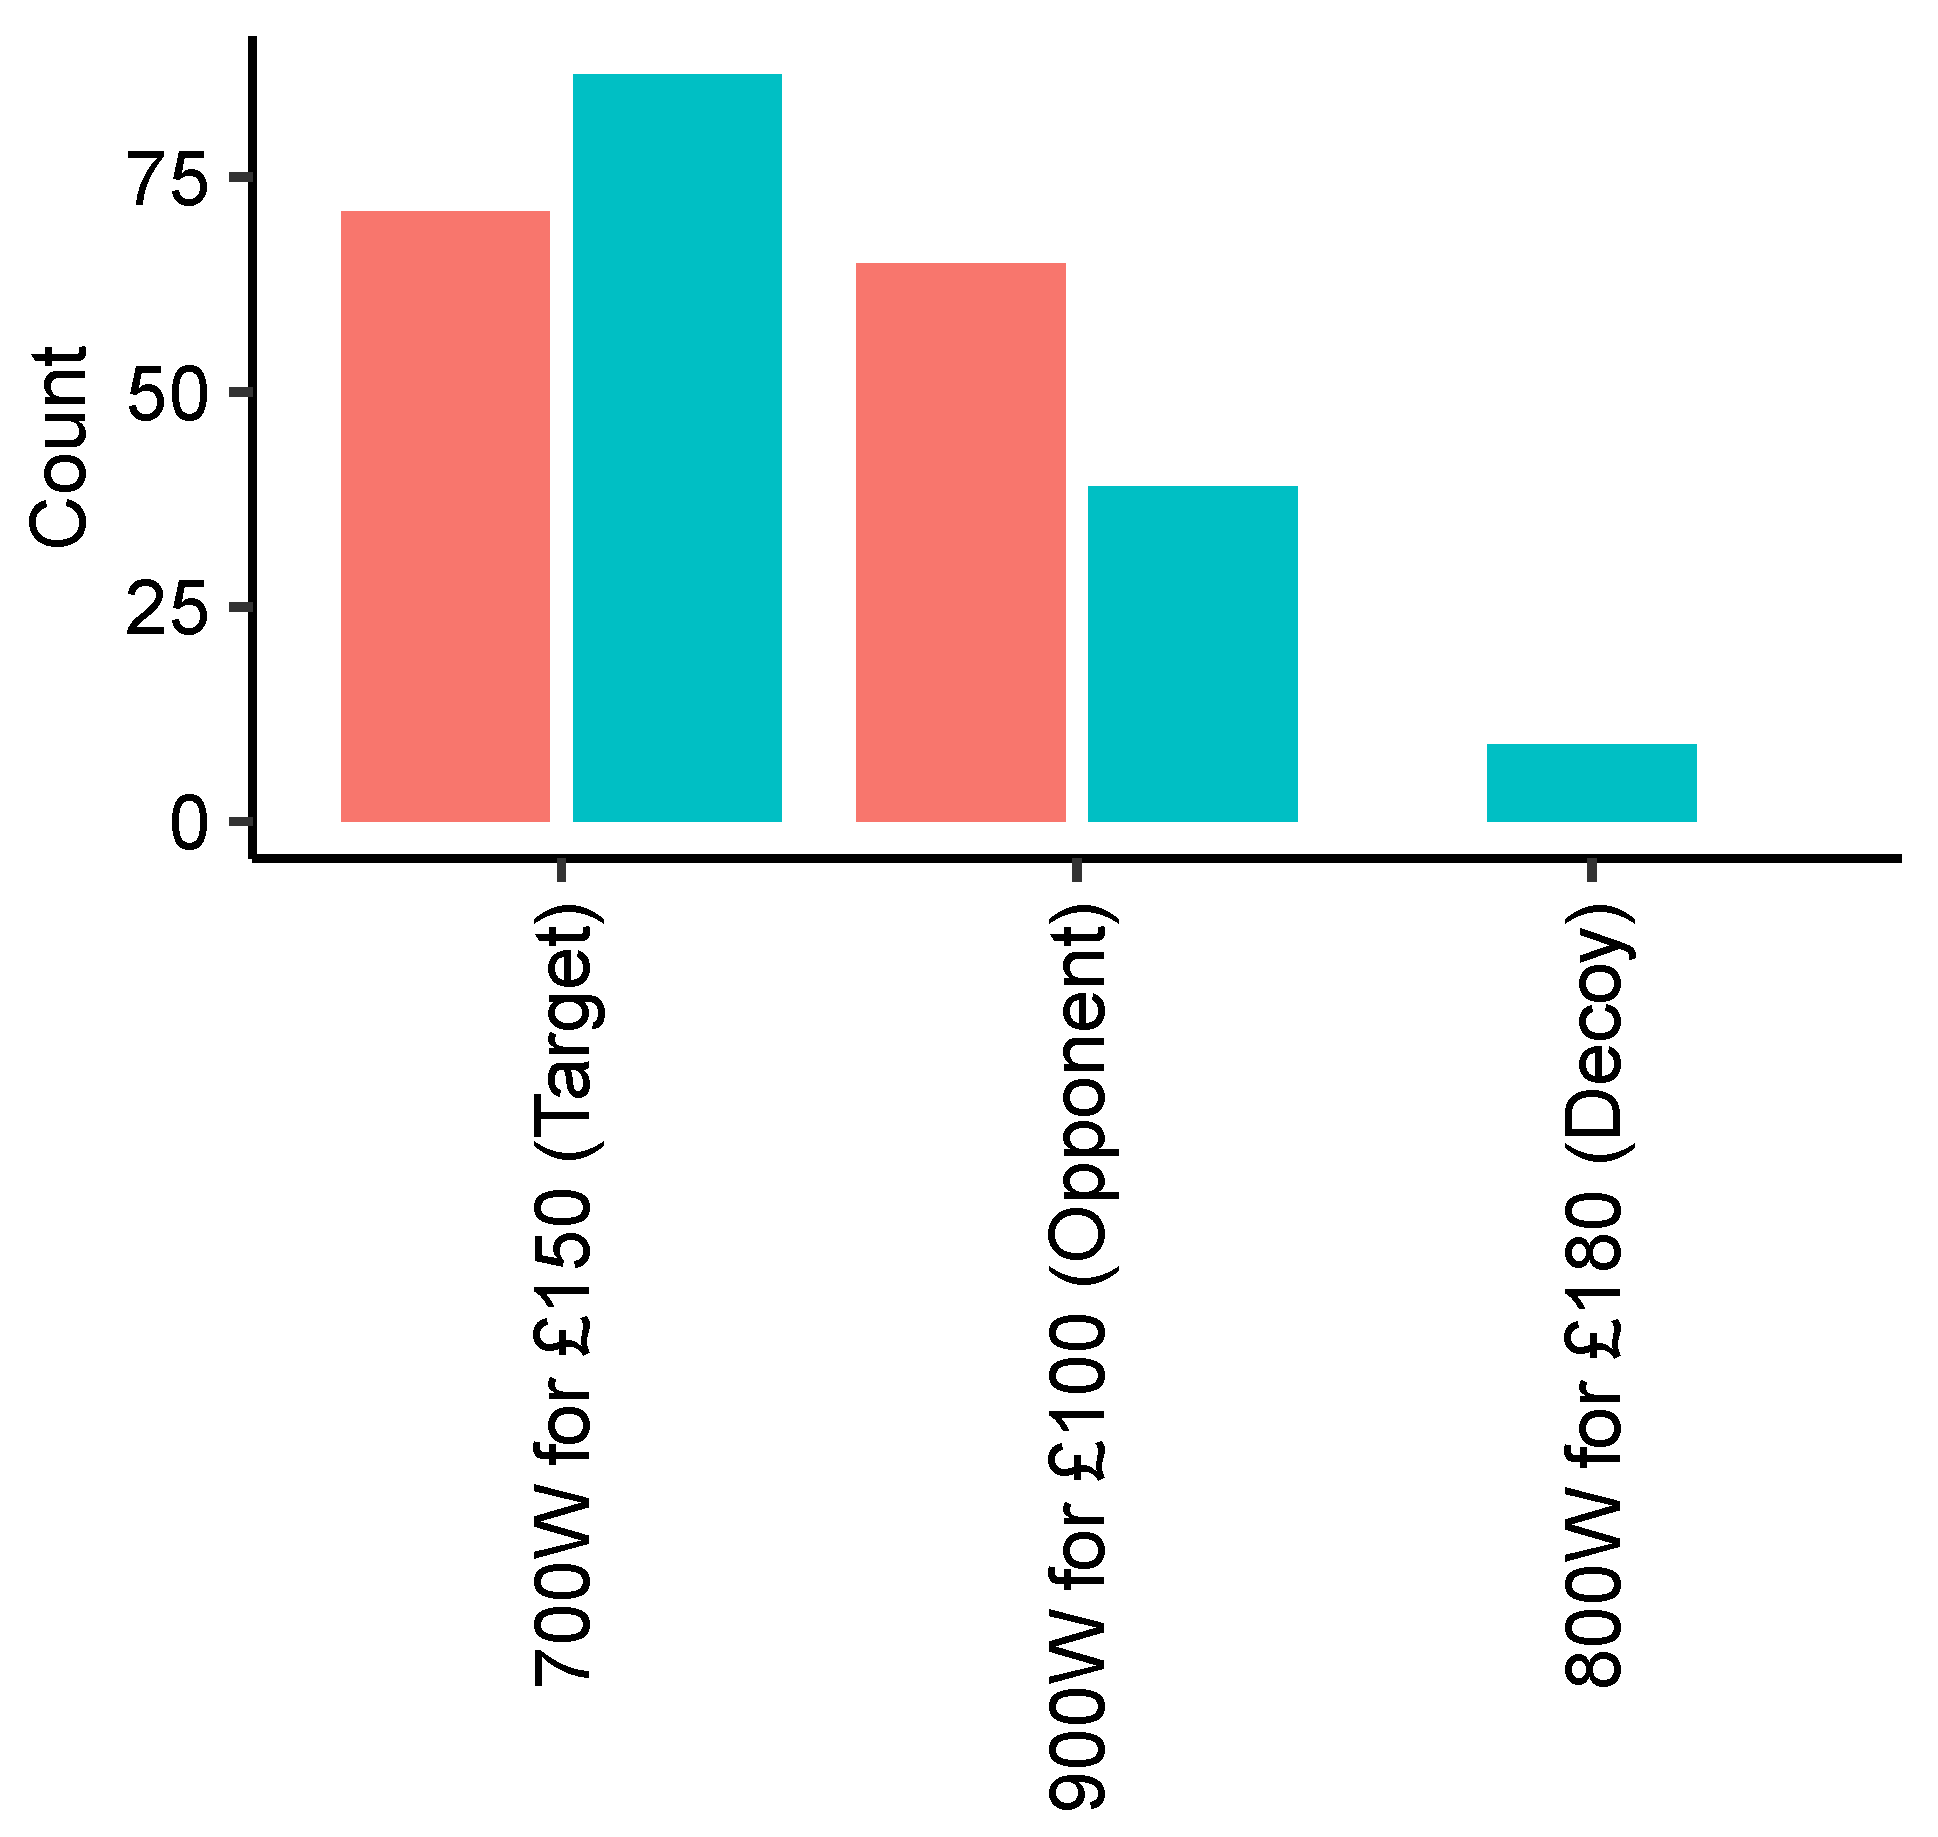
Both scenarios had similar outcomes. Figure 5 and Figure 6 show that participants in group B, where the asymmetrically dominated decoy option was presented, chose the target more often. Few participants even chose the decoy option, which is not rational given the information, as it is inferior to the other options in terms of price and energy efficiency. Apart from the few deviants, the proportion of decision-makers choosing the target was larger in group B (fridge: 93 out of 135, 68.89%; VC: 87 out of 135, 64.44%) than in group A (fridge: 73 out of 136, 53.68%; VC: 71 out of 136, 52.21%). The effect was significant for the fridge, , and the VC example, , with small effect sizes for the fridge, , , and the VC example, , .
6.3. Discussion
The results from the fridge and VC scenarios show a small decoy effect on the proportion of decision-makers who chose a more energy-efficient appliance at a higher price. In previous research on decoy effects, Huber and colleagues [25] found that adding a decoy can be expected to increase the target share by about 9 percent on average, while, in our example, the increase is slightly higher. The given scenarios show that decision makers on the individual level can be nudged towards more energy-efficient alternatives by using the decoy effect. However, as with the other financial decisions in this study, a limitation of this experiment is that participants had to take hypothetical purchase decisions where no real exchange of money took place. This could lead to the given options not being considered as seriously as in reality. Therefore, in further research, it would be interesting to investigate the decoy effect “in the field”, for example by working with appliance retailers.
7. General Discussion
With this study, we reduced the gap in empirical research on cognitive biases in energy-related decisions in the context of buildings, as addressed for example by Klotz and colleagues [12]. As summarized in Table 3, the collected data support three out of four of our alternative hypotheses with small to medium effect sizes on the existence of cognitive biases in energy-related decisions in buildings at three different levels of decision-making. The results indicate that cognitive biases can shift decisions towards more sustainable alternatives and increase the focus on energy-related issues in buildings as well as the willingness to spend more money on more sustainable alternatives. Building on initial work on cognitive biases in the building process by Klotz and colleagues [13] as well as Shealy and co-workers [14] who reported single cognitive biases, namely an anchor and a framing effect, we have shown three cognitive biases: a framing effect that can increase awareness of greenhouse gas emissions, a default effect leading to a more sustainable building design and a decoy effect shifting consumer choices towards more energy efficient devices. These cognitive biases can be applied in real-life scenarios, such as the building design process, in order to favour decisions with more sustainable outcomes.
However, the experimental approach chosen here has two main drawbacks: first, the decision scenarios were hypothetical and no money had to be spent by the participants. Second, the participants were not building professionals or all building owners who are responsible for these type of decisions.
Regarding the first issue, in reality, sustainable choices are often a trade-off between price or convenience and level of sustainability, where decision makers usually need to sacrifice either money or comfort for the positive feeling of protecting the environment. In a hypothetical experiment, however, participants get that feeling for free. This could lead to less time and effort being spent on really weighing up the options, which introduces a bias. Furthermore, participants may be more willing to act sustainably—complying to a general social bias of being environmentally friendly—since it comes at no real cost. However, while the experiments and the amounts participants were willing to pay do not reflect reality one-to-one, they do show that cognitive biases have an effect in these types of scenarios. Since cognitive biases are systematic deviations from purely rational behaviour, it is likely that our findings are at least partially transferable to decisions with real financial consequences, possibly with weaker effects. The fact that cognitive biases can be realized in financially significant contexts is also shown by the broad application in marketing that is already taking place.
The second limitation of this study is concerned with how well the findings can be transferred to the decision-making of experts who work in the field. This limitation only affects research questions 2 and 3 on the anchor and default effect, respectively, since research question 1 is covering the general awareness with respect to GGE from buildings and question 4 is a consumer decision, which is relevant to the general population since most people own a vacuum cleaner and probably many a fridge. For research questions 2 and 3, it needs to be considered that about 40% of the participants in our study were in fact home owners, for whom these questions may be a real-life scenario. Finally, since the propensity for cognitive biases is a trait common to humans, our sample of mixed background does provide a basis for conclusions towards the target group. For example, even experienced engineers, scientists, or managers can be influenced by the framing effect [33] and emission trading research has shown that practitioners, i.e., professional traders, seem to show significantly stronger endowment effects compared to students and that only practitioners show status quo bias [34].
From the above discussion, it can be concluded that the cognitive biases demonstrated here in an online study with a general population would likely also be effective in a group of experts who are faced with these types of decision scenarios in their professional activity. It should be noted that the effect sizes observed here were small to medium. That means that the potential for behaviour change through these biases is limited in its size. Furthermore, it needs to be assessed how well our findings translate into real-life decision scenarios. A more general limitation of the use of cognitive biases towards increased sustainability is their limited behavioural effectiveness: Schubert points out [20] that green nudges are highly context-dependent and may only have temporary effects. Hence, they should be seen as a complement to traditional policy making, based for example on incentives or laws, however one that comes at significantly lower costs to implement. Thus, the examined biases are of interest to be used in real-life scenarios by modifying existing decision contexts in order to promote more sustainable decisions, i.e., nudge people to “greener” outcomes.
The question remains if applying choice architecture for sustainability is ethically desirable since it is at odds with preventing the occurrence of cognitive biases in order to increase transparency and autonomy in decision-making. We need to consider, however, that we are probably limited in the extent to which we can prevent cognitive biases at all. Shealy et al. [14] (p. 3), for example, concluded “Whether intentionally designed or not, there is no neutral framework to present information.” Eliminating one can introduce another cognitive bias (e.g., trying to create a neutral frame for one group of people may introduce an intervention for another group, etc.). On the other hand, some observers might interpret the active application of choice architecture as sinister or evil, whereas sustainability is probably generally considered heroic or good. This would amount to “using evil for something good.” However, staying out of it and being as neutral as possible (e.g., avoid “nudges for sustainable buildings”) could tip the overall balance into the wrong direction, as choice architecture is already widely used by other parties, e.g., in marketing, mostly to maximise sales, retain customers, or promote products (which are not necessarily environmentally friendly). Thus, maybe there is a silver lining in actively using cognitive biases to promote sustainability—a goal which in many countries has been democratically decided upon—instead of going with the flow of monetary interest groups. Furthermore, since the struggle for sustainability is a collective affair, a centralized approach through choice architecture might be more appropriate than a decentralized one where the decision context for the individual would need to be as neutral as possible. This is because the individual may lack the expertise and incentive to choose an appropriate sustainable option and may be better served by a “soft guidance” in the form of choice architecture.
Thus, the systematic study of cognitive biases and its subsequent input for choice architecture of the building design process may lead to a significant decrease in building energy use, embodied energy, and carbon footprint. Furthermore, such an adaptation of the design process could also be utilised to create “nudges” towards the use of more sustainable materials (e.g., materials without harmful components) or the adherence to the principles of circular economy (design for disassembly, possibility to reuse materials). While some of these new design pathways might initially be a bit more expensive, in the long run, overall costs are likely to decrease as sustainable designs, systems, and materials become more commonplace and as negative consequences of a non-sustainable approaches are factored in (e.g., carbon penalty, etc.). Finally, choice architecture in the building design process is a much cheaper measure to increase sustainability compared to interventions based on regulation or incentives.
8. Conclusions
As the influence of bounded rationality on sustainable energy decisions in buildings is largely unknown so far, the empirical evidence presented here can stimulate answers to questions such as how cognitive biases prevent the adoption of available technology, how this can be remedied and, on the other hand, how cognitive biases can be used in the design process in order to favour sustainable options. In this work, we found evidence of three cognitive biases—framing, default, and decoy effect—that may nudge the results of decision-making processes relevant to the energy use in buildings towards increased sustainability. Our data of approximately 270 participants from the UK show that one can increase the willingness to pay more for an energy-efficient home by offering it as default quote (medium effect), raise awareness of greenhouse gas emissions in buildings by framing (small effects), and increase the proportion of decision-makers who choose a more energy efficient target option by the use of a decoy (small effects). On the other hand, we were not able to support the hypothesis that we can increase the willingness to pay more for a solar system by anchoring the decision-makers with past prices. These results promote the identification of pathways to an optimised building design process using choice architecture, which may help to create more energy-efficient and sustainable buildings. They can also help to “leverage” the introduction and uptake of novel sustainable building technology by removing cognitive barriers. Since cognitive biases have scarcely been studied in buildings so far, our findings significantly increase the available “toolbox” for such an endeavour.
On a more theoretical level, this study further deconstructs the tacit assumption that building professionals and building owners behave rationally, simply optimising the financial outcome within given boundary conditions: homo faber is not the homo economicus.
Our findings constitute a basis for further studies with building professionals or homeowners entailing real financial consequences. It is important to assess how our findings translate to decision processes in the field, if effect sizes will be different, and if the decision scenarios need to be adapted for these contexts. Ideally, this will be done in collaboration with architectural offices or building companies. On the other hand, this study indicates that choice architecture theory could also be applied to other developments in the built environment. For example, there are many behavioural and decision barriers in implementing the principles of circular economy for buildings, or one can focus on studying the promotion of CO-neutral materials.
In summary, we have shown that cognitive biases in the building context can be used to support the exploitation of already available and economically feasible technological solutions by encouraging people to make more sustainable choices.
Author Contributions
Conceptualisation, J.W.; formal analysis, M.R.; investigation, M.R.; methodology, M.R. and J.W.; project administration, J.W.; visualisation, M.R.; writing, M.R. and J.W. Both authors have read and agreed to the published version of the manuscript.
Funding
This research received no external funding.
Institutional Review Board Statement
Ethical review and approval were waived for this study, since there were no ethical concerns and all data was collected anonymously.
Informed Consent Statement
Informed consent was obtained from all participants involved in the study.
Data Availability Statement
The data and the R-code for the analysis presented in this study are openly available on Zenodo at 10.5281/zenodo.5148530.
Acknowledgments
We would like to thank our colleagues from the Laboratory for Building Energy Materials and Components at Empa for their participation in a pilot experiment for this study and for helpful comments on the study design and data interpretation. We thank Karin Reitermayr of Empa for her help screening for any ethical issues and for suggesting the online platform we used. In addition, we are grateful to Lucas Kook from ETH Zürich for the discussions on data analysis.
Conflicts of Interest
The authors declare no conflict of interest.
Abbreviations
The following abbreviations are used in this manuscript:
| HVAC | heating, ventilation, air conditioning |
| CRT | cognitive reflection test |
| GGE | greenhouse gas emissions |
| CI | confidence interval |
| VC | vacuum cleaner |
Appendix A. Demographics
In this appendix, we provide additional tables and figures on the demographic information of the survey participants.

Table A1.
Homeowner and student status of the 271 participants.
| Yes | No | Prefer Not to Say | Data Expired | |
|---|---|---|---|---|
| Home owner | 110 | 160 | 1 | - |
| Student status | 64 | 205 | 0 | 2 |
Figure A1.
The age distribution of the 271 survey participants. Participants had a mean age of 34 with standard deviation 12.
Figure A1.
The age distribution of the 271 survey participants. Participants had a mean age of 34 with standard deviation 12.

Figure A2.
The counts of the highest education of the 271 survey participants.

Figure A3.
The counts of the gross household income of the 271 survey participants.

Appendix B. Survey Questions
In this appendix, the survey questions for each cognitive bias studied are presented in table format. The text that participants saw is presented in normal font, with additional information presented in italics.
Table A2.
Questions for hypothesis on framing effect.
| Group A (Focus on Buildings) | Group B (Focus on other Sectors) |
|---|---|
| Approximately one quarter of EU greenhouse gas emission are emitted due to the construction and operation of buildings, the rest are emitted in other sectors such as industry and mobility. | Approximately three quarters of EU greenhouse gas emission are emitted in sectors such as industry and mobility that are not associated with buildings, the rest are emitted due to the construction and operation of buildings. |
| Based on the text above, which of the following problem areas do you think is most important for the EU today? | |
| To answer the question, the participants had to rank eight options based on their personal importance. The eight options were: Greenhouse gas emissions in buildings, Greenhouse gas emissions in mobility, Greenhouse gas emissions in industry, Health care, Education system, Poverty, Economy, and Terrorism. | |
| Based on the text above, should government policy focus strongly on incentives to reduce greenhouse gas emissions in buildings? | |
| To answer the question the participants had to choose between: Strongly agree, Somewhat agree, Neither agree nor disagree, Somewhat disagree, and Strongly disagree. | |
Table A3.
Questions for hypothesis on the anchoring effect.
| Group A (High Anchor) | Group B (Low Anchor) |
|---|---|
| Solar systems provide electricity from sunlight and are installed on the roof or the facade of buildings. The power of a system (i.e., its number of kW) depends on the size of the solar panels; larger panels are more expensive but also provide more electricity for the building’s inhabitants. To cover the electricity demand of a 3-bedroom house, usually a 4 kW solar system is needed. In the last decades, the cost of solar systems have dropped significantly. | |
| A few years ago, a 4 kW solar system cost around £20,000, whereas the price for the same system today is around £6000, with some offers being cheaper and some more expensive, depending on the contractor that sells the system. Assume you would like to have such a system installed in the building you live in, how much would you be willing to spend? | A few years ago, a 4 kW solar system cost around £7500, whereas the price for the same system today is around £6000, with some offers being cheaper and some more expensive depending on the contractor that sells the system. Assume you would like to have such a system installed in the building you live in, how much would you be willing to spend? |
| To answer the question, participants had to fill in a numeric value in pounds. | |
Table A4.
Questions for hypothesis on default effect part 1.
| Group A (Less Energy-Efficient Default) | Group B (Energy Efficient Default) |
|---|---|
| Imagine you are planning to have a house built for yourself to live in. You have already saved a significant amount of money for a down-payment for the plot and the built. You have decided on the size and floor plan of your new home together with a building contractor who will build the house for you: a four bedroom house with about 140 m floor area. To finalise the planning process, you need to decide about some technical choices that will determine the final cost of your house and how much energy it will use. | |
Your building contractor is very cost conscious and presents you with a quote for a house with only the necessary energy technology. Like that, the house will feature the following:
| Your building contractor is very energy conscious and presents you with a quote for a house that adheres to an excellent energy standard, taking into account the latest state-of-the-art technology. Like that, the house will feature the following:
|
| Based on the text above, please rate how attractive you find the initial quote. | |
| To answer the question, participants had to choose between: Extremely attractive, Very attractive, Moderately attractive, Slightly attractive, Not at all attractive, Prefer not to say. | |
Table A5.
Questions for hypothesis on default effect part 2.
| Group A (Less Energy-Efficient Default) | Group B (Energy Efficient Default) |
|---|---|
| As your building contractor knows that maybe you would like to have a more energy-efficient home, he adds to the quote how much the cost would be increased if you chose to substitute these basic features for more energy efficient but also more expensive options. These, in turn, will lead to lower energy bills later as the house will be more energy efficient. | As your building contractor knows that this configuration is on the upper end of your budget expectations, he adds to the quote how much the cost would be reduced if you chose to substitute these energy efficient features for less energy efficient but cheaper options. These, in turn, will lead to higher energy bills later as the house will be less energy efficient. |
Please indicate if you would like to substitute any of the basic energy features to make the quote more attractive for you personally by ticking the box next to the feature.
| Please indicate if you would like to substitute any of the energy efficient features to make the quote more attractive for you personally by ticking the box next to the feature.
|
| To answer the question, the options above were presented as multiple choice answer, where participants had to mark their adaptions. | |
| Please rate how attractive you find the adapted quote with the total cost and the features that you may have changed above. | |
| To answer the question, participants had to choose between: Extremely attractive, Very attractive, Moderately attractive, Slightly attractive, Not at all attractive, Prefer not to say. | |
Table A6.
Questions for hypothesis on the decoy effect for the fridge and vacuum cleaner.
| Question | Answer Options |
|---|---|
| Fridges are classified into official energy classes A+++, A++, A+, A, B, C, and D, where A+++ has the lowest electricity consumption and D has the highest consumption. Assume that the following mentioned fridges are the same apart from the energy class and price (e.g., same looks, functionality, etc.) |
|
| Assume the mentioned vacuum cleaners are the same apart from their electricity consumption and their price (e.g., clean equally well, same weight, same looks, etc.). Higher electricity consumption has a greater impact on the environment. If you wanted to buy a new vacuum cleaner for your home and based on the text above, which of the following would you rather buy? |
|
References
- De Wit, M.; Hoogzaad, J.; von Daniels, C. The Circularity Gap Report; Technical Report; Circle Economy: Amsterdam, The Netherlands, 2020. [Google Scholar]
- Koebel, M.M.; Wernery, J.; Malfait, W.J. Energy in buildings—Policy, materials and solutions. MRS Energy Sustain. 2017, 4, 1–24. [Google Scholar] [CrossRef] [Green Version]
- Martin, L.; Perry, F. Chapter 11—Sustainable Construction Technology Adoption. In Sustainable Construction Technologies; Butterworth-Heinemann: Oxford, UK, 2019; pp. 299–316. [Google Scholar] [CrossRef]
- Schultz, P.W.; Nolan, J.M.; Cialdini, R.B.; Goldstein, N.J.; Griskevicius, V. The Constructive, Destructive, and Reconstructive Power of Social Norms. Psychol. Sci. 2007, 18, 429–434. [Google Scholar] [CrossRef] [PubMed] [Green Version]
- Shealy, T.; Johnson, E.; Weber, E.; Klotz, L.; Applegate, S.; Ismael, D.; Bell, R.G. Providing descriptive norms during engineering design can encourage more sustainable infrastructure. Sustain. Cities Soc. 2018, 40, 182–188. [Google Scholar] [CrossRef]
- Gigerenzer, G.; Goldstein, D.G. Reasoning the fast and frugal way: Models of bounded rationality. Psychol. Rev. 1996, 103, 650–669. [Google Scholar] [CrossRef] [Green Version]
- Jones, B.D. Bounded rationality. Annu. Rev. Political Sci. 1999, 2, 297–321. [Google Scholar] [CrossRef]
- Kahneman, D. A Perspective on Judgment and Choice: Mapping Bounded Rationality. Am. Psychol. 2003, 58, 697–720. [Google Scholar] [CrossRef] [PubMed] [Green Version]
- Thaler, R. Toward a positive theory of consumer choice. J. Econ. Behav. Organ. 1980, 1, 39–60. [Google Scholar] [CrossRef]
- Kahneman, D.; Knetsch, J.L.; Thaler, R.H. Experimental Tests of the Endowment Effect and the Coase Theorem. J. Political Econ. 1990, 98, 1325–1348. [Google Scholar] [CrossRef] [Green Version]
- Christie, L.; Donn, M.; Walton, D. The ‘apparent disconnect’ towards the adoption of energy-efficient technologies. Build. Res. Inf. 2011, 39, 450–458. [Google Scholar] [CrossRef]
- Klotz, L.; Weber, E.; Johnson, E.; Shealy, T.; Hernandez, M.; Gordon, B. Beyond rationality in engineering design for sustainability. Nat. Sustain. 2018, 1, 10. [Google Scholar] [CrossRef]
- Klotz, L.; Mack, D.; Klapthor, B.; Tunstall, C.; Harrison, J. Unintended anchors: Building rating systems and energy performance goals for U.S. buildings. Energy Policy 2010, 38, 3557–3566. [Google Scholar] [CrossRef]
- Shealy, T.; Klotz, L.; Weber, E.U.; Johnson, E.J.; Bell, R.G. Using Framing Effects to Inform More Sustainable Infrastructure Design Decisions. J. Constr. Eng. Manag. 2016, 142, 04016037. [Google Scholar] [CrossRef] [Green Version]
- Ebeling, F.; Lotz, S. Domestic uptake of green energy promoted by opt-out tariffs. Nat. Clim. Chang. 2015, 5, 868–871. [Google Scholar] [CrossRef]
- Harris, N.; Shealy, T.; Parrish, K.; Granderson, J. Cognitive barriers during monitoring-based commissioning of buildings. Sustain. Cities Soc. 2019, 46, 101389. [Google Scholar] [CrossRef] [Green Version]
- Hancock, P.; Klotz, L.; Shealy, T.; Johnson, E.; Weber, E.; Stenger, K.; Vuppuluri, R. Future tense can reduce present bias in infrastructure design. Preprint 2021. [Google Scholar] [CrossRef]
- Blasch, J.; Daminato, C. Behavioral Anomalies and Energy-related Individual Choices: The Role of Status-quo Bias. Energy J. 2020, 41, 181–214. [Google Scholar] [CrossRef]
- Delgado, L.; Shealy, T. Opportunities for greater energy efficiency in government facilities by aligning decision structures with advances in behavioral science. Renew. Sustain. Energy Rev. 2018, 82, 3952–3961. [Google Scholar] [CrossRef]
- Schubert, C. Green nudges: Do they work? Are they ethical? Ecol. Econ. 2017, 132, 329–342. [Google Scholar] [CrossRef] [Green Version]
- Tversky, A.; Kahneman, D. The framing of decisions and the psychology of choice. Science 1981, 211, 453–458. [Google Scholar] [CrossRef] [Green Version]
- Tversky, A.; Kahneman, D. Judgment under Uncertainty: Heuristics and Biases. Science 1974, 185, 1124–1131. [Google Scholar] [CrossRef]
- Johnson, E.J.; Goldstein, D.G. Do Defaults Save Lives? Science 2003, 302, 1338–1339. [Google Scholar] [CrossRef] [Green Version]
- Jachimowicz, J.M.; Duncan, S.; Weber, E.U.; Johnson, E.J. When and why defaults influence decisions: A meta-analysis of default effects. Behav. Public Policy 2019, 3, 159–186. [Google Scholar] [CrossRef]
- Huber, J.; Payne, J.W.; Puto, C. Adding Asymmetrically Dominated Alternatives: Violations of Regularity and the Similarity Hypothesis. J. Consum. Res. 1982, 9, 90–98. [Google Scholar] [CrossRef]
- LimeSurvey GmbH. LimeSurvey: An Open Source Survey Tool; LimeSurvey GmbH: Hamburg, Germany, 2003. [Google Scholar]
- Prolific. Prolific: Online Participant Recruitment for Surveys and Market Research; Prolific: Oxford, UK, 2014. [Google Scholar]
- Peer, E.; Brandimarte, L.; Samat, S.; Acquisti, A. Beyond the Turk: Alternative platforms for crowdsourcing behavioral research. J. Exp. Soc. Psychol. 2017, 70, 153–163. [Google Scholar] [CrossRef] [Green Version]
- Palan, S.; Schitter, C. Prolific.ac—A subject pool for online experiments. J. Behav. Exp. Financ. 2018, 17, 22–27. [Google Scholar] [CrossRef]
- R Core Team. R: A Language and Environment for Statistical Computing; R Foundation for Statistical Computing: Vienna, Austria, 2021. [Google Scholar]
- Hardisty, D.J.; Johnson, E.J.; Weber, E.U. A Dirty Word or a Dirty World? Attribute Framing, Political Affiliation, and Query Theory. Psychol. Sci. 2010, 21, 86–92. [Google Scholar] [CrossRef] [PubMed]
- Green Business Watch. UK Domestic Solar Panel Costs and Returns 2019. Available online: https://greenbusinesswatch.co.uk/uk-domestic-solar-panel-costs-and-returns-2019 (accessed on 29 April 2021).
- Duchon, D.; Dunegan, K.; Barton, S. Framing the problem and making decisions: The facts are not enough. IEEE Trans. Eng. Manag. 1989, 36, 25–27. [Google Scholar] [CrossRef] [Green Version]
- Song, J.D.; Ahn, Y.H. Cognitive Bias in Emissions Trading. Sustainability 2019, 11, 1365. [Google Scholar] [CrossRef] [Green Version]
Figure 1.
Ranking of the importance of GGE from buildings among eight topics for group A (building focus, red) and B (focus on other sectors, turquoise).
Figure 1.
Ranking of the importance of GGE from buildings among eight topics for group A (building focus, red) and B (focus on other sectors, turquoise).

Figure 2.
Rating of the importance of policy incentives to reduce GGE from buildings in group A (building focus, red) and B (focus on other sectors, turquoise).
Figure 2.
Rating of the importance of policy incentives to reduce GGE from buildings in group A (building focus, red) and B (focus on other sectors, turquoise).

Figure 3.
Total number of adjustments to the initial quote in group A (less energy-efficient default, red) and B (energy-efficient default, turquoise).
Figure 3.
Total number of adjustments to the initial quote in group A (less energy-efficient default, red) and B (energy-efficient default, turquoise).

Figure 4.
The satisfaction of the initial (dark blue, khaki) and the adapted (dark gray, yellow) quote for group A (less energy-efficient default, top) and B (energy-efficient default, bottom).
Figure 4.
The satisfaction of the initial (dark blue, khaki) and the adapted (dark gray, yellow) quote for group A (less energy-efficient default, top) and B (energy-efficient default, bottom).

Figure 5.
Total number of choices for the different fridge models in group A (no decoy, red) and B (decoy, turquoise).
Figure 5.
Total number of choices for the different fridge models in group A (no decoy, red) and B (decoy, turquoise).

Figure 6.
Total number of choices for the different vacuum cleaner models in group A (no decoy, red) and B (decoy, turquoise).
Figure 6.
Total number of choices for the different vacuum cleaner models in group A (no decoy, red) and B (decoy, turquoise).

Table 1.
Price in £ the participants were willing to pay for a 4 kW solar system.
| Minimum | 1th Quantile | Median | Mean | 3rd Quantile | Maximum | |
|---|---|---|---|---|---|---|
| Group A (high anchor) | 0 | 4000 | 5000 | 5048 | 6000 | 10,000 |
| Group B (low anchor) | 0 | 3500 | 5000 | 4643 | 6000 | 8000 |
Table 2.
Total cost in £ the participants were willing to pay for their house after their own adaptations.
Table 2.
Total cost in £ the participants were willing to pay for their house after their own adaptations.
| Minimum | 1th Quantile | Median | Mean | 3rd Quantile | Maximum | |
|---|---|---|---|---|---|---|
| Group A (less energy-efficient default) | 409,000 | 416,500 | 422,750 | 422,879 | 429,000 | 436,500 |
| Group B (energy-efficient default) | 409,000 | 424,000 | 426,500 | 428,030 | 435,750 | 436,500 |
Table 3.
Summary of the four alternative hypothesis main effects with p-values and with Cohen’s d, h, and Pearson r.
Table 3.
Summary of the four alternative hypothesis main effects with p-values and with Cohen’s d, h, and Pearson r.
| Effect Size | p-Value | |||
|---|---|---|---|---|
| Framing effect | Ranking | small | * | |
| Rating | small | * | ||
| Anchor effect | small | |||
| Default effect | medium | <0.001 *** | ||
| Decoy effect | Fridge | small | ** | |
| VC | small | * | ||
| small effect | ||||
| medium effect | ||||
| large effect | ||||
* , ** , *** .
Publisher’s Note: MDPI stays neutral with regard to jurisdictional claims in published maps and institutional affiliations. |
© 2021 by the authors. Licensee MDPI, Basel, Switzerland. This article is an open access article distributed under the terms and conditions of the Creative Commons Attribution (CC BY) license (https://creativecommons.org/licenses/by/4.0/).
Share and Cite
MDPI and ACS Style
Rakitta, M.; Wernery, J. Cognitive Biases in Building Energy Decisions. Sustainability 2021, 13, 9960. https://0-doi-org.brum.beds.ac.uk/10.3390/su13179960
AMA Style
Rakitta M, Wernery J. Cognitive Biases in Building Energy Decisions. Sustainability. 2021; 13(17):9960. https://0-doi-org.brum.beds.ac.uk/10.3390/su13179960
Chicago/Turabian StyleRakitta, Maic, and Jannis Wernery. 2021. "Cognitive Biases in Building Energy Decisions" Sustainability 13, no. 17: 9960. https://0-doi-org.brum.beds.ac.uk/10.3390/su13179960
Note that from the first issue of 2016, this journal uses article numbers instead of page numbers. See further details here.