Knowledge, Awareness, and Attitudes toward Tsunamis: A Local Survey in the Southern Coast of Iran


1
Graduate Program in Sustainability Science-Global Leadership Initiative, Graduate School of Frontier Sciences, The University of Tokyo, Kashiwa, Chiba 277-8563, Japan
2
Department of Socio-Cultural Environmental Studies, Graduate School of Frontier Sciences, The University of Tokyo, Kashiwa, Chiba 277-8563, Japan
*
Author to whom correspondence should be addressed.
Sustainability 2021, 13(2), 449; https://0-doi-org.brum.beds.ac.uk/10.3390/su13020449
Submission received: 8 November 2020
/
Revised: 1 January 2021
/
Accepted: 3 January 2021
/
Published: 6 January 2021
(This article belongs to the Section Hazards and Sustainability)
Abstract
:In regions with low tsunami risk probability, mitigation plans are unlikely to resonate with residents. Empirical data regarding people’s knowledge, awareness, and attitudes about tsunamis represent a keystone for better risk management and improved disaster preparedness. This study evaluated these factors on the southern coast of Iran, Makran, by conducting a field survey. The results presented in this paper indicate a low level of awareness and willingness to evacuate among residents and a low level of trust in the government in regard to risk management. Moreover, the results show a significant religious attribution affecting respondents’ risk perception and evacuation behavior that, along with the aforementioned factors, increases residents’ vulnerability. Based on our findings, we provide some recommendations to help policymakers understand how to shape mitigation and evacuation plans such that they will become more evidence-based, sensitive, informed, and cost-effective.
1. Introduction
Currently, as the population continues to increase, so does the number of people living in regions threatened by natural hazards without strong risk awareness. Tsunamis are a representative natural threat and often lead to significant population death tolls, in addition to causing vast destruction, poverty, and homelessness. Specifically, in developing countries, devastating natural hazards, such as tsunamis, can cause a sudden shock in their development process, and recovery is typically very costly and arduous. Hence, proper planning for and management of natural hazards is essential [1].
Historically, Iran has been affected by several tsunamis. The most significant one occurred in 1945 in the Makran subduction zone (MSZ), causing 4000 casualties in the southern coasts of Iran and Pakistan [2]. Notably, coastal hazards are relatively infrequent in Iran, which can lead to a false sense of safety among community leaders and residents. This makes the MSZ more vulnerable and less resilient to unexpected natural disaster incidents. However, considering tsunami hazard assessments, Makran is one of the least-studied regions globally. In this regard, more research is needed in the MSZ because potential damages can be efficiently minimized by sufficient preparation. Several studies have been conducted in Makran to simulate tsunami waves, illustrate inundation areas [3,4], and predict possible scenarios for future tsunami events [5,6]. These studies mainly focused on the physical nature of the hazard; however, socioeconomic factors play a prominent role regarding the concept of sustainable risk management.
There are two rather different approaches for increasing coastal resilience against hazards (be it a tsunami or storm surge): hard and soft measures (according to the United Nations International Strategy for Disaster Reduction (UNISDR), soft measures (or nonstructural measures) are defined as “any measures not involving physical construction that uses knowledge, practice, or agreement to reduce risk and impacts, in particular through policies and laws, public awareness raising, training, and education” [7]). After a coastal hazard, there is typically a significant drive to construct or improve hard measures in highrisk areas. However, an over-reliance on engineering construction, that is, hard measures alone, can still lead to mass casualties, as the at-risk population neglects self-protection strategies. One notable example is the 2011 Tohoku tsunami, specifically in the Taro District [8]. Furthermore, designing and implementing hard measures is costly without being particularly efficient at damage prevention. Despite the expensive exercises for preventing, predicting, and protecting vulnerable communities in the United States against natural hazards, people have still faced staggering helplessness [9]. Hence, the importance of soft measures should also be considered to minimize vulnerability and be studied more extensively. Accordingly, cost–benefit and sustainable disaster management analyses should be applied in developing countries, such as Iran, where the budget for developing hard measures is limited.
One of the most formidable contemporary challenges facing disaster preparedness is how concepts and methods of soft measures are applied. The first step in this process is to assess local awareness, knowledge, perception, and willingness to evacuate, which we discuss later in this paper.
To propose optimal mitigation and education measures, a disaster communication and education strategy must acknowledge heterogeneity in community characteristics [10]. Accordingly, the present work sheds light on the aforementioned problems in an understudied geographical region—Makran—and thus expands upon empirical evidence. Furthermore, this research contributes to the literature in two ways. First, it questions issues that have received little attention in previous research. Second, it applies prominent factors, extracted from the literature, to address people’s knowledge, awareness, perception, and attitudes about tsunamis. Understanding these factors can facilitate the development of effective mitigation strategies that may lead to an increase in resilience. Moreover, these strategies may be scalable, thus being able to reach more residents with lower costs and effort, which is beneficial considering the limited budget available in the MSZ. Finally, we propose possible mitigation measures and a number of recommendations to improve risk management.
2. Literature Review
2.1. Risk Knowledge and Awareness
Generally, awareness and knowledge influence disaster preparedness. Awareness has been defined as the extent to which people think and talk about a specific hazard [11]. Tavares et al. [12] concluded that awareness depends on general knowledge of locals and their access to sources of information. However, as pointed out by Esteban et al. [13], awareness of local residents about natural hazards is obviously location-specific and depends on various factors, including culture, education, and policies. All these factors were separately targeted in different vulnerable areas with different natural hazards, e.g., typhoons [14], hurricanes [15], and floods [16]. Tsunamis have received less attention compared to other disaster types. Some studies established the level of community awareness about tsunamis in different tsunami-prone areas, e.g., [17,18]. Other studies on knowledge, awareness, and attitudes have been carried out in Trinidad and Tobago [19], Vietnam [20,21], Japan [22,23,24,25], and Samoa [26]. The authors of [18] investigated factors in Chile, Japan, and Indonesia that can reflect the degree of awareness at the authority, institution, or citizen levels. Ref. [27] established the level of community awareness about tsunamis through a community mapping exercise in Chile. Some studies have further analyzed awareness and proposed new directions for tsunami mitigation and evacuation [28,29,30]. For example, the idea conceptualized by Ref. [31] shows how a given event can very quickly raise awareness; however, this increased awareness often fades with each successive generation. Hence, repeated education and regular evacuation drills by local governments [32], as well as storytelling across generations, may maintain this level of awareness [33].
Global awareness of risks associated with tsunamis has been increased due to the large number of events that have taken place since the 2004 Indian Ocean tsunami, the 2010 Samoa and Chile tsunamis, and the 2011 Tohoku earthquake tsunami [34]. Partially owing to the high death tolls and destruction following these events, a conception of “tsunami culture” has developed in communities who have been affected by tsunamis. Moreover, the immediate broadcasting and mass media awareness following tsunamis have impacted areas that are not often affected by such events. All studies typically report an increase in tsunami awareness and knowledge. However, there is likely an upper bound regarding how much awareness mass media can promote in areas without frequent tsunami experiences. In addition, the uniqueness of each community’s characteristics as well as cultural and local factors play important roles in the context of awareness and knowledge. Remarkably, our study area—the MSZ—meets these conditions and provides an untouched case study to be further investigated.
2.2. Perception and Attitude
Although various factors related to the physics of tsunamis (e.g., arrival time and magnitude) largely dictate impact, knowledge and awareness affect a community’s vulnerability. The role of other factors, such as psychological (socio-cognitive) processes, culture, and personality are crucial, yet remain poorly understood. During the 2011 Tohoku earthquake and tsunami disaster, in some areas, only 57% of residents evacuated immediately [35], although regular drills were conducted and education regarding awareness and general knowledge was relatively high.
Pidgeon et al. [36] defines risk perception as “people’s beliefs, attitudes, judgment, and feelings, as well as the broader social or cultural values that people adopt against risks”. Risk perception can be considered as a cognitive process capable of guiding people’s behavior in ordinary activities with the aim of reducing the impact of uncertain events. Many aspects—namely psychological and cultural factors, which are often correlated—can influence perception assessment.
The importance of risk perception has been suggested for evacuation behavior in the literature; however, empirical data are lacking [37]. Recently, some studies have been conducted on the reasons influencing failure/success in evacuation in tsunami-affected areas [37,38,39], as well as identifying factors related to willingness (intention) to evacuate by considering a hypothetical scenario in areas not affected by tsunamis. People’s memories of previous events (experience), normalcy bias, (normalcy bias is a tendency to underestimate the risk of a hazard that has been warned about, which affects appropriate evacuation) belief systems, excessive reliance on infrastructure and warning systems, trust, and aging societies (demographic factors) have been considered the main factors causing evacuation failure [40,41]. Other studies have been conducted on the willingness of specific groups (e.g., older [42] and tourist [43,44] populations) to evacuate.
Considering evacuation behavior, tsunami events and areas without frequent tsunami experiences tend to be poorly studied in the literature. In particular, to the best of our knowledge, no studies have been conducted in the MSZ regarding this topic.
3. Methodology
To investigate the aforementioned issues in Makran, a mixed-methodology approach was utilized, including a questionnaire survey and interviews among local residents and beach users. In addition, we conducted three focus group discussions (FGDs) to have further discussion on the findings derived from the questionnaire survey and interview results.
3.1. Study Area
The study area is the Makran coast, which is located on the southeastern coast of Iran and southern coast of Pakistan. This area extends east from the Strait of Hormoz to Onch-nal in Pakistan. Owing to its unique geographical location (it is the closest and best access point to the open sea for land-locked countries, e.g., Uzbekistan, Afghanistan, and Mongolia; moreover, Makran is one of the most important routes of the east–west corridor), the government approved a strategic plan for the development of the southern Makran coast on 26 December, 2016 named “Makran sustainable development”, and announced Chabahar—the most populated city in Makran—a free economic zone. It should be considered that, historically, Makran has been affected by tsunamis; the most disastrous event occurred in 1945, with 4000 casualties in Iran and Pakistan. Based on the latest report of the UNISDR [45], there is no risk management framework in Makran. Thus, any type of study regarding this subject would be of great importance for developing an optimal tsunami management framework.
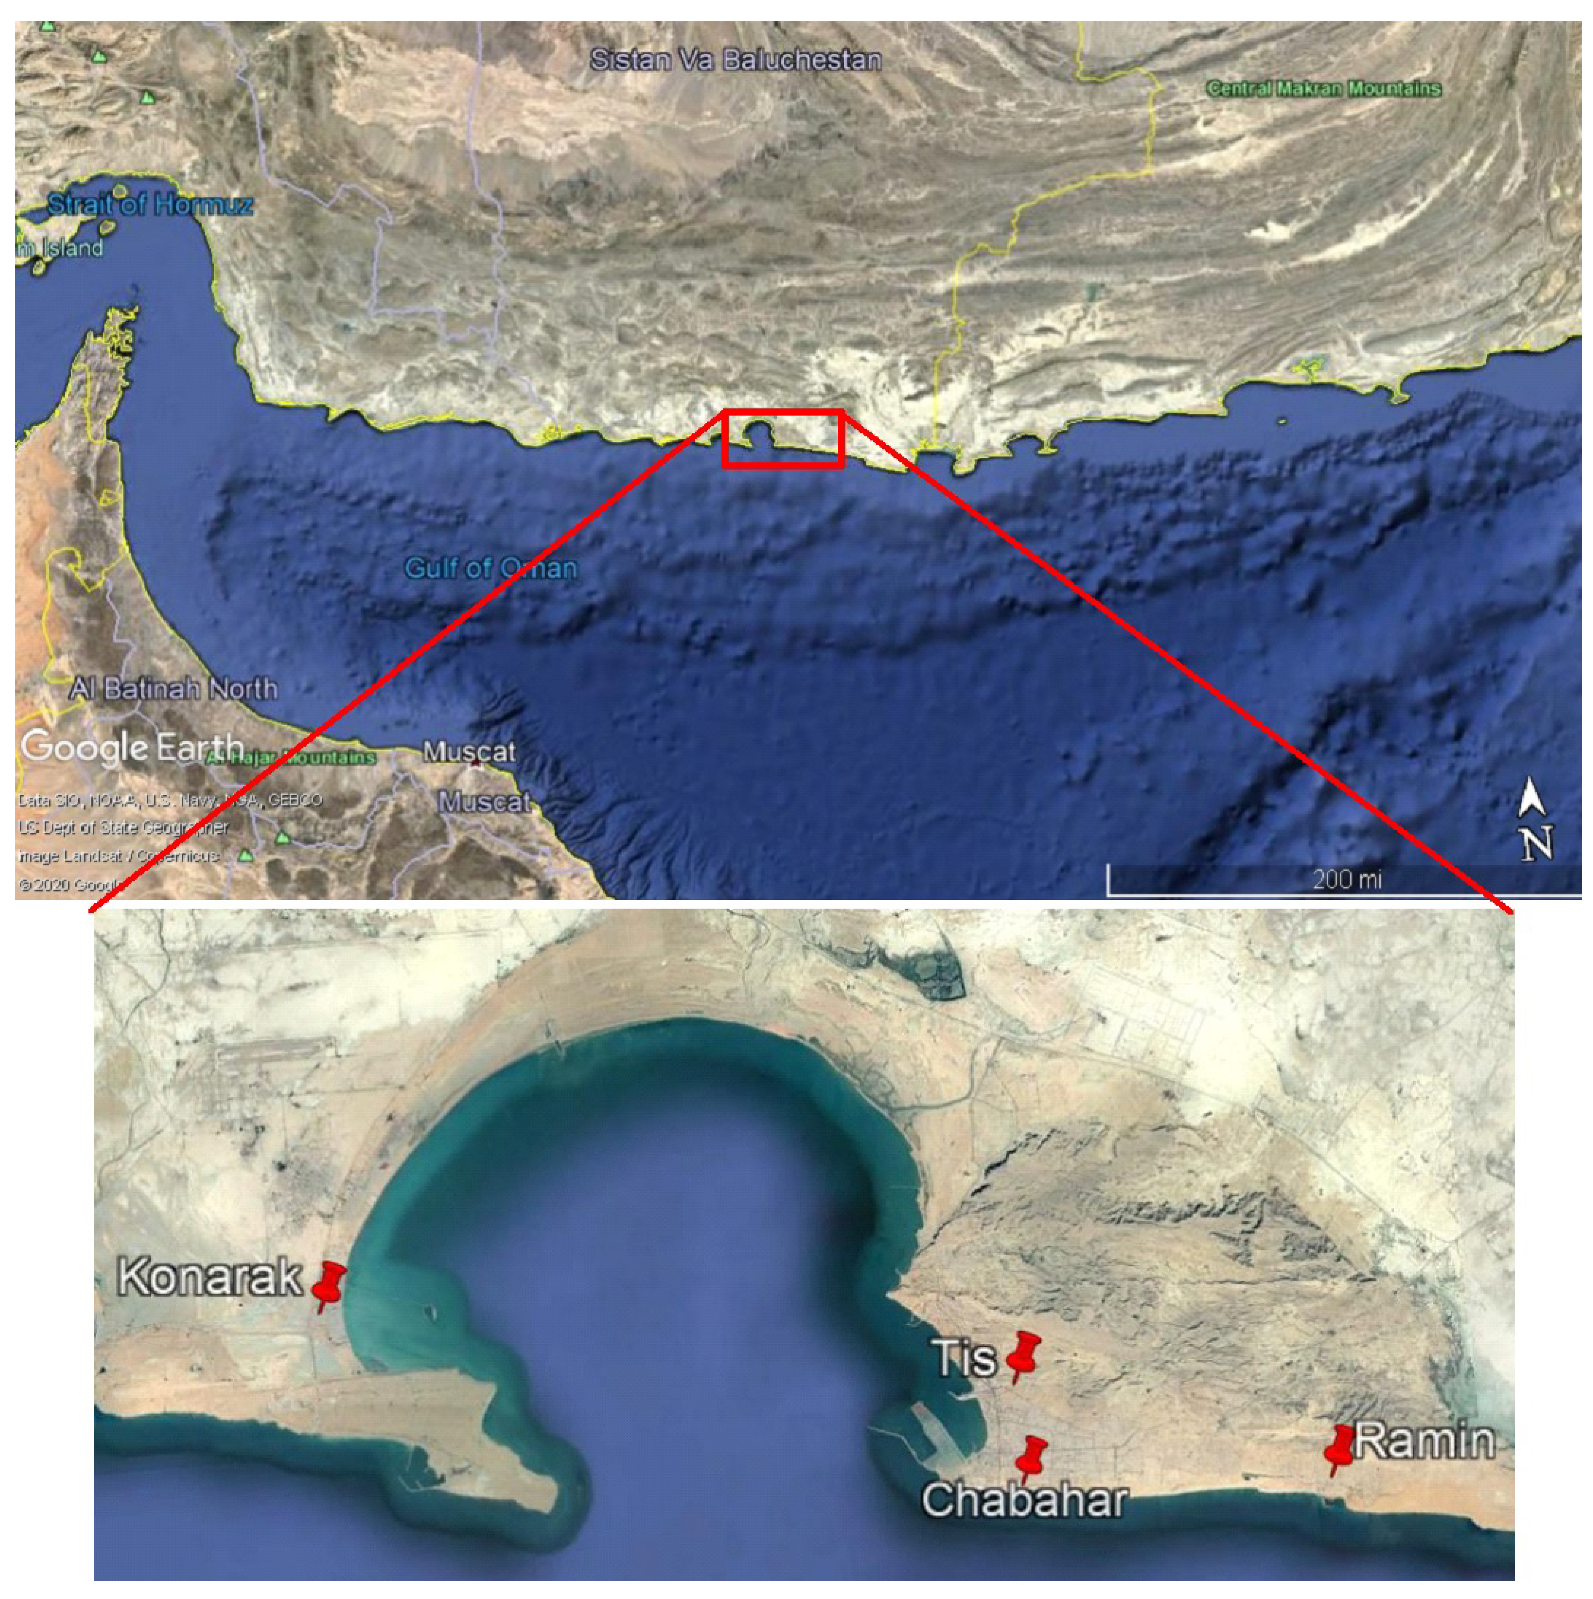
Notably, more than of the population living on the Iranian side of the Makran coast is in rural areas, which is a significant deviation from the country’s norm ( urban population). Hence, a combination of urban and rural locations was selected to obtain a more accurate representation of the population. Accordingly, four locations were selected: Chabahar and Konarak, two densely populated coastal cities, and Ramin and Tis, two rural areas (Figure 1) located within the Sistan and Baluchestan Provinces of Iran. Table 1 shows the gender ratio of the population in each area. According to the latest census data [46], Chabahar is the most populated city along the Makran coast (population: 283,204), followed by Konarak (population: 82,000), which is located close to Chabahar, and the populations of Tis and Ramin are 6348 and 3821, respectively.
Most of the population is Sunni Muslim (Shia and Sunni are the two major denominations of Islam). None of the evaluated areas had experienced a major coastal hazard, specifically a tsunami, in the last 75 years (the last significant tsunami in the area occurred in 1945). However, it is important to note that in the worst-case tsunami scenario, the study areas would be inundated [6].
3.2. Questionnaire
As Van den Akker [47] suggested, some typical steps were taken, including a systematic literature review and expert consultation. Questions were distributed to six disaster resilience experts from Iran via email, and their comments were applied to the questionnaire (see Lawshe’s table [48]). In addition, the questionnaire was initially pretested with 10 residents through face-to-face interviews. Generally, this pilot phase is useful for detecting the suitability, comprehensibility, and amount of time that is needed for filling in the questionnaire. Our modified questionnaire covered the following topics: knowledge, experience, awareness, trust, evacuation behavior, and socio-demographic characteristics (age, income, gender, occupation, religion, insurance status, and education).
3.3. Sampling and Analysis
The survey was conducted using various convenience sampling methods at the four study sites from 10–30 September, 2018. The survey was conducted at different times of day throughout the week to obtain a better distribution of samples. For Chabahar, a random sampling method was used, and questionnaires were administrated by two trained enumerators. In total, 153 valid questionnaires were collected. In Konarak, random spatial sampling method was employed using GPS to select households in the tsunami-prone area. Due to the availability of respondents, 45 households were surveyed. In Tis and Ramin, owing to the relatively low level of education, face-to-face surveys were conducted, and 24 households (12 in each) were interviewed. In addition, three FGDs (taking approximately 3 h and 45 min in total) were held at three main fishery ports, namely Beris, Ramin, and Shahid Beheshty. The participants were fishers and beach users. Data collected from the FGDs were transcribed from the audio recordings, and code analysis was performed for the suitability of the study. These data are summarized in Table 2. Finally, in addition to tabulating the results using descriptive statistics, chi-squared tests and analysis of variance (ANOVA) were performed to analyze the significance of the relationship between various variables by employing the scipy.stats package in Python.
4. Results
4.1. Demographic Profile of Respondents
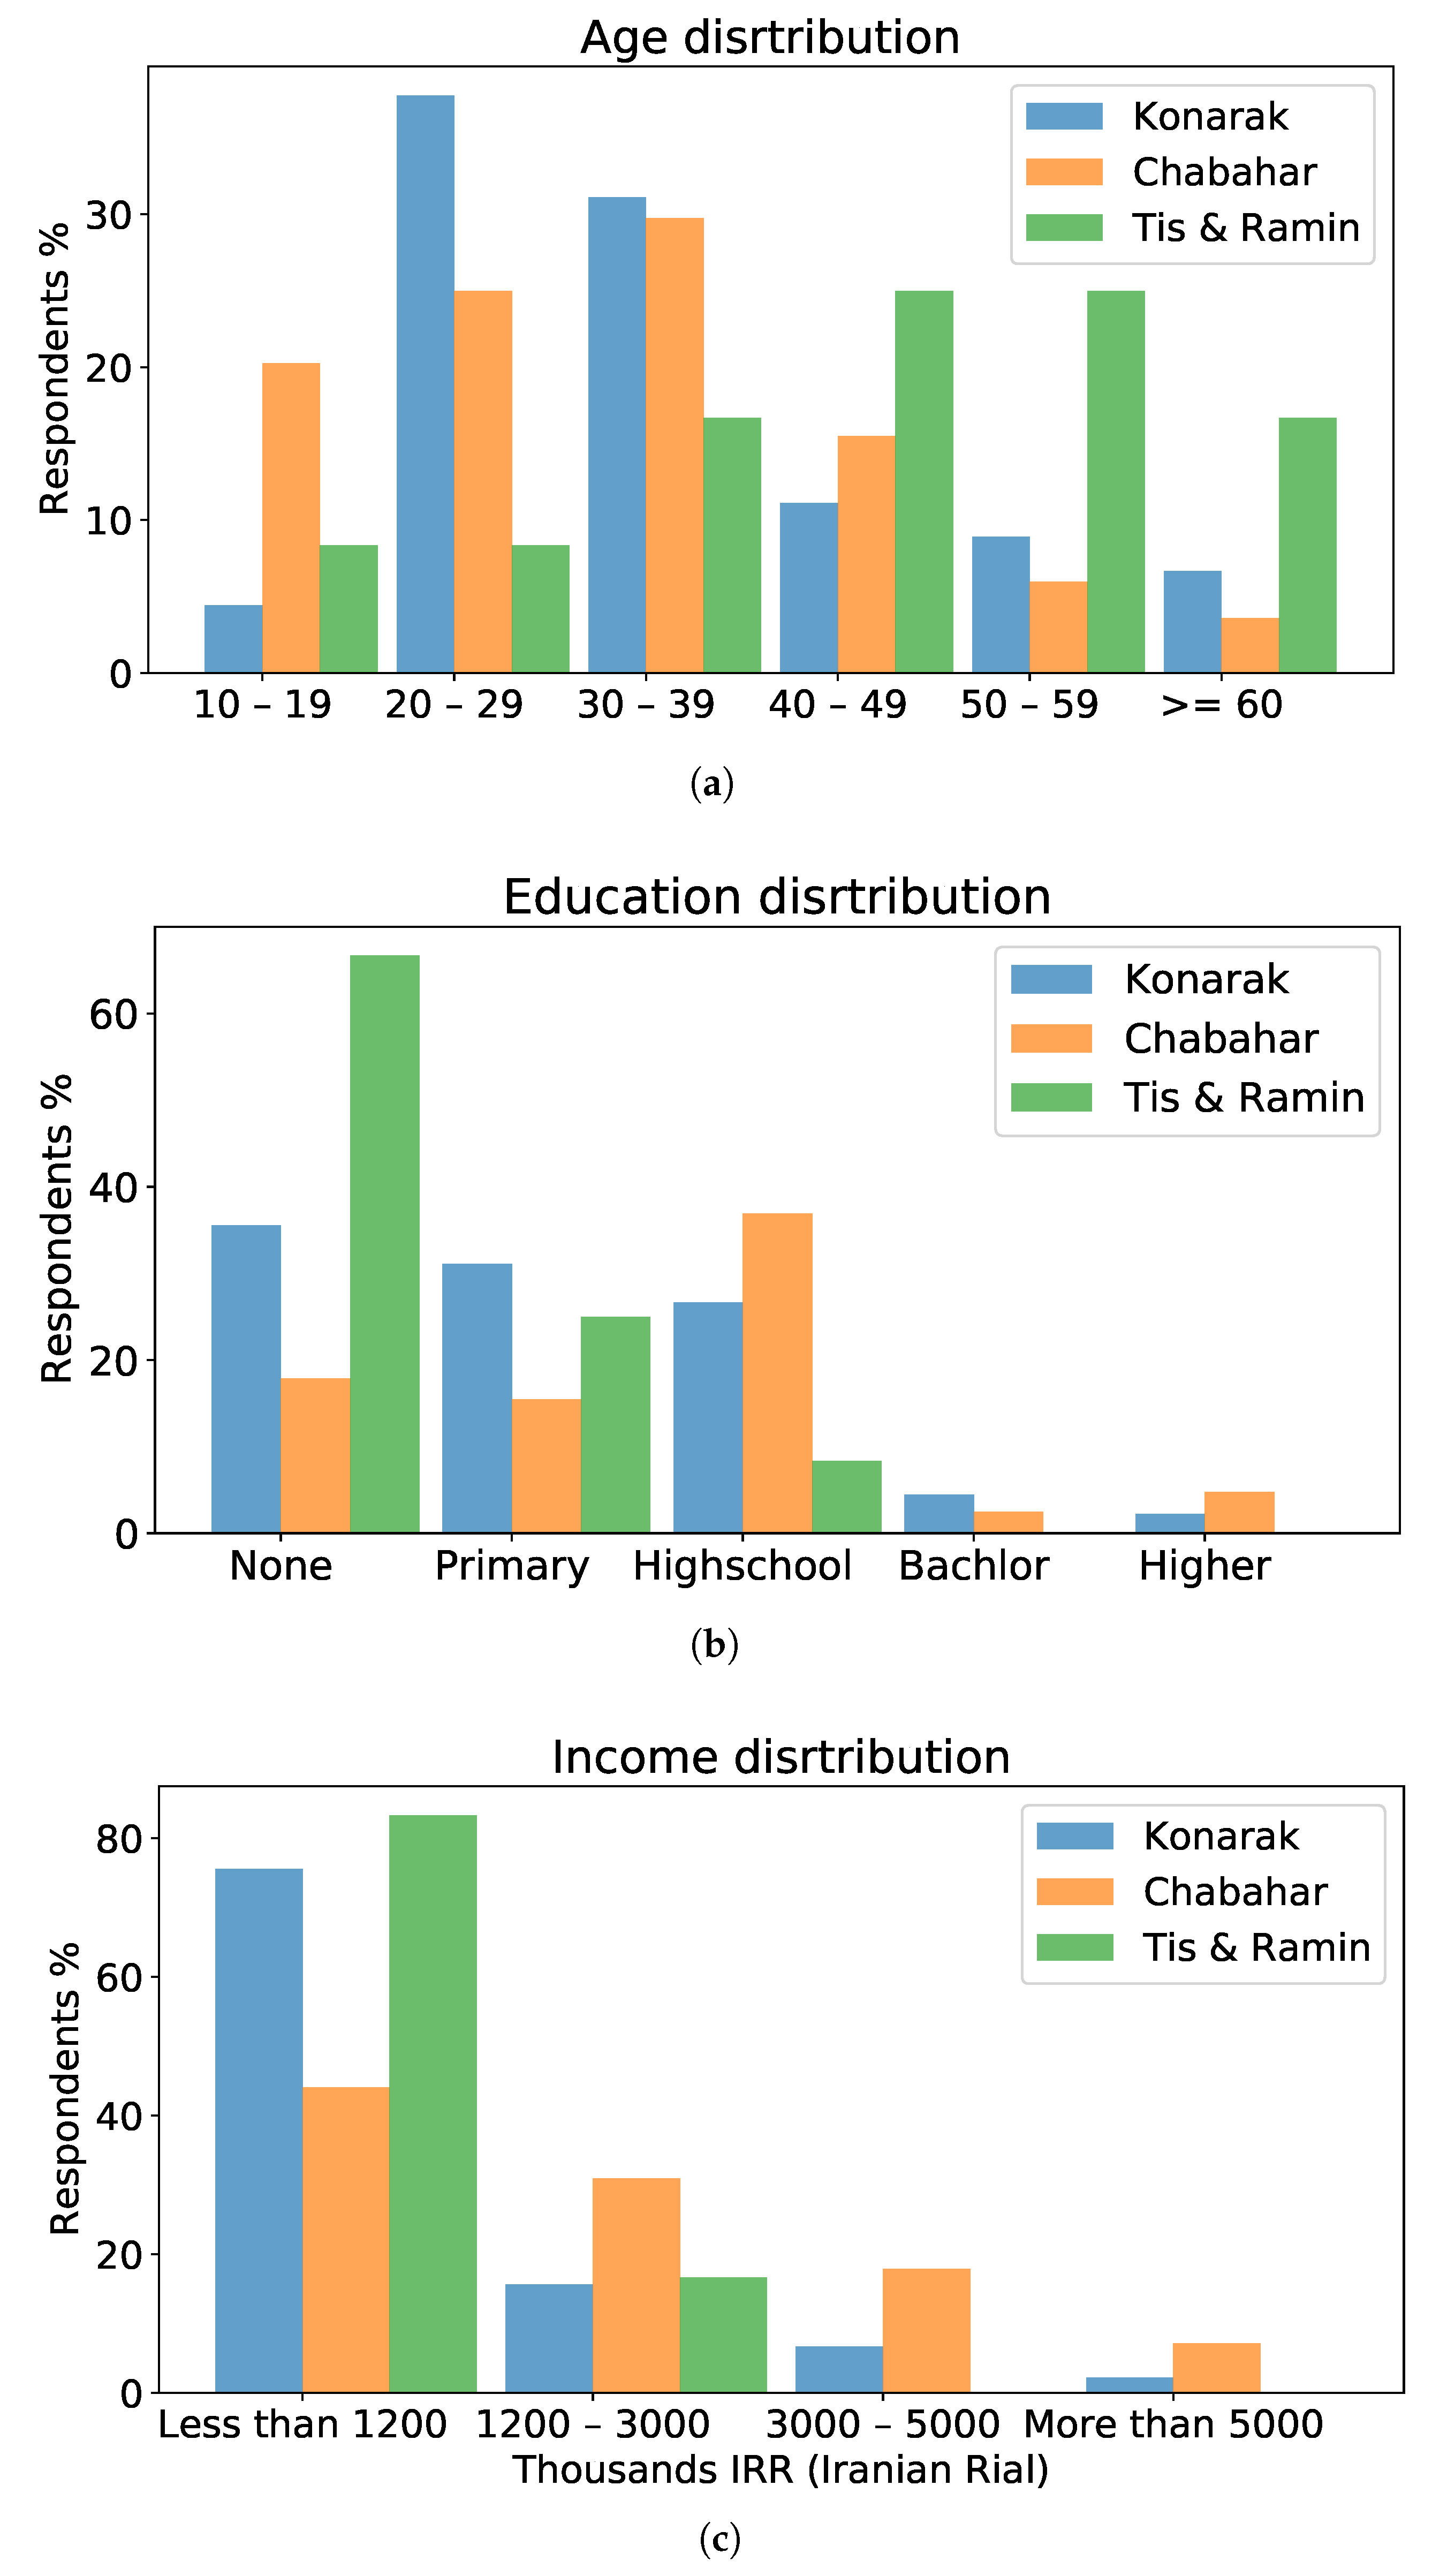
Table 3 and Figure 2 show the demographic characteristics of the respondents in different study areas. In both urban areas, the percentages of men (Chabahar: ; Konarak: ) and women (Chabahar: ; Konarak: ) who responded were similar, and a relatively balanced gender ratio was obtained. However, due to gender prejudice (in rural areas, this issue makes it hard to access and talk with women), there was a gender imbalance in responses in the rural areas of Ramin and Tis (men: ; women: ). Respondents in urban areas were predominantly young, with and being under 40 years old in Chabahar and Konarak, respectively. In contrast, in Ramin and Tis, of respondents were older than 40 years old (see Figure 2a), which could be considered typical owing to the recent major migration of young people to urban areas in Iran. Figure 2b indicates a typical education distribution compared to the latest census of the government [46] for our study areas, where the majority of respondents did not have university education (Chabahar: 70.24%; Konarak: 93.44%; Ramin and Tis: 100%). The socioeconomic status of most respondents was quite low, with most reporting a monthly household income of less than 30,000,000 IRR (Iranian Rials), or around 112 USD (Chabahar: 75%; Konarak: ), as did all respondents in Tis and Ramin (see Figure 2c). Remarkably, the income distribution seems typical because the average monthly income of the province, 12,460,000 IRR, has been 46% of the country’s average income for the past ten years.
4.2. Knowledge and Awareness
Here, we define “knowledge” as respondents’ ability to understand the definition of tsunamis and “awareness” as the perception of the degree of risk/danger associated with tsunamis in their region. Respondents were asked about their knowledge regarding the basic definition of a tsunami and from where they attained this knowledge. The results are shown in Figure 3a–c for Chabahar, Konarak, and Tis and Ramin, respectively. In both Chabahar and Konarak, less than of all respondents were not fully aware of a basic definition of tsunamis, while the majority had a basic knowledge (Chabahar: ; Konarak: ). In contrast, in Tis and Ramin, only of respondents reported knowing a basic definition of tsunamis. This may be the result of minimal access to information sources in rural areas (based on one of the authors’ observations, many respondents did not have access to TVs, radios, etc.), as well as their low education level. With regard to their sources of information, a significant difference among different study areas was observed. In Chabahar, of respondents who answered “Yes” to the previous question (i.e., basic knowledge regarding tsunamis) had obtained their information from the “Internet.” In Konarak, of respondents indicated “Family/Friends,” indicated “Other sources not listed in the questionnaire,” and indicated the “Internet.” In Tis and Ramin, owing to their minimal access to information sources, respondents with a basic knowledge of tsunamis obtained their knowledge either from “Family/Friends” or “Other sources not listed in the questionnaire.”
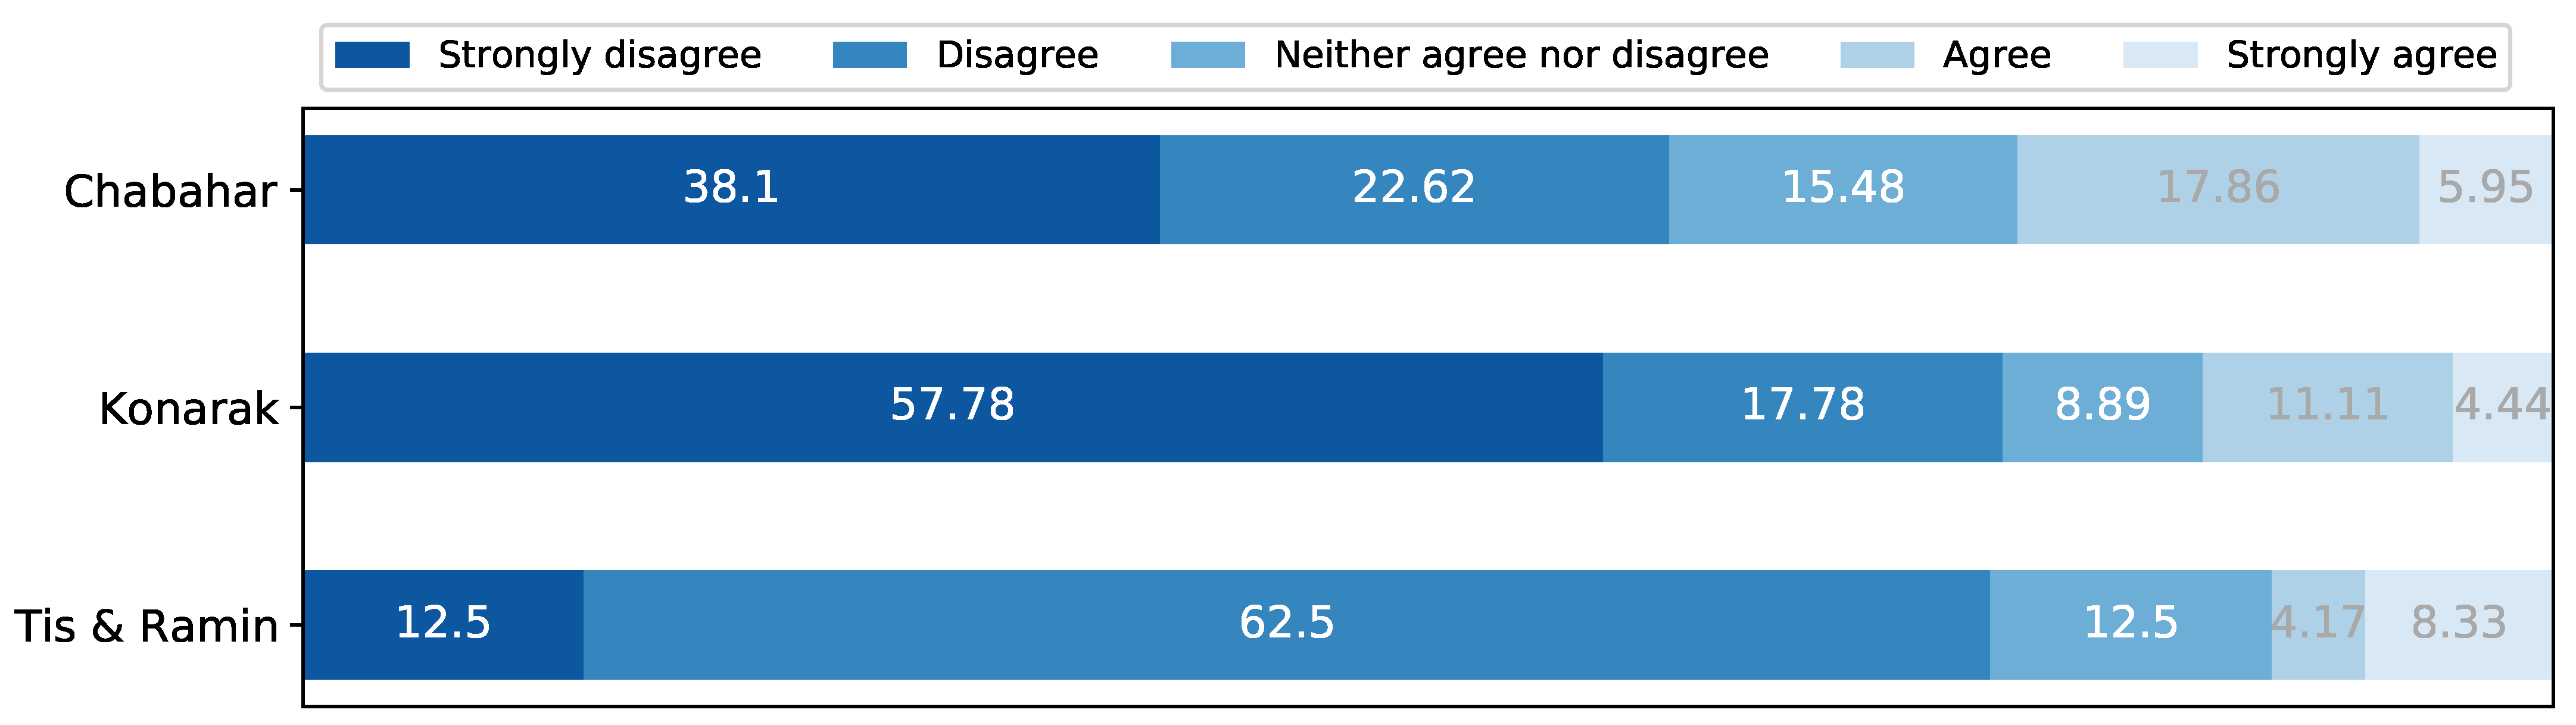
A five-point Likert-type scale (from “Strongly disagree” to “Strongly agree”) was used to evaluate how respondents considered the degree of danger associated with tsunamis in their region. The results are illustrated in Figure 4. Overall, the majority of respondents who had a basic knowledge of tsunamis strongly disagreed or disagreed that tsunamis would be a real danger to them (Chabahar: ; Konarak: ; Tis and Ramin: ). This low level of danger awareness could be attributed to the fact that none of the areas evaluated had experienced a major coastal hazard, specifically a tsunami, in the last 75 years. This may also stem from improper education programs led by the government, as the majority of respondents said that they had not seen or heard any information regarding tsunamis from the local government, city hall, emergency department, Shilat (Shilat is a governmental department in charge of coastal hazards in Iran), local disaster management authority, or other non-governmental organizations (NGOs), and were not aware of any public education programs in their community (as reported by more than of respondents in all study areas).
4.3. Perception and Attitudes
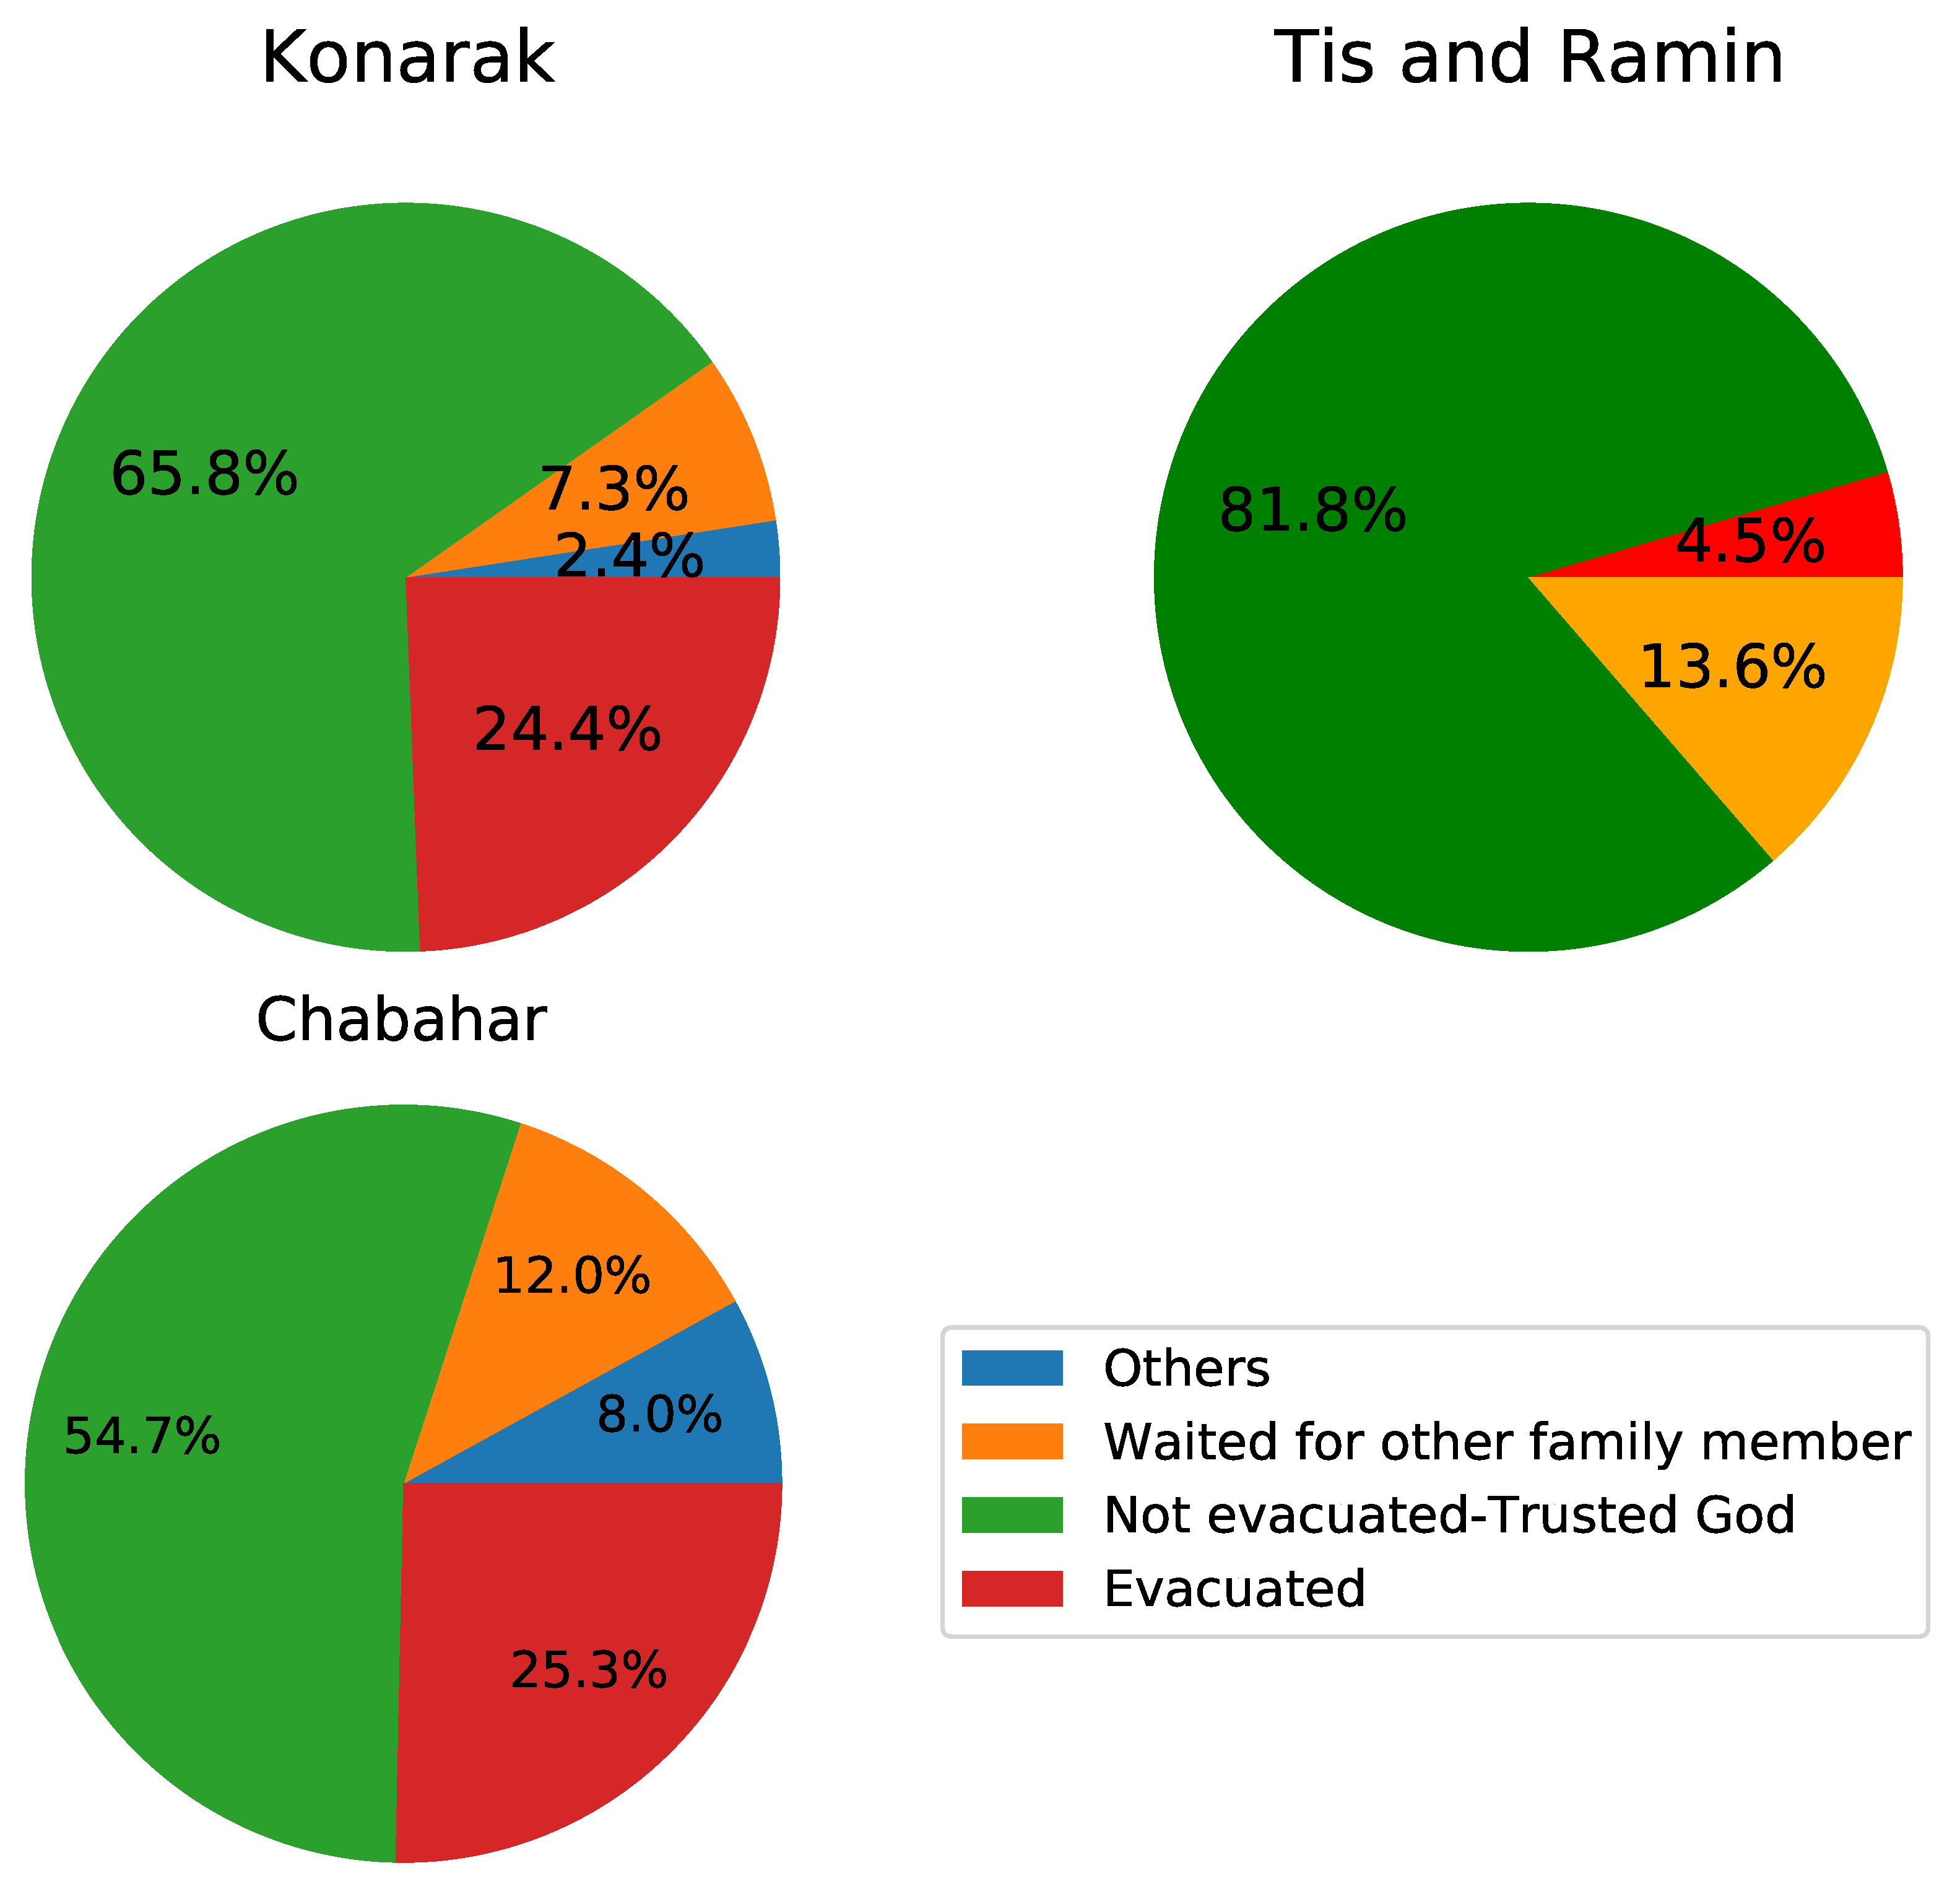
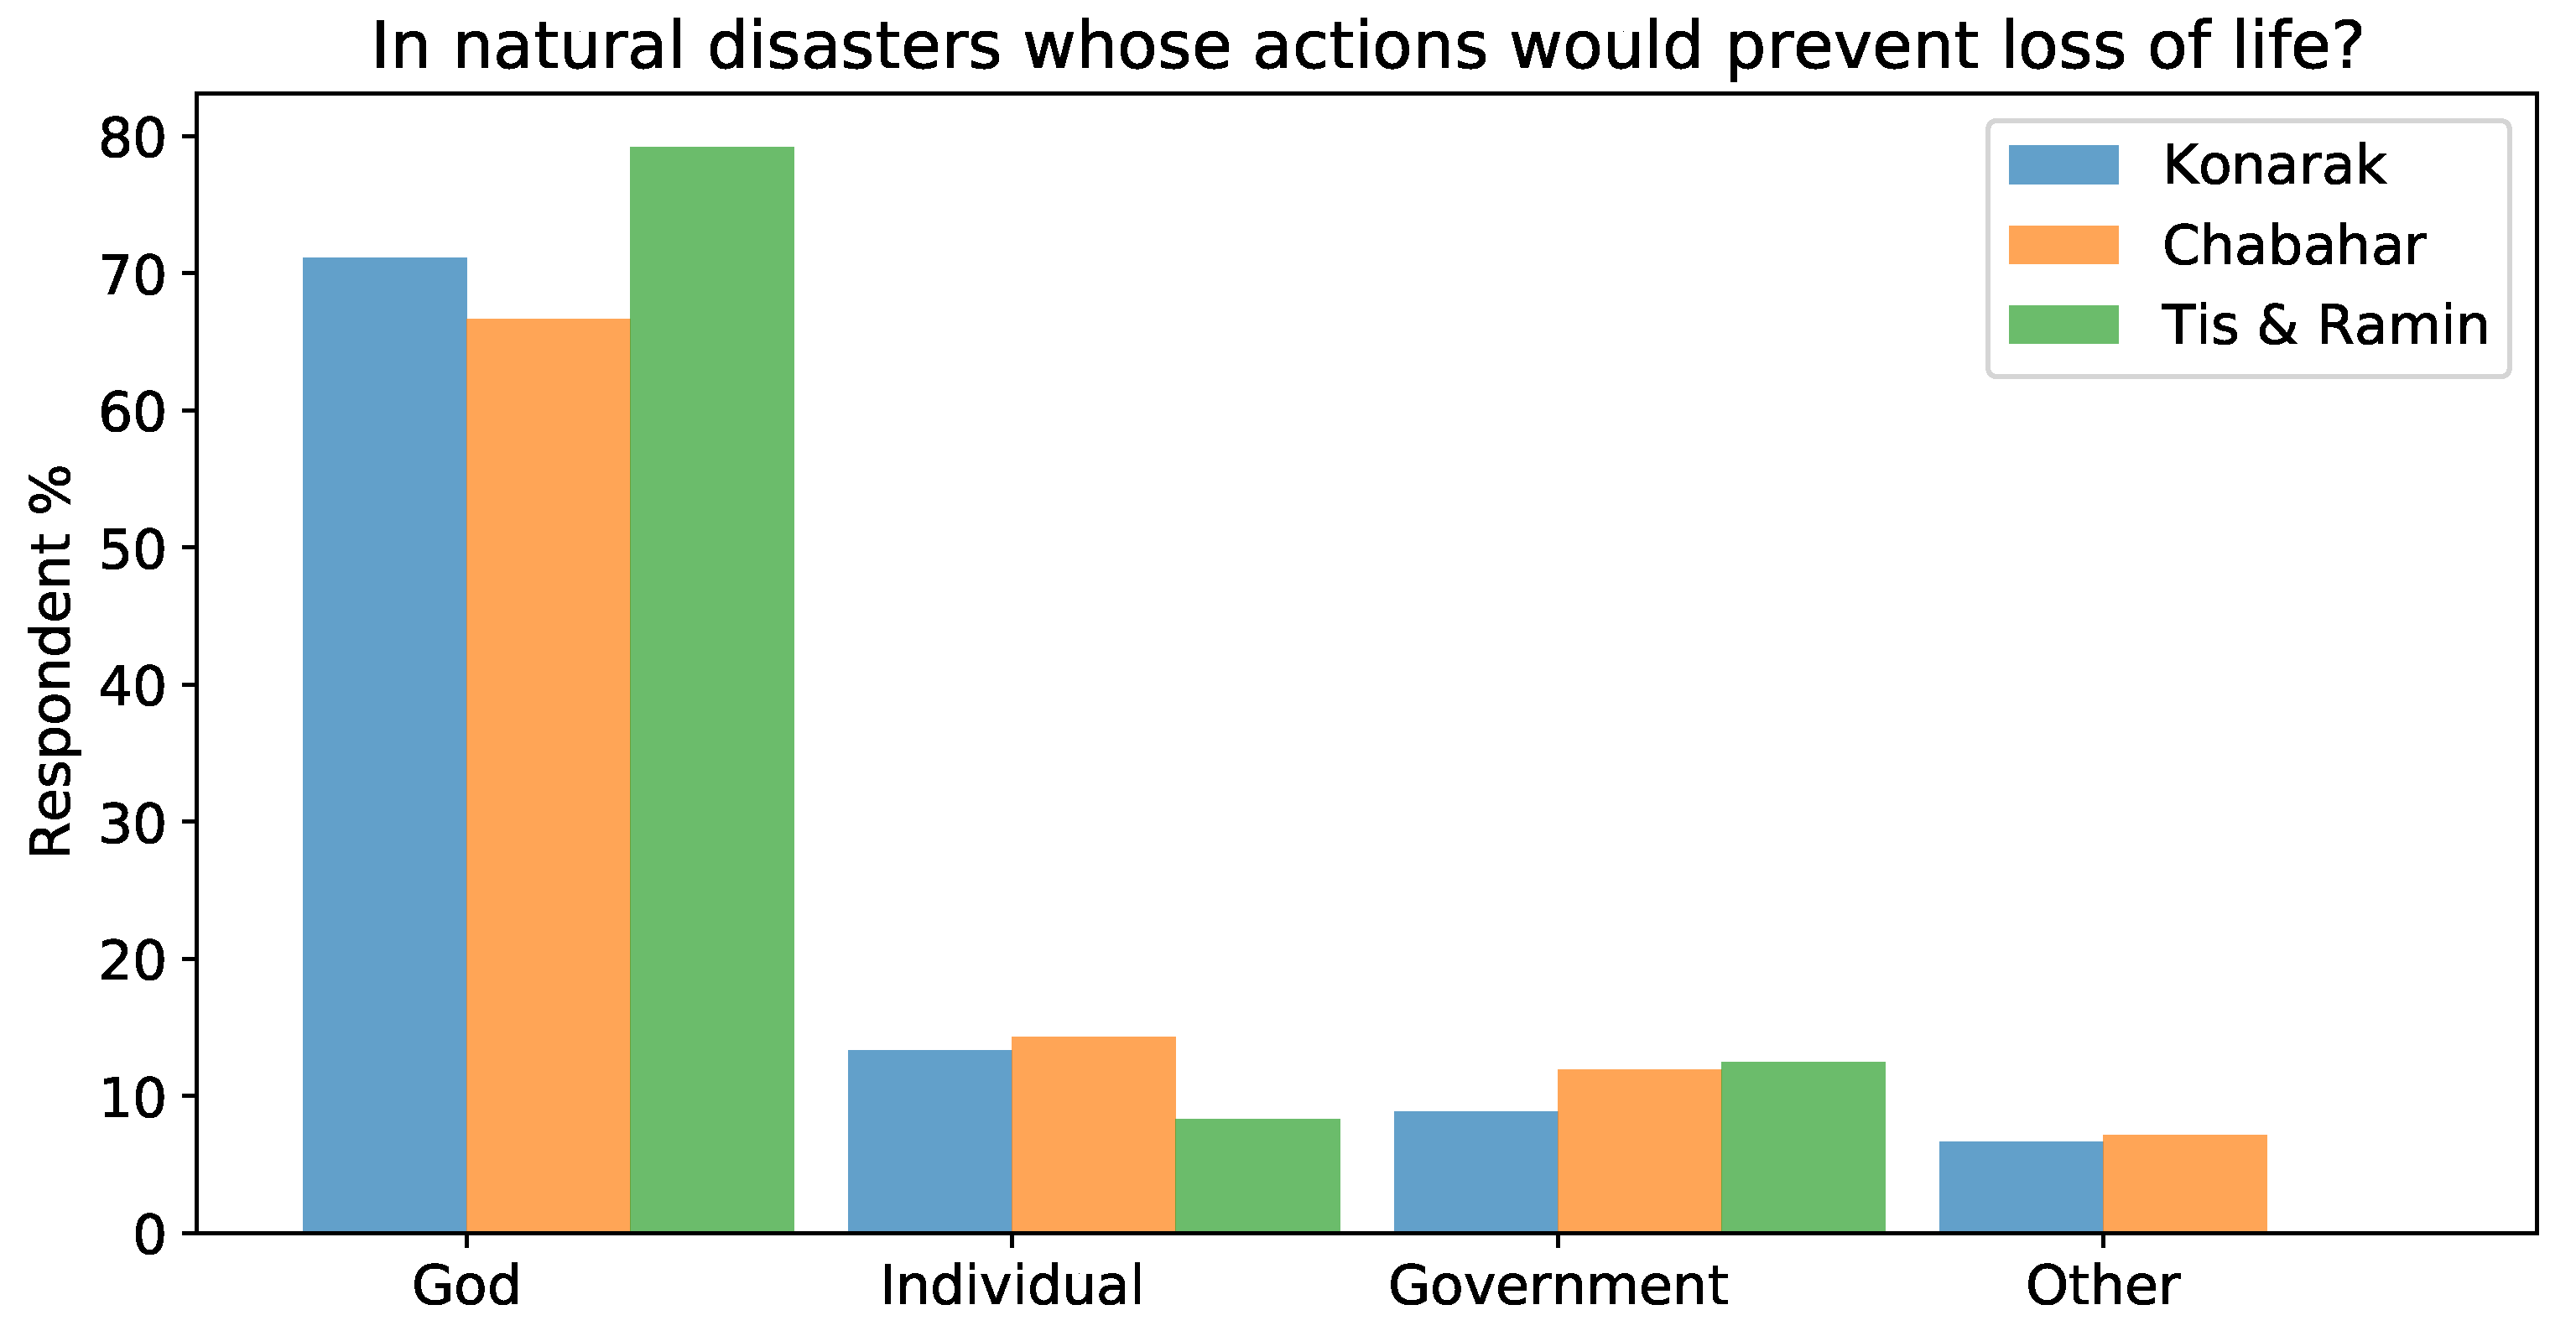
During the pilot investigation, there were considerable challenges, primarily related to the low number of tsunami events in the area. Hence, to assess the intended evacuation behavior of residents, we first asked whether they had experienced any natural hazards. More than of all respondents had experienced at least one natural hazard (e.g., earthquake, flood, storm, or tsunami) in their lifetime. Next, they were asked about their reactions during the hazards. Figure 5 presents the results in all study areas. Over half of the respondents who had at least one experience of natural hazards in their lifetime chose “did not evacuate—trusting God will help” (Chabahar: ; Konarak: ; Tis and Ramin: ). In both Chabahar and Konarak, only around of respondents chose “evacuated immediately” after they sensed the hazard or were asked to evacuate by the local government, whereas in Tis and Ramin, only evacuated immediately. Then, respondents were asked, “Whose actions would prevent loss of life during natural hazards?” A significant proportion of all respondents (more than ) declared that God would prevent the loss of life. Notably, “individuals” and “the government” had almost the same percentages, with less than (Figure 6).
Trust is a pivotal moderator of effectiveness of any policy for risk communication and public engagement. From the literature review and experts’ suggestions in the field (see Section 3.2), trust was identified as a multifaceted phenomenon that can influence people’s behavior toward action (see, e.g., [41,49]). Hence, we evaluated the impact of trust in the government on respondents’ perceptions and attitudes. Figure 7 shows the average level of people’s trust in the government’s ability to manage a disaster in three states: before a disaster, after a disaster, and in disaster education programs. A higher percentage of respondents (strongly) disagreed rather than (strongly) agreed on trusting in the government to manage hazards (Chabahar: ; Konarak: ; Tis and Ramin: ).
4.4. Statistical Analysis
A chi-square test and ANOVA were applied to determine the level of dependence between the variables, and the results were considered significant at (). Moreover, the Pearson correlation coefficient was used to measure the strength of linear association among variables when there was a significant difference. First, the relationship between the demographic characteristics of respondents and their knowledge, awareness, reactions, and trust (the various variables outlined in the previous subsections) were examined. To meet computing needs, respondents from all study areas were combined. Moreover, to make comparisons easier and to overcome the limited number of respondents in some categories, the demographic variables were reclassified into new groups. The reclassifications and their associated numbers for coefficient analysis are illustrated below:
- Age: Age groups were reclassified as 10–29 (“young” = 1), 30–49 (“middle-aged” = 2), and respondents over 50 (“old” = 3).
- Education: Respondents were divided into two groups: “without university education = 1” and “with university education = 2” (respondents without university education included those who did not meet national literacy standards and those with only primary and high-school education).
- Income: Because the majority of respondents were very poor, respondents were divided into two groups: high-income earners = 2 (household income more than 12,000,000 IRR) and non-high-income earners = 1. This distribution was selected considering the national minimum wage in 2018.
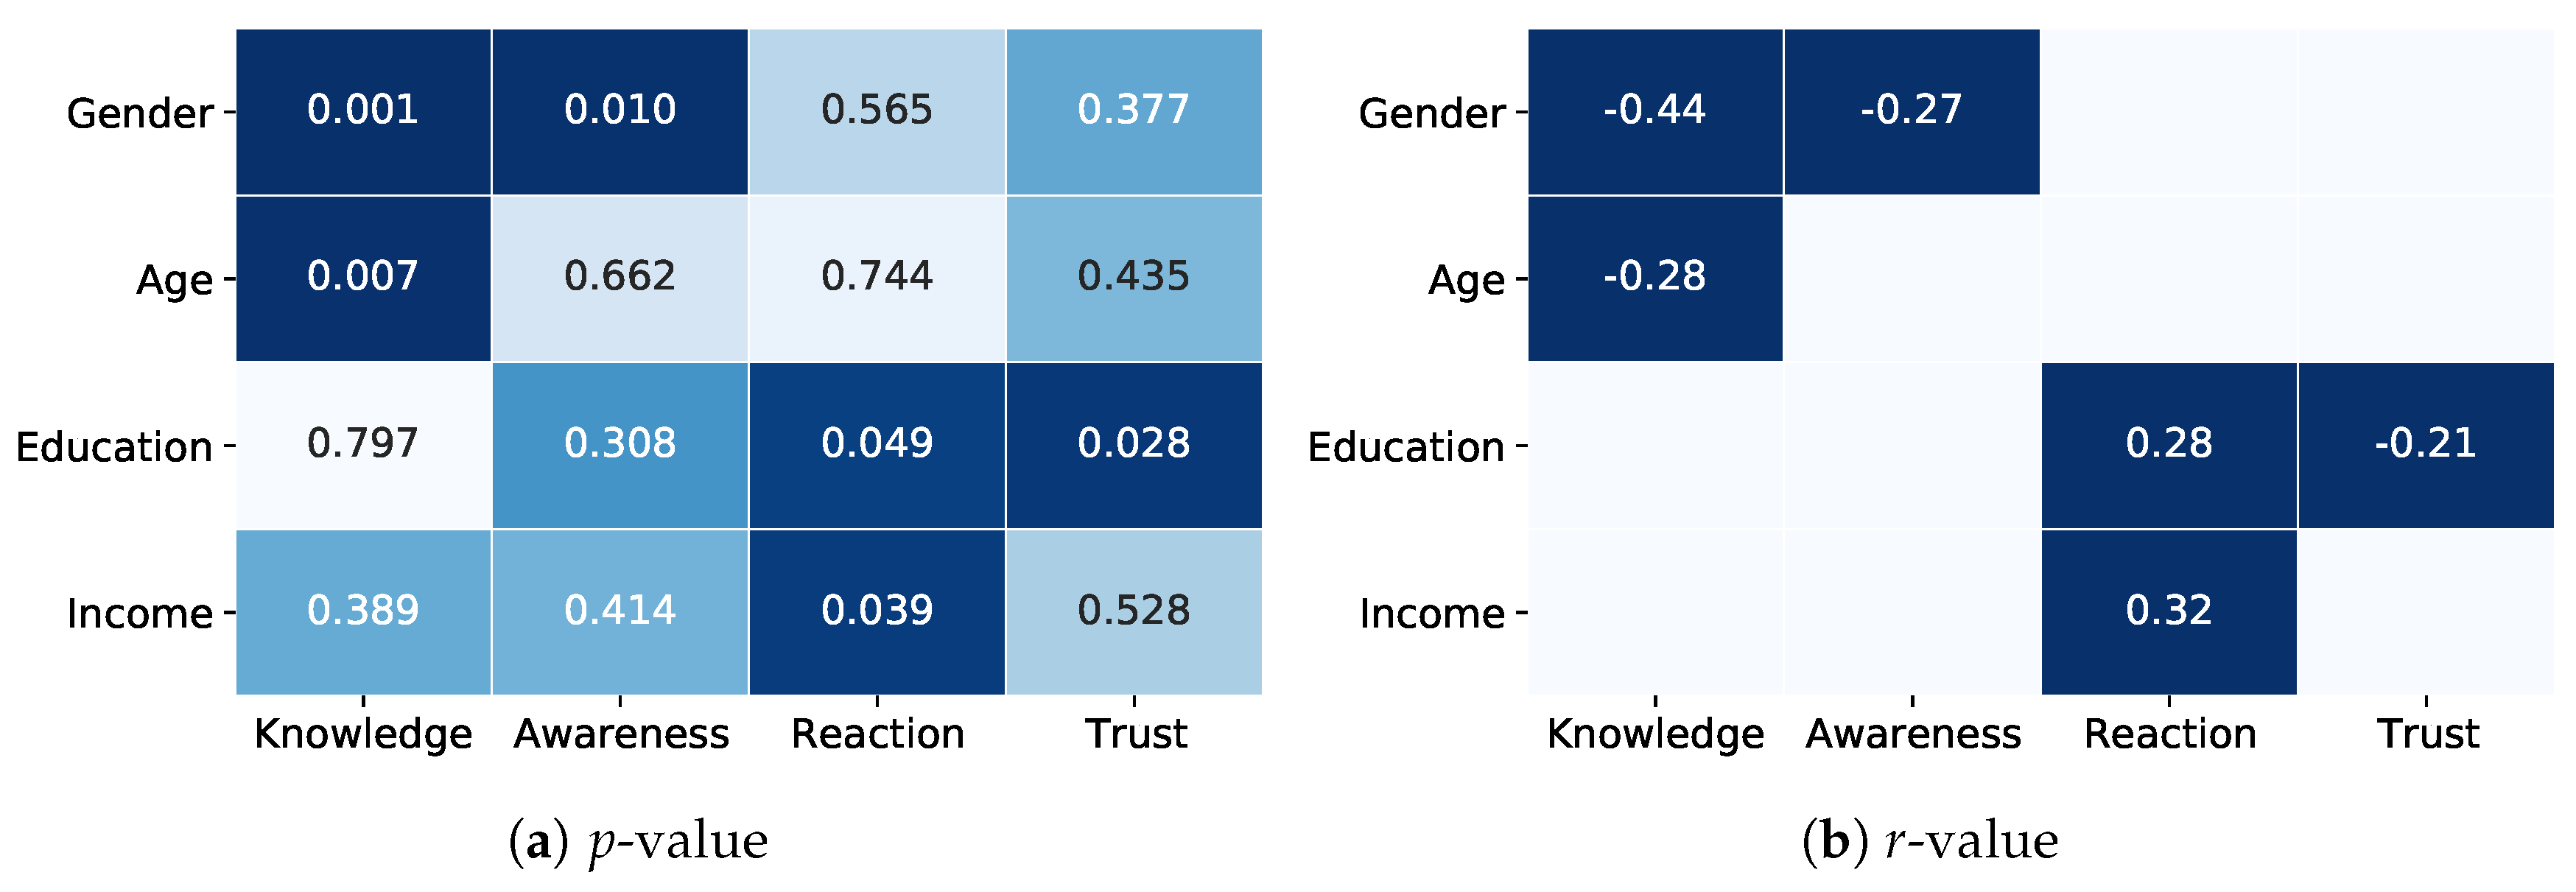
Figure 8a,b shows the results of the p-value obtained via chi-square tests and ANOVA and the r-value obtained via the Pearson correlation coefficient, respectively. At the level of significance, six relationships were found to be statistically significant. Regarding gender, the differences between men and women in their knowledge and awareness were found to be significant with and , respectively. In the coefficient analysis, we considered “men = 1” and “women = 2” and having knowledge:“No = 1” and “Yes = 2”; awareness levels were labeled 1 to 5, from very low (1) to very high (5). The levels of knowledge and awareness among men were higher compared with those of women. This appears to be correlated with notable gender discrimination in this area [50]. However, no statistically significant associations between gender and reaction against hazards or level of trust in the government were observed. The other statistically significant relationship was a negative correlation between age and knowledge (). Young respondents had more general knowledge than other age groups. No relationship was found between respondents’ education or income and their knowledge and awareness. The difference between education levels and the respondents’ reactions was also significant with (in the coefficient analysis, we considered “not evacuated—trusting God = 1”, “not evacuated—waiting for other family member = 2”, and “evacuated immediately = 3”). More educated people tended to evacuate immediately when facing a natural hazard. Moreover, people with university education had less trust in the government (). (in the coefficient analysis, trust levels were labeled from 1 to 5, from strongly distrust (1) to strongly trust (5)). Finally, there was a statistical relationship between respondents’ income and their response to hazards () where high-income earners tended to evacuate immediately.
Further tests were carried out to understand whether differences in awareness could result in respondents’ reactions. The same analysis was performed between reaction and trust; however, no statistically significant relationships were found.
4.5. FGDs
To support our questionnaire results, three FGDs were held among beach users and fishers. The interviewees were asked about their experiences with natural hazards. After the transcribed discussions were coded, “God” and “trust” were found to be among the most repeated variables. Some quotes from interviewees who experienced cyclone Gonu in 2007 are presented below.
We did not evacuate because we thought God will save us.(45 years old, Ramin)
The local government asked us to get on the buses and leave the area; my mom did not let us do so, believing God will take care if we are innocent.(26 years old, Ramin)
My dad told us we have to stay and suffer to be forgiven because of our sins.(18 years old, Ramin)
We do not trust Shilat. They asked people to get on the buses provided by them, but we did not. Shilat does not know where to take people.(42 years old, Ramin)
In summary, the interviewees either trusted God to save them or believed the event to be a form of punishment or test. Moreover, distrusting the government was among the main reasons that respondents did not evacuate. These findings are aligned with those of the questionnaire survey.
5. Discussion
In this section, we summarize the central findings of this study and compare them with those in the literature. A more detailed discussion about the context of our study area is also presented. Finally, based on the evidence, we construct a hypothetical framework for decreasing the vulnerability to natural hazards in the MSZ.
5.1. Knowledge and Awareness
The survey results revealed that the majority of people had a basic knowledge about tsunamis in Chabahar and Konarak. In contrast, in Tis and Ramin, only around one-third of respondents had this basic knowledge (see Figure 3 and the discussion in Section 4.2). Following our expectations, awareness was rather low among respondents with basic knowledge of tsunamis (see Figure 4 and the discussion in Section 4.2). Some studies have focused on specific factors In Indonesia, Chile, and Japan that could influence awareness, such as experience [51,52], poverty [53], information sources, policies [18,54], and demographic indicators [55]. In our study areas, as has been mentioned previously, low awareness could stem from respondents’ minimal experience with coastal hazards, as the last tsunami in the study area occurred 75 years ago. In contrast to areas with recent tsunami experience, however, the level of people’s awareness was rather high (e.g., Chile [27] and Japan [56]). Low awareness could also occur due to the lack of data and tools, such as evacuation maps and warning systems, as well as their poor distribution among residents. According to our results, almost all respondents (more than ) had not received or heard any information regarding tsunamis from the local government, city hall, emergency department, Shilat, local disaster management authority, or other NGOs, and and were not aware of any public education programs in their community.
In addition, some other studies considered the effect of one aspect of demographic indicators on hazard awareness. e.g., gender [57], education [58], and age [59]. In this study, we investigated the relationship between respondents’ demographic profiles and their awareness levels. There was a statistically significant difference between men and women and their knowledge and awareness. There are many studies that confirm the inequalities between genders and their awareness; however, the difference between men and women remains a controversial issue. Some researchers indicated that risks tend to be judged as lower by men than by women [60], while others have rejected this hypothesis [55,57,61]. In societies with strong patriarchal values, including those of Middle Eastern countries, women’s presence in society and decision-making is typically decreased, and this gender gap could intensify disparity in knowledge and awareness outcomes, as indicated by our findings.
5.2. Perception and Attitude
In many studies, the importance of risk perception in evacuation behavior is highlighted. How people perceive risks is shaped by their experience, feelings, values, and beliefs. In addition to a lack of awareness and experience, this study provides information about other variables that affect the attitudes of people regarding natural hazards. Religion and trust in the government were found to affect respondents’ attitudes toward natural hazards.
5.2.1. Trust
In the literature, trust has been identified as a multifaceted phenomenon that can influence people’s behavior toward action. It has different effects in each area and community. Despite the fact that trust in civil protection may lead to neglecting self-protection, trust in the government and information sources may improve disaster risk communication. Trust influences people’s risk perception and their acceptance of preventive actions. Ref. [62] revealed that higher trust leads to higher risk awareness and better acceptance of pursuing preventive action based on a filed survey in India. A review by the authors of [63] suggests that trust in authorities and experts has the most impact on risk perception. Ref. [49] suggests that trust is one of the critical moderators of effectiveness of any policy for risk communication in an uncertain risk. Both too much trust and lack of trust in flood protection measures influenced the flood risk coping culture in Vietnam [33]. Some studies have shown that a high level of trust in the government to manage a disaster and provide information sources is correlated with a higher level of perceived preparedness [41], whereas in Japan, the high level of trust led to neglecting self-protection strategies. A simple example is that of the 2011 Tohoku tsunami, more specifically in the town of Taro, in which too much trust in structures and scientific facts led to ignoring of self-protection [8].
In our work, respondents’ trust in authorities regarding risk management in risk education, evacuation warning, and post-disaster management was evaluated. The results show that more than two-thirds of respondents (strongly) disagreed with trusting the government to manage hazards. This lack of trust in the government may lead to greater vulnerability in the study area. For example, cyclone Sidr on the coasts of Bangladesh in 2007 caused hundreds of casualties because people did not trust the early cyclone warnings circulated by the local government and mass media [64]. The same attitude was reported by interviewees for not evacuating in the cyclone Gonu in 2007 based on our FGDs (Section 4.5). In some studies, this lack of trust stems from survivors’ bitter experiences [65]; however, in our case, it may have resulted from religious differences, where the majority of the government is Shia and residents are Sunni.
5.2.2. Religion
In both the questionnaire and FGDs, we found highlighted subjects that showed the role of religion in respondents’ attitudes toward hazards. The majority of respondents who experienced one type of natural hazards in their lifetime either trusted God to save them or thought it was God’s punishment. Moreover, more than two-thirds of respondents believed that if a natural hazard occurs, God will prevent loss of life. The solid faith in destiny together with one’s lack of belief in his or her will and determination are among the personal characteristics of individuals living in Middle Eastern and Muslim countries [50]. However, there are similar findings in other parts of the world and with other religions. For example, the authors of [66] found that the religious attribution of an earthquake in Tibet, China in 2010 had a negative impact on people’s awareness and their behavioral responses. Furthermore, the majority of coastal residents in Trinidad and Tobago had an attitude and perception that “God is a Trini” and that they were immune; they believed that if a tsunami were to occur, God was most likely to prevent the loss of life ( of interviewees) [19]. In their study, it was argued that the religious attribution of natural hazards might come from low awareness and few/no experiences of tsunamis. However, several studies revealed that even in communities where individuals are aware of scientific explanations of natural hazards, people perceive it as “God’s will or punishment,” such as in Nepal [67,68], Ghana [69], and Japan [70]. Extra effort has been made to extract additional information from the literature regarding survivors’ experiences of the 1945 Makran tsunami. This includes a booklet that includes interviews from 2008–2015 under United Nations projects [71]. There were good examples showing the strong religious attribution of the tsunami among interviewees. Some of these are presented in Table 4. Similar findings were reported after a mosque and shrine survived the 2004 Indonesia and 2011 Japan tsunamis, respectively, where people had asserted that God/the gods were protecting their house.
5.2.3. Salient Value Sharing (SVS)
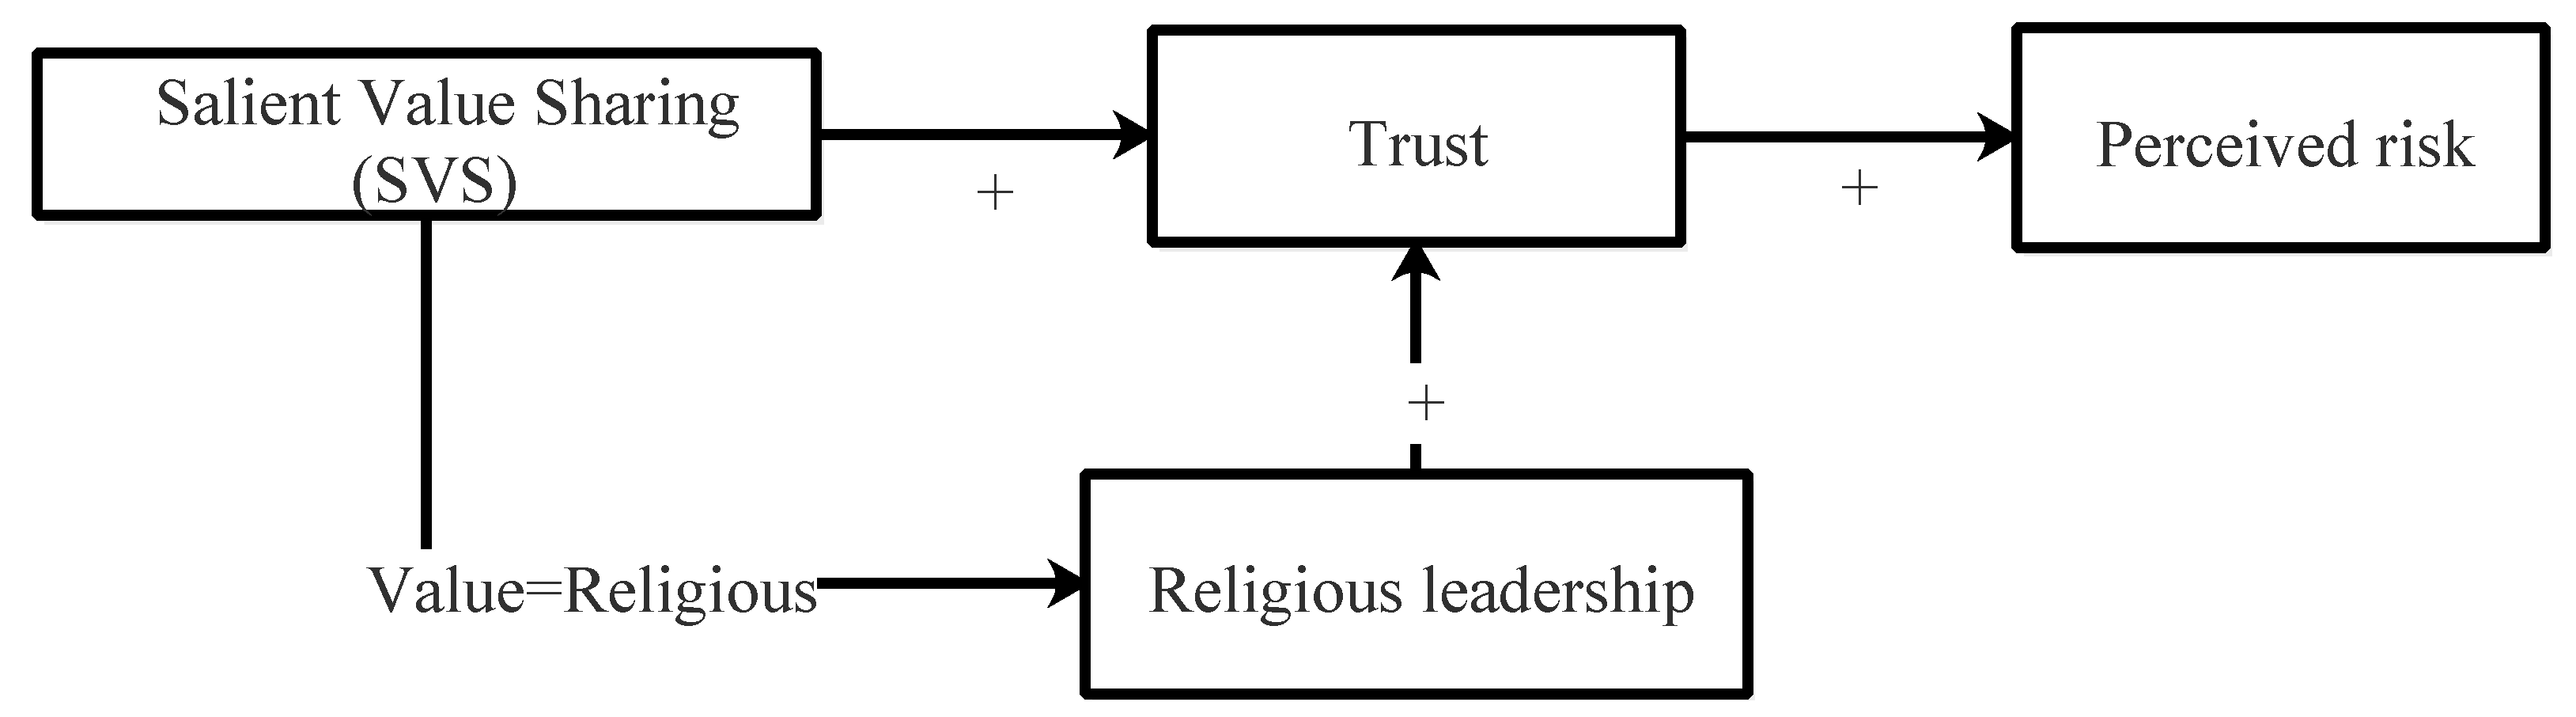
The improper belief in destiny and neglecting one’s part (ability) to change their own situation can lead to not establishing sufficient plans and dismissing the role of risk management in protecting against natural hazards. It should be noted that getting used to any circumstances blindly together with “actions” that come with inaction make any change and acceptance of new thoughts and methods difficult. This situation intensifies when the level of trust in the government regarding risk management is rather low. Hence, we suggest that leaders and disaster management practitioners obtain help from religious leaders to improve risk awareness and perception among low-trust populations. In other studies, the role of local leaders in disaster risk reduction has been reported. A better tsunami mitigation strategy should involve local community leaders as its primary focus of attention [72]. Furthermore, local religious leaders can transfer important information about disaster preparedness to people through religious myths because they understand and accept information better in such terms [68]. Several studies have demonstrated that people tend to trust those who share similar values. Evidence supporting the theory known as salient value sharing (SVS) [73] indicates that policies based on salient cultural values are more widely acceptable [74]. Based on our findings, we hypothesize a framework to improve risk perception in communities (see Figure 9). Religion and risk are interconnected, which can have both positive and negative influences on risk assessment and mitigation [68]. Our hypothesis framework suggests that the negative aspects can be turned into positive factors in risk management by seeking help from religious leaders and involving them in the process of disseminating scientific knowledge and disaster risk reduction. According to our results, one of the effective ways to mitigate risk could be through religious observance. This is parallel with the findings of Dhanhani [75], where it was concluded that a majority of people in the United Arab Emirates considered disasters to be either an act of God or a punishment, and suggested that an effective response for mitigating risk needs to recognize and address the cultural and religious contexts. Our results showed that the level of trust in the government regarding risk management is rather low. This may have resulted from different denominations of religion where the majority of the government is Shia and local people are Sunni. This, along with the significant role of religion in respondents’ attitudes toward hazards (as was demonstrated in our study), led us to come up with this hypothesis. In various studies, the similarities in value sharing had a positive effect on the level of trust and, as a result, on perception of risks [74,76,77,78]. As shown in Figure 9, the role of religious leaders and their involvement in tsunami risk communication and disaster risk reduction can lead to the community’s trust in risk reduction strategies and, consequently, their actions toward reducing the risk.
However, since our survey questions were not originally designed to reflect the construct of SVS and our final hypothesis model, validating them was beyond the scope of this study, and shall be addressed in future work.
6. Conclusions
In this study, we evaluated people’s knowledge, awareness, and attitudes regarding tsunamis in the MSZ, which is an under-studied region. To the best of our knowledge, no research has been conducted in our study area regarding this topic. Hence, our findings provide valuable information for various stakeholders to underpin tsunami risk activities, mitigation measure design, and risk-aware city planning. Moreover, owing to our notable findings regarding the roles of religion, trust, and risk perception, new lines of research and discussion on this topic have been elucidated, exhibiting wide applicability beyond this region. It would be interesting to investigate this research topic further in both Makran and other regions.
Risk reduction measures for one hazard should be compatible with those for other hazards. Therefore, the perspective presented in this study could be beneficial for developing disaster measures for other natural hazards.
This study provides crucial information for developing comprehensive and reliable mitigation plans and activities; however, it is important to acknowledge its limitations. There are several uncertainties involved in this research. For example, regarding data validation, extensive data collection could be more representative of the outcomes, since the sample size of our study was quite small. In addition, different sampling strategies were applied to each study area, which may limit the generalizability.
Author Contributions
Conceptualization, P.S. and J.S.; Data curation, P.S.; Formal analysis, P.S.; Investigation, P.S.; Methodology, P.S. and J.S.; Supervision, J.S.; Visualization, P.S.; Writing—original draft, P.S.; Writing—review and editing, J.S. All authors have read and agreed to the published version of the manuscript.
Funding
This research received no external funding.
Institutional Review Board Statement
Ethical review and approval were waived due to involving neither personally identifiable nor sensitive data.
Informed Consent Statement
Not applicable.
Data Availability Statement
Data is contained within the article. Additional data are available on request from the corresponding author.
Acknowledgments
The authors would like to thank Hiromi Yokoyama (Kavli Institute for the Physics and Mathematics of the Universe, the University of Tokyo) for commenting on the manuscript of this paper and for several illuminating conversations. We would like to thank external English editors for English language editing. The authors would like to acknowledge the anonymous referee for his/her useful comments on the first version of this manuscript.
Conflicts of Interest
The authors declare no conflict of interest.
References
- Bathrellos, G.D.; Skilodimou, H.D. Land Use Planning for Natural Hazards. Land 2019, 8, 128. [Google Scholar] [CrossRef] [Green Version]
- Murty, T.; Rafiq, M. A tentative list of tsunamis in the marginal seas of the north Indian Ocean. Nat. Hazards 1991, 4, 81–83. [Google Scholar] [CrossRef]
- Heidarzadeh, M.; Pirooz, M.D.; Zaker, N.H.; Yalciner, A.C.; Mokhtari, M.; Esmaeily, A. Historical tsunami in the Makran Subduction Zone off the southern coasts of Iran and Pakistan and results of numerical modeling. Ocean Eng. 2008, 35, 774–786. [Google Scholar] [CrossRef]
- Salah, P.; Soltanpour, M. Modeling of tsunami propagation and inundation at the north coast of Gulf of Oman due to earthquake in Makran subduction zone. In Proceedings of the International Conference on Coasts, Ports and Marine Structures (Icopmas), Tehran, Iran, 28 November 2014; p. 11. [Google Scholar]
- Heidarzadeh, M.; Kijko, A. A probabilistic tsunami hazard assessment for the Makran subduction zone at the northwestern Indian Ocean. Nat. Hazards 2011, 56, 577–593. [Google Scholar] [CrossRef] [Green Version]
- Salah, P.; Sasaki, J.; Soltanpour, M. Comprehensive Probabilistic Tsunami Hazard Assessment in the Makran Subduction Zone. arXiv 2020, arXiv:2010.01284. [Google Scholar]
- Nations, U. UNISDR Terminology on Disaster Risk Reduction; United Nations Office for Disaster Risk Reduction: Geneva, Switzerland, 2009. [Google Scholar]
- Suppasri, A.; Shuto, N.; Imamura, F.; Koshimura, S.; Mas, E.; Yalciner, A.C. Lessons learned from the 2011 Great East Japan tsunami: Performance of tsunami countermeasures, coastal buildings, and tsunami evacuation in Japan. Pure Appl. Geophys. 2013, 170, 993–1018. [Google Scholar] [CrossRef] [Green Version]
- National Science and Technology Council. Reducing Disaster Vulnerability through Science and Technology; Technical Report; National Science and Technology Council: Washington, DC, USA, 2003. [Google Scholar]
- Paton, D.; Johnston, D. Disasters and communities: Vulnerability, resilience and preparedness. Disaster Prev. Manag. 2001, 10, 270–277. [Google Scholar] [CrossRef]
- Paton, D. Disaster preparedness: A social-cognitive perspective. Disaster Prev. Manag. 2003, 12, 210–216. [Google Scholar] [CrossRef]
- Tavares, A.O.; Mendes, J.M.; Basto, E.; Cunha, L. Risk perception, extreme events and institutional trust: A local survey in Portugal. Reliab. Risk Saf. Theory Appl. 2009, 3, 1245–1252. [Google Scholar]
- Esteban, M.; Takagi, H.; Nguyen, D.; Tam, T.; Trang, D.; Anh, L.; Valenzuela, V.P. Awareness of coastal disasters: Case of an impoverished low-lying river mouth community in southern Vietnam. Int. J. Sustain. Future Hum. Secur. 2017, 5, 77–85. [Google Scholar] [CrossRef]
- Esteban, M.; Valenzuela, V.P.; Yun, N.Y.; Mikami, T.; Shibayama, T.; Matsumaru, R.; Takagi, H.; Thao, N.D.; De Leon, M.; Oyama, T.; et al. Typhoon Haiyan 2013 evacuation preparations and awareness. Int. J. Sustain. Future Hum. Secur. 2015, 3, 37–45. [Google Scholar] [CrossRef]
- Whitehead, J.C.; Edwards, B.; Van Willigen, M.; Maiolo, J.R.; Wilson, K.; Smith, K.T. Heading for higher ground: Factors affecting real and hypothetical hurricane evacuation behavior. Environ. Hazards 2000, 2, 133–142. [Google Scholar] [CrossRef]
- Mabuku, M.P.; Senzanje, A.; Mudhara, M.; Jewitt, G.; Mulwafu, W. Rural households? flood preparedness and social determinants in Mwandi district of Zambia and Eastern Zambezi Region of Namibia. Int. J. Disaster Risk Reduct. 2018, 28, 284–297. [Google Scholar] [CrossRef]
- Gregg, C.E.; Houghton, B.F.; Paton, D.; Lachman, R.; Lachman, J.; Johnston, D.M.; Wongbusarakum, S. Natural warning signs of tsunamis: Human sensory experience and response to the 2004 great Sumatra earthquake and tsunami in Thailand. Earthq. Spectra. 2006, 22, 671–691. [Google Scholar] [CrossRef] [Green Version]
- Esteban, M.; Tsimopoulou, V.; Mikami, T.; Yun, N.; Suppasri, A.; Shibayama, T. Recent tsunamis events and preparedness: Development of tsunami awareness in Indonesia, Chile and Japan. Int. J. Disaster Risk Reduct. 2013, 5, 84–97. [Google Scholar] [CrossRef]
- La Daana, K.K.; Singh, D.; Lauckner, B.; Ebi, K.L.; Chadee, D.D. Knowledge, attitude and practices of coastal communities in Trinidad and Tobago about tsunamis. Nat. Hazards 2016, 81, 1349–1372. [Google Scholar]
- Esteban, M.; Thao, N.D.; Takagi, H.; Valenzuela, P.; Tam, T.; Trang, D.; Anh, L. Storm surge and Tsunami awareness and preparedness in Central Vietnam. In Coastal Disasters and Climate Change in Vietnam; Elsevier: Amsterdam, The Netherlands, 2014; pp. 321–336. [Google Scholar]
- Anh, L.T.; Takagi, H.; Thao, N.D.; Esteban, M. Investigation of Awareness of Typhoon and Storm Surge in the Mekong Delta–Recollection of 1997 Typhoon Linda. J. JSCE B3 (Ocean Eng.) 2017, 73, I_168–I_173. [Google Scholar] [CrossRef] [Green Version]
- Yun, N.Y.; Hamada, M. Evacuation behavior and fatality rate during the 2011 Tohoku-Oki earthquake and tsunami. Earthq. Spectra. 2015, 31, 1237–1265. [Google Scholar] [CrossRef]
- Nomoto, H. Methodology of Education for Tsunami Disaster Prevention: Sharing the Experiences of Great East Japan Earthquake. J. Soc. Sci. Humanit. 2016, 512, 15–31. [Google Scholar]
- Kakimoto, R.; Fujimi, T.; Yoshida, M.; Kim, H. Factors promoting and impeding precautionary evacuation behaviour. IJUS Int. J. Urban Sci. 2016, 20, 25–37. [Google Scholar] [CrossRef]
- Takabatake, T.; Mäll, M.; Esteban, M.; Nakamura, R.; Kyaw, T.; Ishii, H.; Valdez, J.; Nishida, Y.; Noya, F.; Shibayama, T. Field Survey of 2018 Typhoon Jebi in Japan: Lessons for Disaster Risk Management. Geosciences 2018, 8, 412. [Google Scholar] [CrossRef] [Green Version]
- Lindell, M.K.; Prater, C.S.; Gregg, C.E.; Apatu, E.J.; Huang, S.K.; Wu, H.C. Households’ immediate responses to the 2009 American Samoa Earthquake and Tsunami. Int. J. Disaster Risk Reduct. 2015, 12, 328–340. [Google Scholar] [CrossRef]
- Cubelos, C.; Kularathna, A.; Bruno Valenzuela, V.P.; Iliopoulos, N.; Quiroz, M.; Yavar, R.; Henriquez, P.; Bacigalupe, G.; Onuki, M.; Mikami, T.; et al. Understanding Community-Level Flooding Awareness in Remote Coastal Towns in Northern Chile through Community Mapping. Geosciences 2019, 9, 279. [Google Scholar] [CrossRef] [Green Version]
- Shibayama, T.; Esteban, M.; Nistor, I.; Takagi, H.; Thao, N.D.; Matsumaru, R.; Mikami, T.; Aranguiz, R.; Jayaratne, R.; Ohira, K. Classification of tsunami and evacuation areas. Nat. Hazards 2013, 67, 365–386. [Google Scholar] [CrossRef]
- Hein, P. Expecting the unexpected: A case study on tsunami mitigation in Fujisawa (Japan). Environ. Hazards 2014, 13, 1–20. [Google Scholar] [CrossRef]
- Sun, Y.; Yamori, K. Risk management and technology: Case studies of tsunami evacuation drills in Japan. Sustainability 2018, 10, 2982. [Google Scholar] [CrossRef] [Green Version]
- Esteban, M.; Takagi, H.; Shibayama, T. Handbook of Coastal Disaster Mitigation for Engineers and Planners; Butterworth-Heinemann: Oxford, UK, 2015. [Google Scholar]
- Suppasri, A.; Abe, Y.; Yasuda, M.; Fukutani, Y.; Imamura, F. Tsunami Signs, Memorials and Evacuation Drills in Miyagi Prefecture After the 2011 Tohoku Earthquake Tsunami. In Handbook of Coastal Disaster Mitigation for Engineers and Planners; Elsevier: Amsterdam, The Netherlands, 2015; pp. 599–614. [Google Scholar]
- Viglione, A.; Di Baldassarre, G.; Brandimarte, L.; Kuil, L.; Carr, G.; Salinas, J.L.; Scolobig, A.; Blöschl, G. Insights from sociohydrology modelling on dealing with flood risk–roles of collective memory, risk-taking attitude and trust. J. Hydrol. 2014, 518, 71–82. [Google Scholar] [CrossRef]
- Esteban, M.; Bricker, J.; Arce, R.S.C.; Takagi, H.; Yun, N.; Chaiyapa, W.; Sjoegren, A.; Shibayama, T. Tsunami awareness: A comparative assessment between Japan and the USA. Nat. Hazards 2018, 93, 1507–1528. [Google Scholar] [CrossRef] [Green Version]
- Mas, E.; Suppasri, A.; Imamura, F.; Koshimura, S. Agent-based Simulation of the 2011 Great East Japan Earthquake/Tsunami Evacuation: An Integrated Model of Tsunami Inundation and Evacuation. J. Nat. Disaster Sci. 2012, 34, 41–57. [Google Scholar] [CrossRef] [Green Version]
- Pidgeon, N.; Hood, C.; Jones, D.; Turner, B.; Gibson, R. Risk perception. In Risk: Analysis, Perception, and Management; Royal Society Study Group, Ed.; The Royal Society: London, UK, 1992. [Google Scholar]
- Sugiura, M.; Sato, S.; Nouchi, R.; Honda, A.; Ishibashi, R.; Abe, T.; Muramoto, T.; Imamura, F. Psychological processes and personality factors for an appropriate tsunami evacuation. Geosciences 2019, 9, 326. [Google Scholar] [CrossRef] [Green Version]
- Yasuda, T.; Hatayama, M.; Shimada, H. National questionnaire survey of surfers awareness about tsunami evacuation. Saf. Sci. Rev. 2016, 2016, 61–80. [Google Scholar]
- Ito, T.; Setoguchi, T.; Miyauchi, T.; Ishii, A.; Watanabe, N. Sustainable Downtown Development for the Tsunami-Prepared Urban Revitalization of Regional Coastal Cities. Sustainability 2019, 11, 1020. [Google Scholar] [CrossRef] [Green Version]
- Nakasu, T.; Ono, Y.; Pothisiri, W. Why did Rikuzentakata have a high death toll in the 2011 Great East Japan Earthquake and Tsunami disaster? Finding the devastating disaster’s root causes. Int. J. Disaster Risk Reduct. 2018, 27, 21–36. [Google Scholar] [CrossRef]
- Basolo, V.; Steinberg, L.J.; Burby, R.J.; Levine, J.; Cruz, A.M.; Huang, C. The effects of confidence in government and information on perceived and actual preparedness for disasters. Environ. Behav. 2009, 41, 338–364. [Google Scholar] [CrossRef]
- Gray-Graves, A.; Turner, K.W.; Swan, J.H. Sustainability of seniors: Disaster risk reduction management. J. Aging Emerg. Econ. 2010, 2, 64–78. [Google Scholar]
- Faulkner, B. Towards a framework for tourism disaster management. Tour. Manag. 2001, 22, 135–147. [Google Scholar] [CrossRef]
- Rittichainuwat, B.N. Tourists’ and tourism suppliers’ perceptions toward crisis management on tsunami. Tour. Manag. 2013, 34, 112–121. [Google Scholar] [CrossRef]
- UNDRR. Available online: http://preventionweb.net (accessed on 3 April 2017).
- Census Data, Statistical Center of Iran. 2016. Available online: https://www.amar.org.ir (accessed on 26 October 2020).
- Van den Akker, J.; Bannan, B.; Kelly, A.E.; Nieveen, N.; Plomp, T. The Integrative Learning Design Framework: An Illustrated Example from the Domain of Instructional Technology, Educational Design Research-Part A: An Introduction; Netherlands Institute for Curriculum Development: Enschede, The Netherlands, 2013. [Google Scholar]
- Lawshe, C.H. A quantitative approach to content validity 1. Pers. Psychol. 1975, 28, 563–575. [Google Scholar] [CrossRef]
- Eiser, J.R.; Bostrom, A.; Burton, I.; Johnston, D.M.; McClure, J.; Paton, D.; Van Der Pligt, J.; White, M.P. Risk interpretation and action: A conceptual framework for responses to natural hazards. Int. J. Disaster Risk Reduct. 2012, 1, 5–16. [Google Scholar] [CrossRef] [Green Version]
- Sariolghalam, M. Rationality and Iran’s National Development; Farzan: Tehran, Iran, 2012. [Google Scholar]
- Weinstein, N.D. Effects of personal experience on self-protective behavior. Psychol. Bull. 1989, 105, 31. [Google Scholar] [CrossRef]
- Norris, F.H.; Smith, T.; Kaniasty, K. Revisiting the experience–behavior hypothesis: The effects of Hurricane Hugo on hazard preparedness and other self-protective acts. Basic Appl. Soc. Psych. 1999, 21, 37–47. [Google Scholar]
- Mavhura, E. Applying a systems-thinking approach to community resilience analysis using rural livelihoods: The case of Muzarabani district, Zimbabwe. Int. J. Disaster Risk Reduct. 2017, 25, 248–258. [Google Scholar] [CrossRef]
- Valenzuela, V.P.B.; Samarasekara, R.S.M.; Kularathna, A.; Perez, G.; Norikazu, F.; Crichton, R.N.; Quiroz, M.; Yavar, R.; Izumi, I.; Aranguiz, R.; et al. Comparative analysis of tsunami recovery strategies in small communities in Japan and Chile. Geosciences 2019, 9, 26. [Google Scholar] [CrossRef] [Green Version]
- Mohammad-pajooh, E.; Aziz, K.A. Investigating factors for disaster preparedness among residents of Kuala Lumpur. Nat. Hazards Earth Syst. Sci. Discuss. 2014, 2, 3683–3709. [Google Scholar] [CrossRef] [Green Version]
- Yasuda, M.; Muramoto, T.; Nouchi, R. Assessment of Educational Methods for Improving Children’s Awareness of Tsunamis and Other Natural Disasters: Focusing on Changes in Awareness and Regional Characteristics in Japan. Geosciences 2018, 8, 47. [Google Scholar] [CrossRef] [Green Version]
- Juran, L. The gendered nature of disasters: Women survivors in post-tsunami Tamil Nadu. Indian J. Gend. Stud. 2012, 19, 1–29. [Google Scholar] [CrossRef]
- Muttarak, R.; Pothisiri, W. The role of education on disaster preparedness: Case study of 2012 Indian Ocean earthquakes on Thailand’s Andaman Coast. Ecol. Soc. 2013, 18, 1–16. [Google Scholar] [CrossRef] [Green Version]
- Ngo, E.B. When disasters and age collide: Reviewing vulnerability of the elderly. Nat. Hazards Rev. 2001, 2, 80–89. [Google Scholar] [CrossRef]
- Finucane, M.L.; Slovic, P.; Mertz, C.K.; Flynn, J.; Satterfield, T.A. Gender, race, and perceived risk: The’white male’effect. Health Risk Soc. 2000, 2, 159–172. [Google Scholar] [CrossRef]
- Hines, R.I. Natural disasters and gender inequalities: The 2004 tsunami and the case of India. Race Gend. Class 2007, 14, 60–68. [Google Scholar]
- Samaddar, S.; Misra, B.A.; Tatano, H. Flood risk awareness and preparedness: The role of trust in information sources. In Proceedings of the 2012 IEEE International Conference on Systems, Man, and Cybernetics (SMC), Seoul, Korea, 14–17 October 2012; pp. 3099–3104. [Google Scholar]
- Wachinger, G.; Renn, O.; Begg, C.; Kuhlicke, C. The risk perception paradox—Implications for governance and communication of natural hazards. Risk Anal. 2013, 33, 1049–1065. [Google Scholar] [CrossRef] [PubMed]
- Paul, B.K. Factors affecting evacuation behavior: The case of 2007 Cyclone Sidr, Bangladesh. Prof. Geogr. 2012, 64, 401–414. [Google Scholar] [CrossRef]
- Veszteg, R.F.; Funaki, Y.; Tanaka, A. The impact of the Tohoku earthquake and tsunami on social capital in Japan: Trust before and after the disaster. Int. Political Sci. Rev. 2015, 36, 119–138. [Google Scholar] [CrossRef]
- Sun, L.; Su, G.; Tian, Q.; Qi, W.; Liu, F.; Qi, M.; Li, R. Religious belief and Tibetans? response to earthquake disaster: A case study of the 2010 Ms 7.1 Yushu earthquake, Qinghai Province, China. Nat. Hazards 2019, 99, 141–159. [Google Scholar] [CrossRef]
- Welton-Mitchell, C.; James, L.; Awale, R. Nepal 2015 Earthquake: A Rapid Assessment of Cultural, Psychological and Social Factors with Implications for Recovery and Disaster Preparedness. Int. J. Mass Emerg. Disasters 2016, 34, 55–74. [Google Scholar]
- Sherry, J.; Curtis, A. At the intersection of disaster risk and religion: Interpretations and responses to the threat of Tsho Rolpa glacial lake. Environ. Hazards 2017, 16, 314–329. [Google Scholar] [CrossRef]
- Bempah, S.A.; Øyhus, A.O. The role of social perception in disaster risk reduction: Beliefs, perception, and attitudes regarding flood disasters in communities along the Volta River, Ghana. Int. J. Disaster Risk Reduct. 2017, 23, 104–108. [Google Scholar]
- McLaughlin, L. In the wake of the tsunami: Religious responses to the great East Japan Earthquake. Cross Curr. 2011, 61, 290–297. [Google Scholar] [CrossRef]
- Kakar, D.; Naeem, G.; Usman, A.; Mengal, A.; Naderi Beni, A.; Afarin, M.; Ghaffari, H.; Fritz, H.; Pahlevan, F.; Okal, E.; et al. Remembering the 1945 Makran tsunami; interviews with survivors beside the Arabian Sea. UNESCO-IOC Brochure 2015, 1, 79. [Google Scholar]
- Said, A.M.; Mahmud, A.R.; Abas, F. Community preparedness for tsunami disaster: A case study. Disaster Prev. Manag. 2011, 20, 266–280. [Google Scholar]
- Siegrist, M.; Cvetkovich, G.; Roth, C. Salient value similarity, social trust, and risk/benefit perception. Risk Anal. 2000, 20, 353–362. [Google Scholar] [CrossRef] [PubMed]
- Cvetkovich, G.; Löfstedt, R. Social Trust and the Management of Risk; Routledge: Abingdon, UK, 2013. [Google Scholar]
- Dhanhani, H.A.G. Evaluation of the Response Capability of the United Arab Emirates (UAE) to the Impact of Natural Hazards; University of Bedfordshire: Luton, UK, 2010. [Google Scholar]
- Vaske, J.J.; Absher, J.D.; Bright, A.D. Salient value similarity, social trust and attitudes toward wildland fire management strategies. Hum. Ecol. Rev. 2007, 14, 223–232. [Google Scholar]
- Siegrist, M.; Cvetkovich, G.T.; Gutscher, H. Shared values, social trust, and the perception of geographic cancer clusters. Risk Anal. 2001, 21, 1047–1054. [Google Scholar] [PubMed]
- Nakayachi, K.; Ozaki, T. A method to improve trust in disaster risk managers: Voluntary action to share a common fate. Int. J. Disaster Risk Reduct. 2014, 10, 59–66. [Google Scholar] [CrossRef]
Figure 1.
Study sites in the Makran region, Gulf of Oman. Chabahar and Konarak are highly populated cities, and Tis and Ramin are rural areas. Sources: Google Earth, Data SIO, NOAA, U.S. Navy, NGA, GEBCO.
Figure 1.
Study sites in the Makran region, Gulf of Oman. Chabahar and Konarak are highly populated cities, and Tis and Ramin are rural areas. Sources: Google Earth, Data SIO, NOAA, U.S. Navy, NGA, GEBCO.

Figure 2.
Demographic characteristic of respondents: (a) age, (b) education, and (c) income distribution in the four study areas. Blue: Konarak, orange: Chabahar, and green: Tis and Ramin.
Figure 2.
Demographic characteristic of respondents: (a) age, (b) education, and (c) income distribution in the four study areas. Blue: Konarak, orange: Chabahar, and green: Tis and Ramin.

Figure 3.
Respondents’ basic knowledge regarding their familiarity with the definition of a tsunami, shown by the pie chart for (a) Chabahar, (b) Konarak, and (c) Tis and Ramin. The sources of information from which they had obtained their knowledge are depicted by the bar graph. Values were rounded off to two decimals.
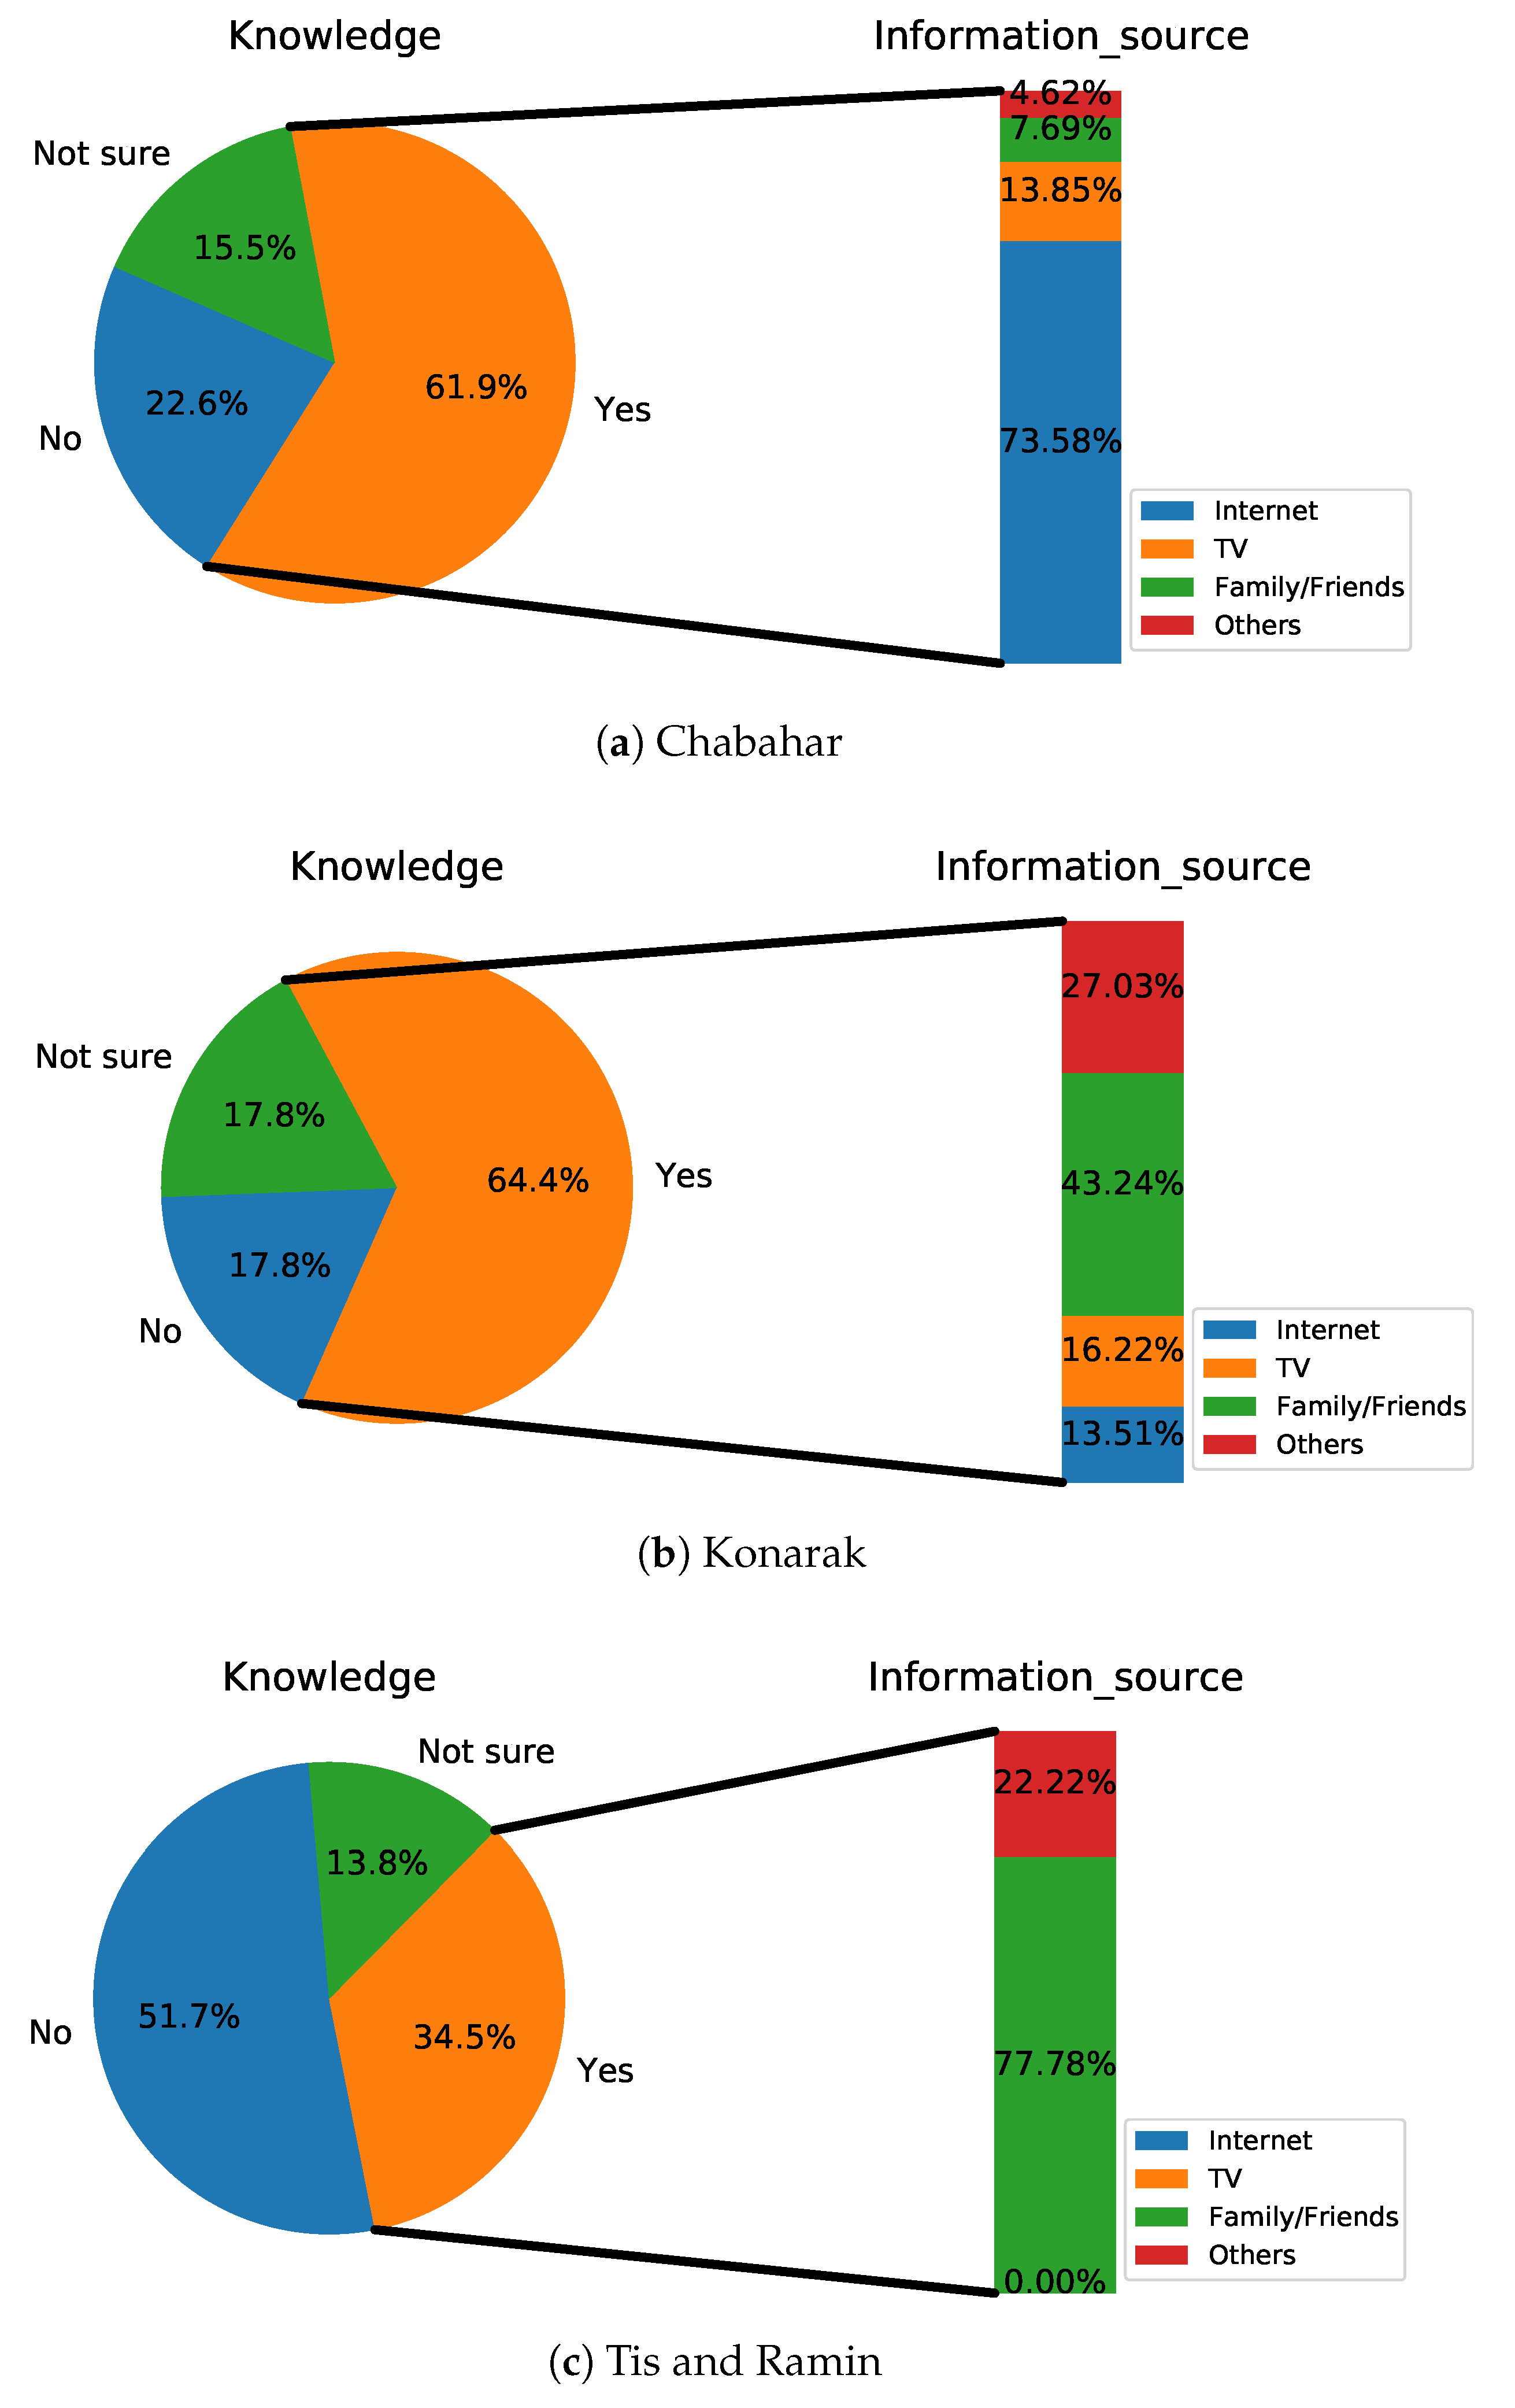
Figure 4.
Tsunami awareness and perception of danger according to respondents who had a basic knowledge of tsunamis, from “strongly disagree” (believing it will not happen in their area) to “strongly agree” (believing it will threaten their area). Values were rounded off to two decimals.
Figure 4.
Tsunami awareness and perception of danger according to respondents who had a basic knowledge of tsunamis, from “strongly disagree” (believing it will not happen in their area) to “strongly agree” (believing it will threaten their area). Values were rounded off to two decimals.
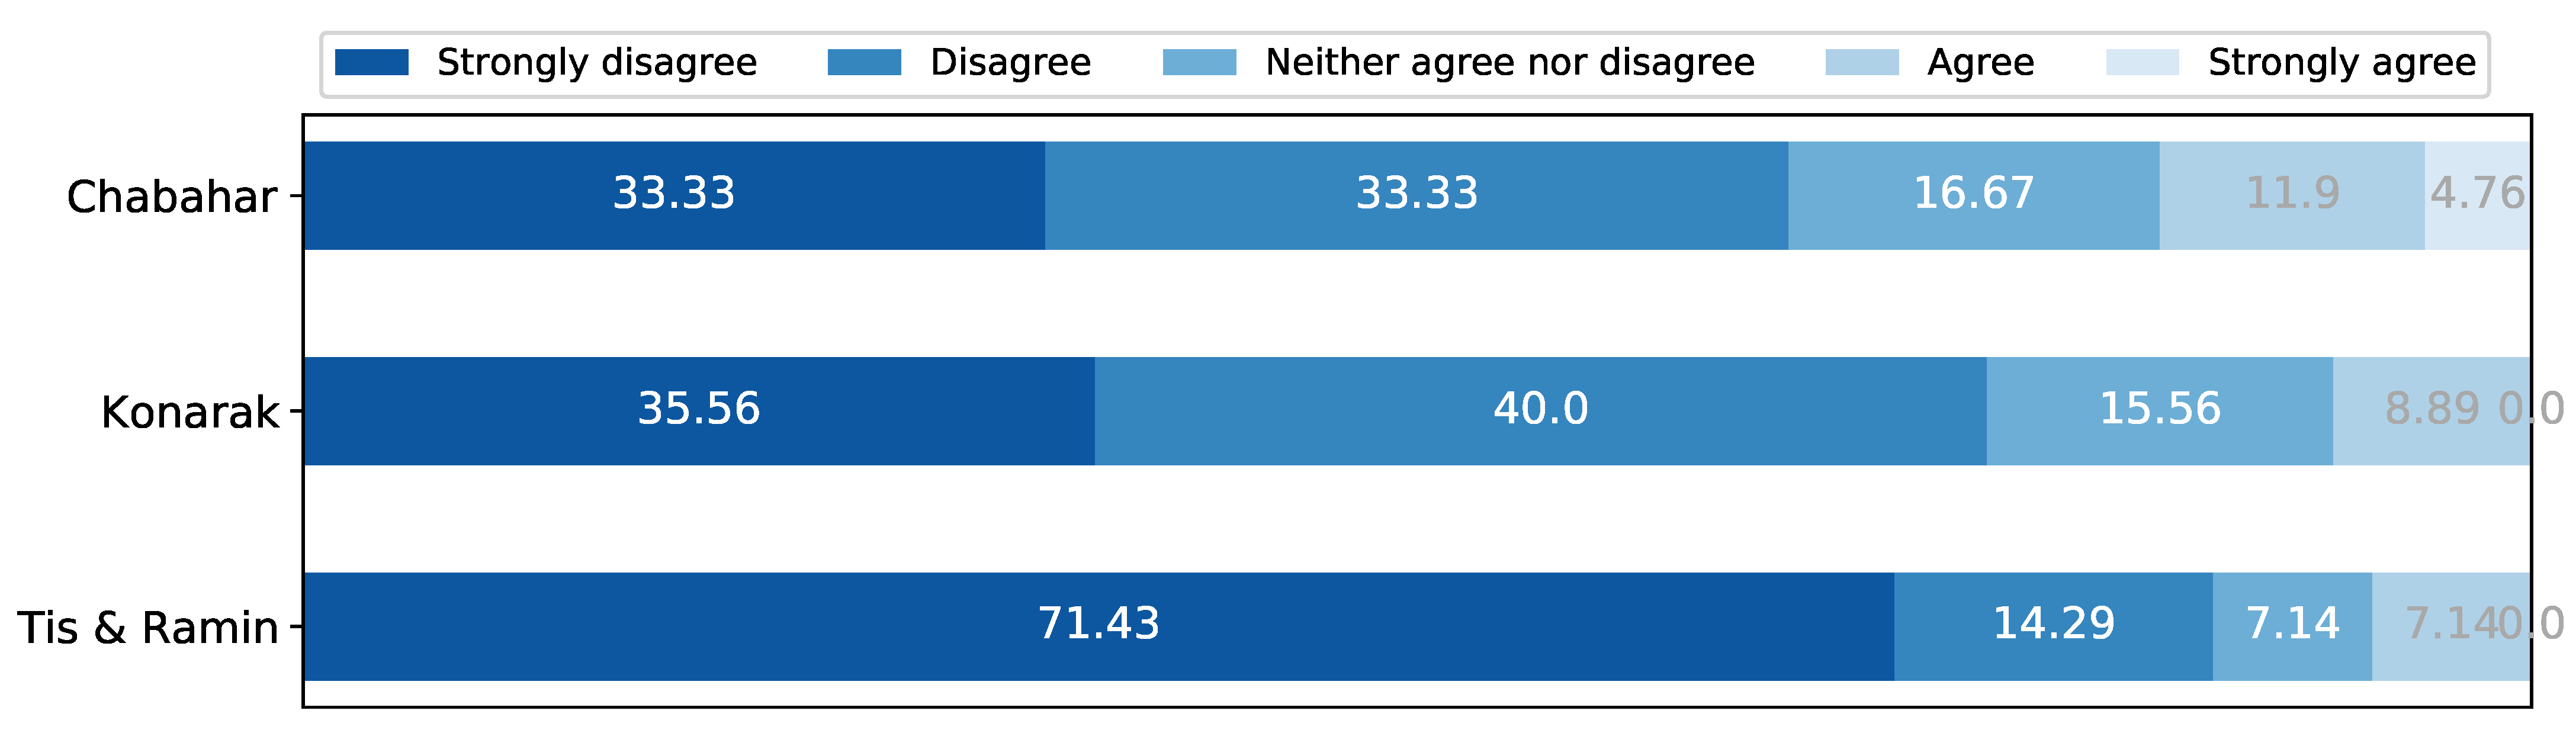
Figure 5.
Respondents’ reactions to their previous experiences of natural hazards. According to our pilot survey and consultations with the local experts (see Section 3.2), three choices were involved in the questionnaire: evacuated immediately, did not evacuate—trusting God, waited for other family members, and others not listed in the questionnaire.

Figure 6.
Respondents’ beliefs regarding whose actions prevent loss of life during natural hazards in blue: Konarak, orange: Chabahar, and green: Tis and Ramin.
Figure 6.
Respondents’ beliefs regarding whose actions prevent loss of life during natural hazards in blue: Konarak, orange: Chabahar, and green: Tis and Ramin.

Figure 7.
Average trust in the government’s ability to manage a disaster in three states: before a disaster, after a disaster, and in disaster education programs. From “strongly disagree” (distrust) to “strongly agree” (trust).
Figure 7.
Average trust in the government’s ability to manage a disaster in three states: before a disaster, after a disaster, and in disaster education programs. From “strongly disagree” (distrust) to “strongly agree” (trust).

Figure 8.
(a) p-values resulting from chi-square tests and analysis of variance (ANOVA) between different variables and demographic characteristics. (b) r-values resulting from the Pearson correlation coefficient.
Figure 8.
(a) p-values resulting from chi-square tests and analysis of variance (ANOVA) between different variables and demographic characteristics. (b) r-values resulting from the Pearson correlation coefficient.

Figure 9.
Hypothesis-based salient value sharing (SVS) framework for improving risk perception in Makran. It is suggested that the negative impact of religious attribution on risk management can become positive by seeking help from religious leaders.
Figure 9.
Hypothesis-based salient value sharing (SVS) framework for improving risk perception in Makran. It is suggested that the negative impact of religious attribution on risk management can become positive by seeking help from religious leaders.

Table 1.
Population and gender ratios in the four study areas based on the latest census data [46].
Table 1.
Population and gender ratios in the four study areas based on the latest census data [46].
| Area | Male | Female |
|---|---|---|
| Chabahar | 144,482 () | 138,722 () |
| Konarak | 40,933 () | 41,067 () |
| Tis | 3238 () | 3110 () |
| Ramin | 1982 () | 1839 () |
Table 2.
Sampling methodology and number of samples in each study area.
| Area | Chabahar | Konarak | Ramin and Tis | Fisheries |
|---|---|---|---|---|
| Sampling method | Random sampling in a high-density area of the city | GPS random sampling | Face-to-face interview | FGD |
| Number of samples | 153 | 45 | 24 | 3 |
Table 3.
Demographic characteristics of respondents.
| Chabahar (%) | Konarak (%) | Tis and Ramin (%) | ||
|---|---|---|---|---|
| Gender | Men | 55.95 | 57.42 | 70.83 |
| Women | 44.05 | 42.22 | 29.17 | |
| Age | 10–19 | 20.24 | 4.44 | 8.33 |
| 20–29 | 25 | 37.78 | 8.33 | |
| 30–39 | 29.76 | 31.11 | 16.67 | |
| 40–49 | 15.48 | 11.11 | 25 | |
| 50–59 | 5.95 | 8.89 | 25 | |
| ≥60 | 3.57 | 6.67 | 16.67 | |
| Education | No schooling | 17.86 | 35.56 | 66.67 |
| Primary | 15.48 | 31.11 | 25 | |
| High school | 36.9 | 26.67 | 8.33 | |
| University | 25 | 4.44 | 0 | |
| Higher | 4.76 | 2.22 | 0 | |
| Income (IRR) | ≤12,000,000 | 44.05 | 75.6 | 83.33 |
| 12,000,001–30,000,000 | 30.95 | 15.65 | 16.67 | |
| 30,000,001–50,000,000 | 17.86 | 6.67 | 0 | |
| >50,000,000 | 7.14 | 2.22 | 0 |
Table 4.
Quotes from survivors’ experiences in the 1945 Makran tsunami extracted from the literature.
Table 4.
Quotes from survivors’ experiences in the 1945 Makran tsunami extracted from the literature.
| Gender, Age at 1945 (Years Old) | Indicative Quotes |
|---|---|
| Male, 20 | Only a mosque survived, and the rest of the town was destroyed. |
| Male, 20 | We could not protect ourselves, but many of us prayed at the mosque that Allah may save us from any destruction. |
| Female, 20 | The roof of the shrine fell because of the earthquake. The sea did not go further than the mosque; Allah (God) stopped it. |
| Male, 12 | Before the sea went far onshore, I went to the mosque for the dawn prayer; the first wave happened, but it was small, so we began the prayer. |
| Male, 13 | This area was not flooded because of a shrine that would not allow the sea to enter. |
| Male, – | The story of the daughter of a just judge, she was either kidnapped or killed in Qalhaat, and thus causing the wrath of God upon the town. |
Publisher’s Note: MDPI stays neutral with regard to jurisdictional claims in published maps and institutional affiliations. |
© 2021 by the authors. Licensee MDPI, Basel, Switzerland. This article is an open access article distributed under the terms and conditions of the Creative Commons Attribution (CC BY) license (http://creativecommons.org/licenses/by/4.0/).
Share and Cite
MDPI and ACS Style
Salah, P.; Sasaki, J. Knowledge, Awareness, and Attitudes toward Tsunamis: A Local Survey in the Southern Coast of Iran. Sustainability 2021, 13, 449. https://0-doi-org.brum.beds.ac.uk/10.3390/su13020449
AMA Style
Salah P, Sasaki J. Knowledge, Awareness, and Attitudes toward Tsunamis: A Local Survey in the Southern Coast of Iran. Sustainability. 2021; 13(2):449. https://0-doi-org.brum.beds.ac.uk/10.3390/su13020449
Chicago/Turabian StyleSalah, Parastoo, and Jun Sasaki. 2021. "Knowledge, Awareness, and Attitudes toward Tsunamis: A Local Survey in the Southern Coast of Iran" Sustainability 13, no. 2: 449. https://0-doi-org.brum.beds.ac.uk/10.3390/su13020449
Note that from the first issue of 2016, this journal uses article numbers instead of page numbers. See further details here.