Article

The Effect of Individual’s Technological Belief and Usage on Their Absorptive Capacity towards Their Learning Behaviour in Learning Environment

1
Faculty of Engineering and IT, School of Information, Systems and Modelling, University of Technology, Sydney, NSW 2007, Australia
2
Business School, Harbin University of Commerce, Harbin 150028, China
*
Author to whom correspondence should be addressed.
Sustainability 2021, 13(2), 718; https://0-doi-org.brum.beds.ac.uk/10.3390/su13020718
Submission received: 10 November 2020 / Revised: 8 January 2021 / Accepted: 11 January 2021 / Published: 13 January 2021
(This article belongs to the Special Issue Sustainable Information Systems)

Abstract

:
Absorptive capacity is a common barrier to knowledge transfer at the individual level. However, technology absorptive capacity can enhance an individual’s learning behaviour. This study investigates that technology readiness, the tools for knowledge sources, social influences, and social networks influence an individual’s absorptive capacity on an adaptation of the individual learning behaviour. A quantitative approach is used to assess the presence of a causal relationship from the constructs mentioned above. Data were collected from university students in Australia to examine the hypotheses. With 199 responses, a partial least squares structural equation modelling (PLS-SEM) approach was used for the analysis. The results generated mixed findings. Individual’s technological belief in optimism and innovation and social influences had a significantly weaker effect on individual absorptive capacity, which in turn had a significantly weaker impact on their learning behaviour.

1. Introduction

For organisations to succeed, knowledge is critical and assists as a dynamic capability, managing a sustained competitive advantage [1,2,3,4,5,6,7,8]. Managers who do not leverage knowledge are risking their organisation’s operations [9]. Organisations that understand the importance of knowledge spend a lot of resources to manage it [10]. Knowledge transfer barriers can still exist even if organisations entirely designate to knowledge management [11]. An arduous rapport between the knowledge holder and recipient, causal ambiguity, and a recipient’s absorptive capacity (ACAP) is the most common hurdle to knowledge transfer [11,12]. ACAP plays a mediating role between knowledge and technology adaptation [13].
On the other hand, individual motivation has been the success factor in knowledge transfer [11]. A solution to underlying ambiguity and arduous connection between knowledge owner and the recipient is implementing a horizontal structure in an organisation [3,14,15]. This structure allows for communication flow across business functions, unlike the vertical structure counterpart [6]. The recipient’s ACAP remains a common barrier at the individual level without easily discernible mitigation.
Different types of knowledge are associated with various absorptive capacities [16], such as technology absorptive capacity refers to the recognition adaptation of new technical information and knowledge. Individuals obtain knowledge through multiple pathways, such as observation, experience, or acquisition. An individual acquires knowledge due to the difficulties they encounter, hence the challenges it intends to solve. Individuals choose challenges to identify threats and opportunities in the external environment, further developing triggers for actions. Consequently, an individual takes its learning path, and the extent of learning is formed by the absorptive capability to address those challenges. Due to rapid technological advancements, technology is essential to empower individuals to learn rapidly in the knowledge society. Technological information is a compelling amalgamation of technical experiences, knowledge, and social values that provide a powerful individual absorptive capacity source. For instance, mandating assistive learning technology in American campuses in 1990 helped students with learning disabilities beyond their education [17]. However, learning intent is a necessary antecedent [18], and beliefs also affect behaviour [19].
According to Daghfous [20], internal and external factors govern the changes in absorptive capacity. Internal factors consist of the tools for knowledge sources and technology readiness. While for external factors, social networking services consolidate external knowledge. The assimilation capability of ACAP, which represents understanding and comprehension, is formed by group heuristics [21]. For example, social influence (SI), tools for knowledge sources (TKS), and social networks (SN) can potentially improve student learning, foster collaboration, and enhance creativity [22]. However, the relation between individual absorptive capacity and these dynamic capabilities must be examined empirically. In this context, this study intends to empirically reveal that technology readiness, the tools for knowledge sources, social influences, and social networks will favour the development of individual absorptive capacity. This paper addresses the research question: what is the impact of an individual’s technological belief and other factors on their capability to absorb knowledge towards their learning behaviour?
The paper is organized into the following sections. The theoretical background and hypotheses development section introduces the different conceptual frameworks used and the hypothesis formulated. The research methodology section explains the chosen approach and its method to collect data and generate the results. The results are then provided with an explanation of the measurement used. Finally, the paper concludes with a discussion about said results and limitations and further recommendations.

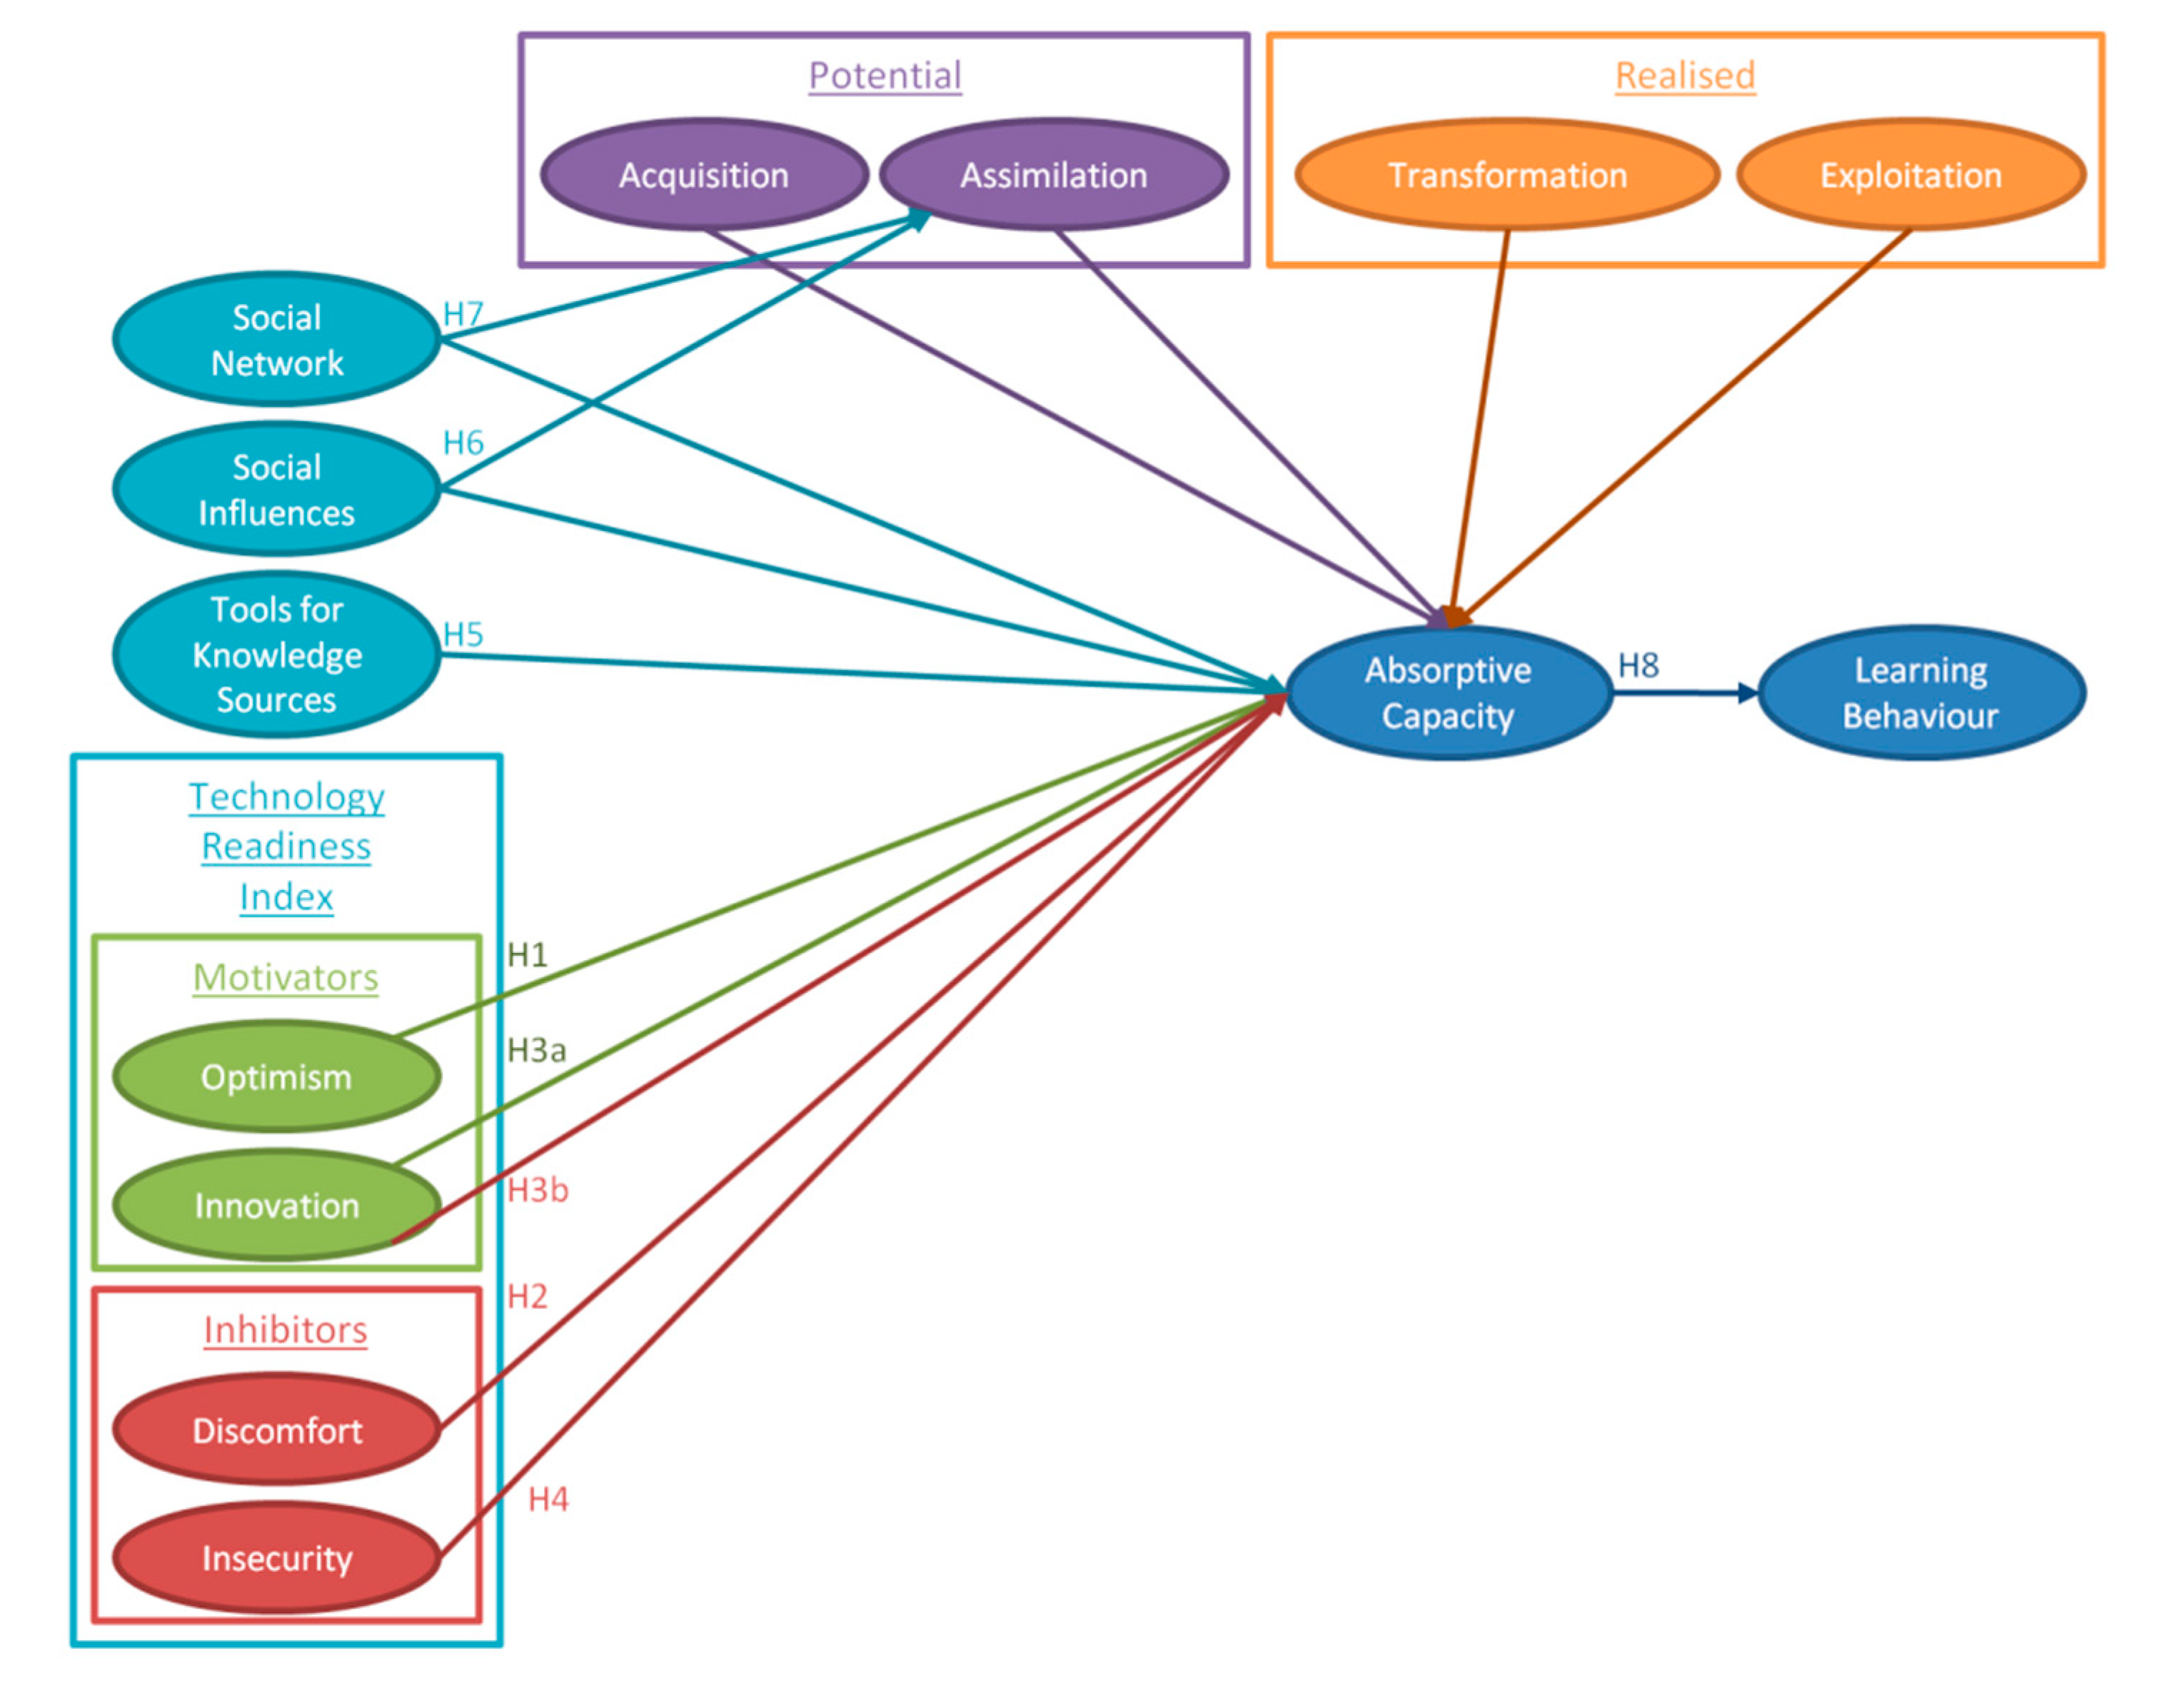
2. Theoretical Background and Hypotheses Development

2.1. Absorptive Capacity (ACAP)

ACAP was first introduced by Cohen and Levinthal [23] to identify, assimilate, and apply external knowledge. ACAP is the process of absorbing knowledge from external sources, and it differs from formalizing new knowledge, which is known as retentive capacity [11]. In the last three decades, ACAP has been accepted as an important construction for IS scholars to study knowledge transferring in various levels and contexts [24,25,26,27]. In ACAP studies, understanding the structure of the process involved caused many research interests [28,29]. Amongst those studies, Zahra and George’s [20] framework plays an essential position. It provides a procedural view of ACAP as a dynamic capability and suggests that the construct has two general states and four processes as the followings. The knowledge object is first acquired in acquisition capability [20]. The assimilation ability that enables the knowledge is then extracted from the object [20]. Hence, social integration mechanisms differentiate assimilation from transformation [20]. The knowledge processes are re-configured in transformation [20]. The more effort to unlearn and relearn the new process will be required as prior knowledge processes are deeper [30]. Exploitation capability is where knowledge has its value returned by being used [20].
This ACAP framework is dynamic [20]. A capability is dynamic when it gains an advantage, and its dimensions expand as the resources and competencies are combined [31]. The framework has been used at an individual level [32]. Cohen and Levinthal [23] (p.131) state that “an organization’s absorptive capacity will depend on the absorptive capacities of its individual members” and that “a firm’s absorptive capacity is not simply the sum of the absorptive capacities of its employees”. As individuals are part of organisations [23], an organisation’s knowledge transfer stems from individual behaviour [33]. ACAP was initially conceptualised from individuals’ learning cognitive ability [23], but individual ACAP as a barrier remains little researched [32,33]. Therefore, it is still necessary for us to revisit ACAP at the individual level to resolve conflicting results from ACAP studies at the group, organizational, and inter-organizational levels. Findings would offer insights as to which individual technological beliefs and other factors would impact an individual’s learning capability to their learning behaviour. There is an interest in understanding the technological factors that influence knowledge absorptions at the individual level. Figure 1 shows the research model.

2.2. The Benefits of Technology in Learning

Technology changes and impact permeate much of human work processes [34]. In the early nineteen nineties, students with learning disabilities were introduced to assistive technologies on American campuses [35]. Such technologies would include word processors, spell checkers, outlining, speech recognition, screen readers, personal data managers, and many more [16]. Following their introduction, students wrote better assignments, as these technologies enabled them to iterate when writing [36]. Those technologies would still be used by those students outside of their tertiary education [37]. Today, such technologies are accepted standards and are currently used by people with no learning disabilities.
Technology allows content and pedagogy to be transformed [38,39] that can enhance learning [17]. Selecting the right technology for learning will depend on its impact on a person who can be different for each individual [40]. Nevertheless, education is turning towards technologies to enhance learning experiences [41]. There is an increasing interest in understanding how technologies affect students and their abilities beyond their formal education [42].

2.3. Technology Readiness Index (TRI)

To better profile their customers as self-service technologies rose, organisations needed a framework. Parasuraman [43] proposed the Technology Readiness Index (TRI), which measures people’s technological inclination. TRI is not to be confused with the Technology Readiness Level (TRL). The two are different levels of a technology’s development, first developed by NASA [44]. Since the original conception of the TRI, it has a new version called TRI 2.0, which retains its core dimensions [45]:
  • Optimism represents the trust that technology deals more flexibility, control, and efficiency [43].
  • Innovation is when technology is a pioneer or leader [43].
  • Insecurity is the disbelief of technology [43].
  • Discomfort is the perceived lack of control over technology and the feeling of being overwhelmed [43].
As optimism and innovation motivate individuals to use technology, they are considered motivators [43]. Walczuch et al. [46] later found that innovation negatively impacted perceived usefulness. As insecurity and discomfort inhibit technology adoption, these are viewed as inhibitors [43]. Unlike the Technology Acceptance Model (TAM), TR focuses on individuals, which focuses on systems [47]. Research has already examined the relationship between TAM and TRI [46,48]. TR is individual specific in contrast to the system-specific TAM [47]. The TR is better suited for research into individual ACAP. Figure 1 shows the research model.
The definition of optimism is “a positive view of technology and a belief that it offers people increased control, flexibility, and efficiency in their lives” [43]. The word “belief” implies that it is closer to potential than being real. Optimism is a positive view [43,46]. Optimism is a motivator [43] and has high potential; it would be positively associated with individual ACAP. Using the insights from the above models, in what follows, the hypotheses explored in this paper are described:
Hypotheses 1 (H1).
Optimism positively influences individual ACAP.
The definition of insecurity is “a distrust of technology, stemming from skepticism about its ability to work properly and concerns about its potentially harmful consequences” [43]. The word “potential” is stated. Insecurity has a strong connotation with negativity [46]. As insecurity is an inhibitor [43] and has potential, it would negatively affect individual ACAP.
Hypotheses 2 (H2).
Insecurity negatively influences individual ACAP.
Innovation is defined as “a tendency to be a technology pioneer and thought leader” [43]. As innovation is a motivator [43] and accurate, it would be positively associated with individual ACAP.
Hypotheses 3a (H3a).
Innovation positively influences individual ACAP.
Innovation can impact ACAP differently. It can have a negative perception [46]. Innovation does not always improve performance [49].
Hypotheses 3b (H3b).
Innovation negatively influences individual ACAP.
Discomfort is defined as “a perceived lack of control over technology and a feeling of being overwhelmed by it.” [43]. The tense is in the past, which suggests that it has been realised. Discomfort is a negative experience [46]. It would negatively affect individual ACAP.
Hypotheses 4 (H4).
Discomfort negatively influences individual ACAP.

2.4. Tools for Knowledge Sources (TKS)

Technologies can encourage knowledge management and transfer [10]. For example, organisations can implement knowledge management systems to manage knowledge [3,50,51,52]. The tools or techniques used to access knowledge sources could be referred to as tools for knowledge sources (TKS). These often attempt to capture both tacit and explicit knowledge in organisations to be reused [52,53]. Tacit knowledge can be disputed or misinterpreted [54]. It cannot be reduced or codified into information [55]. This makes knowledge harder to encode, which increases its difficulty to transfer [5] (pp. 4–5) [6]. Hence, the type of knowledge, such as explicit or tacit, affects its transfer [18]. TKS are meant to make learning more efficient by delivering content in a malleable manner [40].
Knowledge management systems treat knowledge as if it is some stock and can be ineffective at managing knowledge [2,56]. Data in a repository are not knowledge [6,23]. However, transforming data into knowledge is still tricky for technology [54]. These systems must present experience efficiently and effectively to be easily comprehended and appropriately assimilated by its user [52]. Said assimilation relies on social interactions, which can make it very slow [54]. The effectiveness of these systems for its users to absorb its knowledge depends on a culture that develops and shares knowledge, which requires nurturing trust in technology and people [53,57].
The evaluation of these systems is essential, as organisations considerably invest financially into these [58,59]. Antecedents such as knowledge sources can affect ACAP differently, leading to different performance [60]. Therefore,
Hypotheses 5 (H5).
Tools for knowledge sources positively influence individual ACAP.

2.5. Social Influences (SI)

Assimilation relies on comprehension and understanding, which is shaped by group heuristic [20]. Social processes influence these group heuristics. Kelman [61] proposes the three social approaches of compliance, identification, and internalisation, which is called social influences (SI):
  • Compliance is described as when an individual accepts influence, because he wishes to please another person or group to obtain a reward or avoid punishment while still disagreeing with said person’s or group’s value [61].
  • Identification often means that an individual accepts and defines himself based on the influence of another person or group [61].
  • Internalisation is when an individual accepts influence, because the values presented match his own [61].
The assimilation of knowledge relies on comprehension and understanding [20]. This is shaped by group heuristics and communication shape [20,62]. SI affects communication and heuristics [61]. SI affects an individual’s ACAP through assimilation.
Hypotheses 6 (H6).
Social influences positively influence individual ACAP (assimilation).

2.6. Social Networks (SN)

SN refers to using online spaces to connect, communicate, share, socialise, entertain, work, and so forth [22,39]. SN allows extensive access to different sources of information [22]. With the introduction of mobile device applications, SN’s popularity is increasing, especially with lonely or young adults [22,63,64,65]. As a communication tool, SN is capable of combining interpersonal and mass communication together [22,65,66]. While websites are focused on interests and their communities, SN is centred around people [66]. SN provides the opportunity to connect individuals with similar interests that otherwise could not [22,67]. SN facilitates creating new and adding latent ties [22,67,68], which can become stronger ones [67]. However, most SN users are not looking to make a new connection but instead seek to extend their existing SN [22,66,68,69]. SN is dependent on reciprocal trust, which acts as a social glue [70].
In the context of learning, SN can potentially improve student learning, foster collaboration, and enhance creativity [21] if integrated adequately with education [22]. As teachers interact with their students via SN, they can learn from them [22]. SN can also allow for groups to act in concert without users knowing each other [70]. However, SN can have multiple negative consequences such as relationship problems, reduced academic performance, or decreased community engagement [22,71]. SN can have both a positive and negative impact on students [22].
The collaborative and interactive nature of SN has tremendous learning potential [22]. SN is used to connect, communicate, share, socialise, entertain, work, and so on [22,39]. They provide the opportunity to connect individuals with similar interests that otherwise could not [22,67]. They can potentially improve learning, foster collaboration, and enhance creativity [21].
Hypotheses 7 (H7).
Social networks positively influences individual ACAP (assimilation).

2.7. Beliefs Affects Learning Behaviour

Behaviour is influenced by beliefs [19], among other factors such as cognition and affection [72]. Behaviours about learning in a technological context would be described as technological learning behaviour. The individual work performance revised by Koopmans et al. [73] generally consists of task performance, contextual and adaptive performance, and counterproductive work behaviour [73]:
  • Tasks performance is made of explicit behaviours, including fundamental responsibilities defined in the job description [74].
  • Contextual performance is described as the organisational, social, and psychological behaviours that support the work environment’s technical function [73]. This is often referred to as team spirit [74].
  • Adaptive performance refers to an individual’s ability to adapt and acclimatise to change in a dynamic work environment [73,74]. While contextual interpretation is proactive and adaptive performance is reactive, both can support organisational, social, and psychological behaviours [73].
  • Counterproductive work behaviour describes behaviour that can harm an organisation or its members [75], such as off-task behaviour, absenteeism, addiction, and theft [73,76,77].
While frameworks can, at times, be poor, they can still offer advantages and remain helpful [34]. The learning behaviour can be used to construct generic questionnaires [73]. Missing some items is not critical [73]. The learning behaviour can be adapted to assess an individual’s learning behaviour. As behaviour is influenced by beliefs [19], if an individual’s technological belief and usage affects their ACAP, it would also influence their learning behaviour in a technology context.
Hypotheses 8 (H8).
Individual’s ACAP positively influences their learning behaviour.

3. Research Methodology

A quantitative approach is used to provide empirical evidence. Quantitative research seeks to provide truth using an objective scientific method [78]. It is suited to confirm theories [79] (p.22). It provides methods that use statistical or numerical data to test theories [80]. It uses statistical analysis on numerical data to test hypotheses [78]. As Fowler and Lapp [81] state: “a larger population sample reduces the chance of outliers”. Additionally, small sample sizes might not gather enough data to support hypotheses [81]. Confirming a theoretical causal effect with a large population sample would provide the findings with extrapolation with a credible generalisation. To gather numerical data, online questionnaires are used. Data were collected from university students in Australia. Participants were asked to fill out a closed-ended questionnaire on a five-point Likert scale. For testing the hypotheses, PLS-SEM is used. The research’s model is made of formative and reflective constructs. Reflective measures are when indicators are caused by the construct (arrows pointing from the construct to the indicator) [82]. Previously validated measurement items were adopted and modified to warrant the measurement items’ adequate reliability and validity. Appendix A shows all items used in the study. The indicators for the TR dimension were modified from Parasuraman and Colby [45]. The indicators used for learning behaviour were derived from Koopmans et al. [73] and Pradhan et al. [74]. As personality and attitudes cause something observable, these indicators are realised. Therefore, these are modelled as reflective [83,84]. When a combination of indicators makes a construct, then they should be formative [84]. TKS indicators were derived from Adeyinka et al. [59] and Ozkan et al. [85]. SN refers to online sites and services that allow individuals to connect and interact with one another [22]. SN indicators were adapted from Gupta and Bashir [22]. The different set of indicators that make SI in the model were derived from Venkatesh et al. [86]. Acquisition, assimilation, transformation, and exploitation are interdependent [20]. As these indicators make the construct, they have been set to formative.
Construct modelling can be performed with higher-order constructs (HC) [87]. The two-stage approach has a better parameter recovery of paths pointing from and to the HC and exogenous construct in the path model [87]. Acquisition, assimilation, transformation, and exploitation are all dynamic capabilities of ACAP that are interdependent [20]. As all components are formative, the preferred HC is formative–formative.
SEM is the technique of choice when the objective is to test cause–effect relationship models with latent variables [82]. When the structural model has formative constructs, then the preferred approach is PLS-SEM [88]. PLS-SEM offers many benefits when correctly applied [89]. PLS-SEM can deal with more problems [89]. Even though PLS-SEM is a preferred method for predictions [89,90], it is also appropriate for theory confirmation [88]. The disjoint two-stage approach can assess the structural model [87]. As the purpose of this paper is to provide evidence of a causal effect between conceptual frameworks, PLS-SEM remains an appropriate method to predict and confirm said causal effect. Every model, every distribution, every set of parameter values, and every sample size shows no such thing as the perfect estimation method [91]. An objective mind should highlight the advantages and limitations of any technique [91].
In assessing the measurement model, the loading of reflective indicators must be above 0.4 [92] (p. 103). The composite reliability of constructs needs to be between 0.6 and 0.95, the average variance extract should be above 0.50, and the heterotrait–monotrait should also be below 0.85 [88]. Formative indicators should not have weights that are not significant (above 0.05) and whose loading is below 0.5 and again not significant (above 0.05) [88]. Weights should also be between +1 and −1 [88]. The structural model’s VIF values must be below 3. The p-value should be below 0.05, which is the statistical significance threshold. The R2 values are used to determine the construct’s effect with 0.75 as substantial, 0.50 as moderate, 0.25 as weak, and depending on the discipline to accept it, 0.10 as very weak [88]. High-order constructs structural model can be assessed using the disjoint two-stage approach, unlike the repeated indicator approach, which can introduce small biases [87].

Data Collection Procedure
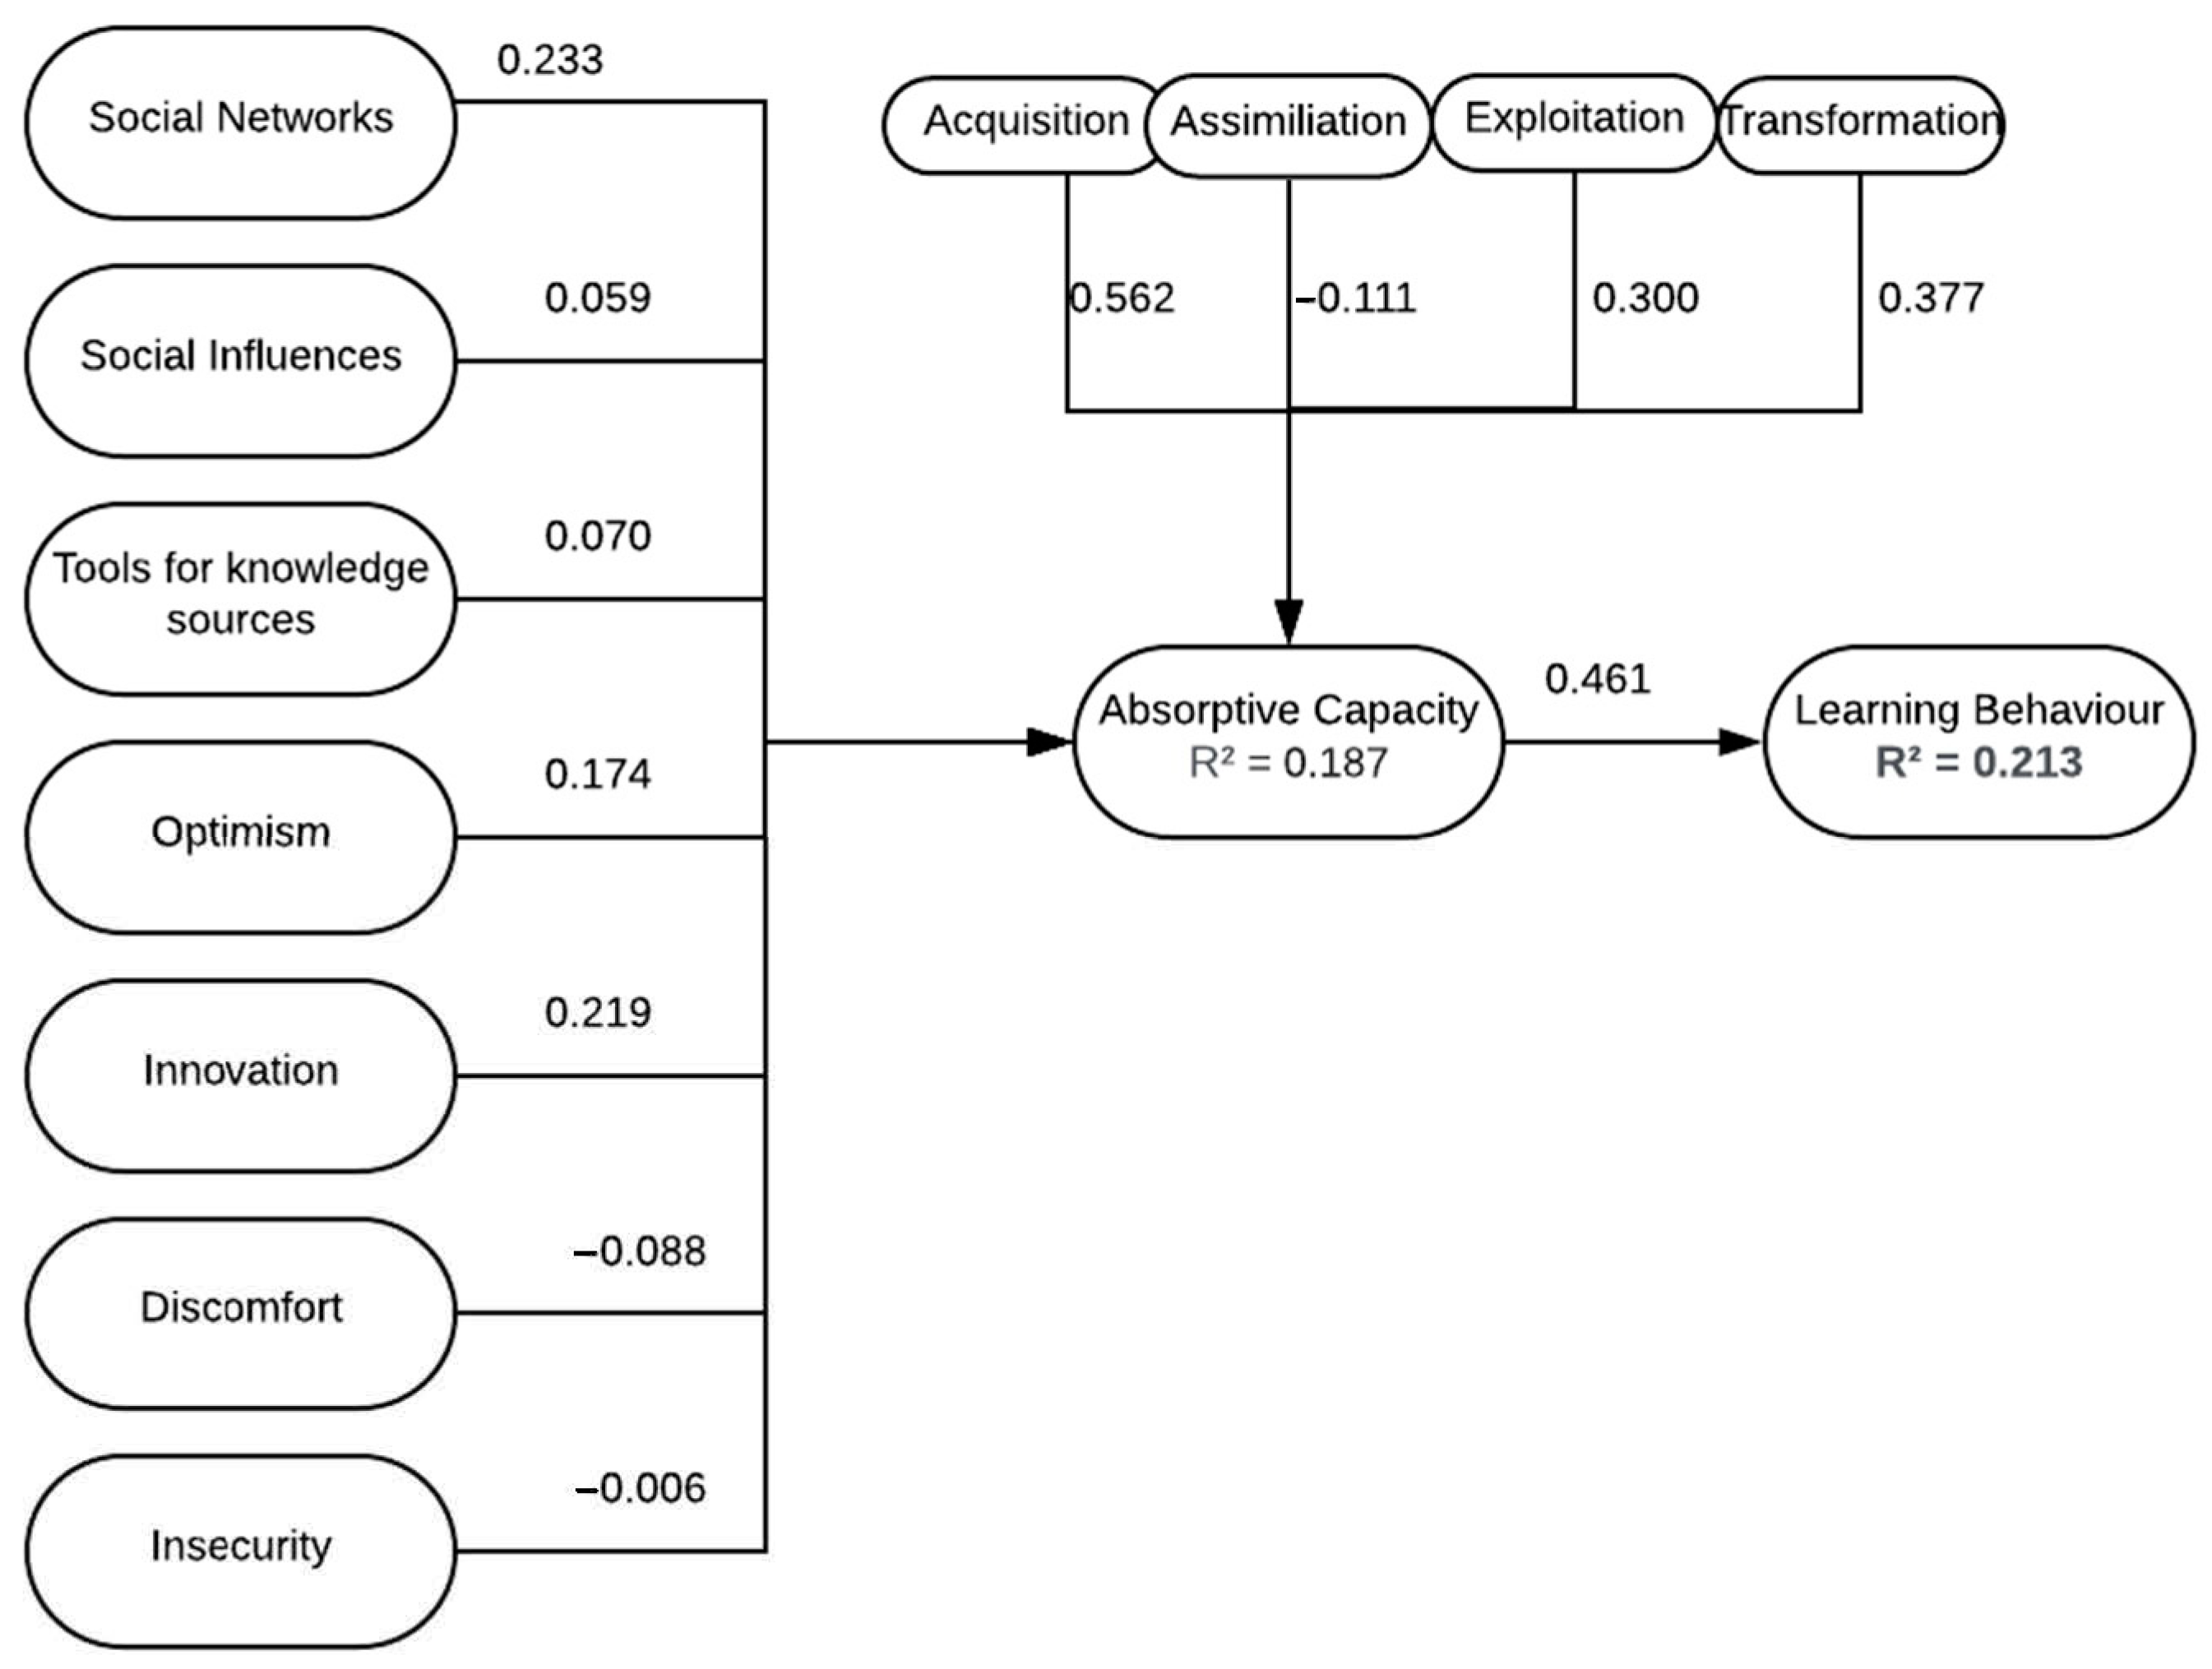
The questionnaire was hosted on Qualtrics, which is an online web survey platform. Records whose progress was not “100” were filtered out, leaving 204 completed records. As this research’s context is universities, participants who had answered that they were not studying for a bachelor’s or master’s degree or PhD were also omitted, leaving 199 completed records.

4. Results

SmartPLS v3 was used to perform the PLS-SEM analysis. The evaluation of PLS-SEM results requires first assessing the measurement model and then the structural model [88].

4.1. Measurement Model

The measurement model includes reliability and validity assessments. For reflective indicators, reliability and validity were assessed using external consistency, convergent validity, and discriminant validity. Outer loadings are recommended to be above 0.708; however, they must be removed if under 0.4 [92] (p. 103) (see Table 1). For the item weight, Jöreskog’s composite reliability (CR) should be above 0.60 and below 0.95 [88] (see Table 2). For convergent validity, the average variance extract (AVE) should be above 0.50 [88] (see Table 2). For the discriminant validity, heterotrait–monotrait ratio (HTMT) should be less than 0.90, although 0.85 is preferred [88,93] (see Table 3). For indicator collinearity, the variance inflation factor (VIF) of all items was below 3 [88]. For statistical significance, if the indicator’s weight must be either below 0.05 or its outer loading must not be between 0.5 and 0.05 [94]. For the relevance of the indicator weights, weights should be between 1 and −1 [88].
The results were generated using the PLS-SEM algorithm with the weighting scheme set to “Path”, maximum iteration set to “300”, and stop criterion set to “7” and using bootstrapping with “5000” sample, with “complete bootstrap”, and “Bias-Corrected and Accelerated (BCa) Bootstrap (default)” to reduce skewness.

4.2. Structural Model Assessment

Table 4 shows the structural model results. While collinearity issues can still exist with VIF scores below 3, the Stage 1 collinearity statistics VIF values are all below the said score, with the highest value at 2.9. This should ensure that all formative indicators are statistically significant and do not bias the regression results of the structural model. The Stage 2 disjoint approach calculates its results using the latent variable scores from Stage 1.
While collinearity issues can still exist with VIF scores below 3, the disjoint Stage 2 collinearity statistics VIF values are below the said score with the highest value being transformation at 2.2. This should ensure that all formative indicators are statistically significant and do not bias the regression results of the structural model.

4.3. Hyptheses Testing

The structural model should be assessed again that VIF scores are below 3 to ensure no regression bias, and test significance with a p-value below 0.05 and the coefficient of determination R2 to determine the strength of the effect [88]. The p-values of the path coefficient were generated using bootstrapping with “5000” sample, “complete bootstrap”, and “Bias-Corrected and Accelerated (BCa) Bootstrap (default)” to reduce skewness. The path coefficient and R2 values were generated using the PLS-SEM algorithm with the weighting scheme set to “Path”, maximum iteration set to “300”, and stop criterion set to “7”. Figure 2 shows the hypotheses testing.
The results produced from the PLS-SEM determine if said hypotheses are accepted or not based on the statistical significance. The R2 score determines the strength of the effect. “Optimism -> Absorptive Capacity” path coefficient p-value of 0.041 is below 0.05, which is significant. The null hypothesis is rejected. The path coefficient value of 0.174 is positive. While some disciplines accept R2 values as low as 0.10, the ACAP R2 value of 0.187 is beneath the weak threshold of 0.25 and thus very weak. “Insecurity -> Absorptive Capacity” path coefficient p-value of 0.946 is not significant. The null hypothesis is not rejected. “Innovation -> Absorptive Capacity” path coefficient p-value of 0.002 is significant. The null hypothesis is rejected. The path coefficient value of 0.219 is positive. This hypothesis is not rejected. Again, the ACAP R2 value of 0.187 is above 0.10 but still beneath 0.25. “Innovation -> Absorptive Capacity” path coefficient p-value of 0.002 is significant. The null hypothesis is rejected. The path coefficient value of 0.219 is not negative. This hypothesis is rejected. Innovation does not have a negative influence on individual ACAP. “Discomfort -> Absorptive Capacity” path coefficient p-value of 0.289 is not significant. The null hypothesis is not rejected.
“Tools for Knowledge Sources -> Absorptive Capacity” path coefficient p-value of 0.348 is not significant. The null hypothesis is not rejected. “Social Influences -> Absorptive Capacity” path coefficient p-value of 0.379 is not significant. The null hypothesis is not rejected. “Social Networks -> Absorptive Capacity” path coefficient p-value of 0.003 is significant. The null hypothesis is rejected. The path coefficient value of 0.233 is positive. Again, the ACAP R2 value of 0.187 is above 0.10, which is very weak. “Absorptive Capacity -> Learning Behaviour” path coefficient p-value of 0.000 is significant. The null hypothesis is rejected. The path coefficient value of 0.461 is positive. Learning behaviour R2 value of 0.213 is above the very weak threshold of 0.10 and close but still below the weak threshold of 0.25.
Further research on the use in stage two of unstandardised latent variable scores from stage one is required to address the use of confirmatory tetrad analysis (CTA-PLS), PLSpredict, or importance performance map analysis (IPMA) [87]. The PLS algorithm was executed with the weighting scheme set to “Path”, maximum iteration set to “300”, and stop criterion set to “7”. Bootstrapping was executed with “5000” sample, with “complete bootstrap”, and “Bias-Corrected and Accelerated (BCa) Bootstrap (default)” to reduce skewness. All the values used in the assessment of measurements model and structural model are within acceptable results. These results follow the recommended guidelines. Optimism, innovation, and SN have a very weak significant effect on individual ACAP, and individual ACAP has a weak significant effect on learning behaviour. Other hypotheses have been rejected.

5. Discussions, Implications, and Conclusions

By using a quantitative approach, this study provided empirical results. The findings show that optimism and innovation have a very weak significant positive effect on an individual’s ACAP. However, innovation could be perceived negatively; [46] discovered that it could also be perceived negatively, as it does not always improve performance [49]. However, the results did satisfy that innovation does not have a very weak significant adverse effect on an individual’s ACAP. Insecurity is distrusting technology, stemming from scepticism about its ability to work appropriately and concerns about its potentially harmful consequences [43]. Discomfort is the perceived lack of control over technology and a feeling of being overwhelmed by it [43]. However, insecurity and discomfort does not have a significant effect on an individual’s ACAP. Knowledge sources are an antecedent to ACAP, which can affect ACAP differently, which can lead to different performance [60]. Organisations invest considerably into tools for knowledge sources [58,59]. However, TKS do not have a significant effect on an individual’s ACAP.
SI does not have a significant effect on an individual’s ACAP. SN can improve learning, foster collaboration, and enhance creativity [21]. Comprehension and understanding are shaped by group heuristic, which makes assimilation [20]. The results show that SN has a very weak significant effect on an individual’s ACAP through assimilation. SN can have both a positive and negative impact on individuals’ comprehension [22]. Behaviour is influenced by beliefs [19] as well as other factors [72]. Instead of the outcome, the behaviour or action under the control of an employee [73]. Individual’s ACAP has a weak significant effect on an individual’s learning behaviour. An individual’s ACAP has a mediating effect on learning behaviour.

5.1. Contribution and Implications of the Results

The results add to the underlying theory of planned behaviour that says beliefs influence behaviour [19]. The very weak effect that individual technological beliefs have on individuals does pertain to Ajzen: [72] is a revision of his Ajzen [19] theory. Ajzen [19,72] stated that there are other factors than beliefs that affect people’s behaviour. Nevertheless, this study demonstrates that individual ACAP is a mediating factor towards individual learning behaviour. This adds to the literature about learning and performance. Further research would help understand this causal effect in more detail.
The findings show that optimism and innovation have a significant weak effect. This implies that individuals with optimism and innovation technological beliefs should have slightly better ACAP. This suggests that perhaps teaching individuals to be optimistic and innovative with technology will improve their learning capability slightly. This might only be observable over a long period. Nevertheless, efforts should be dedicated to increasing individuals’ motivation in technology, such as optimism and innovation, to improve their learning behaviour. Lowik, Kraaijenbrink, and Groen [32] makes recommendations to strengthen innovation, which are dissociative cognitive style and network diversity.
Learning practices should also consider social networks of individuals, as they have a significant very weak causal effect on individual ACAP through assimilation. Pedagogues could take note of the SN their students belong to. Students should also be made aware that expanding their social circle might help them increase their ACAP, as network diversity enhances individual ACAP [32]. This is an important insight to further current and significant efforts to deploy dynamic e-learning platform. In this next generation of learning tools, the content providers will tailor the system interactions to suit individual learners and aims [95,96]. Developers rely heavily on identifying learners’ abilities and predispositions based on historical data [96,97]. The insights provided in this work suggest further the use of learners’ interactions amongst themselves and suggest another dimension of tailoring for online learners based on their ACAP.
This study also extends the current ACAP study for providing a “bigger” picture for integrating the technology readiness, adopted technology, ACAP and learning behaviour, and uncovering the dynamics among them.

5.2. Limitations

A potential limitation could stem from individuals themselves, which are known as the self-reporting bias. As individuals emphasize merits and downplay faults, they are motivated to self-enhance, known as the leniency effect [98]. The focus of this study on individuals is as well a limitation. While ACAP was initially conceptualised from individuals’ learning cognitive ability [23], Cohen and Levinthal [23] (p. 131) state that “an organization’s absorptive capacity will depend on the absorptive capacities of its members” and that “a firm’s absorptive capacity is not simply the sum of the absorptive capacities of its employees”. The expectation that individual role and organisational goals are interdependent [74] is an assumption. The research scope on individuals might not be translatable into collective or organisational ACAP. This warrants further research.
BCa bootstrapping was used to mitigate any skewness in the data that this study used. This method may have limitations. PLS-SEM certainly does with its focus on maximising partial model structures [89]. However, all statistical methods are prone to shortfalls [91]. As limitations still exist and mistakes can happen, this study has done its best to provide reliable and honest results.
One limitation of the learning behaviour is antithetical items, which are items that are not opposite but measure the same content [73,99]. For example, contextual performance and counterproductive work behaviour could potentially measure the same item more than once [73]. As the learning behaviour items suffer from not measuring all dimensions together, it does not incorporate all individual behaviours [73].
The data are collected through university students. Under this context, all the students have similar prior existing knowledge, knowledge sources, and social context, which is different from business and government. Future work will focus on executing the study required a large population sample. Therefore, there is necessary to extend this study to other contexts.

5.3. Conclusions

This study has demonstrated that individual optimism and innovation have an unexpectedly very weak effect on their ability to absorb knowledge. SN has a very weak impact on an individual’s understanding when absorbing knowledge, and that individuals’ capability to absorb knowledge has a weak effect on their learning behaviour. Online questionnaires allowed data to be collected from participants over a large distance. One hundred and ninety-nine records were used for the analysis. PLS-SEM was used to analyse the collected dataset to provide results. While this study may fall short of its limitations, these all have been acknowledged. Its insight tells that further efforts should be directed to examine an individual technological optimism and innovation; an individual’s SN could influence his understanding, and an individual’s learning capability could lead to his learning behaviour. The model ensued could be adapted for future research or to make a measuring instrument. However future research should focus on other factors and frameworks such as technology–organization–environment (TOE) that would influence knowledge absorption. The journey to bridge knowledge and technology is a long one, even if one stumbles, one must persevere to progress.

Author Contributions

Conceptualization, T.D. and O.S.; methodology, T.D. and O.S.; data collection, T.D.; writing—T.D., writing—review and editing, G.B. and K.W.; supervision, O.S., G.B., and K.W. All authors have read and agreed to the published version of the manuscript.

Funding

This research received no external funding.

Institutional Review Board Statement

The study was conducted according to the guidelines of the University of Technology Sydney Human Research, and approved by the Ethics Committee of University of Technology Sydney (protocol code UTS HREC ETH19-4176 August 2019).

Informed Consent Statement

Informed consent was obtained from all subjects involved in the study.

Data Availability Statement

The data presented in this study are available on request from the corresponding author. The data are not publicly available due to participants privacy.

Conflicts of Interest

The authors declare no conflict of interest.

Appendix A

Table A1. Survey items: These technology readiness questions were modified from the Technology Readiness Index 2.0, which is copyrighted by A. Parasuraman and Rockbridge Associates, Inc., 2014. [45]. This scale may be duplicated only with written permission from the original authors.
FactorSurvey QuestionReference
Optimism Parasuraman and Colby [45].
OPTI1New technologies contribute to a better quality of life.
OPTI2Technology gives me more freedom of mobility.
OPTI3Technology gives people more control over their daily lives.
OPTI4Technology makes me more productive in my personal life.
Innovativeness
INNO1Other people come to me for advice on new technologies.
INNO2In general, I am among the first in my circle of friends to acquire new technology when it appears.
INNO3I can usually figure out new high-tech products and services without help from others.
INNO4I keep up with the latest technological developments in my areas of interest.
Discomfort
DISC1When I get technical support from a provider of a high-tech product or service, I sometimes feel as if I am being taken advantage of by someone who knows more than I do.
DISC2Technical support lines are not helpful because they don’t explain things in terms I understand.
DISC3Sometimes, I think that technology systems are not designed for use by ordinary people.
DISC4There is no such thing as a manual for a high-tech product or service that’s written in plain language.
Insecurity
INSE1People are too dependent on technology to do things for them.
INSE2Too much technology distracts people to a point that is harmful.
INSE3Technology lowers the quality of relationships by reducing personal interaction.
INSE4I do not feel confident doing business with a place that can only be reached online.
Tools for knowledge sources Adeyinka et al. [59] and Ozkan et al. [85]
TOOLS1The systems that the university uses to provide course content (for example, Blackboard) seems to be exactly what I need.
TOOLS2I find that the university’s systems are easy to use.
TOOLS3I can effectively and easily manage my time using the university’s systems.
TOOLS4I am informed by announcements through the university’s systems.
Social Networks Gupta and Bashir [22].
SN01I use social networks to solve my academic problems.
SN02I use social networks to do research.
SN03I use social networks to communicate with my friends to prepare for exams.
SN04I use social networks to seek help from my teachers.
SN05I use social networks to share new ideas.
SN06I find it difficult to find accurate information about academia on social networks.
SN07I usually postpone my academic task to spend more time on social networks.
Social influence Venkatesh et al. [86]
SI1People who are important to me think I should use the university’s systems.
SI2I use the university’s systems because of the proportion of students who use them.
SI3The teachers help me use the university’s systems.
SI4People who use the university’s systems have more prestige than those who do not.
Acquisition Zahra and George [20]
ACQU01I am always actively looking for new knowledge.
ACQU02I can easily identify what new knowledge is most valuable.
ACQU03I collect information through informal means such as talking with students, industry professionals or mentors.
ACQU04I regularly approach teachers, tutors or other staff.
Assimilation
ASSM01I frequently share my new knowledge with other students.
ASSM02I translate new knowledge in such a way that students understand what I mean.
ASSM03I maintain relevant knowledge over time.
Transformation
TRNS01I can turn existing knowledge into new ideas.
TRNS02I record and store new knowledge for future reference.
TRNS03I am proficient in repurposing existing knowledge for new uses.
Exploration
EXPL01I constantly consider how I can apply new knowledge to improve my work.
EXPL02I clearly know how activities within their course should be performed.
EXPL03I have difficulty implementing new knowledge.
Learning behaviour Koopmans et al. [73]
Pradhan et al. [74].
LB1I take into account my teacher’s wishes in my work.
LB2I am able to cope well with difficult situations and setbacks.
LB3I handle assignments without much supervision.
LB4I complete my assignments on time.

References

  1. Davenport, T.H.; Prusak, L. Working Knowledge: How Organizations Manage What They Know; Harvard Business School Press: Boston, MA, USA, 1998. [Google Scholar]
  2. Garavelli, A.C.; Gorgoglione, M.; Scozzi, B. Managing knowledge transfer by knowledge technologies. Technovation 2002, 22, 269–279. [Google Scholar] [CrossRef]
  3. Karlsen, J.T.; Gottschalk, P. Factors affecting knowledge transfer in it projects. Eng. Manag. J. 2004, 16, 3–10. [Google Scholar] [CrossRef]
  4. Polanyi, M. Personal Knowledge: Towards a Post-Critical Philosophy; Routledge & Kegan Paul: London, UK, 1962. [Google Scholar]
  5. Polanyi, M. The Tacit Dimension; Peter Smith: Gloucester, UK, 1967. [Google Scholar]
  6. Goh, S.C. Managing effective knowledge transfer: An integrative framework and some practice implications. J. Knowl. Manag. 2002, 6, 23–30. [Google Scholar] [CrossRef] [Green Version]
  7. Hwang, H.-G.; Chang, I.C.; Chen, F.-J.; Wu, S.-Y. Investigation of the application of kms for diseases classifications: A study in a taiwanese hospital. Expert Syst. Appl. 2008, 34, 725–733. [Google Scholar] [CrossRef]
  8. Othman, S.H.; Beydoun, G.; Sugumaran, V. Development and validation of a disaster management metamodel (dmm). Inf. Process. Manag. 2014, 50, 235–271. [Google Scholar] [CrossRef] [Green Version]
  9. Prusak, L. Knowledge in Organizations; Butterworth-Heinemann: Boston, MA, USA, 1997; pp. ix–xv. [Google Scholar]
  10. Iyengar, K.; Sweeney, J.R.; Montealegre, R. Information technology use as a learning mechanism: The impact of it use on knowledge transfer effectiveness, absorptive capacity, and franchisee performance. MIS Q. 2015, 39, 615–641. [Google Scholar] [CrossRef]
  11. Szulanski, G. Exploring internal stickiness: Impediments to the transfer of best practice within the firm. Strateg. Manag. J. 1996, 17, 27–43. [Google Scholar] [CrossRef]
  12. Omidvar, O.; Edler, J.; Malik, K. Development of absorptive capacity over time and across boundaries: The case of r&d consortia. Long Range Plan. 2017, 50, 665–683. [Google Scholar]
  13. Ferreras-Méndez, J.L.; Newell, S.; Fernández-Mesa, A.; Alegre, J. Depth and breadth of external knowledge search and performance: The mediating role of absorptive capacity. Ind. Mark. Manag. 2015, 47, 86–97. [Google Scholar] [CrossRef]
  14. Uygur, U. Determinants of causal ambiguity and difficulty of knowledge transfer within the firm. J. Manag. Organ. 2013, 19, 742–755. [Google Scholar] [CrossRef] [Green Version]
  15. Tang, F.; Xi, Y.; Ma, J. Estimating the effect of organizational structure on knowledge transfer: A neural network approach. Expert Syst. Appl. 2006, 30, 796–800. [Google Scholar] [CrossRef]
  16. Schmidt, T. Absorptive Capacity—One Size Fits All? A Firm-Level Analysis of Absorptive Capacity for Different Kinds of Knowledge, Discussion Paper No. 05-72. In Proceedings of the ZEW Conference on Innovation and Patenting, Mannheim, Germany, 19–20 September 2005; pp. 1–37. [Google Scholar]
  17. Raskind, M. Assistive technology and adults with learning disabilities: A blueprint for exploration and advancement. Learn. Disabil. Q. 1993, 16, 185–196. [Google Scholar] [CrossRef]
  18. Yoo, S.J.; Sawyerr, O.; Tan, W.L. The mediating effect of absorptive capacity and relational capital in alliance learning of smes. J. Small Bus. Manag. 2016, 54, 234–255. [Google Scholar] [CrossRef]
  19. Ajzen, I. The theory of planned behavior. Organ. Behav. Human Decis. Process. 1991, 50, 179–211. [Google Scholar] [CrossRef]
  20. Daghfous, A. Organizational learning, knowledge and technology transfer: A case study. Learn. Org. 2004, 11, 67–83. [Google Scholar] [CrossRef]
  21. Zahra, S.A.; George, G. Absorptive capacity: A review, reconceptualization, and extension. Acad. Manag. Rev. 2002, 27, 185–203. [Google Scholar] [CrossRef] [Green Version]
  22. Gupta, S.; Bashir, L. Social networking usage questionnaire: Development and validation in an indian higher education context. Turk. Online J. Distance Educ. TOJDE 2018, 19, 214–227. [Google Scholar] [CrossRef] [Green Version]
  23. Cohen, W.M.; Levinthal, D.A. Absorptive capacity: A new perspective on learning and Innovation. Adm. Sci. Q. 1990, 35, 128–152. [Google Scholar] [CrossRef]
  24. Roberts, N.; Galluch, P.S.; Dinger, M.; Grover, V. Absorptive capacity and information systems research: Review, synthesis, and directions for future research. MIS Q. 2012, 36, A625–A626. [Google Scholar] [CrossRef] [Green Version]
  25. Gao, S.; Yeoh, W.; Wong, S.F.; Scheepers, R. A literature analysis of the use of absorptive capacity construct in is research. Int. J. Inf. Manag. 2017, 37, 36–42. [Google Scholar] [CrossRef] [Green Version]
  26. Marabelli, M.; Newell, S. Knowing, power and materiality: A critical review and reconceptualization of absorptive capacity. Int. J. Manag. Rev. 2014, 16, 479–499. [Google Scholar] [CrossRef]
  27. Liu, H.; Ke, W.; Wei, K.K.; Hua, Z. The impact of it capabilities on firm performance: The mediating roles of absorptive capacity and supply chain agility. Decis. Support Syst. 2013, 54, 1452–1462. [Google Scholar] [CrossRef]
  28. Dyer, J.H.; Singh, H. The relational view: Cooperative strategy and sources of interorganizational competitive advantage. Acad. Manag. Rev. 1998, 23, 660–679. [Google Scholar] [CrossRef] [Green Version]
  29. Lane, P.J.; Koka, B.R.; Pathak, S. The reification of absorptive capacity: A critical review and rejuvenation of the construct. Acad. Manag. Rev. 2006, 31, 833–863. [Google Scholar] [CrossRef]
  30. Szulanski, G. The process of knowledge transfer: A diachronic analysis of stickiness. Organ. Behav. Hum. Decis. Process. 2000, 82, 9–27. [Google Scholar] [CrossRef] [Green Version]
  31. Teece, D.J.; Pisano, G.; Shuen, A. Dynamic capabilities and strategic management. Strateg. Manag. J. 1997, 18, 509–533. [Google Scholar] [CrossRef]
  32. Lowik, S.; Kraaijenbrink, J.; Groen, A.J. Antecedents and effects of individual absorptive capacity: A micro-foundational perspective on open Innovation. J. Knowl. Manag. 2017, 21, 1319–1341. [Google Scholar] [CrossRef]
  33. Minbaeva, D.B.; Mäkelä, K.; Rabbiosi, L. Linking hrm and knowledge transfer via individual-level mechanisms. Hum. Resour. Manag. 2012, 51, 387–405. [Google Scholar] [CrossRef]
  34. Mishra, P.; Koehler, M.J. Technological pedagogical content knowledge: A framework for teacher knowledge. Teach. Coll. Rec. 2006, 108, 1017. [Google Scholar] [CrossRef]
  35. Day, S.L.; Edwards, B.J. Assistive technology for postsecondary students with learning disabilities. J. Learn. Disabil. 1996, 29, 486–492. [Google Scholar] [CrossRef]
  36. Collins, T. The impact of microcomputer word processing on the performance of learning disabled students in a required first-year writing course. Comput. Compos. 1990, 8, 49–67. [Google Scholar] [CrossRef]
  37. Raskind, M.H.; Scott, N.G. Technology for postsecondary students with learning disabilities. In Success for College Students with Learning Disabilities; Vogel, S.A., Adelman, P.B., Eds.; Springer: New York, NY, USA, 1993; pp. 240–279. [Google Scholar]
  38. Koehler, M.J.; Mishra, P.; Kereluik, K.; Shin, T.S.; Graham, C.R. The technological pedagogical content knowledge framework. In Handbook of Research on Educational Communications and Technology; Springer: Berlin/Heidelberg, Germany, 2014; pp. 101–111. [Google Scholar]
  39. Beydoun, G.; Kultchitsky, R.; Manasseh, G. Evolving semantic web with social navigation. Expert Syst. Appl. 2007, 32, 265–276. [Google Scholar] [CrossRef]
  40. Lust, G.; Juarez Collazo, N.A.; Elen, J.; Clarebout, G. Content management systems: Enriched learning opportunities for all? Comput. Hum. Behav. 2012, 28, 795–808. [Google Scholar] [CrossRef]
  41. Chan, A.Y.K.; Chow, K.O.; Jia, W. A Framework for Evaluation of Learning Effectiveness in Online Courses; Springer: Berlin/Heidelberg, Germany, 2003; pp. 383–395. [Google Scholar]
  42. Coates, H.; James, R.; Baldwin, G. A critical examination of the effects of learning management systems on university teaching and learning. Tert. Educ. Manag. 2005, 11, 19–36. [Google Scholar] [CrossRef]
  43. Parasuraman, A. Technology readiness index (tri): A multiple-item scale to measure readiness to embrace new technologies. J. Serv. Res. 2000, 2, 307–320. [Google Scholar] [CrossRef]
  44. Sadin, S.R.; Povinelli, F.P.; Rosen, R. The nasa technology push towards future space mission systems. Acta Astronaut. 1989, 20, 73–77. [Google Scholar] [CrossRef]
  45. Parasuraman, A.; Colby, C.L. An updated and streamlined technology readiness index: Tri 2.0. J. Serv. Res. 2015, 18, 59–74. [Google Scholar] [CrossRef]
  46. Walczuch, R.; Lemmink, J.; Streukens, S. The effect of service employees’ technology readiness on technology acceptance. Inf. Manag. 2007, 44, 206–215. [Google Scholar] [CrossRef]
  47. Lin, C.-H.; Shih, H.-Y.; Sher, P.J. Integrating technology readiness into technology acceptance: The tram model. Psychol. Mark. 2007, 24, 641–657. [Google Scholar] [CrossRef]
  48. Hallikainen, H.; Laukkanen, T. How Technology Readiness Explains Acceptance and Satisfaction of Digital Services in B2B Healthcare Sector? In Proceedings of the Pacific Asia Conference On Information Systems (PACIS), Chiayi, Taiwan, 27 June 27–1 July 2016; pp. 294–306. [Google Scholar]
  49. Vlačić, E.; Dabić, M.; Daim, T.; Vlajčić, D. Exploring the impact of the level of absorptive capacity in technology development firms. Technol. Forecast. Soc. Chang. 2019, 138, 166–177. [Google Scholar] [CrossRef] [Green Version]
  50. Wang, Y.-S.; Wang, H.-Y.; Shee, D.Y. Measuring e-learning systems success in an organizational context: Scale development and validation. Comput. Hum. Behav. 2007, 23, 1792–1808. [Google Scholar] [CrossRef]
  51. Vance, D.; Eynon, J. On the requirements of knowledge transfer using information systems: A schema whereby such transfer is enhanced. In Proceedings of the AMCIS 1998 Proceedings 212, Baltimore, MD, USA, 22 August 1998; pp. 632–634. [Google Scholar]
  52. Kuo, R.Z.; Lee, G.G. Kms adoption: The effects of information quality. Manag. Decis. 2009, 47, 1633–1651. [Google Scholar] [CrossRef]
  53. Damodaran, L.; Olphert, W. Barriers and facilitators to the use of knowledge management systems. Behav. Inf. Technol. 2000, 19, 405–413. [Google Scholar] [CrossRef]
  54. Bhatt, G.D. Knowledge management in organizations: Examining the interaction between technologies, techniques, and people. J. Knowl. Manag. 2001, 5, 68–75. [Google Scholar] [CrossRef] [Green Version]
  55. Lopez-Cruz, O.; Garnica, N.J. Engineering Organizational Absorptive Capacity for Effective Knowledge Transfer. In Proceedings of the International Conference on Software Process Improvement, Cham, Swizerland, 28 October 2018; Springer International Publishing: Cham, Swizerland, 2018; pp. 186–197. [Google Scholar]
  56. Lin, T.-C.; Huang, C.-C. Understanding knowledge management system usage antecedents: An integration of social cognitive theory and task technology fit. Inf. Manag. 2008, 45, 410–417. [Google Scholar] [CrossRef]
  57. Adams, G.L.; Lamont, B.T. Knowledge management systems and developing sustainable competitive advantage. J. Knowl. Manag. 2003, 7, 142–154. [Google Scholar] [CrossRef]
  58. Saarinen, T. An expanded instrument for evaluating information system success. Inf. Manag. 1996, 31, 103–118. [Google Scholar] [CrossRef]
  59. Adeyinka, T.; Mutula, S.M.; Athulang, M.; Angelina, T. An evaluation of webct course content management system at the university of botswana. Int. J. E-Adopt. IJEA 2010, 2, 48–78. [Google Scholar]
  60. Jansen, J.J.P.; Van Den Bosch, F.A.J.; Volberda, H.W. Managing potential and realized absorptive capacity: How do organizational antecedents matter? Acad. Manag. J. 2005, 48, 999–1015. [Google Scholar] [CrossRef] [Green Version]
  61. Kelman, H.C. Compliance, identification, and internalization: Three processes of attitude change. J. Confl. Resolut. 1958, 2, 51–60. [Google Scholar] [CrossRef]
  62. Jacobs, M.J.; Buys, A.J. In Evaluating the military’s technology absorptive capacity. In Proceedings of the PICMET 2010 Technology Management For Global Economic Growth, Phuket, Thailand, 18–22 July 2010; pp. 1–6. [Google Scholar]
  63. Leung, L. Loneliness, self-disclosure, and icq (“i seek you”) use. Cyberpsychol. Behav. 2002, 5, 241–251. [Google Scholar] [CrossRef] [PubMed]
  64. Morahan-Martin, J.; Schumacher, P. Loneliness and social uses of the internet. Comput. Hum. Behav. 2003, 19, 659–671. [Google Scholar] [CrossRef]
  65. Pempek, T.A.; Yermolayeva, Y.A.; Calvert, S.L. College students’ social networking experiences on facebook. J. Appl. Dev. Psychol. 2009, 30, 227–238. [Google Scholar] [CrossRef]
  66. Boyd, D.M.; Ellison, N.B. Social network sites: Definition, history, and scholarship. J. Comput. Med. Commun. 2007, 13, 210–230. [Google Scholar] [CrossRef] [Green Version]
  67. Haythornthwaite, C. Social networks and internet connectivity effects. Inf. Commun. Soc. 2005, 8, 125–147. [Google Scholar] [CrossRef]
  68. Ellison, N.B.; Steinfield, C.; Lampe, C. The benefits of facebook “friends:” Social capital and college students’ use of online social network sites. J. Comput. Med. Commun. 2007, 12, 1143–1168. [Google Scholar] [CrossRef] [Green Version]
  69. Subrahmanyam, K.; Reich, S.M.; Waechter, N.; Espinoza, G. Online and offline social networks: Use of social networking sites by emerging adults. J. Appl. Dev. Psychol. 2008, 29, 420–433. [Google Scholar] [CrossRef]
  70. Kamel Boulos, M.N.; Wheeler, S. The emerging web 2.0 social software: An enabling suite of sociable technologies in health and health care education. Health Inf. Libr. J. 2007, 24, 2–23. [Google Scholar] [CrossRef]
  71. Kuss, D.J.; Griffiths, M.D. Online social networking and addiction—A review of the psychological literature. Int. J. Environ. Res. Public Health 2011, 8, 3528–3552. [Google Scholar] [CrossRef] [PubMed] [Green Version]
  72. Ajzen, I. The theory of planned behaviour: Reactions and reflections. Psychol. Health 2011, 26, 1113–1127. [Google Scholar] [CrossRef]
  73. Koopmans, L.; Bernaards, C.; Hildebrandt, V.; Buuren, S.V.; van der Beek, A.J.; de Vet, H.C.W. Development of an individual work performance questionnaire. Int. J. Prod. Perform. Manag. 2013, 62, 6–28. [Google Scholar] [CrossRef]
  74. Pradhan, R.K.; Jena, L.K. Employee performance at workplace: Conceptual model and empirical validation. Bus. Perspect. Res. 2017, 5, 69–85. [Google Scholar] [CrossRef]
  75. Rotundo, M.; Sackett, P.R. The relative importance of task, citizenship, and counterproductive performance to global ratings of job performance: A policy-capturing approach. J. Appl. Psychol. 2002, 87, 66–80. [Google Scholar] [CrossRef] [Green Version]
  76. Hunt, S.T. Generic work behavior: An investigation into the dimensions of entry-level, hourly job performance. Pers. Psychol. 1996, 49, 51–83. [Google Scholar] [CrossRef]
  77. Koopmans, L.; Bernaards, C.M.; Hildebrandt, V.H.; Schaufeli, W.; de Vet, H.C.W.; van der Beek, A.J. Conceptual frameworks of individual work performance—A systematic review. J. Occup. Environ. Med. 2011, 53, 846–866. [Google Scholar] [CrossRef] [Green Version]
  78. Bloomfield, J.; Fisher, M.J. Quantitative research design. J. Australas. Rehabil. Nurses Assoc. 2019, 22, 27–30. [Google Scholar] [CrossRef]
  79. Teddlie, C.; Tashakkori, A. Foundations of Mixed Methods Research: Integrating Quantitative and Qualitative Approaches in the Social and Behavioral Sciences; SAGE Publications: Thousand Oaks, CA, USA, 2009. [Google Scholar]
  80. Watson, R. Quantitative Research. Nurs. Stand. 2015, 29, 44–48. [Google Scholar] [CrossRef] [PubMed]
  81. Fowler, S.B.; Lapp, V. Sample size in quantitative research: Sample size will affect the significance of your research. Am. Nurse Today 2019, 14. [Google Scholar]
  82. Hair, J.F., Jr.; Sarstedt, M.; Hopkins, L.; Kuppelwieser, V.G. Partial least squares structural equation modeling (pls-sem): An emerging tool in business research. Eur. Bus. Rev. 2014, 26, 106–121. [Google Scholar] [CrossRef]
  83. Diamantopoulos, A.; Winklhofer, H.M. Index construction with formative indicators: An alternative to scale development. J. Mark. Res. 2001, 38, 269–277. [Google Scholar] [CrossRef]
  84. Fornell, C.; Bookstein, F.L. Two structural equation models: Lisrel and pls applied to consumer exit-voice theory. J. Mark. Res. 1982, 19, 440–452. [Google Scholar] [CrossRef] [Green Version]
  85. Ozkan, S.; Koseler, R.; Baykal, N. Evaluating learning management systems: Adoption of hexagonal e-learning assessment model in higher education. Transform. Gov. People Process Policy 2009, 3, 111–130. [Google Scholar] [CrossRef]
  86. Venkatesh, V.; Morris, M.G.; Davis, G.B.; Davis, F.D. User acceptance of information technology: Toward a unified view. MIS Q. 2003, 27, 425–478. [Google Scholar] [CrossRef] [Green Version]
  87. Becker, J.-M.; Hwa, C.; Ringle, C.; Sarstedt, M.; Hair, J. How to specify, estimate, and validate higher-order constructs in pls-sem. Australas. Mark. J. 2019, 27, 197–211. [Google Scholar]
  88. Hair, J.F.; Risher, J.J.; Sarstedt, M.; Ringle, C.M. When to use and how to report the results of pls-sem. Eur. Bus. Rev. 2019, 31, 2–24. [Google Scholar] [CrossRef]
  89. Hair, J.F.; Ringle, C.M.; Sarstedt, M. Pls-sem: Indeed a silver bullet. J. Mark. Theory Pract. 2011, 19, 139–152. [Google Scholar] [CrossRef]
  90. Reinartz, W.; Haenlein, M.; Henseler, J. An empirical comparison of the efficacy of covariance-based and variance-based sem. Int. J. Res. Mark. 2009, 26, 332–344. [Google Scholar] [CrossRef] [Green Version]
  91. Henseler, J.; Dijkstra, T.K.; Sarstedt, M.; Ringle, C.M.; Diamantopoulos, A.; Straub, D.W.; Ketchen, D.J.; Hair, J.F.; Hult, G.T.M.; Calantone, R.J. Common beliefs and reality about pls:Comments on rönkkö and evermann. Organ. Res. Methods 2014, 17, 182–209. [Google Scholar] [CrossRef] [Green Version]
  92. Hair, J.F., Jr.; Hult, G.T.M.; Ringle, C.M.; Sarstedt, M. A Primer on Partial Least Squares Structural Equation Modeling (Pls-Sem), 1st ed.; Sage: Thousand Oaks, CA, USA, 2014. [Google Scholar]
  93. Henseler, J.; Ringle, C.M.; Sarstedt, M. A new criterion for assessing discriminant validity in variance-based structural equation modeling. J. Acad. Mark. Sci. 2015, 43, 115–135. [Google Scholar] [CrossRef] [Green Version]
  94. Hair, J.F., Jr.; Hult, G.T.M.; Ringle, C.M.; Sarstedt, M. A Primer on Partial Least Squares Structural Equation Modeling (Pls-Sem), 2nd ed.; Sage: Thousand Oaks, CA, USA, 2017. [Google Scholar]
  95. Sun, G.; Cui, T.; Beydoun, G.; Chen, S.; Dong, F.; Xu, D.; Shen, J. Towards Massive Data and Sparse Data in Adaptive Micro Open Educational Resource Recommendation: A Study on Semantic Knowledge Base Construction and Cold Start Problem. Sustainability 2017, 9, 898. [Google Scholar] [CrossRef] [Green Version]
  96. Wang, L.; Hu, G.; Zhou, T. Semantic Analysis of Learners’ Emotional Tendencies on Online MOOC Education. Sustainability 2018, 10, 1921. [Google Scholar] [CrossRef] [Green Version]
  97. Muhammad, A.; Zhou, Q.; Beydoun, G.; Xu, D.; Shen, J. Learning path adaptation in online learning systems. In Proceedings of the20th IEEE Conference on Computer Supported Cooperative Work in Design (CSCWD), Nanchang, China, 4–6 May 2016. [Google Scholar]
  98. van der Heijden, B.I.J.M.; Nijhof, A.H.J. The value of subjectivity: Problems and prospects for 360-degree appraisal systems. Int. J. Hum. Resour. Manag. 2004, 15, 493–511. [Google Scholar] [CrossRef]
  99. Dalal, R.S. A meta-analysis of the relationship between organizational citizenship behavior and counterproductive work behavior. J. Appl. Psychol. 2005, 90, 1241–1255. [Google Scholar] [CrossRef] [PubMed]
Figure 1. Research model.
Sustainability 13 00718 g001
Figure 2. Disjoint Stage 2 construct effect model.
Sustainability 13 00718 g002
Table 1. Stage 1 reflective indicator outer loadings.
DiscomfortInnovationInsecurityLearning BehaviourOptimism
DISC10.574
DISC20.593
DISC30.738
DISC40.884
INNO1 0.799
INNO2 0.688
INNO3 0.850
INNO4 0.805
INSE2 0.598
INSE4 0.887
LB2 0.713
LB3 0.809
LB4 0.742
OPTI1 0.677
OPTI2 0.674
OPTI4 0.862
Table 2. Stage 1 reflective indicator construct reliability and average variance extracted.
Composite ReliabilityAverage Variance Extracted (AVE)
Discomfort0.800.50
Innovation0.870.62
Insecurity0.720.57
Learning Behaviour0.800.57
Optimism0.780.55
Table 3. Stage 1 reflective indicator heterotrait–monotrait ratio.
DiscomfortInnovationInsecurityLearning BehaviourOptimism
Discomfort
Innovation0.179
Insecurity0.7330.189
Learning Behaviour0.2600.2440.275
Optimism0.2100.2940.3770.163
Table 4. Path coefficients relevance and statistical significance.
PathPath CoefficientStandard DeviationT-Valuep-ValueSupported?
H1Optimism -> Absorptive Capacity0.1740.0852.0440.041Yes
H2Insecurity -> Absorptive Capacity−0.0060.0910.0680.946No
H3aInnovation -> Absorptive Capacity0.2190.0703.1280.002Yes
H3bInnovation -> Absorptive Capacity0.2190.0703.1280.002Yes
H4Discomfort -> Absorptive Capacity−0.0880.0831.0600.289No
H5Tools for Knowledge Sources -> Absorptive Capacity0.0700.0740.9390.348No
H6Social Influences -> Absorptive Capacity0.0590.0670.8790.379No
H7Social Networks -> Absorptive Capacity0.2330.0792.9600.003Yes
H8Absorptive Capacity -> Learning Behaviour0.4610.0676.8720.000Yes
Publisher’s Note: MDPI stays neutral with regard to jurisdictional claims in published maps and institutional affiliations.

