1. Introduction
During the last years, a change in postal services could be observed. While some years ago, the business for postal services was mainly bounded to the delivery of letters, nowadays the “money is made” with the delivery of parcels. The letter segment drastically dropped due to the immense growth of electronic mailing (emails) in the private as well as in the business sector. The parcel segment developed vice versa from small mailings from your grandmother at your birthday to massive volumes of parcels having their origin in e-commerce [
1]. This is also underlined by the numbers presented by the Austrian Post in their business numbers. There, they mention an increase of the parcel service from only 56 Mio. parcels in 2010 to 127 Mio. parcels in 2019. The number of letters decreased from 6200 Mio. in 2010 to 5107 Mio. 2019 [
2,
3]. About 25% of the yearly income of the Austrian Post AG is generated via parcel logistics [
3]. This combined with the current modus operandi in the
courier express parcel (CEP) sector implies that the parcel delivery process needs to be rethought.
In most countries, but especially in Austria, the status quo in the CEP sector is that parcels are delivered during the day, cf. in [
4]. However, the recipients of the parcels are often not at home leading to a decreased number of first deliveries. As the main goal of every CEP service provider is to reduce the number of unsuccessful deliveries, they apply various strategies on how to deal with them:
The easiest approach is to get a storage permit from the recipient which allows depositing the parcel(s) at predefined locations at the recipient’s property. Obviously, access to this location has to be granted and liability with respect to damage and theft is passed over to the recipient.
A similar, but more technically supported approach, is to employ a reception box, which is mounted close to the post box (or is even integrated in it). In some cases, these reception boxes can be opened by everyone such that they are similar to the case of the storage permit. The more developed boxes are constructed such that parcels cannot be removed (by others than the recipient) once they are delivered.
The most cost-inefficient approach is to attempt another delivery on another day. Due to the high costs related to this approach, most CEP service providers do not rely on this practice.
If no deposit is possible at location (e.g., the reception box is already full) and attempting a second delivery is not followed by the CEP service provider, another often applied approach is to deliver the parcels to other addresses:
collect at the neighbor In this case, depositing the parcel at one of the neighbors is attempted. The recipient is informed either electronically or via notice about the deposit position.
collect at the post office If the CEP service provider operates also public premises (e.g., post offices), the parcels might be deposited at these locations. Again, the recipient is notified about this option.
collect at third party offices For those CEP service providers not operating at their own premises, it is convenient that the parcels have to be collected at locations operated by third parties, e.g., laundromats or tobacconists. Again, notifications are passed to the recipient.
collect at parcel lockers Finally, it is also possible that the parcels are deposited at parcel lockers. These are parcels boxes which are located in public space (or which are at least publicly accessible) and which can be unlocked by the recipient with the according unlocking code (e.g., transmitted via email).
Reports about successful deliveries are consistent among different CEP service providers (cf. in [
4,
5,
6]) and is about 90%. In [
7], the authors state that only up to 66% of recipients take over their parcels personally at home. The gap to the aforementioned 90% is covered by drop offs of parcels at neighbors, in locally mounted reception boxes, or by storage permits at the recipient’s home.
In case of collection at a parcel locker, is chosen, the application scenario is in most cases like this: The CEP service provider’s employee tries to deliver the parcel at the recipient’s home address, does not find the recipient at home, and delivers the parcel to the locker at the end of her delivery tour. That means that the delivery person has first to call at all home locations and finally almost always stops by the parcel locker.
Within this paper, we examine a use case where the delivery address of the recipients might be changed directly to the parcel locker’s location. Instead of first trying to deliver the parcel at home it is directly shipped to the parcel locker. On a first glance, this approach is beneficial as
the first delivery attempt is always successful,
a detour to the home location of the recipient is not necessary for the delivery person, and
no additional detour for the parcel locker is necessary as the delivery person (almost) always has to call at the parcel locker anyway as described above.
However, the obvious drawback of this approach is that the recipients have to drive (or walk) to the parcel locker to grab their packages. This can be either done en route when they are on their way anyway (e.g., for commuting or shopping) or an extra trip is performed. Even in the former case, it is possible that extra distance is traveled due to a detour, especially when the parcel locker is inconveniently placed.
We want to highlight that this paper is not on behavioral research trying to find out why people are accepting (or not accepting) parcel lockers. Further, we highlight that the usage of parcel lockers is the solely choice of the recipients, i.e., they are deciding whether the parcels should be dropped off at the parcel locker or—as conventional—at their home addresses.
1.1. Main Contribution
Within this work, we examine the impact of parcel lockers on traveled distance as well as on CO
emissions. In contrast to numbers presented and referred to in [
8], we examine not only the impact on the CEP service providers but also on the recipients who have to leave their homes for collecting their parcels. We show that under certain circumstances the
total traveled distance is decreased when employing parcel lockers. We further show that in most cases the impact on CO
emissions is positive and could lead in the best case to a reduction of up to 40% compared to the status quo. For our study, we make the following assumptions.
The parcel lockers are white-labeled. They are not limited to one specific CEP service provider but open to any of them.
The recipients decide on the parcel lockers. Therefore, if multiple parcels are delivered to the recipient by different CEP, service providers they are still deposited at the same parcel locker location.
Parcels are directly delivered to the parcel locker. No delivery attempt at the recipient’s home address is done even if the recipient is at home.
Even though the last assumption seems to be very limiting, we have to stress that if first delivery attempts would be done to the recipients’ home addresses, this would correspond to the status quo. That is, no impact could be measured.
1.2. Outline
The remainder of the paper is structured as follows. First, we give an overview on the current status quo of last-mile parcel logistics in Austria. Then, we discuss how open parcel lockers can be integrated into parcel logistics without the need to change the total supply chain, especially as company internal decisions at various CEP service providers cannot be easily influenced from outside. We then present our experimental setup to back the proposed last-mile parcel logistics with numbers which are presented (and statistically analyzed) in a results section. Finally, we draw conclusions and discuss necessary future work.
2. Status Quo in Austrian Last-Mile Parcel Logistics
The current general logistics related to the last-mile in the CEP sector in Austria is organized as follows. Starting at the local depot, which is the end of the (more efficient) long-haul transport, delivery trucks are filled with parcels according to their delivery sequence. The parcel carriers try to stack the parcels in the delivery trucks such that easy access to the next parcel to be delivered is always guaranteed. This loading process is in most cases done manually meaning that no planning support is provided by a computer system.
As soon as all parcels are loaded, the parcel carrier starts the delivery tour. Therefore, the parcel carrier drives from recipient address to recipient address according to the sequence of parcels piled up in the delivery truck. If a recipient is not at home (and no permit to deposit the parcel at the recipients property exists), the parcel is packed again into the delivery truck. All parcels which have not been successfully delivered are then handed over to a parcel pick-up shop, e.g., an office of the CEP service provider, a tobacconist or a laundry shop. The actual shop where the non-delivered parcels are deposited is selected according to the fitting of the shop’s location into the delivery tour (or other beneficial factors for the CEP service provider) and not according to the distance to the recipient. Of course, the drop-off location might also be a parcel locker.
However, this approach implies that in bad cases a recipient has to travel an extra distance (compared to the closest shop) to pick up the parcel. Services like second delivery attempts have been discontinued several years ago in Austria. However, different other approaches are currently tested or are getting to be established. For example, some CEP service providers offer the possibility to register for digital services which, among others, provide (more) detailed information about the delivery of parcels (e.g., an actual delivery time-window). It is also possible to track and trace the delivery process in various levels of detail. Furthermore, for some CEP service providers it is possible to either select a desired delivery time-window or redirect a parcel to another delivery address, e.g., the office address or a specific pick-up location like parcel lockers or a specific inbound lot on the own property.
3. Logistics Processes Integrating Open Parcel Lockers
To overcome some shortcomings of the current logistics processes related to parcel deliveries, we propose the integration of
open parcel lockers. Open or
white-label parcel lockers are parcel lockers which are not proprietary, i.e., which are not owned by one specific CEP service provider and therefore are not limited in use to parcel carriers from the owning CEP service provider. Apart from the possibility that all CEP service providers might deposit parcels in these open parcel lockers, multiple other use scenarios can be thought of like private sales or machinery rings, cf. in [
9]. Similar considerations have been previously done in other countries, cf. in [
10]. Furthermore, because of the COVID-19 pandemic we experienced a massive increase in interest for the integration of parcel lockers into parcel logistics due to its contactless nature [
11].
White-label logistics and/or horizontal collaboration is one of the key points of future logistics when trying to increase occupancy rates and economic viability of last-mile (parcel) logistics [
12]. Key success factors for collaborative logistics are discussed in various works, see, e.g., in [
13,
14,
15,
16].
The integration of (open) parcel lockers into the logistics processes related to the last-mile in CEP services in Austria is currently as follows. When a customer is ordering some goods in the internet, the customer normally provides her home address (or any other postal address like the office) as delivery address. Only in rare cases, it is possible to select a (specific) parcel locker facility during ordering. The CEP service provider executing the last-mile, normally tries to deliver the parcel to the given address. If the parcel carrier encounters nobody, she either deposits the parcel according to the storage permit given by the recipient or deposits the parcel at a specific collection point like the CEP service provider’s office, the laundry or other third party shops. Such a collection point might also be a proprietary parcel locker. However, no deposit at open parcel lockers is guaranteed or forced.
We propose, however, to extend the customer’s options by providing an alternative approach. Similar to the current ordering process, the customer provides a postal address for delivery. However, this postal address is not bound to properties like a house, office, or shop but is associated with a parcel locker. Due to the current regulations in Austria, the CEP service provider is then obliged to deliver the parcel to that address, i.e., to deposit it at the parcel locker. Of course, an appropriate user interface has to be available at the parcel locker such that the parcel can be deposited by any parcel carrier.
As the customer provides the address of the parcel locker during the ordering process, the customer has to make sure that the computer system of the parcel locker provider can match the specific parcels with the recipients. Among others, this could be realized by providing the parcel carrier a list of all possible recipients in the user interface.
One main point, which has to be discussed, is who is paying for the parcel locker service. As the main idea is to uncouple the parcel lockers from the CEP service providers, the operation of the parcel lockers has to be economically viable or subsidized by the public. This can be guaranteed if either the recipient or the CEP service provider has to pay for depositing parcels. While it is easier to realize payment by the recipients (as these are the ones deciding that the parcel has to be delivered to the parcel locker), it is, from our perspective, fairer if the CEP service provider is paying. The CEP service provider can significantly reduce its own costs due to the usage of parcel lockers. This statement is backed by our own computations (cf.
Section 4) but also by other studies as presented in [
8]. In [
8], it is highlighted that the fuel consumption of CEP service providers alone can be reduced by the integration of parcel lockers to only 5% of the original fuel consumption which would lead to a massive cost reduction. In addition, time savings would significantly reduce personnel costs. However, we have to highlight that these numbers are under very optimistic conditions and more realistic scenarios do not lead to these enormous savings. Nevertheless, our computations show that savings for CEP service providers could be up to 50% of the traveled distance.
4. Experimental Setup
In order to assess the impact of (open) parcel lockers, we decided to follow a two step approach. First, we installed a parcel locker in the rural village Kaumberg, Austria. Usage of this parcel locker has been free of charge for one year. Therefore, users were not influenced with respect to their usage of the locker by a possible price sensitivity. This demonstration was, however, mainly used to assess the usage patterns and the user experience as well as to collect data about the “typical” parcel quantities. The data and especially gained insights build the basis of the second step.
The parcel locker in Kaumberg has been installed during May and June 2019 and was set operational in July 2019. From then on, registration at and usage of the parcel locker was possible for one year until the end of June 2020. We collected data during the mentioned period which builds the base for our experiments. In addition to automatically collected data about usage (which CEP service provider deposited how many parcels (and when) for which customer), we performed two surveys among the users of the parcel locker questioning the typical behavior (e.g., “How many extra trips are performed?” and “Do extra costs for this service influence the acceptance?”). In total, about 900 parcels have been received by about 25 persons, which is an average of about 3 parcels per day and over 30 parcels per person.
Second, we ran a set of simulations to assess the distances traveled by the parcel carriers and the recipients. Setting up the simulations was necessary as not all influencing parameters could be extensively observed in the real-world installation of the parcel lockers. For example, the rate of successful (first) deliveries could not be influenced in the real-world experimental setup. The simulations revealed, however, that this parameter has large influence on the performance of the logistics system, cf.
Section 5.
As some of the parameters have been varied for our simulations, we also performed a statistical analysis in order to estimate the impact and (statistical) significance of the chosen parameters. For this purpose, 16 Wilcoxon rank sum tests were performed to examine the influence of the “extreme” cases of the chosen parameters.
These simulations are based on a set of parameters which were either determined by (personal) observations, preliminary experiments (as described above), or are varied within this study to quantify their impact on the actual solution. As the main intention of this study is to show the impact of the integration of parcel lockers into CEP logistics, we made two simulation setups: the first one representing the status quo and the second one assuming the envisaged adaptions. The following conditions are identical for both setups:
An application area is selected in Austria. For this area, the radius of interest is selected.
A set of points of interest (POIs) is selected within the radius of interest. POIs correspond to points like train station, motorway access, supermarket, tobacconist, etc.
A set of CEP service providers is selected. For each CEP service provider, the logistics hub address is researched and stored. Further, for each CEP service provider, the collection points in case of an unsuccessful first delivery are determined.
A set of recipients is randomly generated. For each recipient, a home address is randomly selected which is within the previously determined radius of interest.
A set of parcels to be delivered is randomly generated. For each parcel, one of the previously generated recipients is randomly selected. Further, for each parcel, a CEP service provider is assigned.
Some recipients receive more than one parcels while others receive none. Those with no parcel assigned have no further impact on the calculations. Therefore, we remove them from the set of recipients.
For each parcel, it is determined whether the parcel is collected exclusively or while another trip is executed.
For each recipient with at least one parcel assigned to be collected while another trip is executed, a randomly selected POI is assigned.
Based on these conditions, the following two setups emerge:
The first setup tries to resemble the current status quo. That is, the parcels are delivered by the CEP service providers to the home addresses of the recipients. If a recipient is not at home, the parcel is delivered to a collection point (called at by the CEP service provider). The recipient is informed (e.g., via e-mail) and collects the parcel—either during another trip or exclusively. This depends on the randomly selected parameter for the specific parcel. If more than one parcel is to be collected at the collection point, all of them are collected at the same time.
The second setup correspond to the intended logistics chain. In addition to the aforementioned conditions, we randomly select among all recipients those who are using the parcel locker. The actual number of recipients using the parcel locker is an input parameter discussed in more detail later. Obviously, we also select a location for the parcel locker within the area of interest.
For this setup, the CEP service provider delivers all parcels to customers not using the parcel locker as described in the first setup. If the recipient is not at home, the parcels are deposited at a collection point. However, for those recipients using the parcel locker, the packages are directly delivered to the parcel locker. In order to minimize the overall travel time and distance of the parcel carrier, the stop at the parcel locker is optimally inserted in the delivery tour. The necessary (additional) trips for collecting the parcels from the lockers are estimated analogously to the collection of parcels from the collection points. If parcels are collected exclusively, the recipient has an extra trip from home to the locker and back. If the parcels are collected “on trip”, only the necessary detour to the trip to/from the corresponding POI is added.
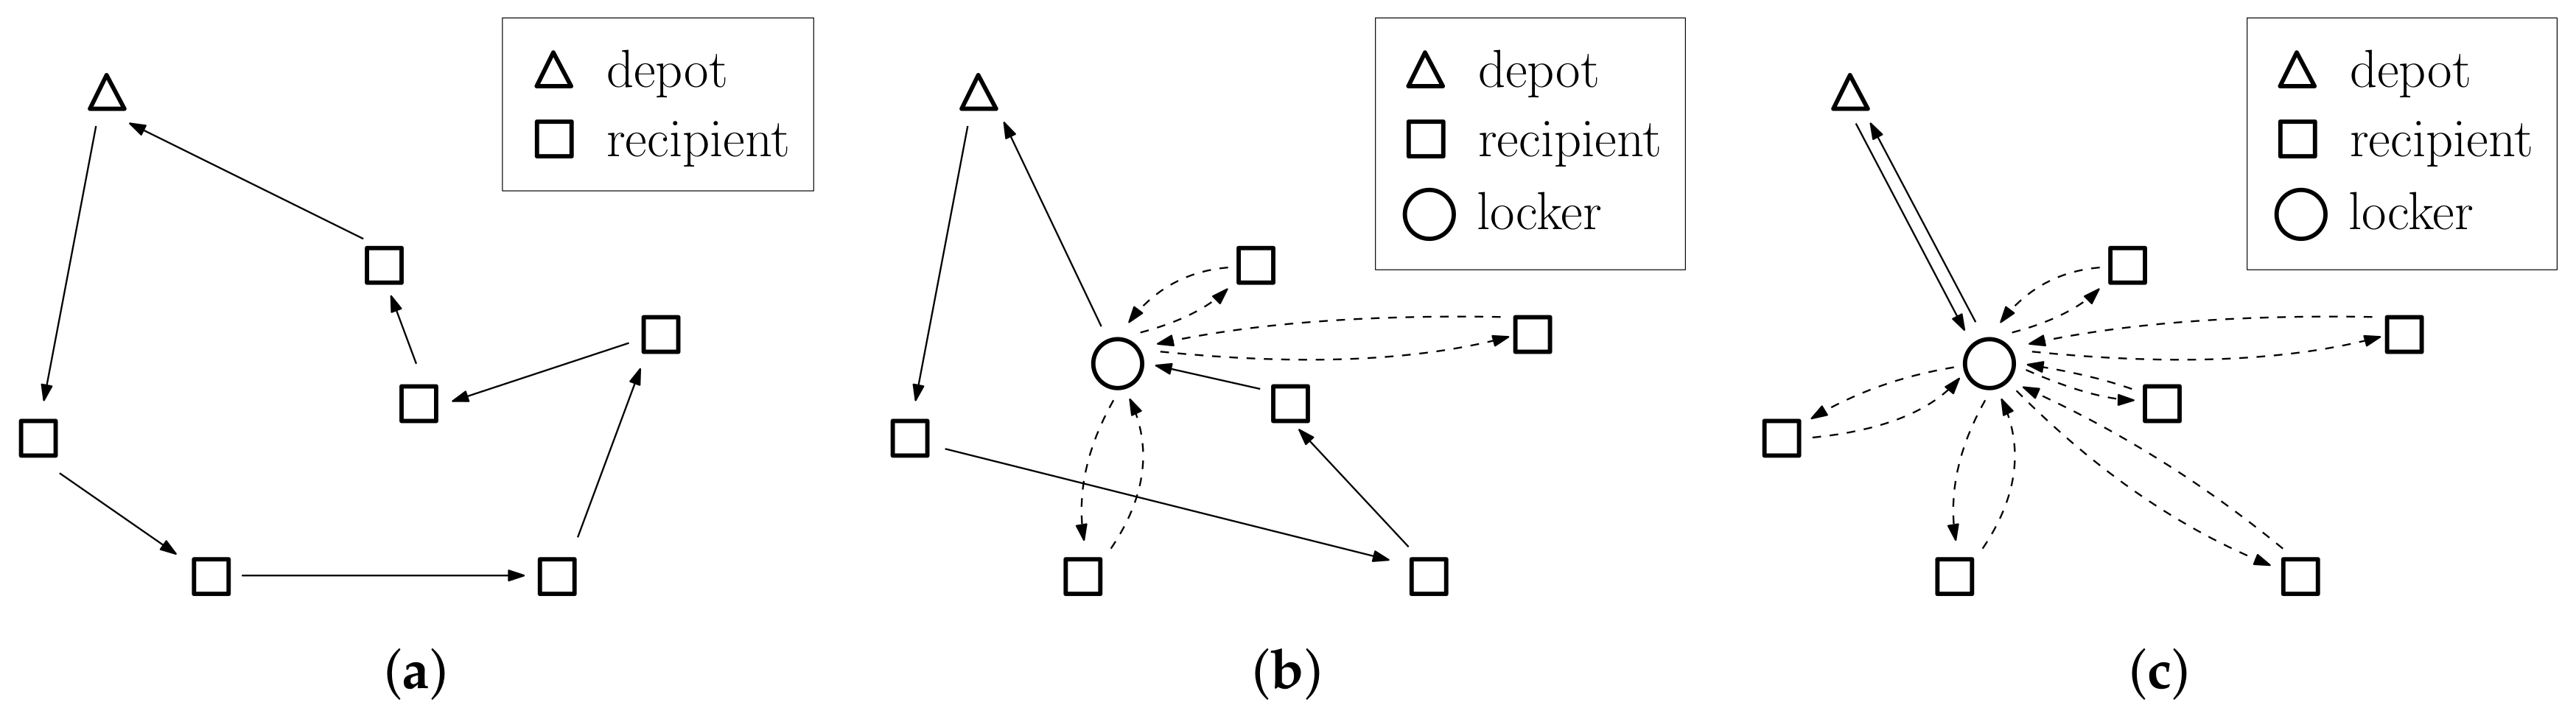
For the first setup, which reflects the current status quo, the resulting delivery plan corresponds to a classical
traveling sales person (TSP) problem (cf.
Figure 1a) for each CEP service provider. The second setup results for each CEP service provider in a tour plan as sketched in
Figure 1b. An extreme case where all recipients employ the parcel locker is shown in
Figure 1c, which corresponds to a classical hub-and-spoke network. One could question whether the TSP based approach or the hub-and-spoke based approach is more efficient with respect to traveled distance as well as CO
emissions.
If no other influencing factors would be existent, it is obvious that the distance traveled for the TSP-based approach is less than (or in the worst case equal to) the hub-and-spoke-based delivery plan. However, we have to consider that (most of the) recipients travel anyway and therefore synergies with respect to their trips can be exploited. To answer the question, how much these synergies decrease the advantage of TSP based delivery tours, we first calculate the overall traveled distance for the first setup (status quo) with all trips by the CEP service providers and recipients (to the respective POIs). Then, we subtract the overall distance traveled when employing parcel lockers. However, some assumptions have been made influencing the performance of the examined logistics concepts.
rate of successful first deliveries This parameter determines how often the delivery of parcels at the recipients home address is successful. For our computations, we chose among the values 20%, 40%, 60%, 80%, and 100%, meaning that 20%, 40%, etc. of all parcels delivered to the recipients home address could be successfully delivered. Obviously, this does not necessarily mean that the recipients are at home. Other successful first deliveries like depositing the parcel at a neighbor’s house or in a reception box could have been applied.
rate of recipients using parcel lockers This parameter determines how many of the recipients use the parcel lockers. That is, for how many of them, the parcels are not delivered to their home address but directly to the parcel lockers, e.g., for the scenario depicted in
Figure 1b, this value corresponds to 50%. Again, we have altered this value between 20%, 40%, 60%, 80%, 100%. A value of 100% corresponds to the case depicted in
Figure 1c.
rate of collecting parcels exclusively This parameter determines how many of the parcels are collected exclusively, i.e., for how many of the parcels an extra trip from home to the parcel locker or any other collection point in case the parcel has be dropped of at a laundry, etc. have been performed. All others parcels are collected while another POI is approached anyway. The values for this parameter have been set to 0%, 10%, 20%, 30%, 40%, and 50%, respectively. This range has been chosen as the survey in Kaumberg revealed that only 25% of the parcel locker users undertake an exclusive trip for collecting a parcel.
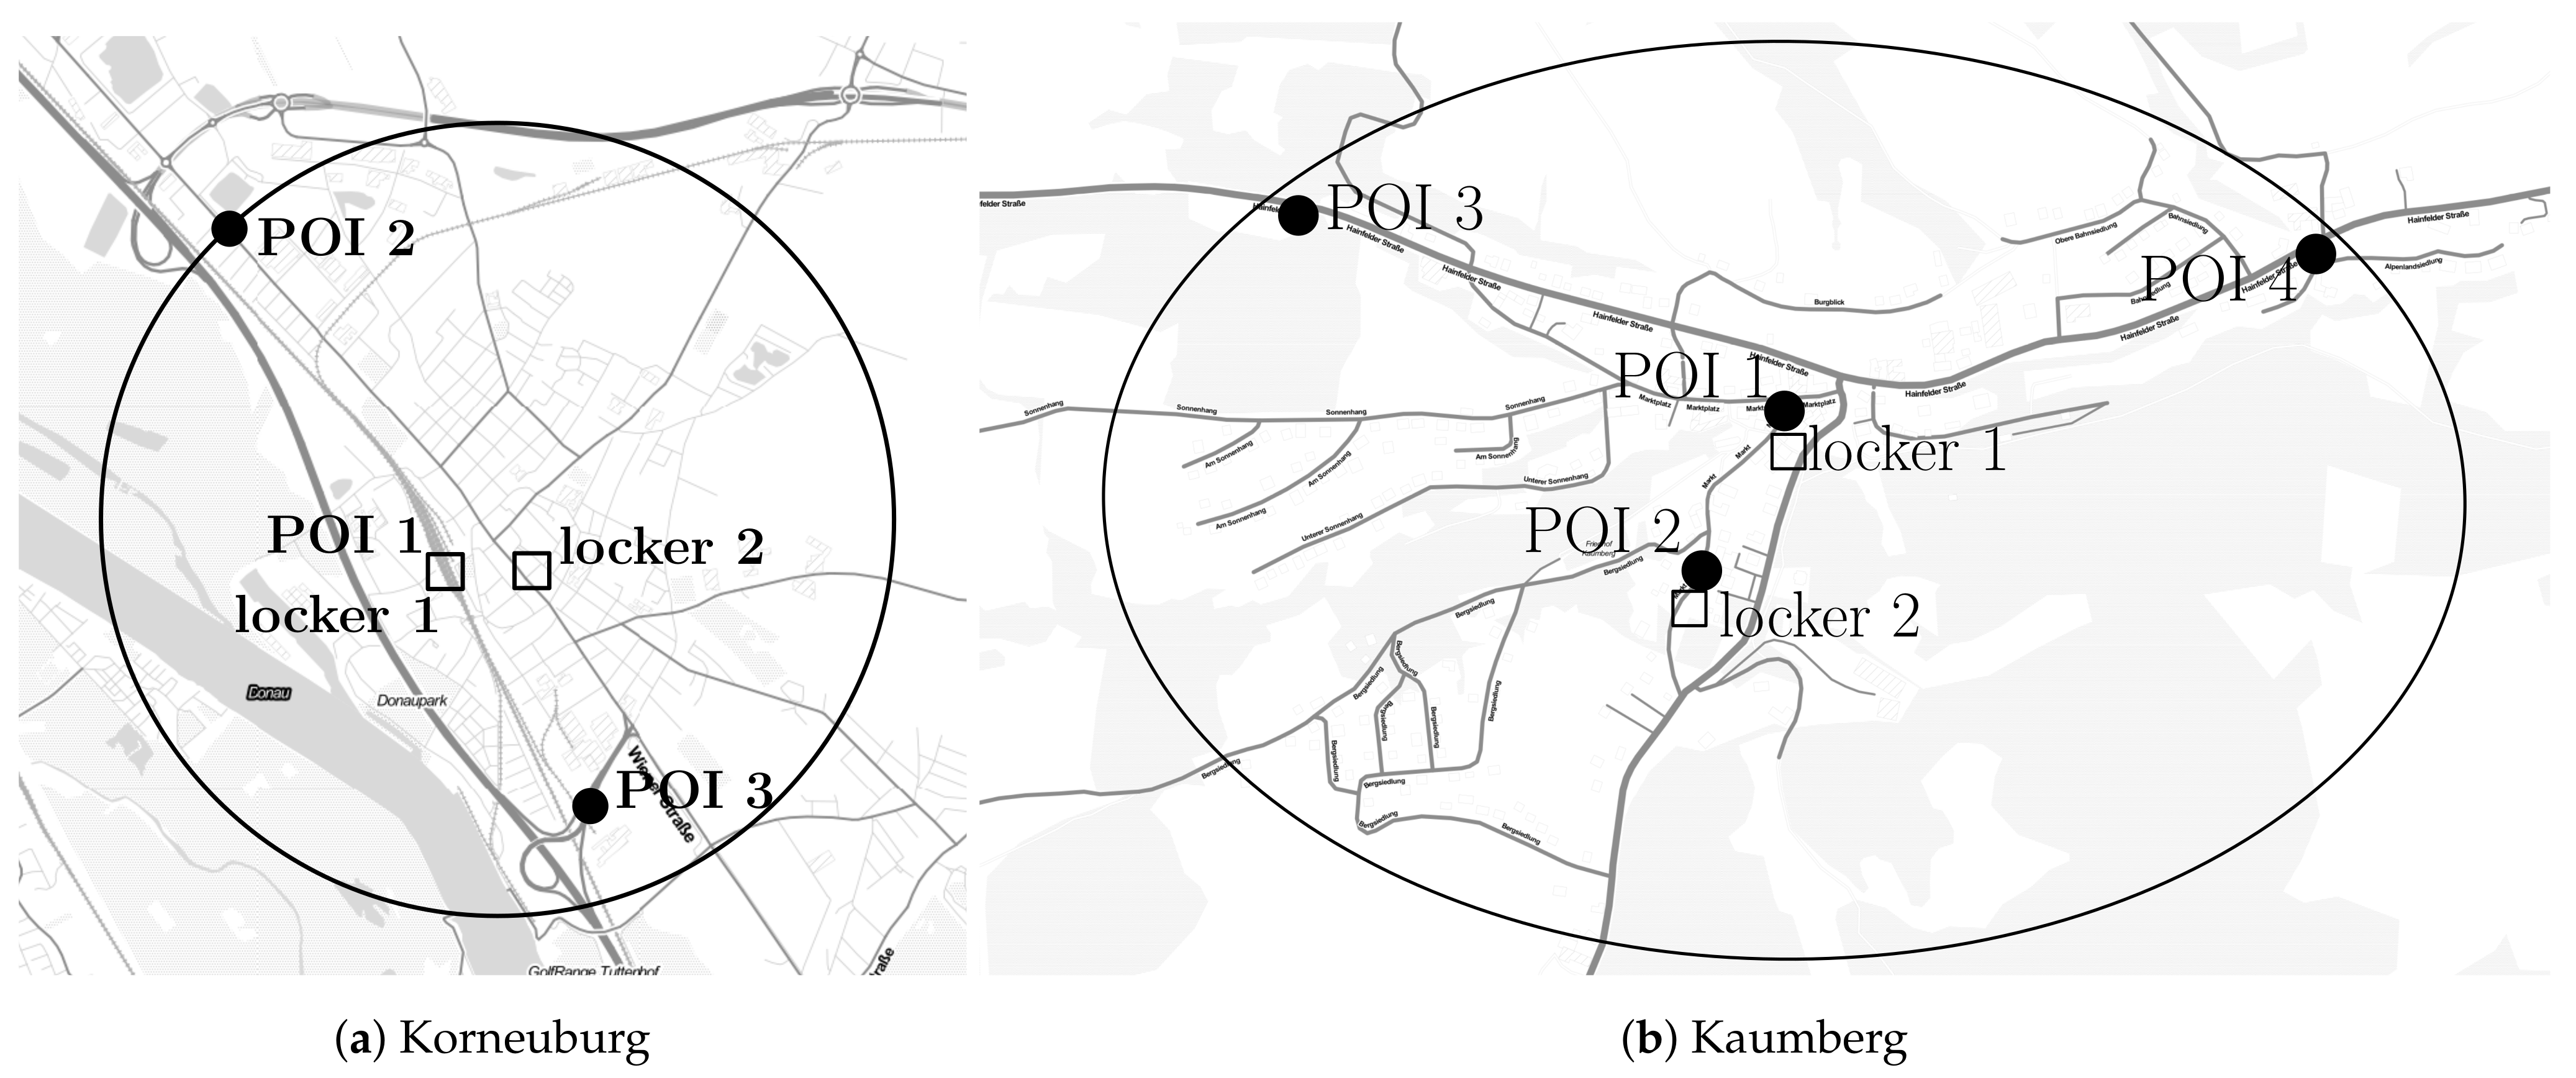
In order to have realistic values with respect to the distances traveled by the CEP service providers as well as the recipients, we have carried out our computations for the two Austrian towns Korneuburg and Kaumberg, cf.
Figure 2. The map data have been received from OpenStreetMap which has a pretty good coverage in Austria [
17]. It has then been converted into a routable graph for our internal routing engine [
18,
19] such that the trips of the CEP service providers as well as recipients can be computed. In addition, we employed the VRP planner of Google’s OR-Tools [
20] for determining the tours of the CEP service providers.
The following further parameters have been chosen based on preliminary experiments and/or educated assumptions:
location of parcel locker In order to investigate the influence of the location of the parcel locker, two locations have been chosen for each town. For Korneuburg, the first one (labeled locker 1) corresponds to the train station and the second one (locker 2) corresponds to the main plaza. For Kaumberg, the first one corresponds to the main plaza and the second one to the primary school.
POIs Not all parcels are picked up by recipients exclusively, meaning that they are collected while other purposes are taken care of, e.g., during trips from/to work. Therefore, we chose three or four
points of interest (POIs) for each town, cf.
Figure 2.
For Korneuburg, POI 1 is identical to the train station as there actually is an open parcel locker located. Second, we assume in our computations that the majority of the recipients commutes to the close city of Vienna, Austria, using public transport. Therefore, a large portion of the recipients will pass by this location anyway. The other two POIs have been chosen to be at the two motorway access roads of Korneuburg. Again, this is reasoned by the fact that the majority of the recipients commute (and therefore leaves the town during day).
Similar considerations are applied for Kaumberg, where two POIs are located at the (two only) entry/exit points for commuters. The two other POIs are overlapping with the considered locker locations as there are grocery stores (POI 1) and the primary school (POI 2).
area of interest For both towns, the area of interest has been chosen such that the respective whole living area is included.
modal split The modal split for CEP providers is always “delivery van”, i.e., this parameter is only relevant for the recipients.
For Korneuburg, it is assumed that in a first scenario all considered recipients commute via public transport, that is, only POI 1 is targeted at. The modal split is set to 30% car, 30% bike, and 40% walking share. The second assumed scenario is that one third of the commuters use their car for their trips, i.e., POIs 1–3 are used. Therefore, the modal split is adjusted to 54% car, 20% bike, and 26% walking.
When picking up parcels only, i.e., no other purpose is fulfilled with a trip, the modal split is set to 86% car, 10% bike, and 4% walking.
For Kaumberg, the modal split is set to 70% car, 20% bike, and 10% walking for trips to POIs as well as picking up parcels exclusively for those scenarios where all POIs are considered. When considering only POIs 3 and 4, the modal split is set to taking the car only (for commuting as well as for picking up the parcels).
Based on the data presented in [
21], we further set the following thresholds: Whenever a trip is longer than 1
(and the chosen mode of transport would be walking) we switch to bike. The threshold for bike is set to 5
. Exceeding this threshold, the car is used regardless of the assigned mode of transport.
Based on this logic, we randomly assign to each trip (regardless whether a POI or a parcel is targeted at) a mode of transport. Based on the thresholds a switch to another mode of transport might be applied.
A summary of these parameters as well as the actual values are given in
Table 1 and
Table 2. For both towns, the possible combinations of locker locations and POIs used (as shown in
Table 2) were used to generate four basic scenarios. For each of these four basic scenarios, detailed scenarios have been generated, each consisting of one of the 150 possible combinations of the parameters
rate of successful deliveries (20%, 40%, 60%, 80%, 100%),
rate of recipients using parcel lockers (20%, 40%, 60%, 80%, 100%), and
rate of collecting parcels exclusively (0%, 10%, 20%, 30%, 40%, 50%).
We randomly generated 30 instances for each of the 600 scenarios such that we can eliminate statistical outliers. The simulation/optimization algorithms have been implemented in Java 14 using Google’s OR-Tools [
20] for tour computations as subordinate. All results were computed on a single core of a standard Intel© Xeon™ E5645 processor @
) and 4 GB of RAM. Each simulation run took about 15
. The actual results are presented in
Section 5 including a comprehensive discussion of them.
5. Results
The main question of the examination was what impact do parcel lockers have on the traveled distance by car as well as on CO
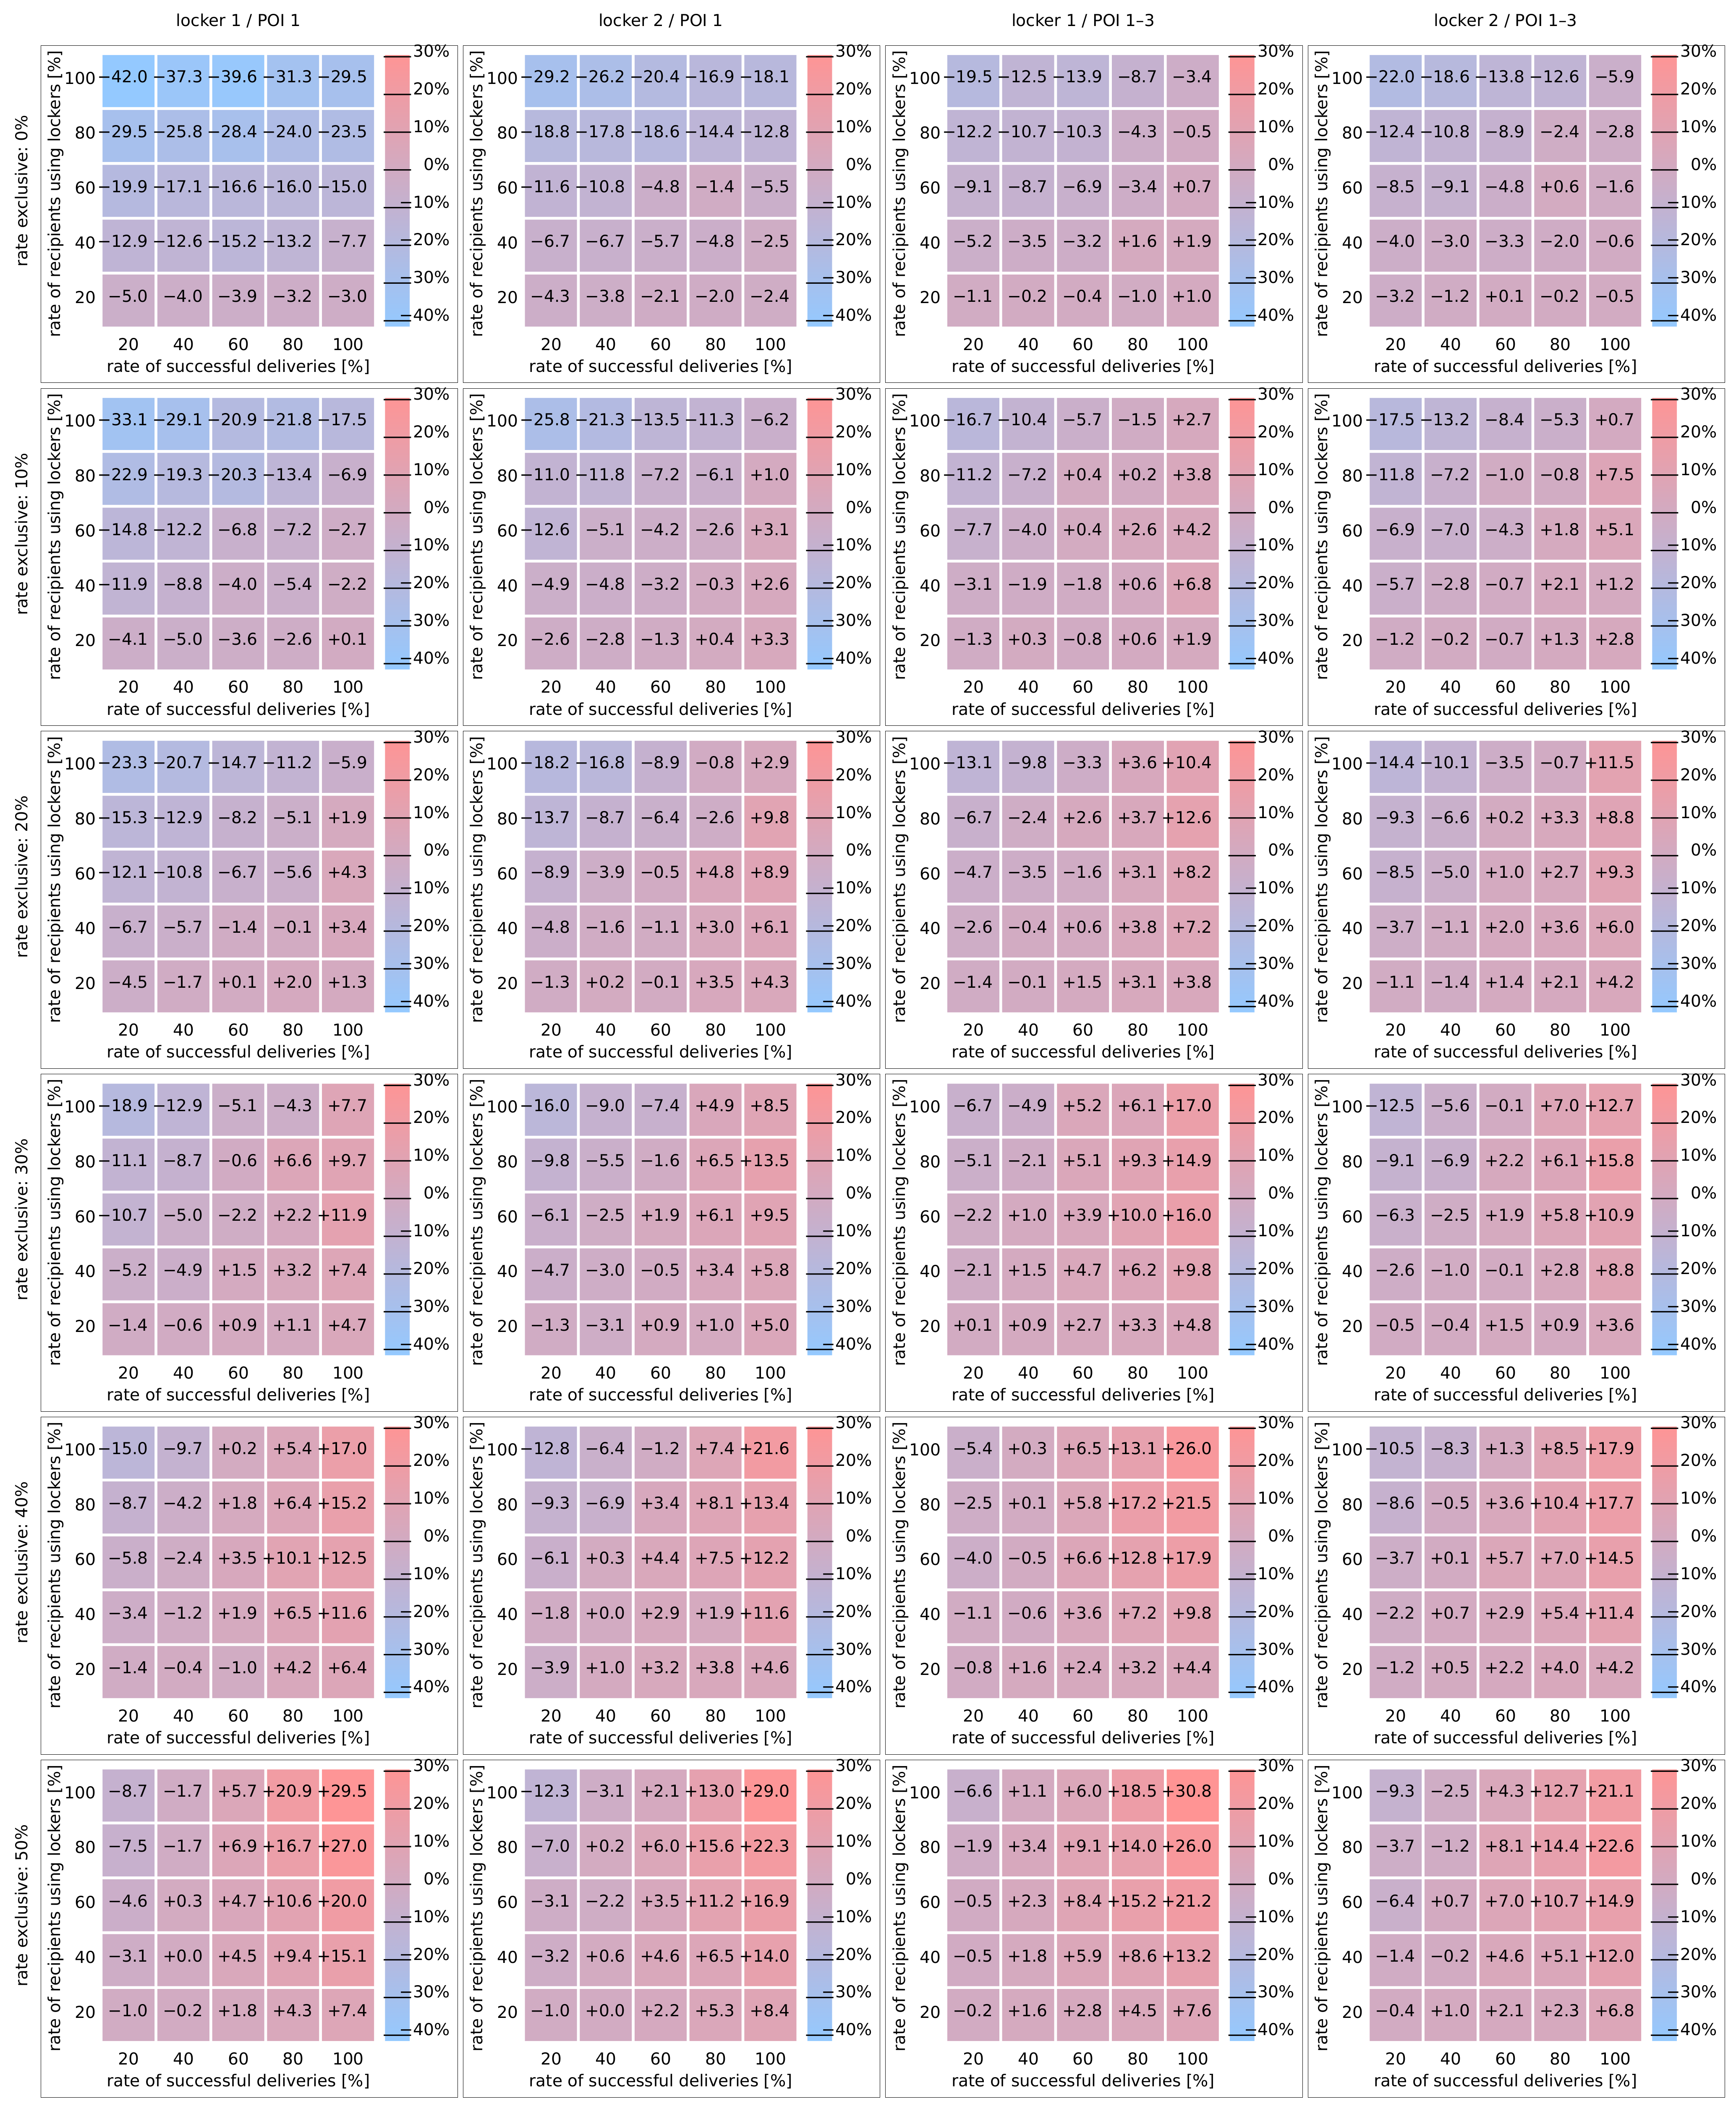
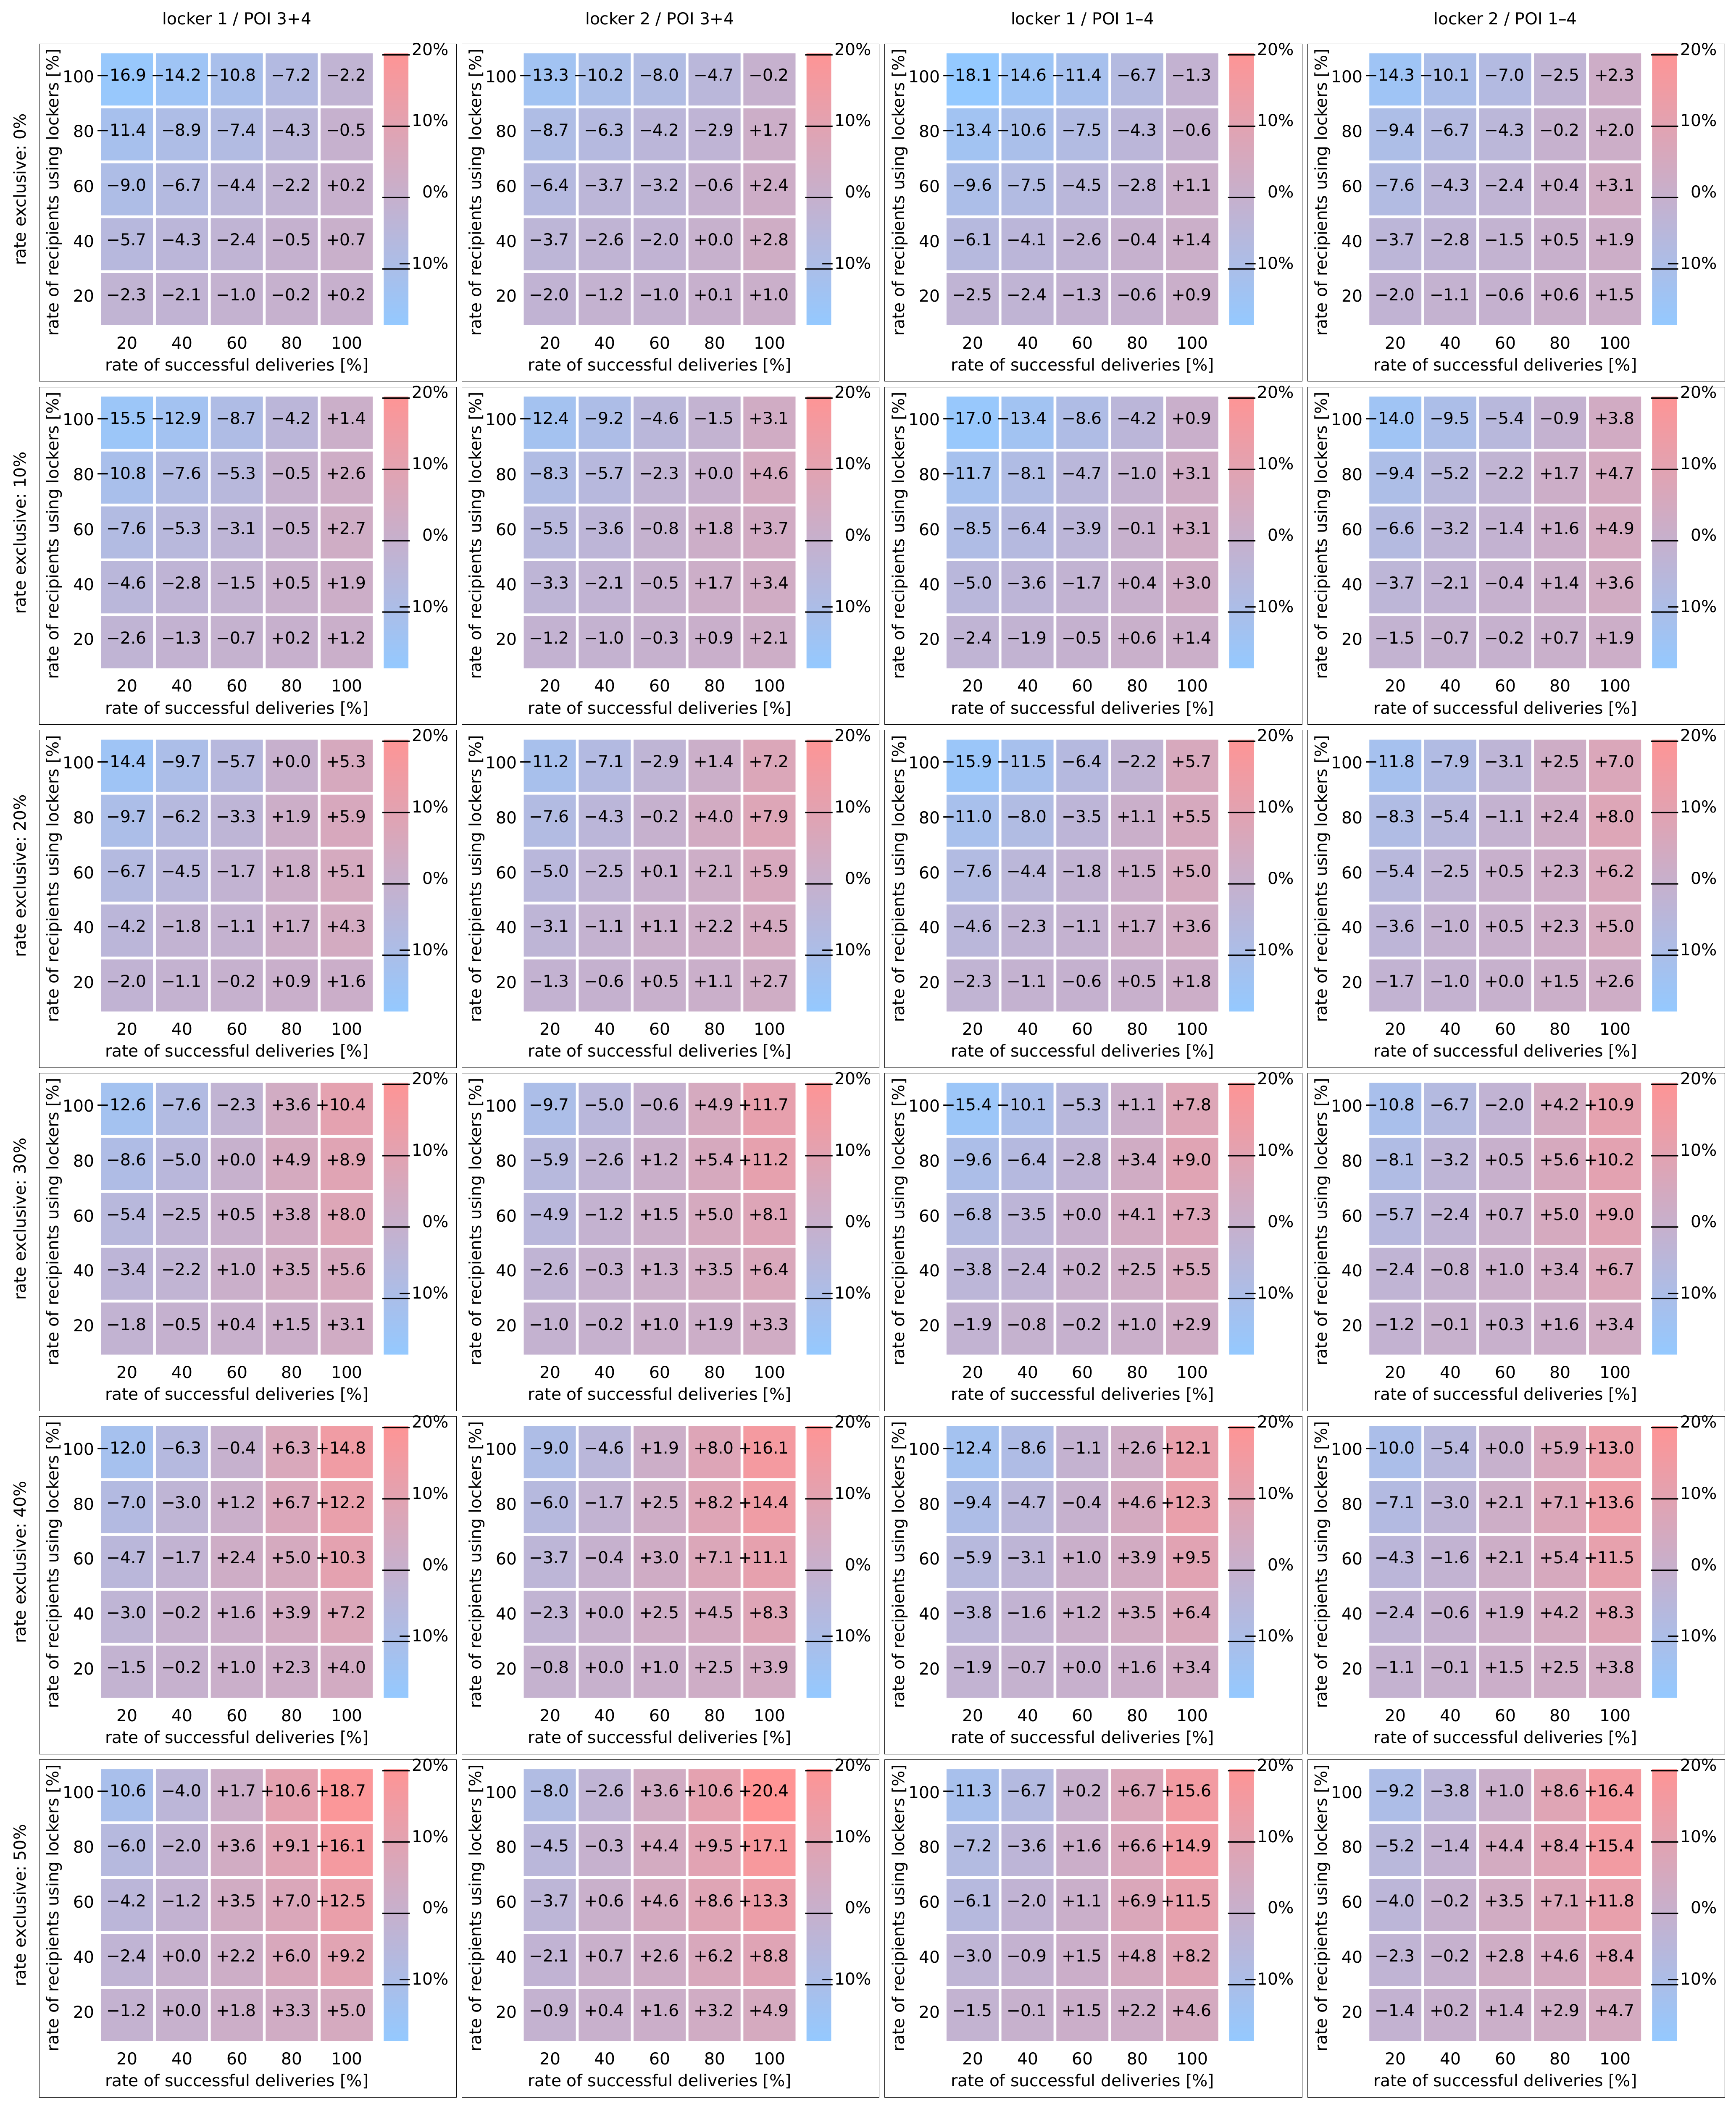
emissions depending on their location, their rate of utilization, and the rate of successful first deliveries. In
Figure 3, we present the impact on traveled distances for the instances as described in
Section 4 for the town of Korneuburg.
Figure 3 must be read as follows. Each column represents a set of experiments with respect to a setup of locker used and considered POIs. Each row, on the other hand, represents a different parameter value for the percentage of trips performed exclusively just to collect parcels. For each diagram, the percentage of successful first deliveries (at home by the CEP service providers) is given on the x-axis, while the y-axis consists of the penetration rate of locker usage, i.e., the percentage of recipients who are employing the parcel locker as delivery address.
Each cell in the diagrams represents the mean value of 30 runs for the specific scenario. For example, the mean percentage change in traveled distance when employing parcel lockers for a setting where no extra trip is performed to collect a parcel (rate exclusive 0%), almost half of the parcels can be successfully delivered at home (successful deliveries 40%) and only a few commuter (using lockers 20%) use the parcel lockers located at the train station (locker 1). The values are computed as the differences of the distances traveled without employing parcel lockers and the distances traveled with using parcel lockers. To avoid biases, not only the distances traveled for retrieving the parcels are considered but also the distances covered for reaching the POIs. Consequently, a positive value indicates a negative impact (additionally traveled distance).
The results of
Figure 3 can be interpreted as follows. For each individual diagram, the impacts get more positive with decreasing rates of first successful deliveries. In addition, with increasing utilization rates of the parcel lockers, the positive and negative impacts are intensified, respectively. This implies that the combination of high successful first deliveries and high utilization rate forms the worst case. In contrast, the combination of low successful deliveries and high utilization rate forms the best case.
A detectable impact can be measured based on the modal split used for commuting. Commuting via train only (POI 1) has a positive impact for the parcel locker located at the train station (locker 1). For the more centrally located parcel locker, the positive impact is not so high. In a first sight, this is counterintuitive. However, it is justified by the fact that not all commuters pick their parcel when commuting and therefore the difference, i.e., the additional travel, is more decisive. For the use case with car commuters as well (POI 1–3), the negative impact is not so high as some persons travel by car anyway.
With respect to the influence of exclusive trips made to collect parcels, it can be clearly seen that lower rates of exclusive trips have a less negative (or even positive) impact on the traveled distances (for tests on statistical significance, we refer to the end of this section). This is obvious as no extra trips are done by the private persons and the delivery tours of the CEP service providers can be significantly shortened.
It is, however, interesting that the positive impact of low successful first delivery rates gets less significant for low rates of exclusive trips. This can be reasoned by the fact that the percentage of traveled distances by the CEP service providers is relatively low compared to the sum of
all trips of private individuals, i.e., not only parcel collecting trips. This is inline with studies available on the impact of CEP service providers on the traffic volume [
22].
Further, it is interesting that the impact of the utilization rate of parcel lockers is significant—especially if the rate of successful first deliveries is low. This is due to the inconveniently located parcel pickup locations currently employed by CEP service providers.
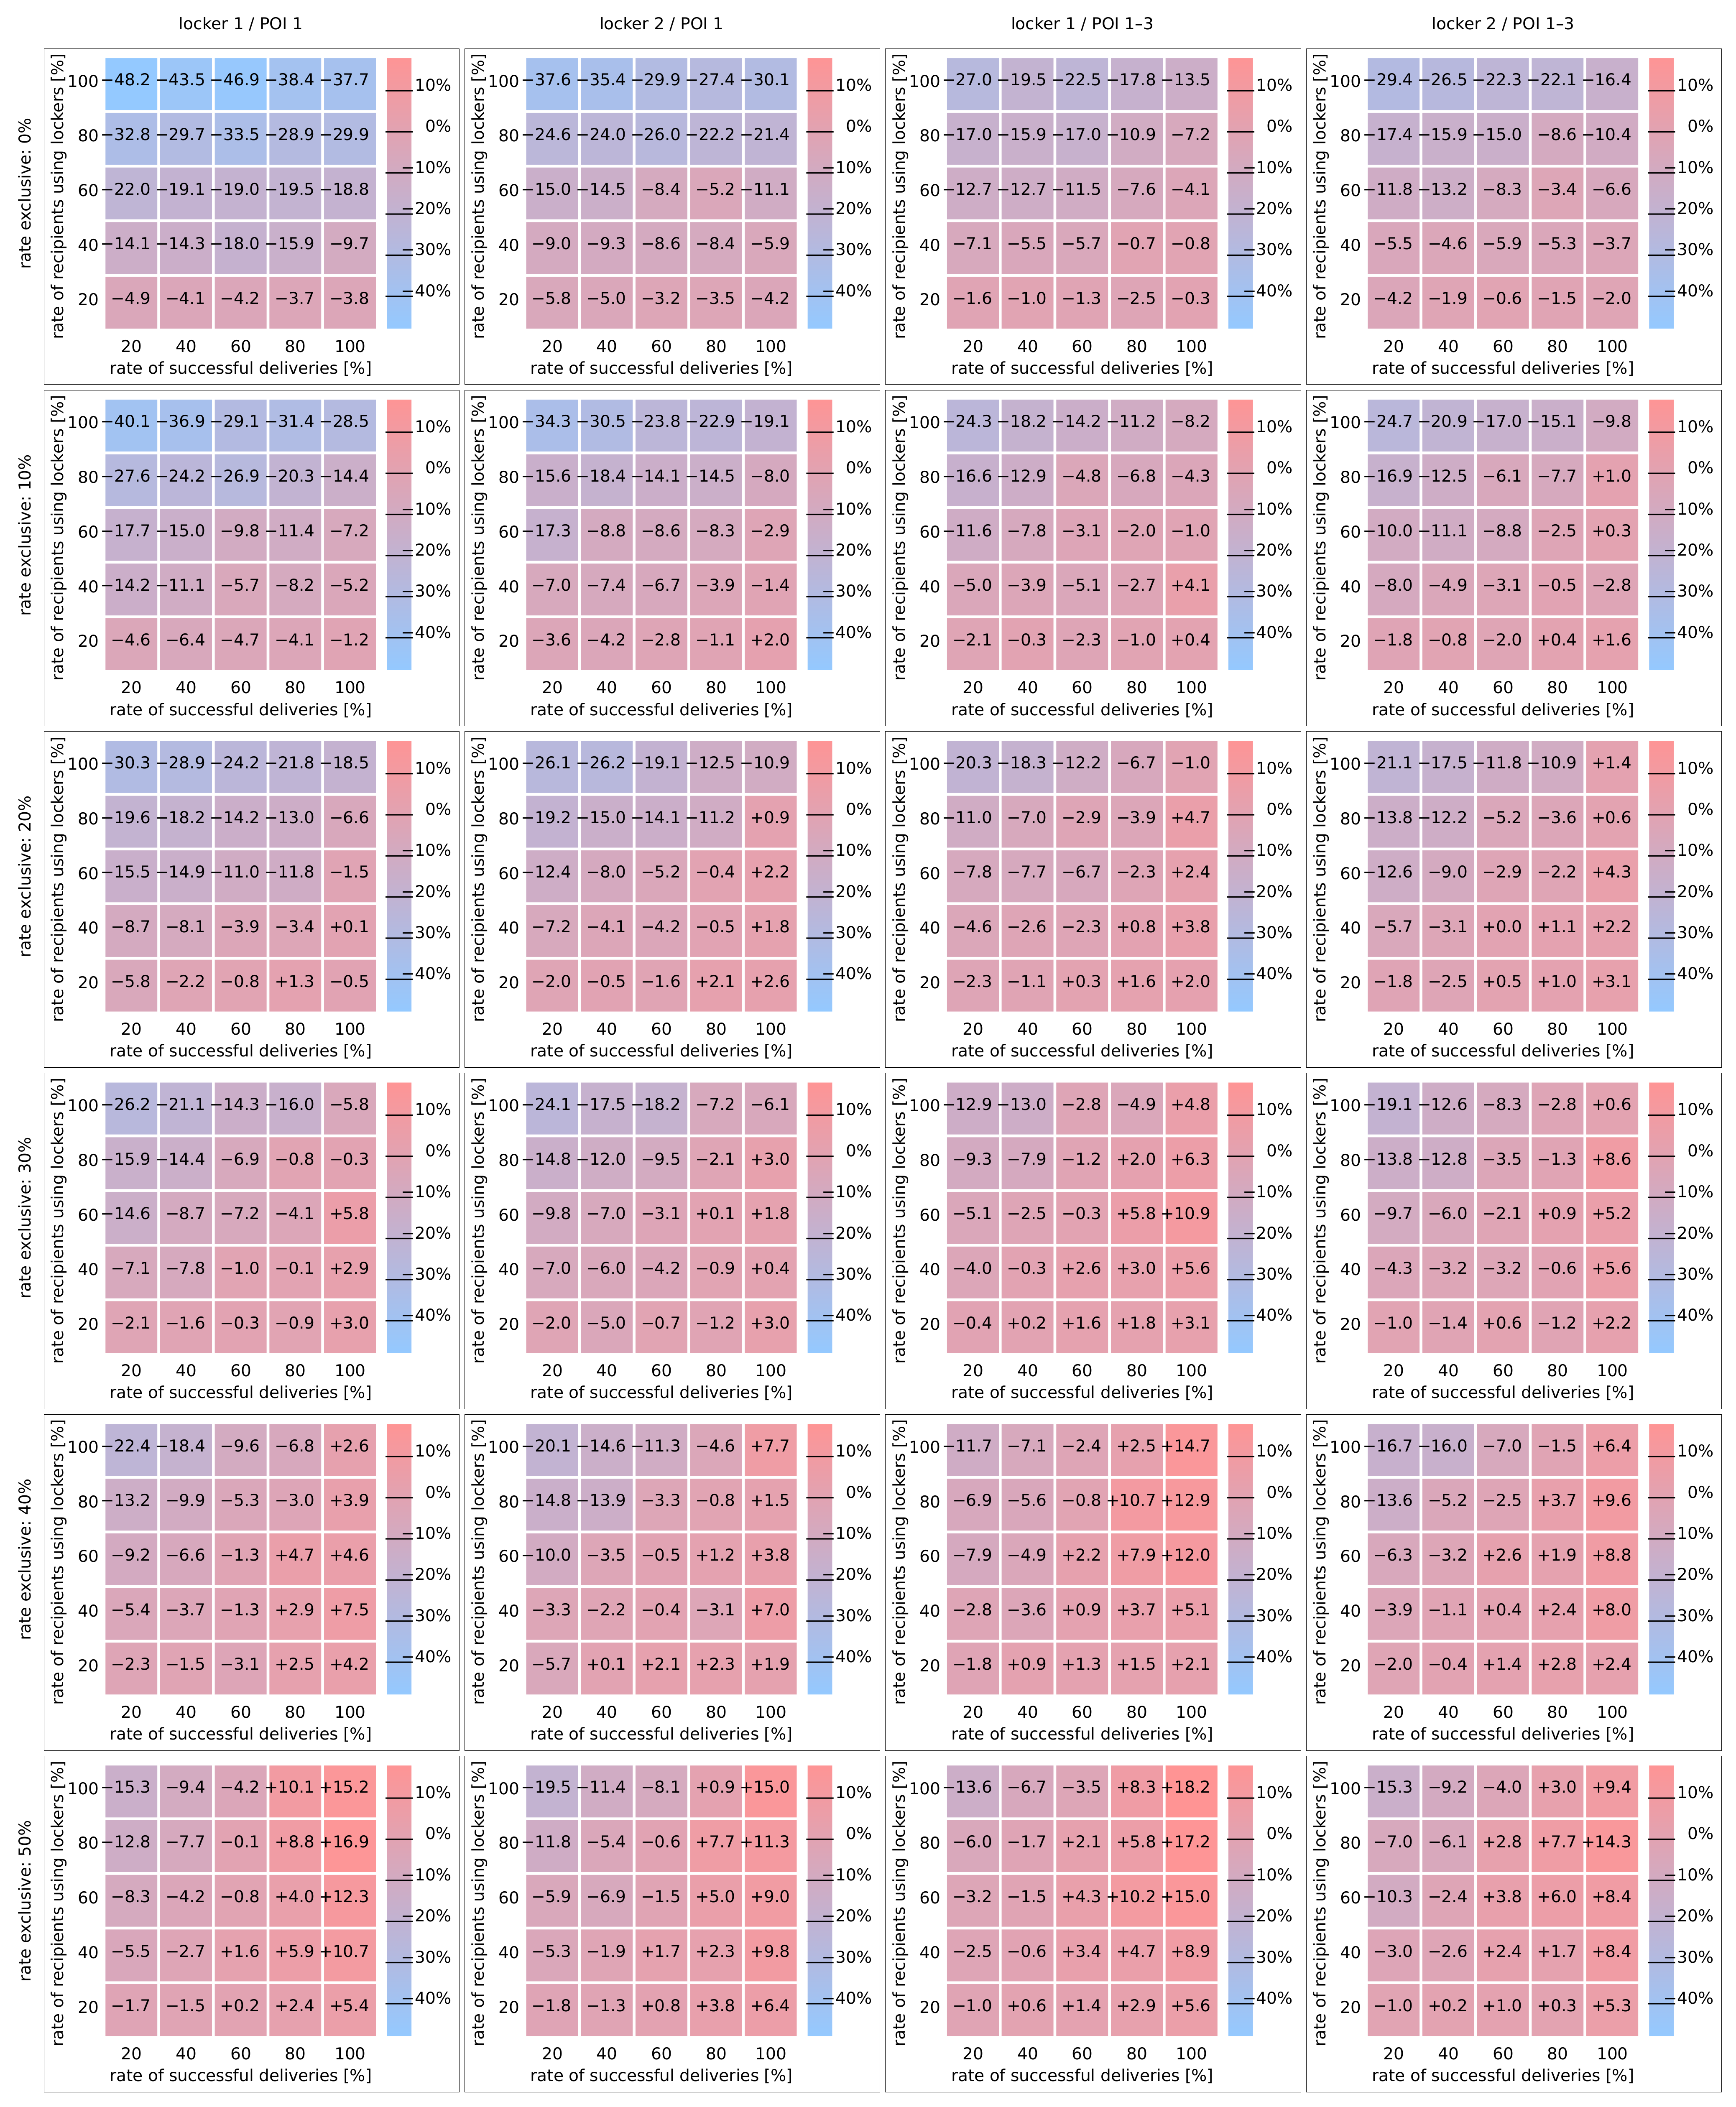
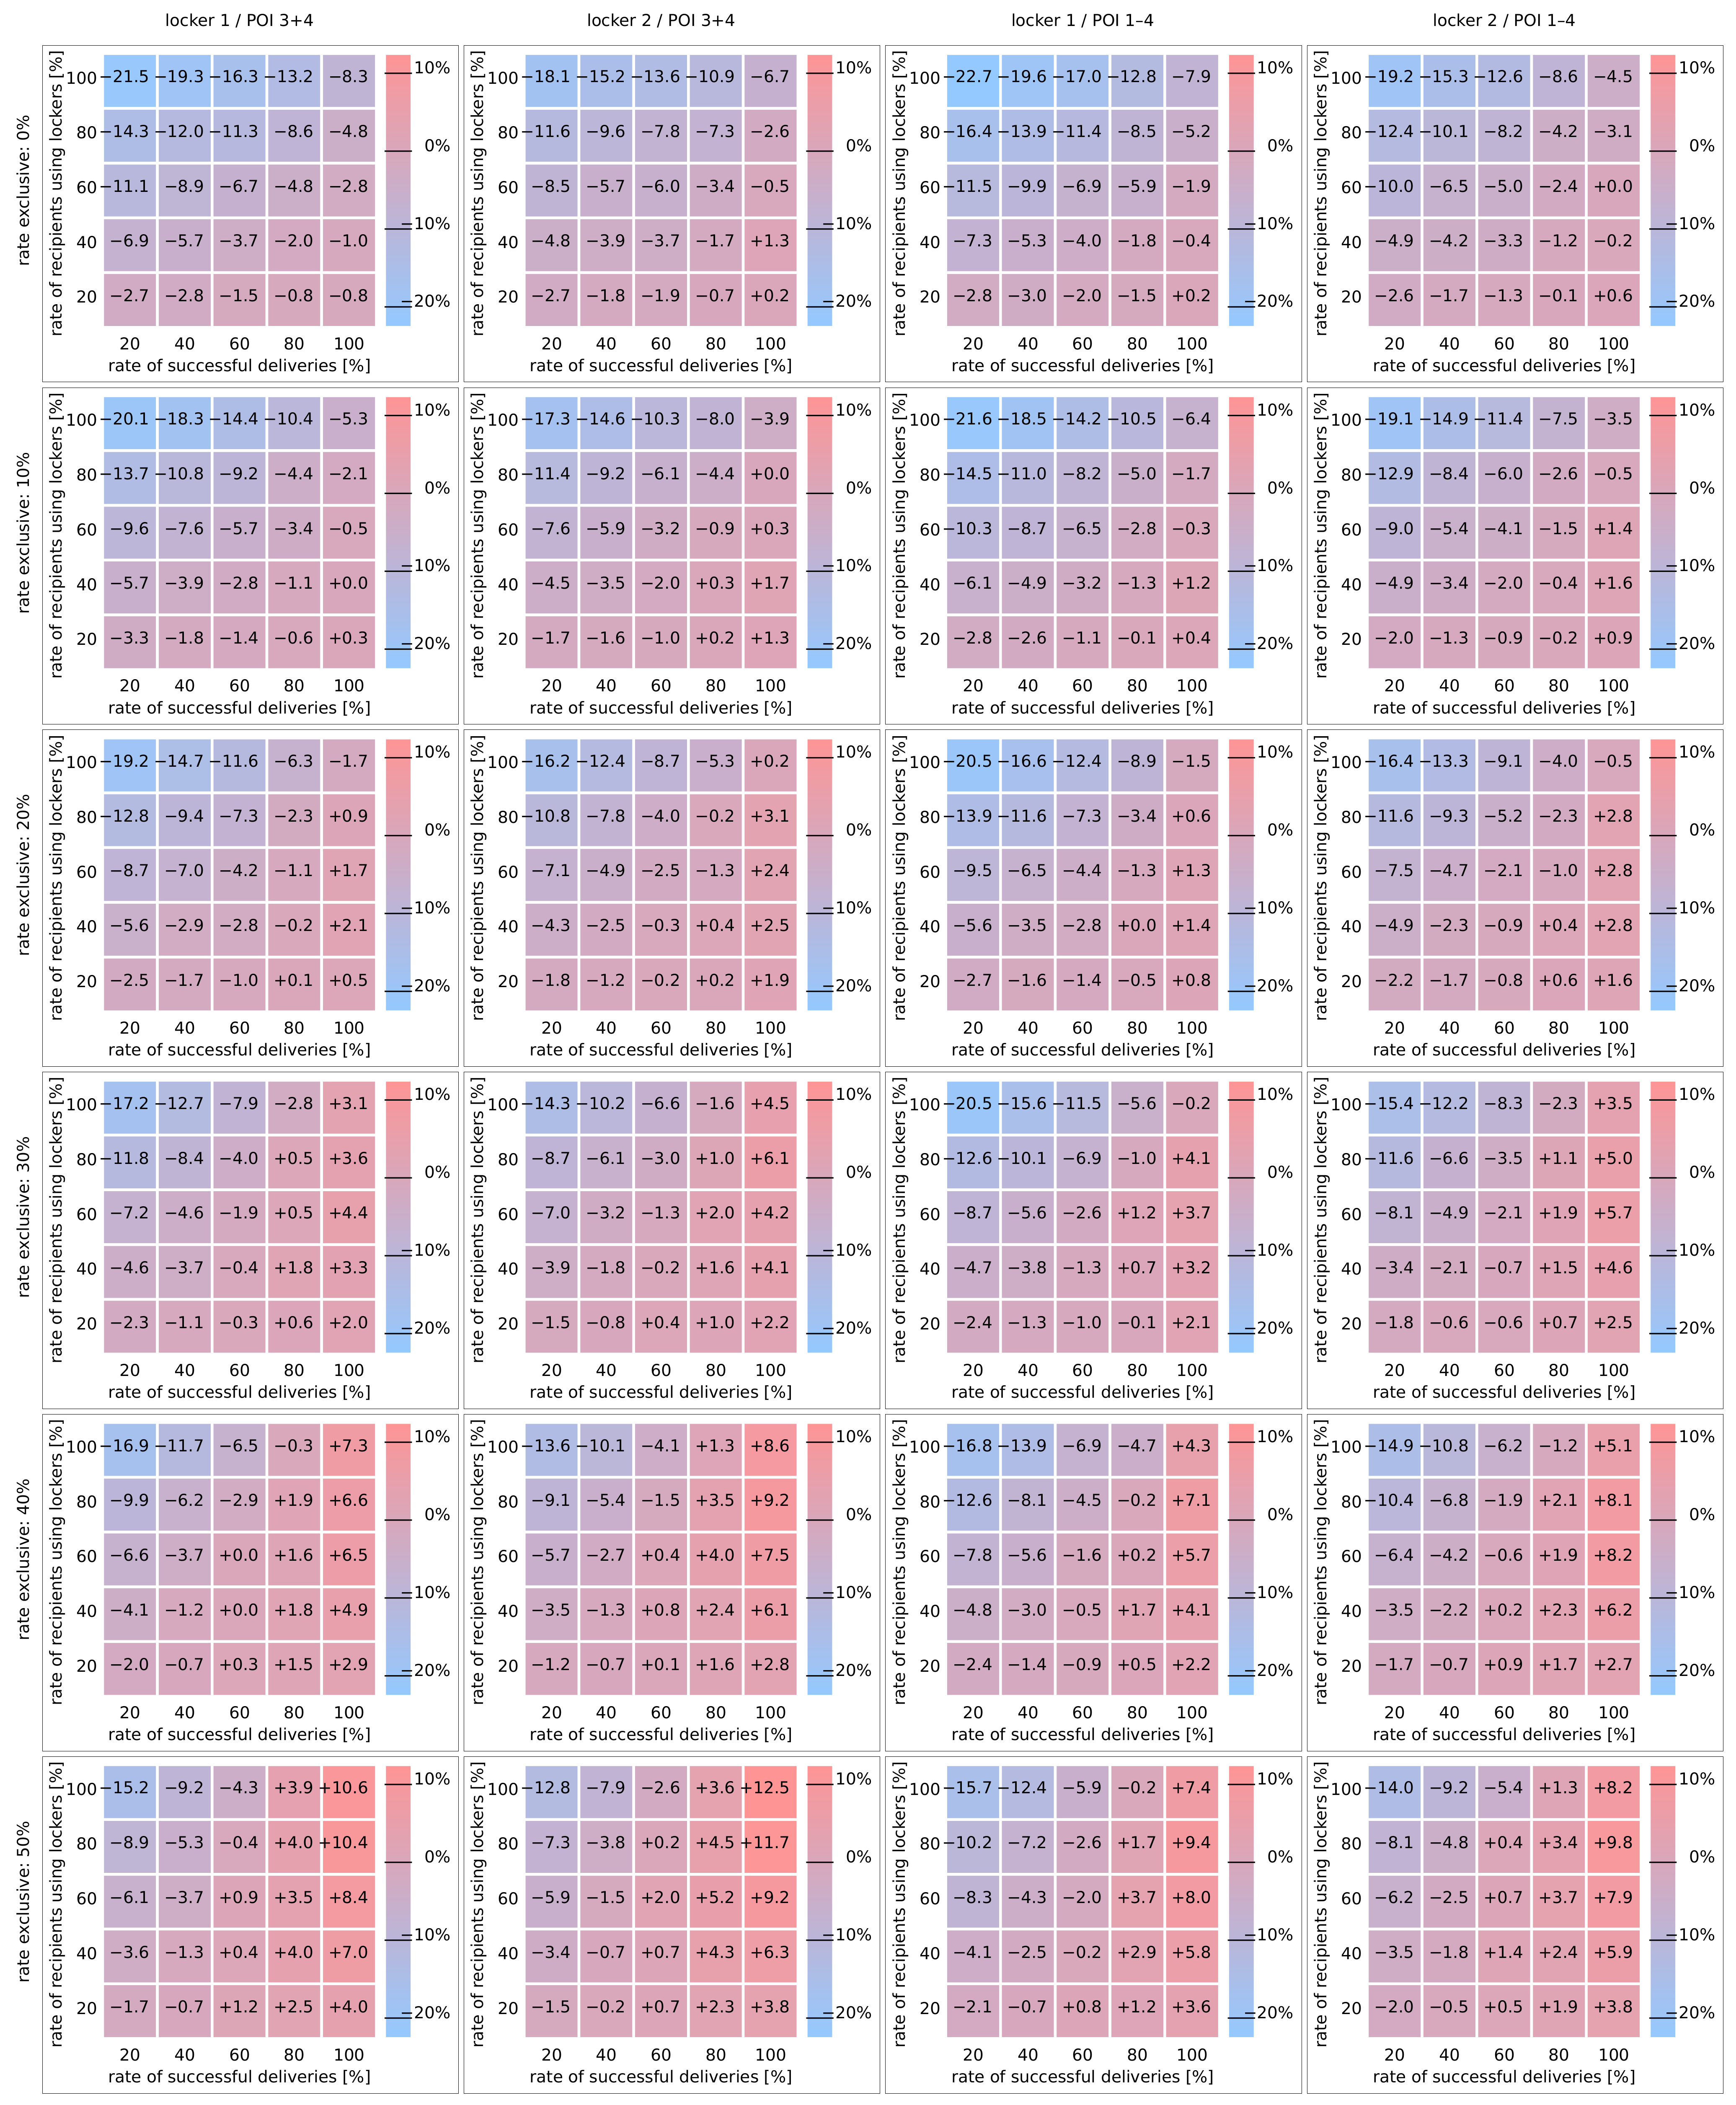
To examine the impact on CO
emissions, we refer to
Figure 4. The CO
emissions have been estimated on the traveled distance as well as the “average” vehicle used. As usual in Austria (and many other countries), we consider a van (e.g., Mercedes-Benz Sprinter or Fiat Ducato) for CEP service providers. A regular passenger car is considered for private trips. The actual CO
emissions assumed are listed in
Table 3 and correspond to emission values for state-of-the-art vehicles. As can be seen, the negative impact of parcel lockers with respect to CO
emissions is much less drastic then on the traveled distance. Only in few cases, an increase in CO
emissions can be expected. By contrast, a reduction of over 40% is realistic in the best case. This is reasoned by the fact that the emissions for delivery vans are almost double compared to emissions for passenger cars. In addition, “good” scenarios (i.e., scenarios with an even positive impact on the traveled distances) do not compensate saved travel distances of delivery vans with exhaustive extra traveled distances of passenger cars. Instead, picking up parcels whenever other trips are performed anyway has a double positive effect.
We refer to
Figure 5 and
Figure 6 for further evaluations with respect to the saved travel distance and CO
emissions, respectively, for the village of Kaumberg. Similar effects can be observed, which encourage a deduction of conclusions.
Finally, we conducted statistical tests to verify the graphical observations. We therefore performed a Wilcoxon rank sum test on four setups using the statistical software R.
Table 4 lists the obtained results. We tested the four extreme cases, i.e., minimum/maximum usage of lockers vs. minimum/maximum successful first deliveries. Please read
Table 4 as follows. A > sign indicates that the corresponding median value (e.g., use20, i.e., a usage of parcels lockers of 20%) is statistically significant greater than the other median value (e.g., use100). The actual values given correspond to the percentage change in traveled distance or CO
emissions, i.e., 1.02 indicates a median raise of 2%. Analogously, the < sign stands for statistically significant “less than”. If a ∼ sign is given, no statistical significance could be determined. The latter case is true only for the setups with a successful first delivery rate of 100%. In the columns “succ” and “use” the corresponding values for the successful first delivery and usage of lockers rate are given. The column labeled with “
p-value” indicates the actual p-value. Statistical significance could be determined with an error probability less than 0.0001 for almost all comparisons. Only for those setups with a successful first delivery of 100% no significance could be determined. The last column reports the effect size. As can be seen, the values are rather high except for the setups with high first delivery rates.
Although Korneuburg and Kaumberg are quite different in their framework setting (suburbs vs. rural small town, etc.), the results of the statistical tests are almost identical for both towns. This underlines the assumption that we expect to obtained similar results in other regions. To conclude, the statistical tests show that significance of the observed changes in traveled distance and CO emissions is given except for the setups with high successful first delivery rates, that is, no significant impact of parcel lockers can be detected in those cases.
However, for low successful first delivery rates, it is important that high utilization rates of parcel lockers are achieved as the significance tests showed that large impacts can be expected (which is underlined by high effect sizes). It is, however, not surprising that for those comparisons where low successful delivery rates are tested against high ones significant impacts of parcel lockers could be detected. This underlines that the extra mileage of CEP service providers for home deliveries is not meaningful in application cases where (most of) the recipients are not at home to take over the parcel.
6. Conclusions and Future Work
6.1. Conclusions
Within this paper, we examined the impact of parcel lockers and their positioning on the travel distance by car as well as the induced CO emissions. It can be summarized that parcel lockers have a positive impact under certain circumstances which can be easily achieved if consequently promoted.
Although we report within this paper on only two experimental setups, we performed additional computations for regions within the Austrian capital Vienna. Although the density of available pickup shops is much higher and the distances to walk/travel are much shorter the obtained results are very similar to the ones presented in the figures above. Therefore, we conclude that the impacts are relatively similar for further settings as well.
However, we want to stress that no general deduction of “a parcel locker will reduce the emitted CO” can be made. This is mainly since the individual surroundings and framework conditions have to be considered. For example, a badly placed parcel locker might have a (very) negative impact as huge detours have to be taken to collect the parcels.
As seen in the results presented in
Section 5, it is important that either the rate of successful first deliveries or the utilization rate of parcel lockers is increased. Especially in rural settings, one can expect that the majority of citizens is not at home during day. Therefore, three strategies could be followed:
increase successful first deliveries by concluding a storage permit, e.g., at a specific location. This is, obviously, only possible if access to the property can be granted and if a safe location is available.
increase parcel locker usage. By increasing the usage rate of parcel lockers, unsuccessful deliveries at home locations are reduced.
shift delivery windows. Most CEP service providers operate during office hours which means that parcel deliveries are potentially unsuccessful as the recipients are not at home but at their office. Therefore, a shift of parcel delivery time windows either into the (very) early morning hours or late afternoon/evening hours would have a positive impact.
It is now the task of the (political) administration to establish basic conditions that promote all or some of the above mentioned strategies. This could be to introduce incentives for the usage of parcel lockers (e.g., cost coverage). This could be to prohibit the delivery of parcels during office hours. Many other strategies and framework conditions could be thought of. In the end, it is a political decision.
Based on the results presented in
Section 5, we further recommend reducing the number of exclusive trips. This can either be achieved by smartly positioning parcel lockers such that collecting the parcels is naturally combined with other purposes or by promoting sustainable behavior. The latter could, for example, be gained by consciousness raising campaigns. Other mechanism could be to avoid informing recipients about parcel deliveries when it is likely that they start an extra trip to receive the parcel, e.g., in the evening.
Finally, the thoroughly planning of pickup locations (parcel lockers or conventional) has a major impact on the extra distances traveled (and therefore CO emissions). Therefore, the main goal of (political) decision makers must be to promote sustainable pickup locations and prohibit pure cost-induced decisions like pickup locations at fuel stations or in industrial areas, which might be cheaper than those situated close to living areas. The latter are, however, preferable from a customer-convenience perspective as well as from an environmental perspective.
Furthermore, especially in (larger) cities, it is promising to place lockers in apartment buildings as then the extra traveled distance is reduced to zero in any case leading to maximum savings.
6.2. Future Work
In [
23], Lemke et al. show that the acceptance of parcel lockers by those people who chose to utilize parcel lockers is quite high. We think that further studies should be conducted on how the actual service could be improved such that the operation of parcel lockers leads to an economically viable business model. This is especially backed by the observation in [
9], where the most decisive factor for the acceptance of parcel lockers is not monetary costs but reachability.
To outline possible future research: Currently there are mainly two business models applied with respect to open parcel lockers. The first one states that the recipients have to pay for the lockers. Basically, they are renting a locker and have to pay for this service. The second business model asks the CEP service provider to pay for delivering the parcels to the lockers. Some CEP service provider neglect this and do not deposit parcels in such parcels lockers.
Beside these two business models, one could think of a model where the parcel locker is operated (and financed) by a grocery shop (or any other shop). It could be expected that additional customers are attracted to the shop due to the parcel lockers. Another operational model might be that communities (e.g., the city) provides the parcel lockers to their inhabitants. However, we think that there are a lot of potential operational models (and combinations of them) which need to be investigated in more detail with respect to economical viability and acceptance by the recipients and CEP service providers.
In addition, the study of Lemke et al. did not evaluate how the acceptance of non-users would be or why they do not choose parcel lockers as delivery option. We think that future work should cover these aspects as well as further investigations should be conducted with respect to mobility behavior as intended in [
24].

 ,
, 


