Article

Whole-Field Stress Sensing and Multiscale Mechanics for Developing Cement-Based Composites Containing Recycled Municipal Granular Wastes

1
School of Chemical and Process Engineering, University of Leeds, Leeds LS2 9JT, UK
2
Center for Advanced Materials, Qatar University, Doha 2713, Qatar
3
Department of Environmental Engineering, Hacettepe University, Ankara 06800, Turkey
*
Author to whom correspondence should be addressed.
Sustainability 2021, 13(2), 848; https://0-doi-org.brum.beds.ac.uk/10.3390/su13020848
Submission received: 17 December 2020 / Revised: 12 January 2021 / Accepted: 13 January 2021 / Published: 16 January 2021
(This article belongs to the Special Issue Granular Materials and Sustainable Industrial Processes)

Abstract

:
Worldwide, there is a growing level of interest to develop sustainable cement-based products and processes in which the usage of natural resources such as sand and limestone are reduced from the current levels. One of the ways to achieve this is by replacing them with suitable inclusions of recycled granular materials from municipal wastes where possible. However, to understand the effects of such inclusions in concrete structures, research advancements are needed to sense and characterise the distribution of stresses (/strains) at the local scale and to establish their links with the fracture and bulk strength characteristics under external loading environments, which is the focus here. In this research, polyethylene (PE)-based granular materials derived from municipal wastes and fly ash obtained from the incineration of municipal solid wastes are used together as secondary raw materials in preparing the concrete mixtures. Photo stress analysis (PSA) is performed here, making non-contact and whole-field digital measurements of maximum shear stress distribution and the directions of the principal stresses at any point of interest on the surface of the samples under external loading. Their links with the fracture toughness and flexural strength of the samples cured at different times are presented. The novel PSA-based stresssensing helps to establish new understandings of the strength characteristics of composites across scales in the applications involving recycling and reusing conventional wastes and possibly in otherengineering applications in the future.

1. Introduction

Concrete, in general, can be defined as a composite material consisting of binding materials (i.e., Portland cement, lime) mixed with filler medium (i.e., fine and coarse granular material), and water and admixtures in specific proportions [1]. When Portland cement is mixed with water, cement paste is produced as a result of a chemical reaction, which is called hydration, between cement and water. In concrete, cement paste acts as a binding medium, while aggregates such as sand and gravel act as fillers. Cement paste fills the space between aggregates and keeps all aggregates embedded into the solid matrix. As cement paste hardens and gains strength, it forms a stone-like mass that is called concrete.
Concrete is one of the most versatile and widely used construction materials in the world [2]. However, despite all the benefits of concrete, there are adverse impacts of concrete on the environment [3,4]. The production of 1 tonne of cement emits between 0.6 and 1.0 tonne of CO2 into the atmosphere [5]. Hence, cement production, all around the world, is contributing about 5–7% of anthropogenic CO2 emissions [6].
Furthermore, concrete consumes a large amount of natural aggregates. About 60–70% of the concrete volume is occupied by fine and coarse aggregates [7]. As the demand for concrete increases, consumption of cement and aggregates will continue with their adverse environmental effects.
Sustainable development in the construction industry requires reducing the consumption of cement and natural aggregates while increasing the quality of concrete. This requirement is one of the motivations of the construction industry to incorporate solid waste materials and industrial by-products in the production of cement-based materials [3,8]. To reduce the cement amount, some industrial granular by-products such as coal fly ash [9], municipal fly ash [10,11,12,13], ground granulated blast-furnace slag [14,15], and silica fumes [16,17] have been used as cement replacement or admixtures. Furthermore, recent studies show the suitability of using bottom fly ash, especially in vitrified form, as a valuable replacement for ordinary Portland cement (OPC) and sand in mortars [18]. Other studies have shown the usefulness of applying different pre-treatment procedures to improve the performance of fly ash in developing sustainable concretes [19]. To decrease the natural aggregate demand, granular aggregates from recycled concrete [20,21] and recycled polymers [22,23] have been used in the construction industry in consideration of sustainability. In several countries, polymeric materials derived from municipal wastes are used for this purpose. For example, Figure 1 shows the typical polymeric waste contents available in Qatar municipal wastes [24,25]. A few examples of the materials studied were high-density and low-density polyethylene (HDPE and LDPE, respectively), polyethylene terephthalate (PET), polycarbonate (PC), polyvinyl chloride (PVC), polystyrene (PS), acrylonitrile butadiene styrene (ABS), and recycled polypropylene reinforced with materials such as talc and fibre glass. HDPE and LDPE constitute a major proportion. Al-Ma’adeed et al. [25] compared the environmental impacts of virgin and recycled thermoplastics (polypropylene [PP] and polyethylene [PE]) with mineral fillers like talc and glass fibre and reported that recycling has a lower environmental effect.
The construction industry is facing difficulties in adopting more sustainable practices, including the use of waste, by-products, or recycled granular materials to reduce CO2 emissions and conserve natural raw materials because the substitution of these granular materials in concrete makes its heterogeneous nature more complex and challenging. However, one of the fundamental challenges to overcome in developing and designing new composite concretes is to understand the mechanical strength characteristics of concretes at both micro (local) and macro (global) scales. The current level of strength evaluation tests mostly pertain to global strength measures [1].
For concretes subjected to external loading conditions, micro-scale strain measurements are generally made using electrical strain gauges and rosettes [26,27]. Fibre optic sensors could help to make strain measurements inside concretes, but with some intrusion effects of the sensor [28]. Signals derived from other methods such as holographic interferometry [29] and acoustic emission [30] are used to infer and monitor crack growth in concrete structures. Infrared (IR) thermography [31] and digital image correlation (DIC) [32,33,34] have been used to detect displacements and crack formation on the surface of concretes. Photo stress analysis (PSA) [35] has been reported to detect stress (/strain) distribution on materials by studying the birefringent (/photonic) properties of light-transmitting materials, or using birefringent coatings applied on opaque materials under mechanical loading. Each method has its advantages and disadvantages, however, non-contact and whole-field measurement methods including having the ability to analyse stresses on relatively hard materials are generally preferable. Research on the applicability of PSA to concrete structures is relatively scarce in the literature.
Here, using PSA, the focus is on sensing and analysing the evolution of maximum shear stress (/shear strain) distribution on concrete samples hosting granular materials derived from municipal wastes and fly ash obtained from the incineration of municipal solid wastes. Cylindrical and beam samples of the concretes are considered in this study. The cylindrical samples were subjected to an axial compression test and the rectangular notched beams were subjected to the flexural strength test as per ASTM standards. Using PSA, detailed analysis was reported on the variation of the shear stress concentration factor in all types of the samples and more accurate characterisation of the local fracture processing zone (where deviator stress (/strain) is most dominant) in the notched samples. These, in turn, helped to link with the evaluation of the fracture toughness of composite concretes considered here.

2. Materials and Methods
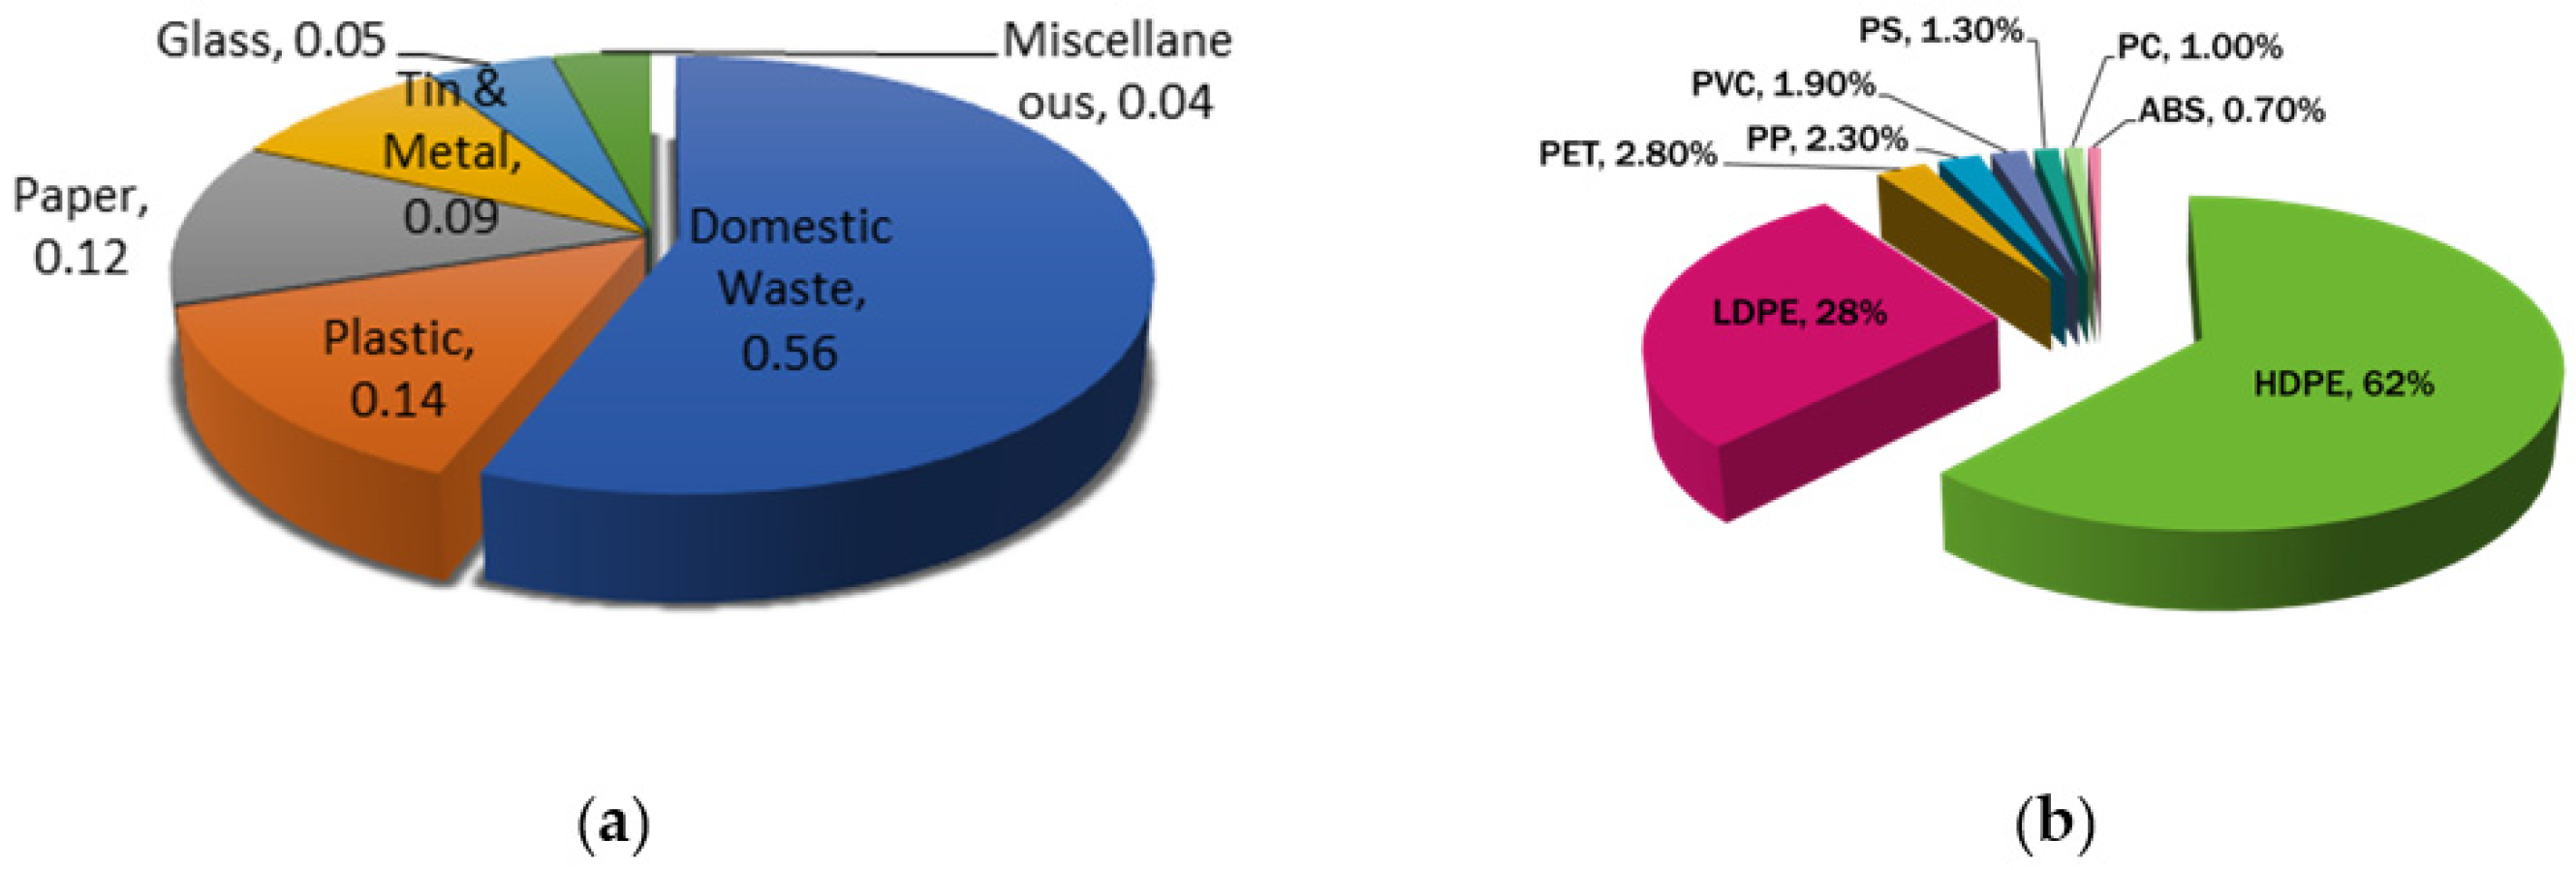
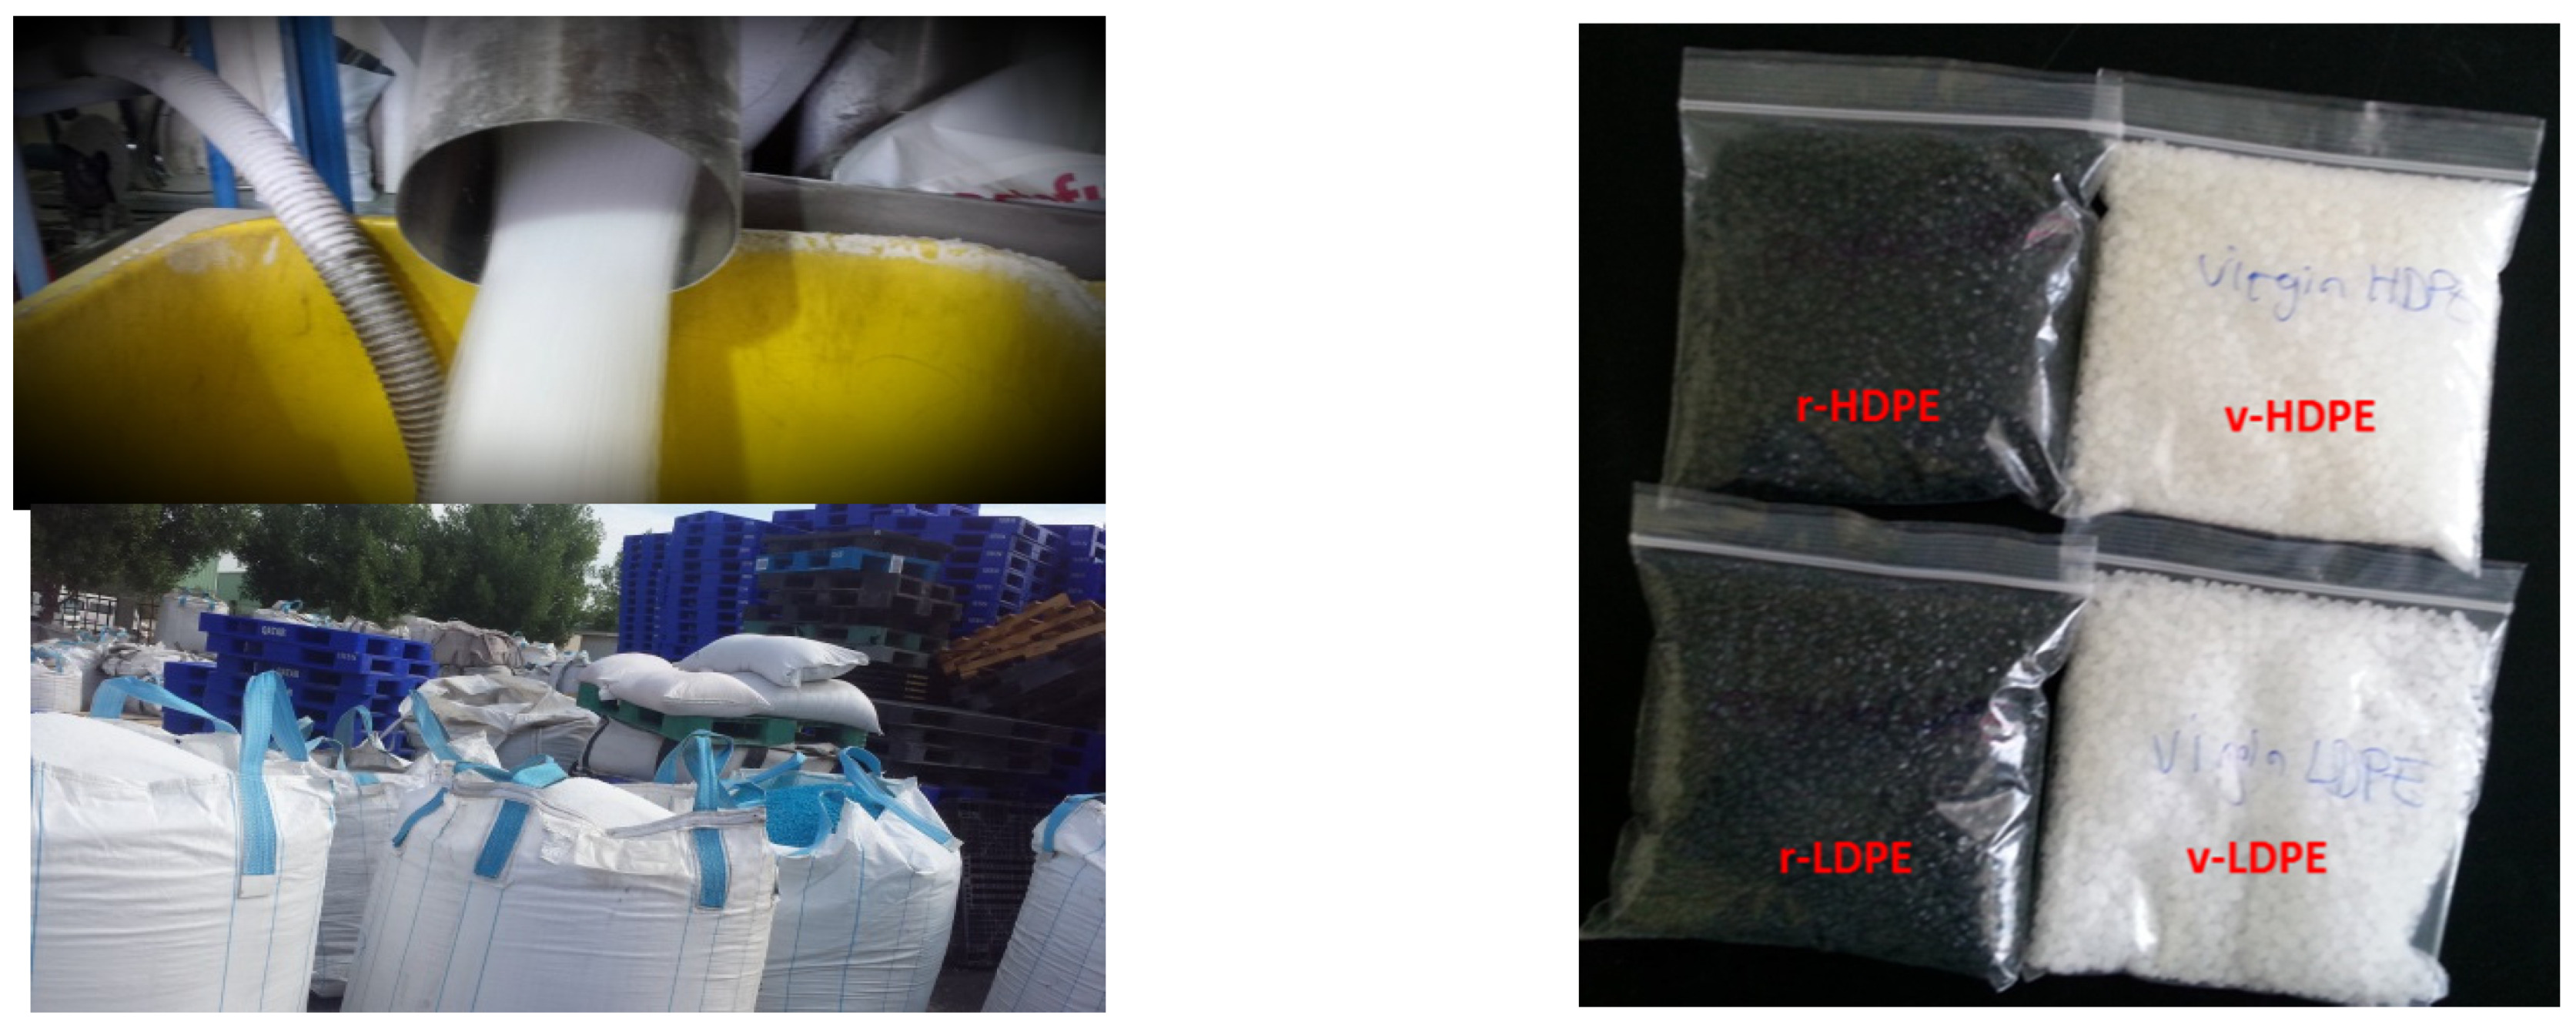
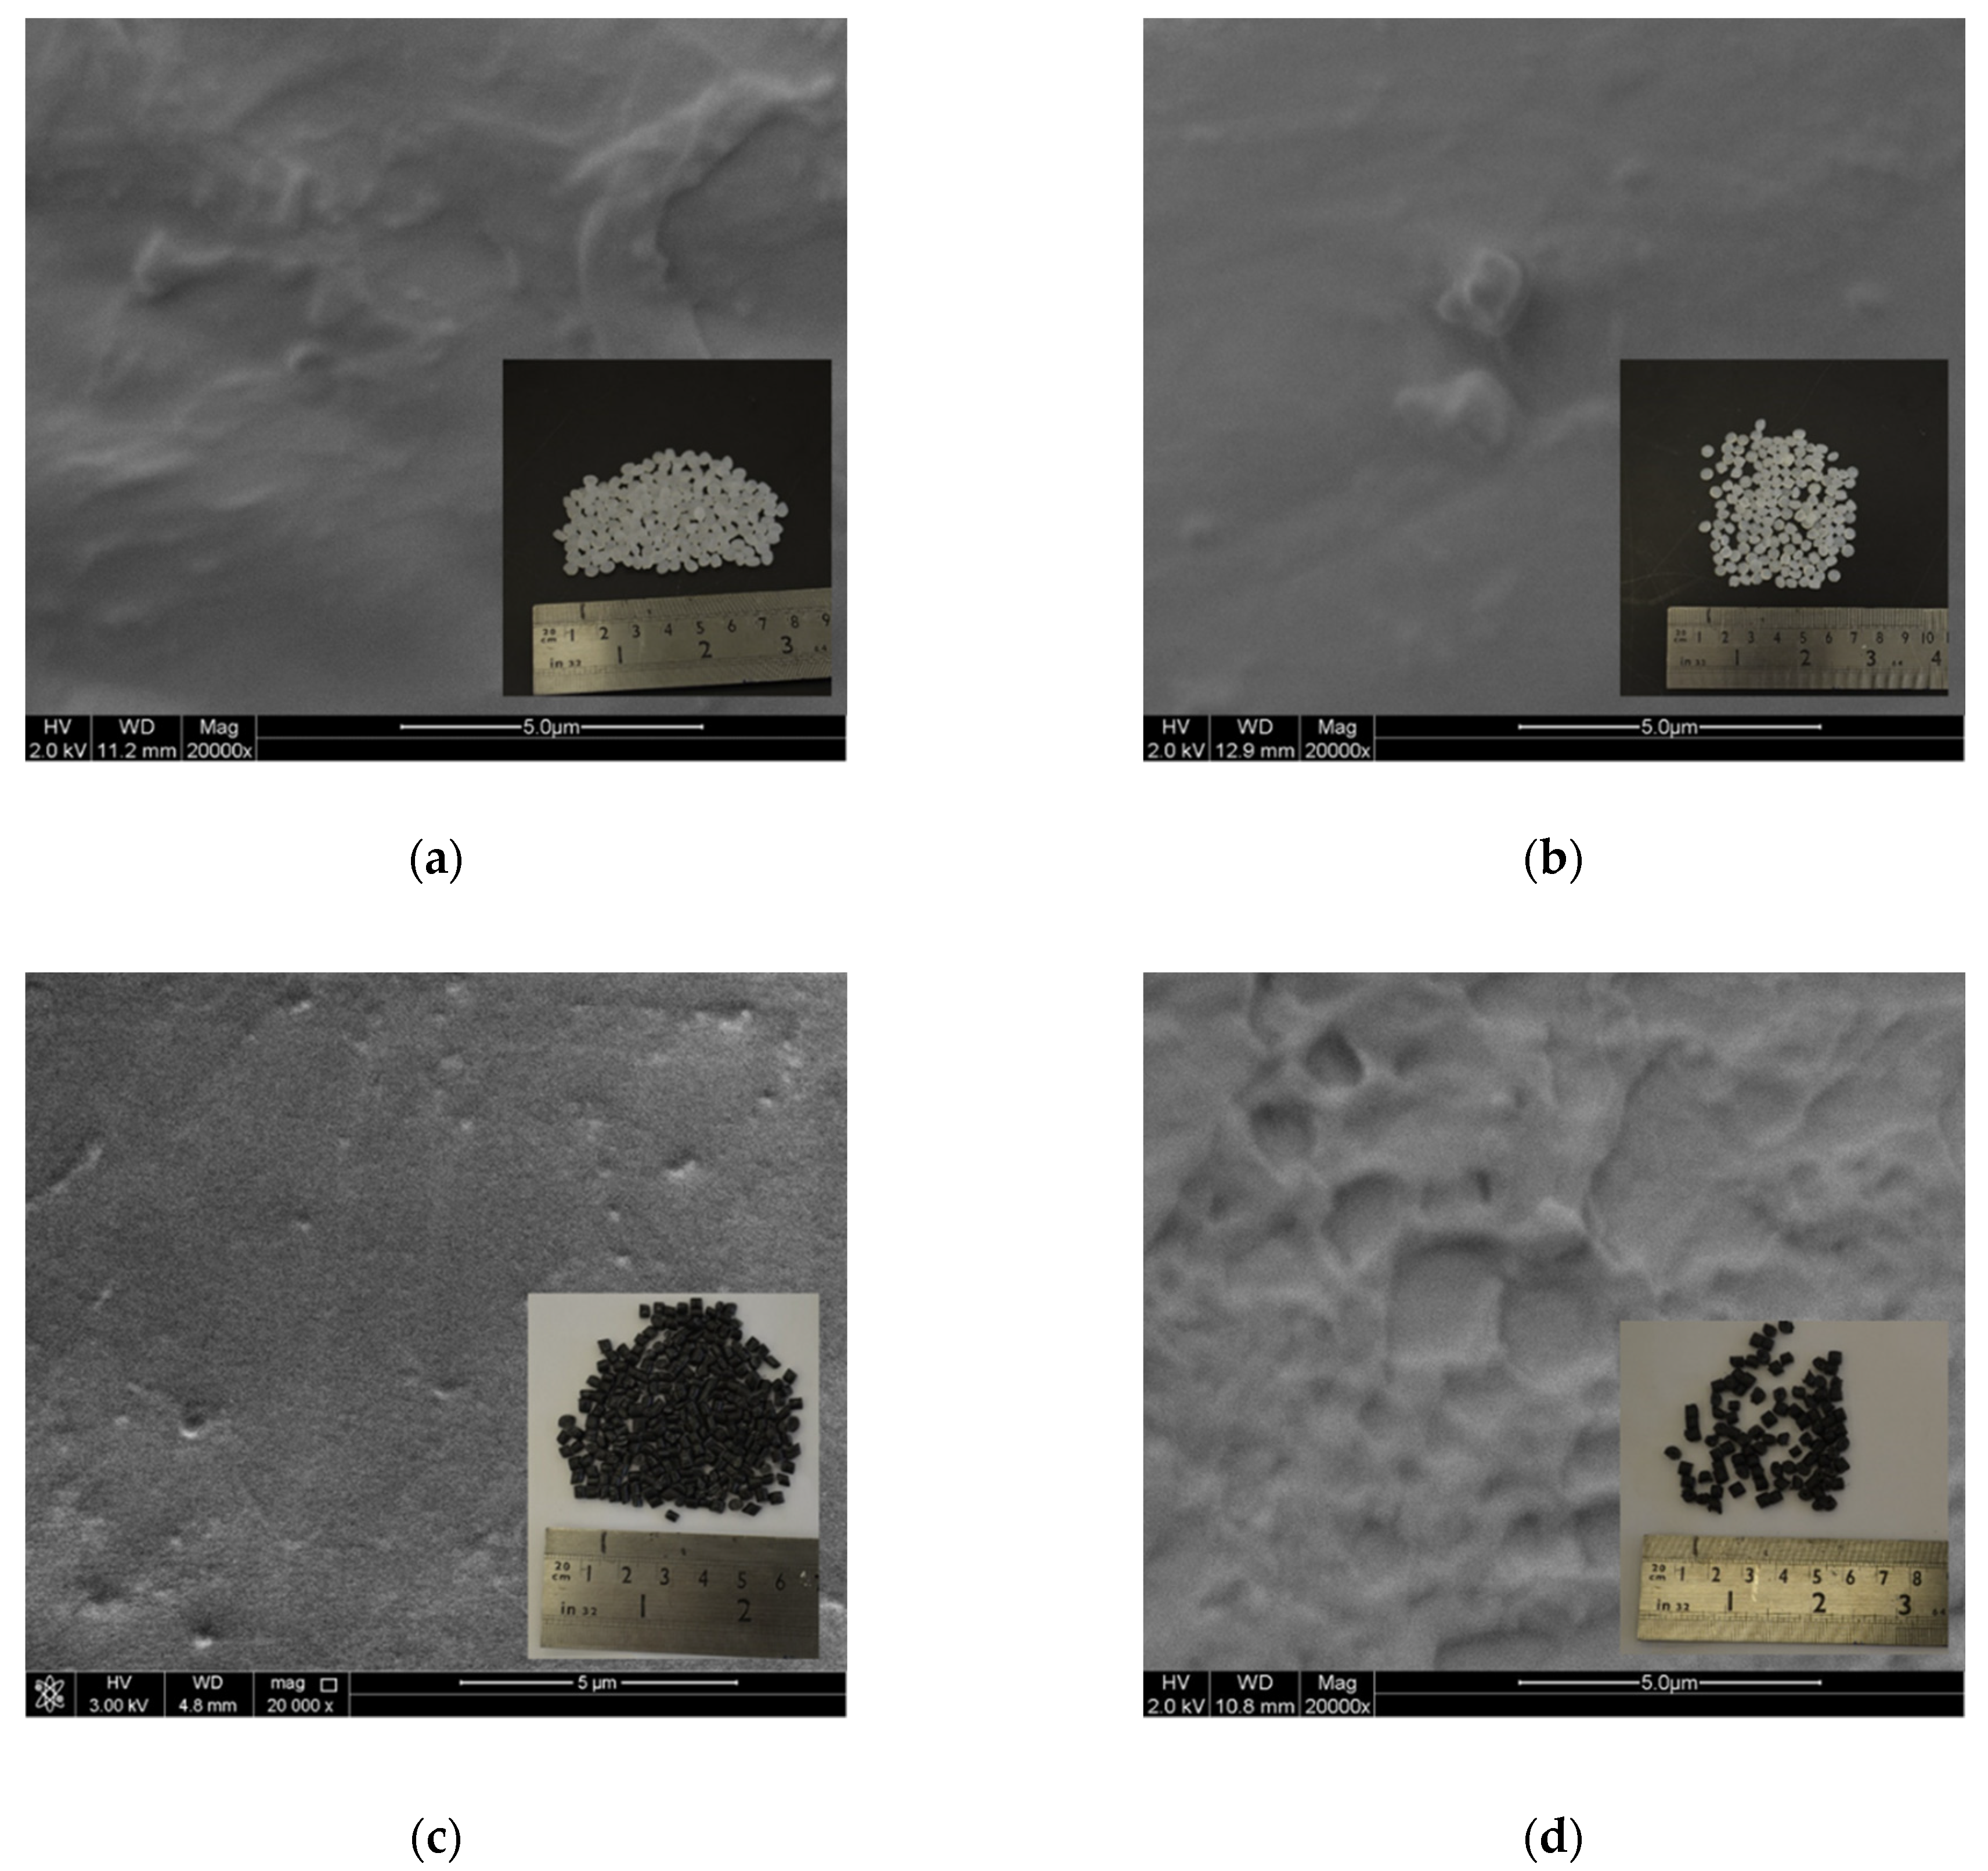
2.1. Materials

In this study, different types of granules recycled from Qatar’s domestic solid waste processing streams were used (Figure 2). They were added into concrete mixes in controlled proportions for making seven different types of concrete samples. In all concrete mixtures, a polycarboxylic-ether-based superplasticiser with a specific gravity of 1.11 ± 0.03 was used to obtain the desired workability and kept constant for comparison. The amount of superplasticiser (SP) was about 3.5% by weight of cement for all concrete mixtures. The aggregates were procured from the local recycling companies in Qatar as detailed below.
The plastic materials (Figure 2) comprised virgin high-density polyethylene (v-HDPE) samples (collected from Qatar Chemical Company (QCHEM)) and virgin low-density polyethylene (v-LDPE) samples (collected from Qatar Petrochemical Company (QAPCO)). They were used in the mixtures in systematic proportions to compare their effect on the mechanical properties of the concrete samples. Both v-HDPE and v-LDPE were in the form of spherical granules with an average diameter of 3.0 mm (0.118 in.). Recycled polyethylene granules were collected from one of the plastic recycling companies in Qatar. In this plant, first HDPE and LDPE municipal plastic wastes were separated, and then they were processed. Separated HDPE and LDPE wastes were washed and crushed into scraps. Before extrusion, these crushed scraps were dried and then fed into the extruder and extracted as plastic wires. Finally, these plastic wires were reshaped into cylindrical granules (Figure 1 and Figure 2), and fibres (r-HDPE fibres of length 3–10 mm and 100 µm diameter). The average diameter and length were 4.0 mm and 3.5 mm for r-HDPE, and both 3.0 mm for r-LDPE. The properties of polyethylene used in this research are given in Table 1, while the shape and size of polyethylene aggregates along with their SEM images are presented in Figure 3.

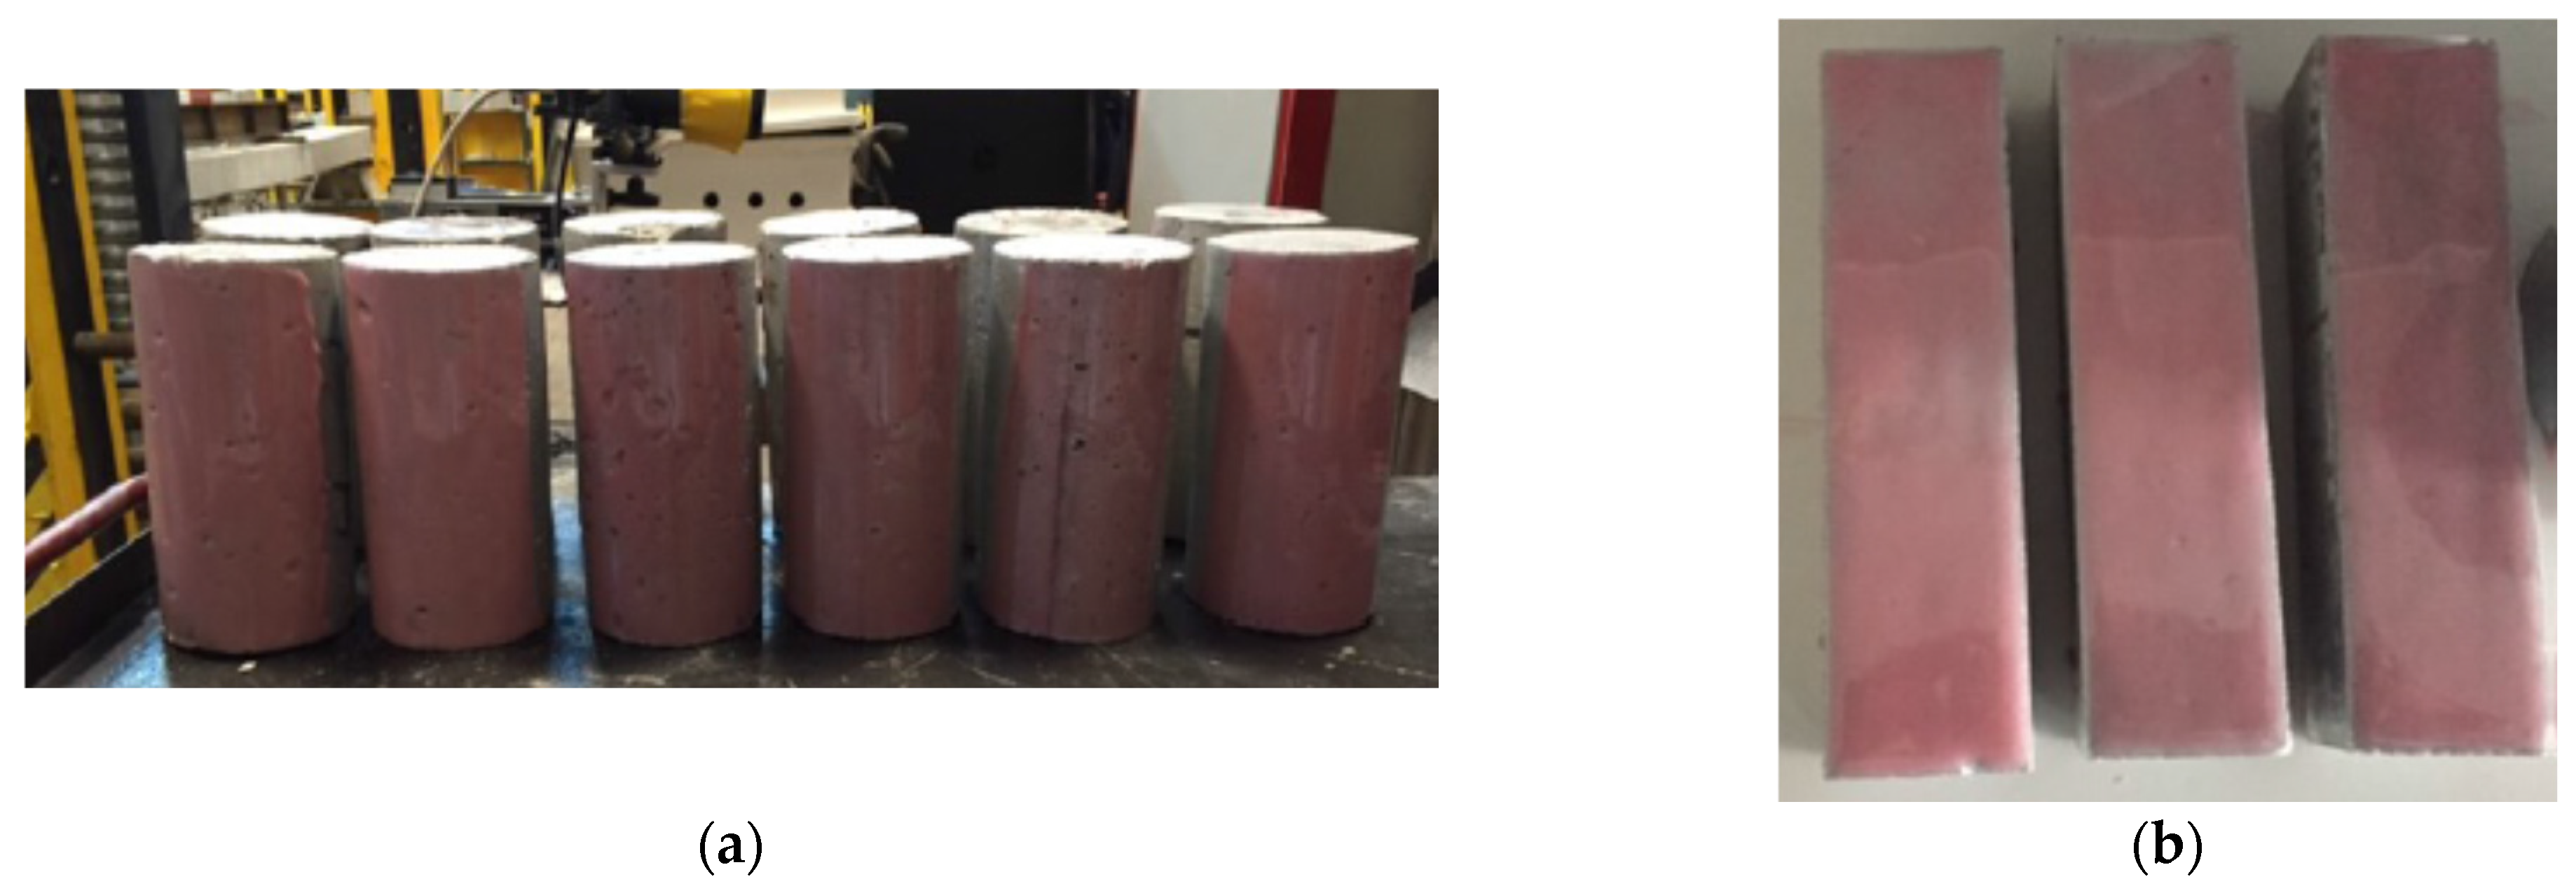
2.2. Strength Assessments

Table 2 provides the details of the seven concrete mixes used in this study. More details on the preparation and the evaluation of the physical, chemical, and functional material properties of the different concrete mixes used here can be found elsewhere [36]. Here we focus on the application of PSA as presented above. Two types of samples were considered here: cylinders (200 mm length and 100 mm diameter) subjected to compression (ASTM C39), and notched beams (160 mm × 40 mm × 40 mm having a 1 mm notch size at the middle, Figure 4) subjected to three-point bending to evaluate flexural strength and fracture toughness (ASTM C78). The 7-, 28-, and 90-day cured samples were tested for assessing different mechanical properties, though the stress sensing and fracture toughness evaluations were limited to 28-day and 90-day samples.

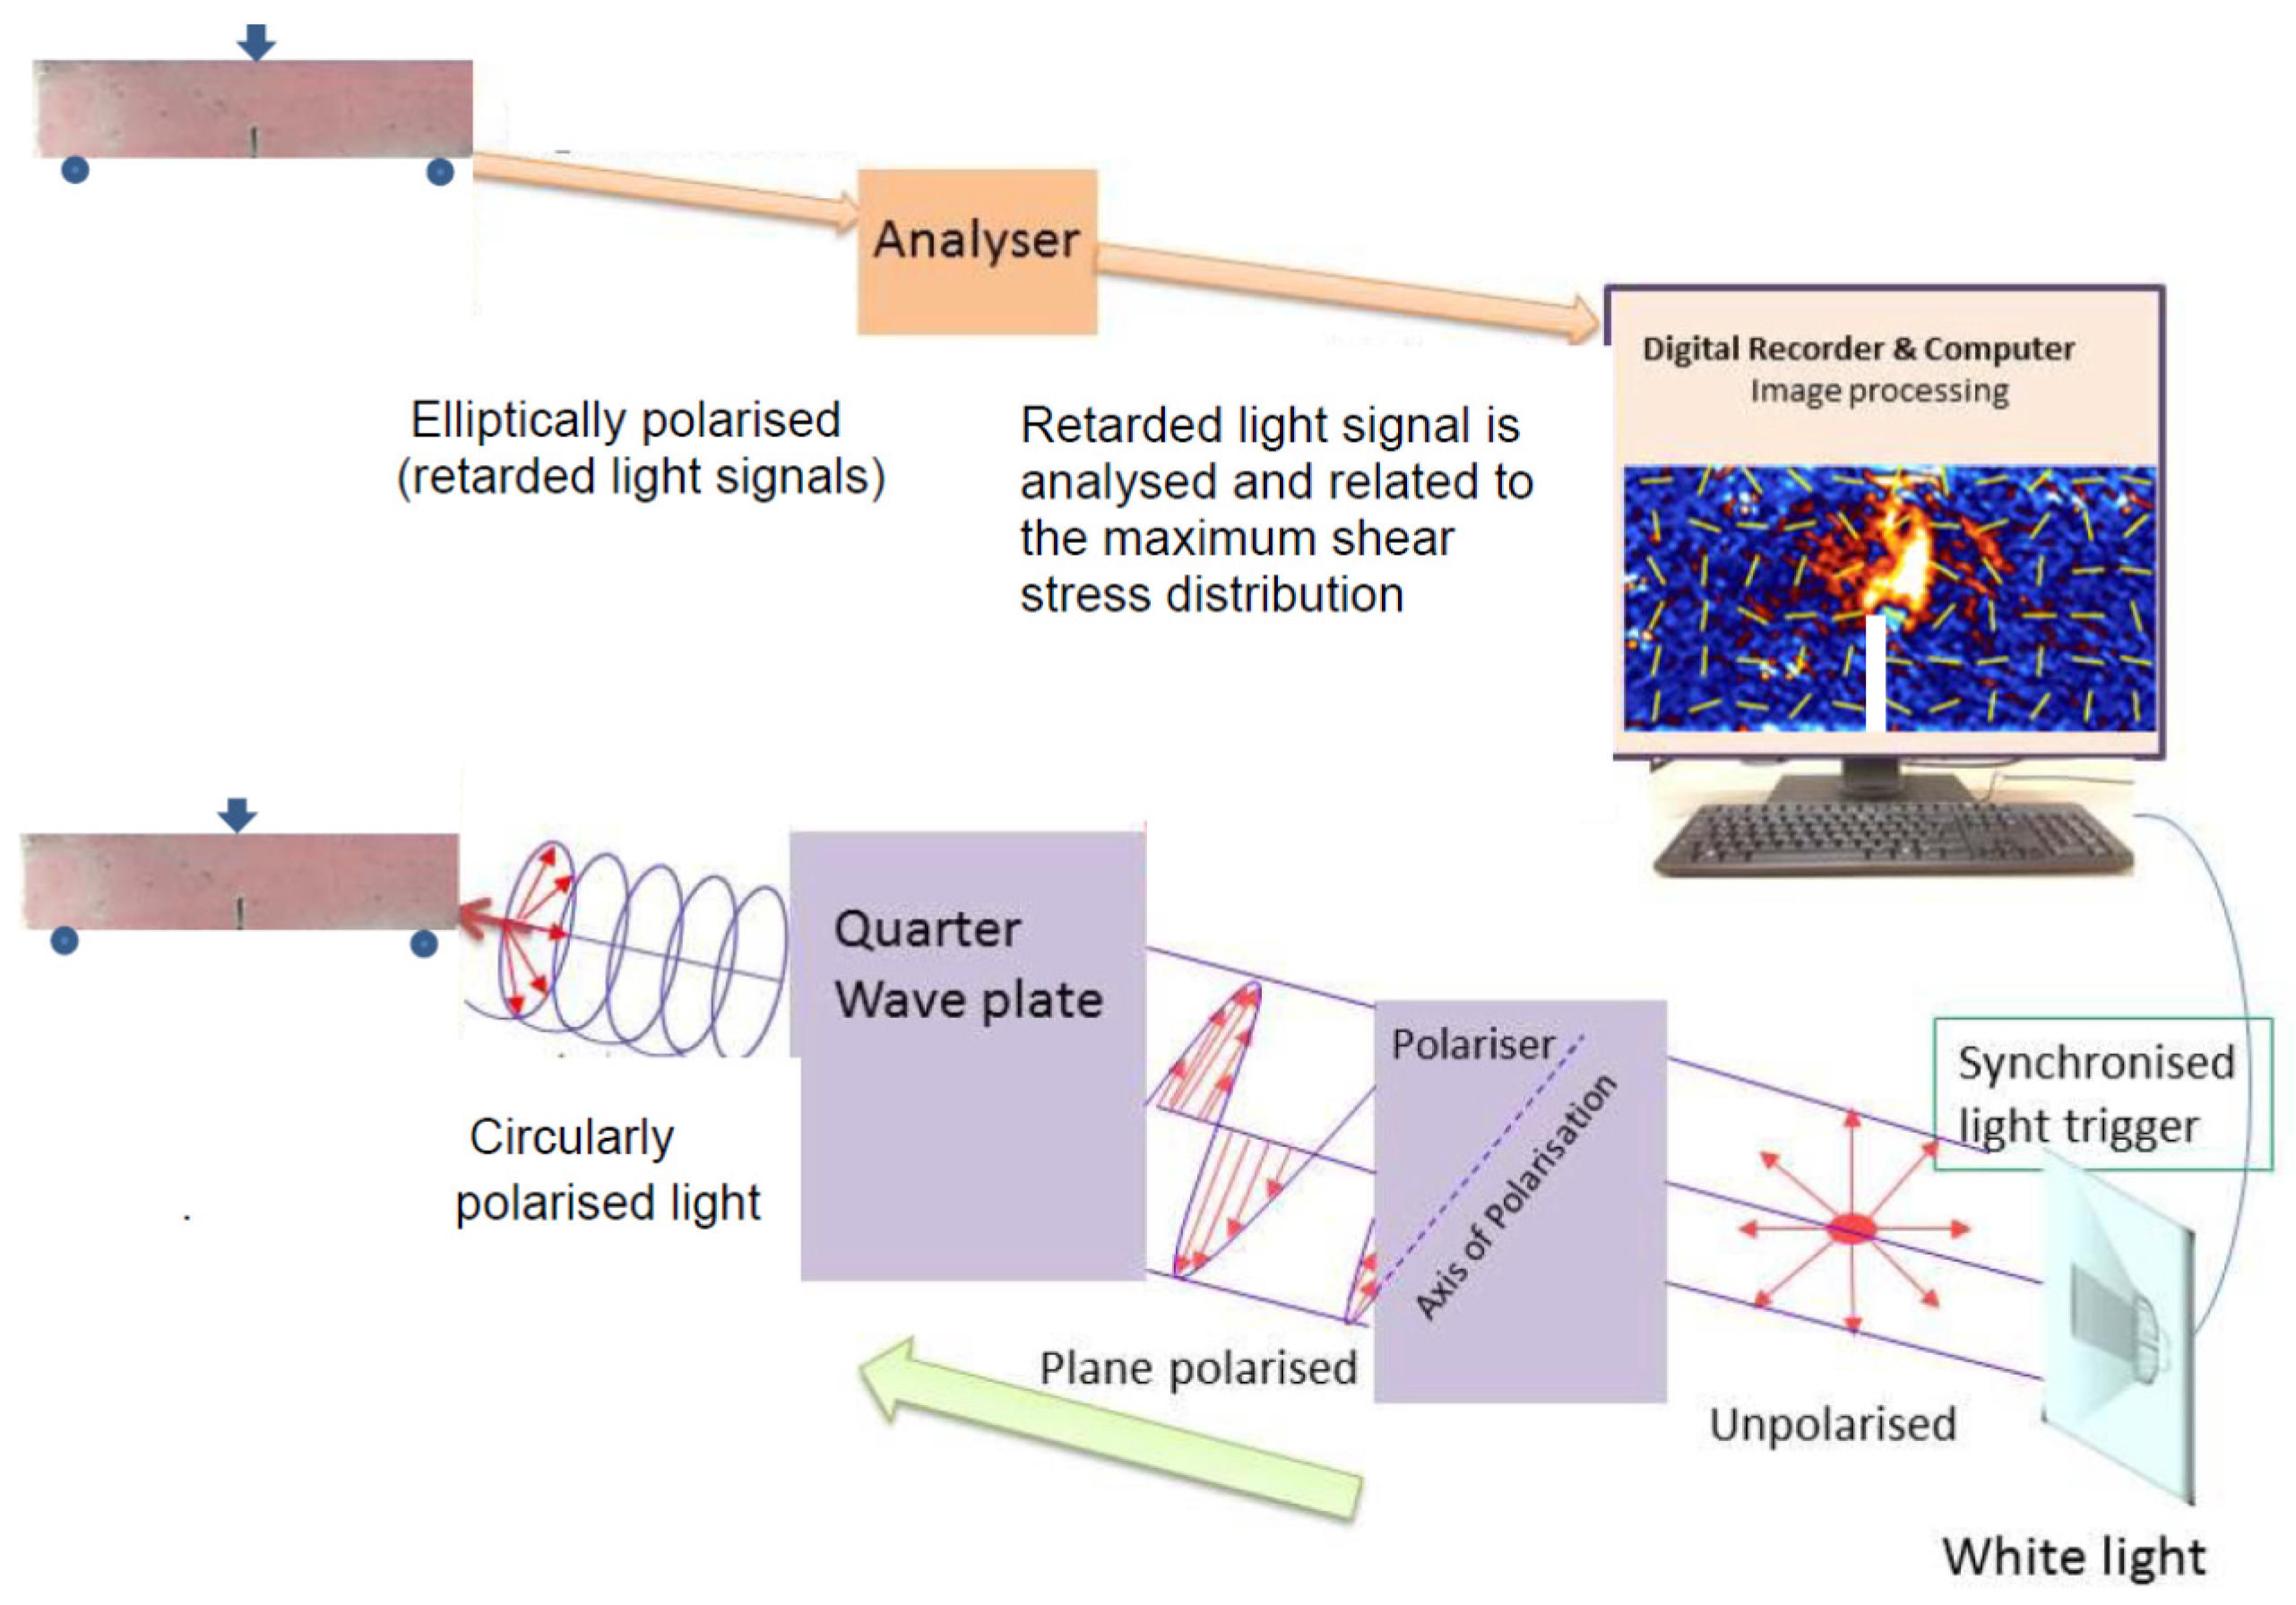
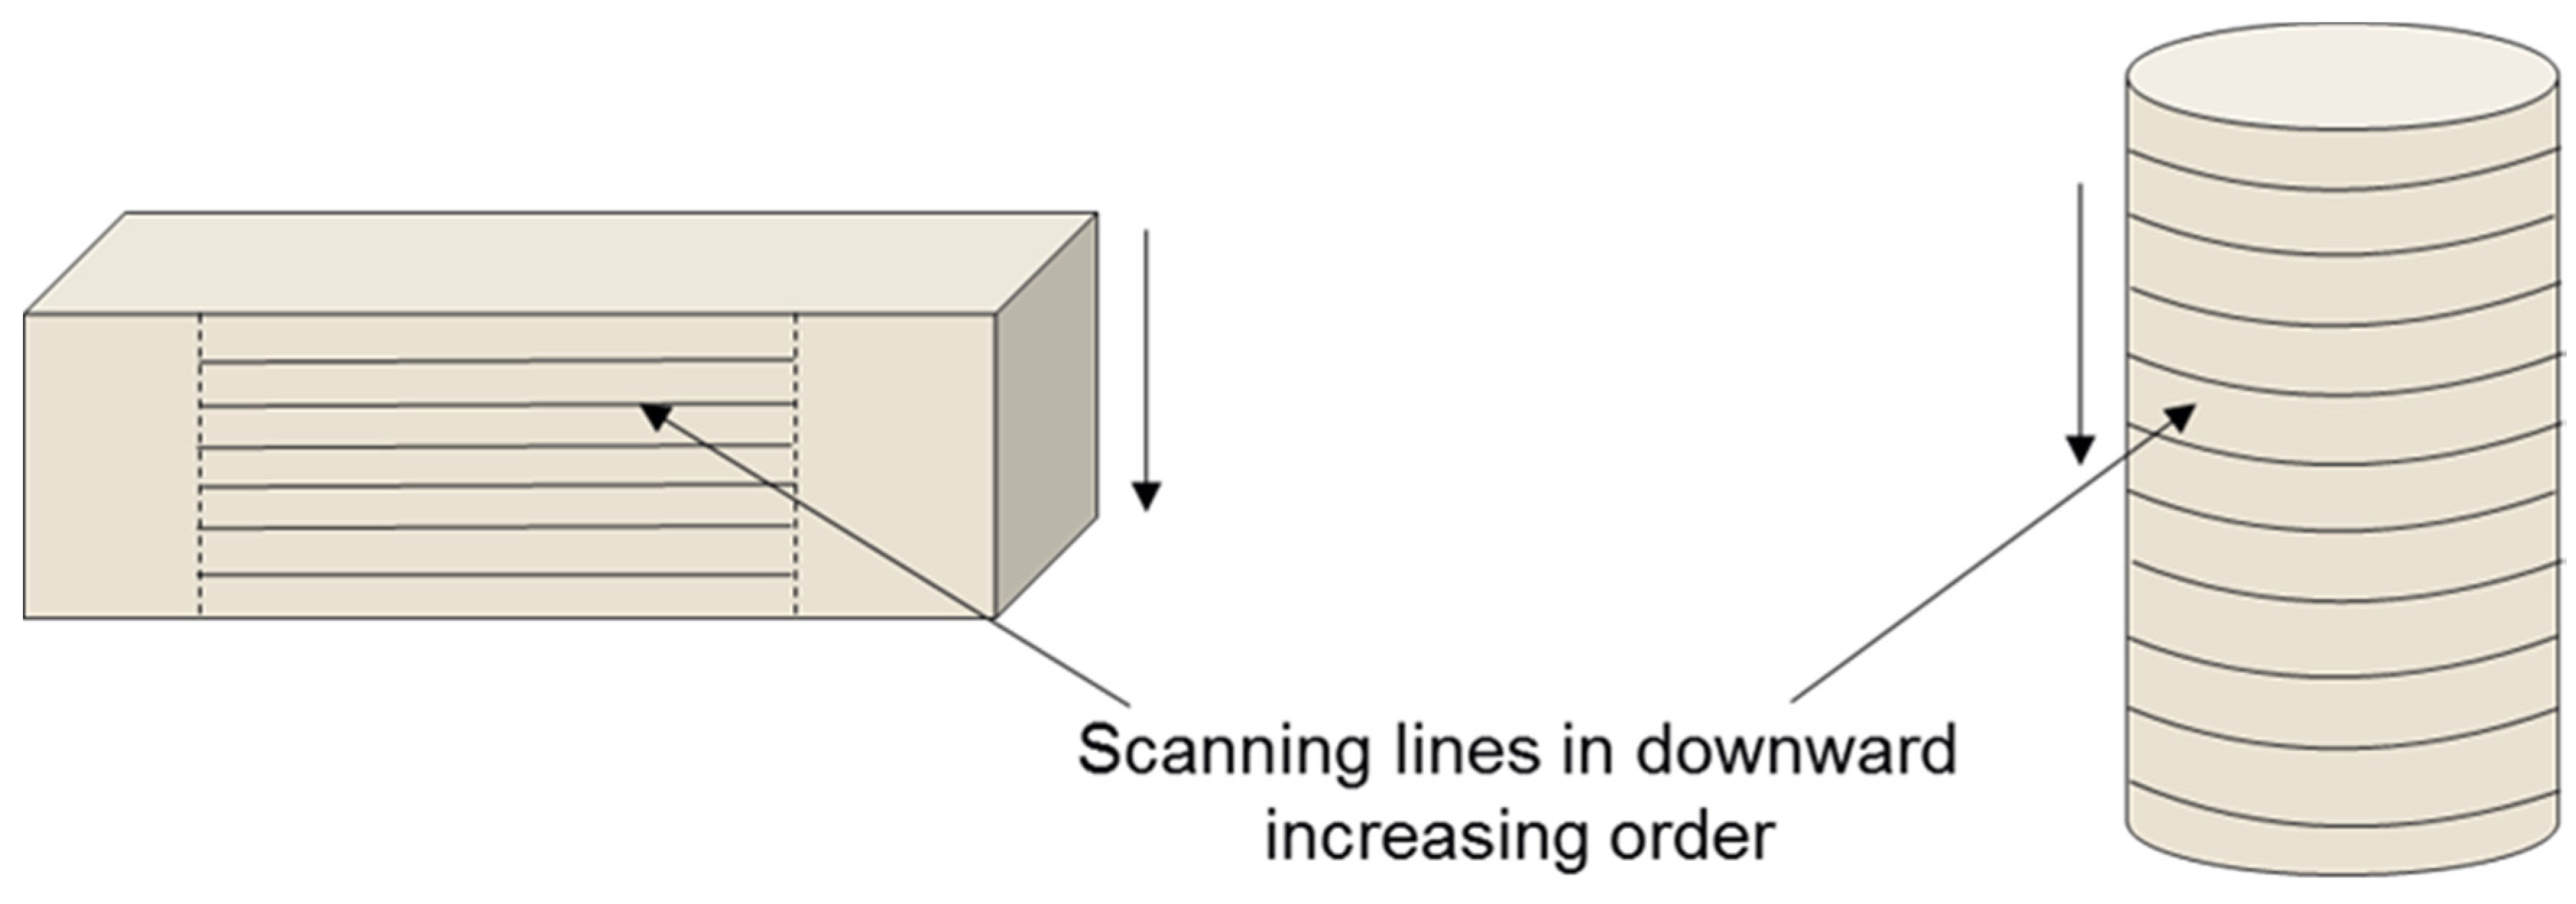
2.3. PSA Measurements

The experimental methodology to sense the maximum shear stress distribution whole-field on the samples under the mechanical loading was based on reflective type PSA (Figure 5) and an expanded detail of this can be found elsewhere [37]. The setup for the PSA-based experiments (Figure 5) under loading (Figure 6) involved initially making a polished surface of the concrete specimens. A uniform birefringent coating [38] was applied on the surface of the different concrete specimens and allowed 24 h for the coating to bond well with the specimen (strain optic coefficient [39] of the film was 0.06 m/m/(m/m)) (Figure 7). We also verified that the coatings were free from any shrinkage stresses in the photonic stress measurements (as described below) so that no birefringence was noticed in any of the unloaded specimens. Then the standard ASTM C39 compression [40] and ASTM C78 three-point bend tests [41] were conducted on the specimens using a 500 kN Instron compression machine under a slow loading rate of 0.25 MPa/s and 41 N/s for compression and flexural tests, respectively (Figure 6). The method of measuring birefringence on the surface of the concrete is similar to measuring it on the surface of the human cornea [42] except that, as concrete is not naturally birefringent (unlike the human eye [42]), the birefringent coating applied on the surface of the concrete provided the similar functionality (birefringence under loading). The wavelength of light from the initial light source was 650 nm. Expanded details on the working of PSA can be found elsewhere [37,39,43]. In brief, a circularly polarised light sweeps on the birefringent-coated surface of the loaded specimens (Figure 5 and Figure 7). Under the mechanical loading, the outcoming retarded light from the sample is elliptically polarised [43]. This is characterised further by using an analyser for different optical orientations of the analyser [43]. At the point of interest in the sample, the retardation was related to the principal strain difference or the principal stress difference using the well-known strain (or stress)-optic law [39,42,43]. The difference between the principal strain components and principal stress components are referred to as deviator strain and deviator stress, respectively [39,44,45]. The maximum shear stress (τmax) is equal to half the deviator stress [39,45]. The shear stress concentration factor Scf was evaluated under the ultimate load as [42];
Scf = τmaxavg
where τavg is the average value of the maximum shear stress calculated from the middle one-third region of the measurement side of the beam in the case of the prism (to not get affected by the beam supports) and the full length, in the case of the cylindrical samples (Figure 8).

3. Results and Discussion

The results focus on the mechanical and fracture properties of the composite beams investigated here, including the evolution of the distribution of maximum shear stress and principal stress directions. In the following, the compressive strength of the samples is presented in Figure 9.
The results on the evolution of the maximum stress distribution for the unnotched prisms and cylinders and corresponding variation of the shear stress concentration factor across different sections in the samples are shown in Figure 10, Figure 11, Figure 12, Figure 13, Figure 14, Figure 15 and Figure 16. Similar results are also presented for the notched prism (Figure 17 and Figure 18). Finally, the evaluation of the fracture toughness of the samples using the PSA-Technology-based methods (denoted by the term PSAT in the plots) and their comparison with a conventional approach are provided in Figure 19.

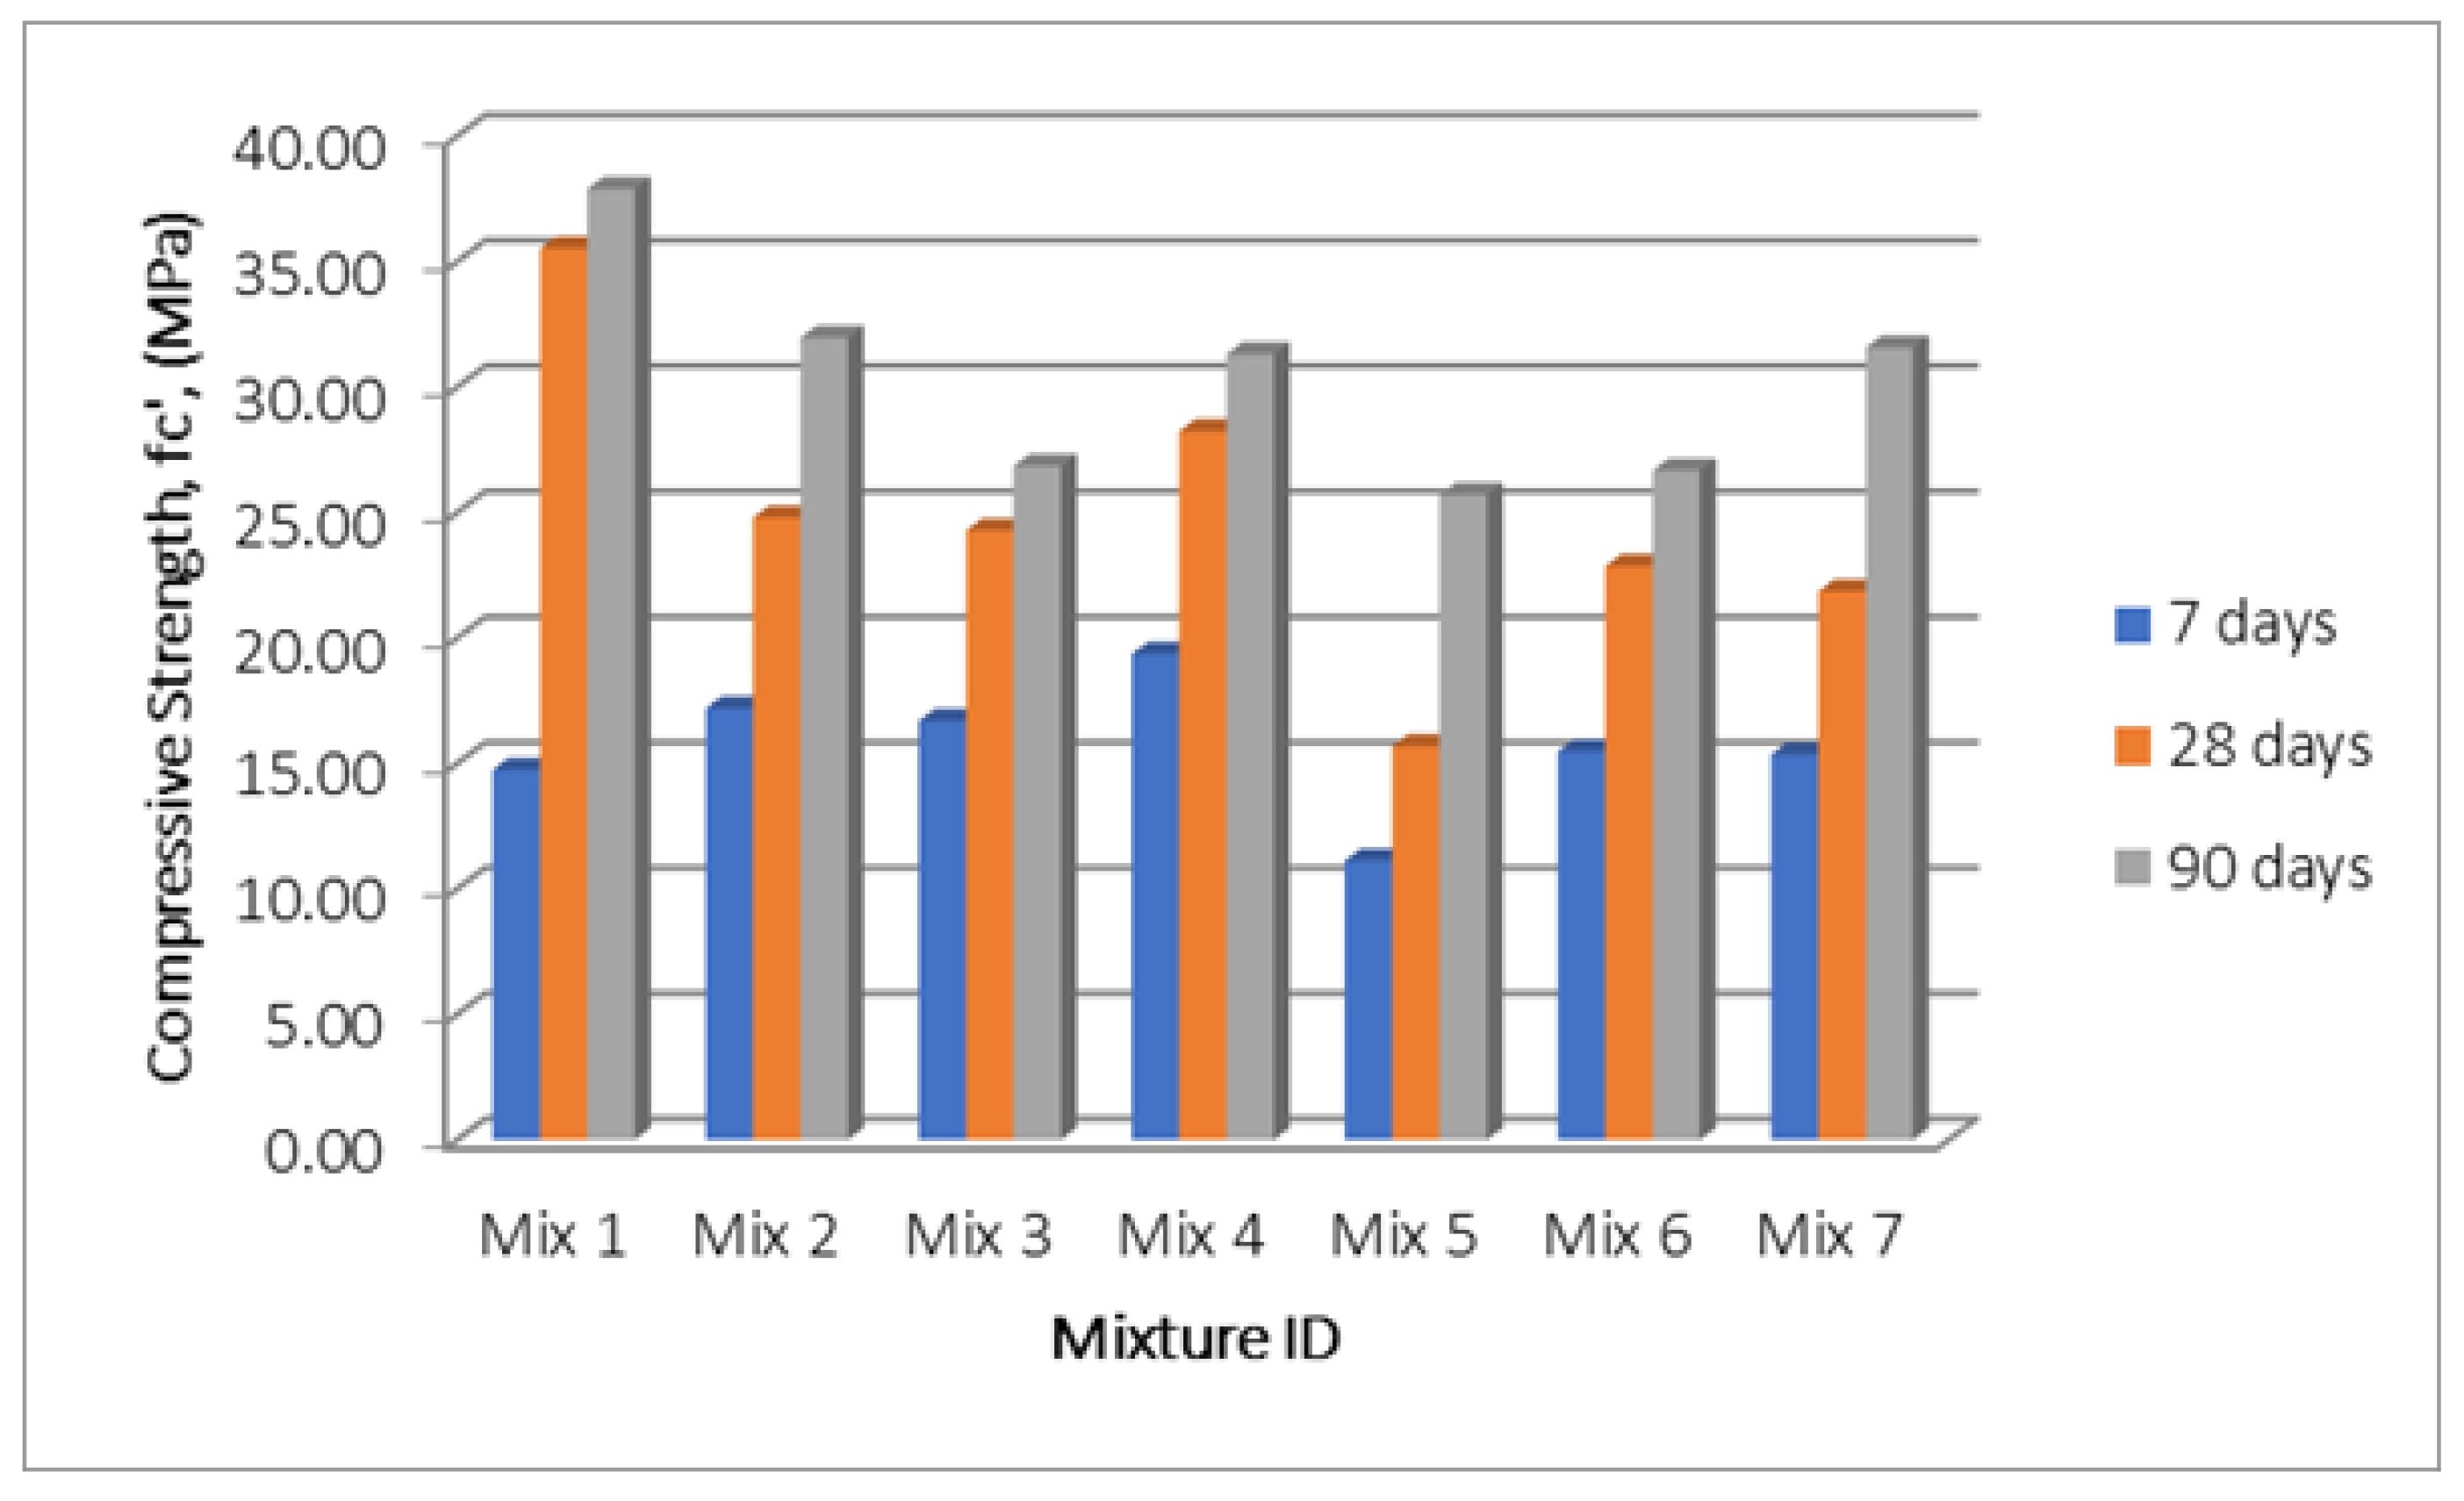
3.1. Strength Characteristics

The compressive strength test results of the composite concrete mixtures are presented in Figure 9. The values represent the average values of at least three samples. As seen from the compressive strength test results, (i) the 28- and 90-day compressive strengths were significantly higher than that of the 7-day samples, including the cases of the granules-added samples; (ii) the granules-added samples showed a slight decrease in their compressive strength, and hence further studies are to be conducted to include suitable bonding materials to increase their compressive strength; (iii) although the 90-day strength was higher than the 28-day strength in the samples, the increase was significantly higher in the case of samples with HDPE granules (Mixes 5 and 7). Some observations on the compressive strength characteristics were consistent with other studies on using plastic particles with cementitious materials [46,47]. However, other studies have shown that, even though the polymer-added concrete composites present some reduction in strength compared to the control sample, they possess significantly high resistance against sulphate attack, as found in the case of the current samples as well and reported elsewhere [36].
The results on the flexural strength and fracture toughness of the samples are incorporated and discussed later (Figure 19) for convenience.

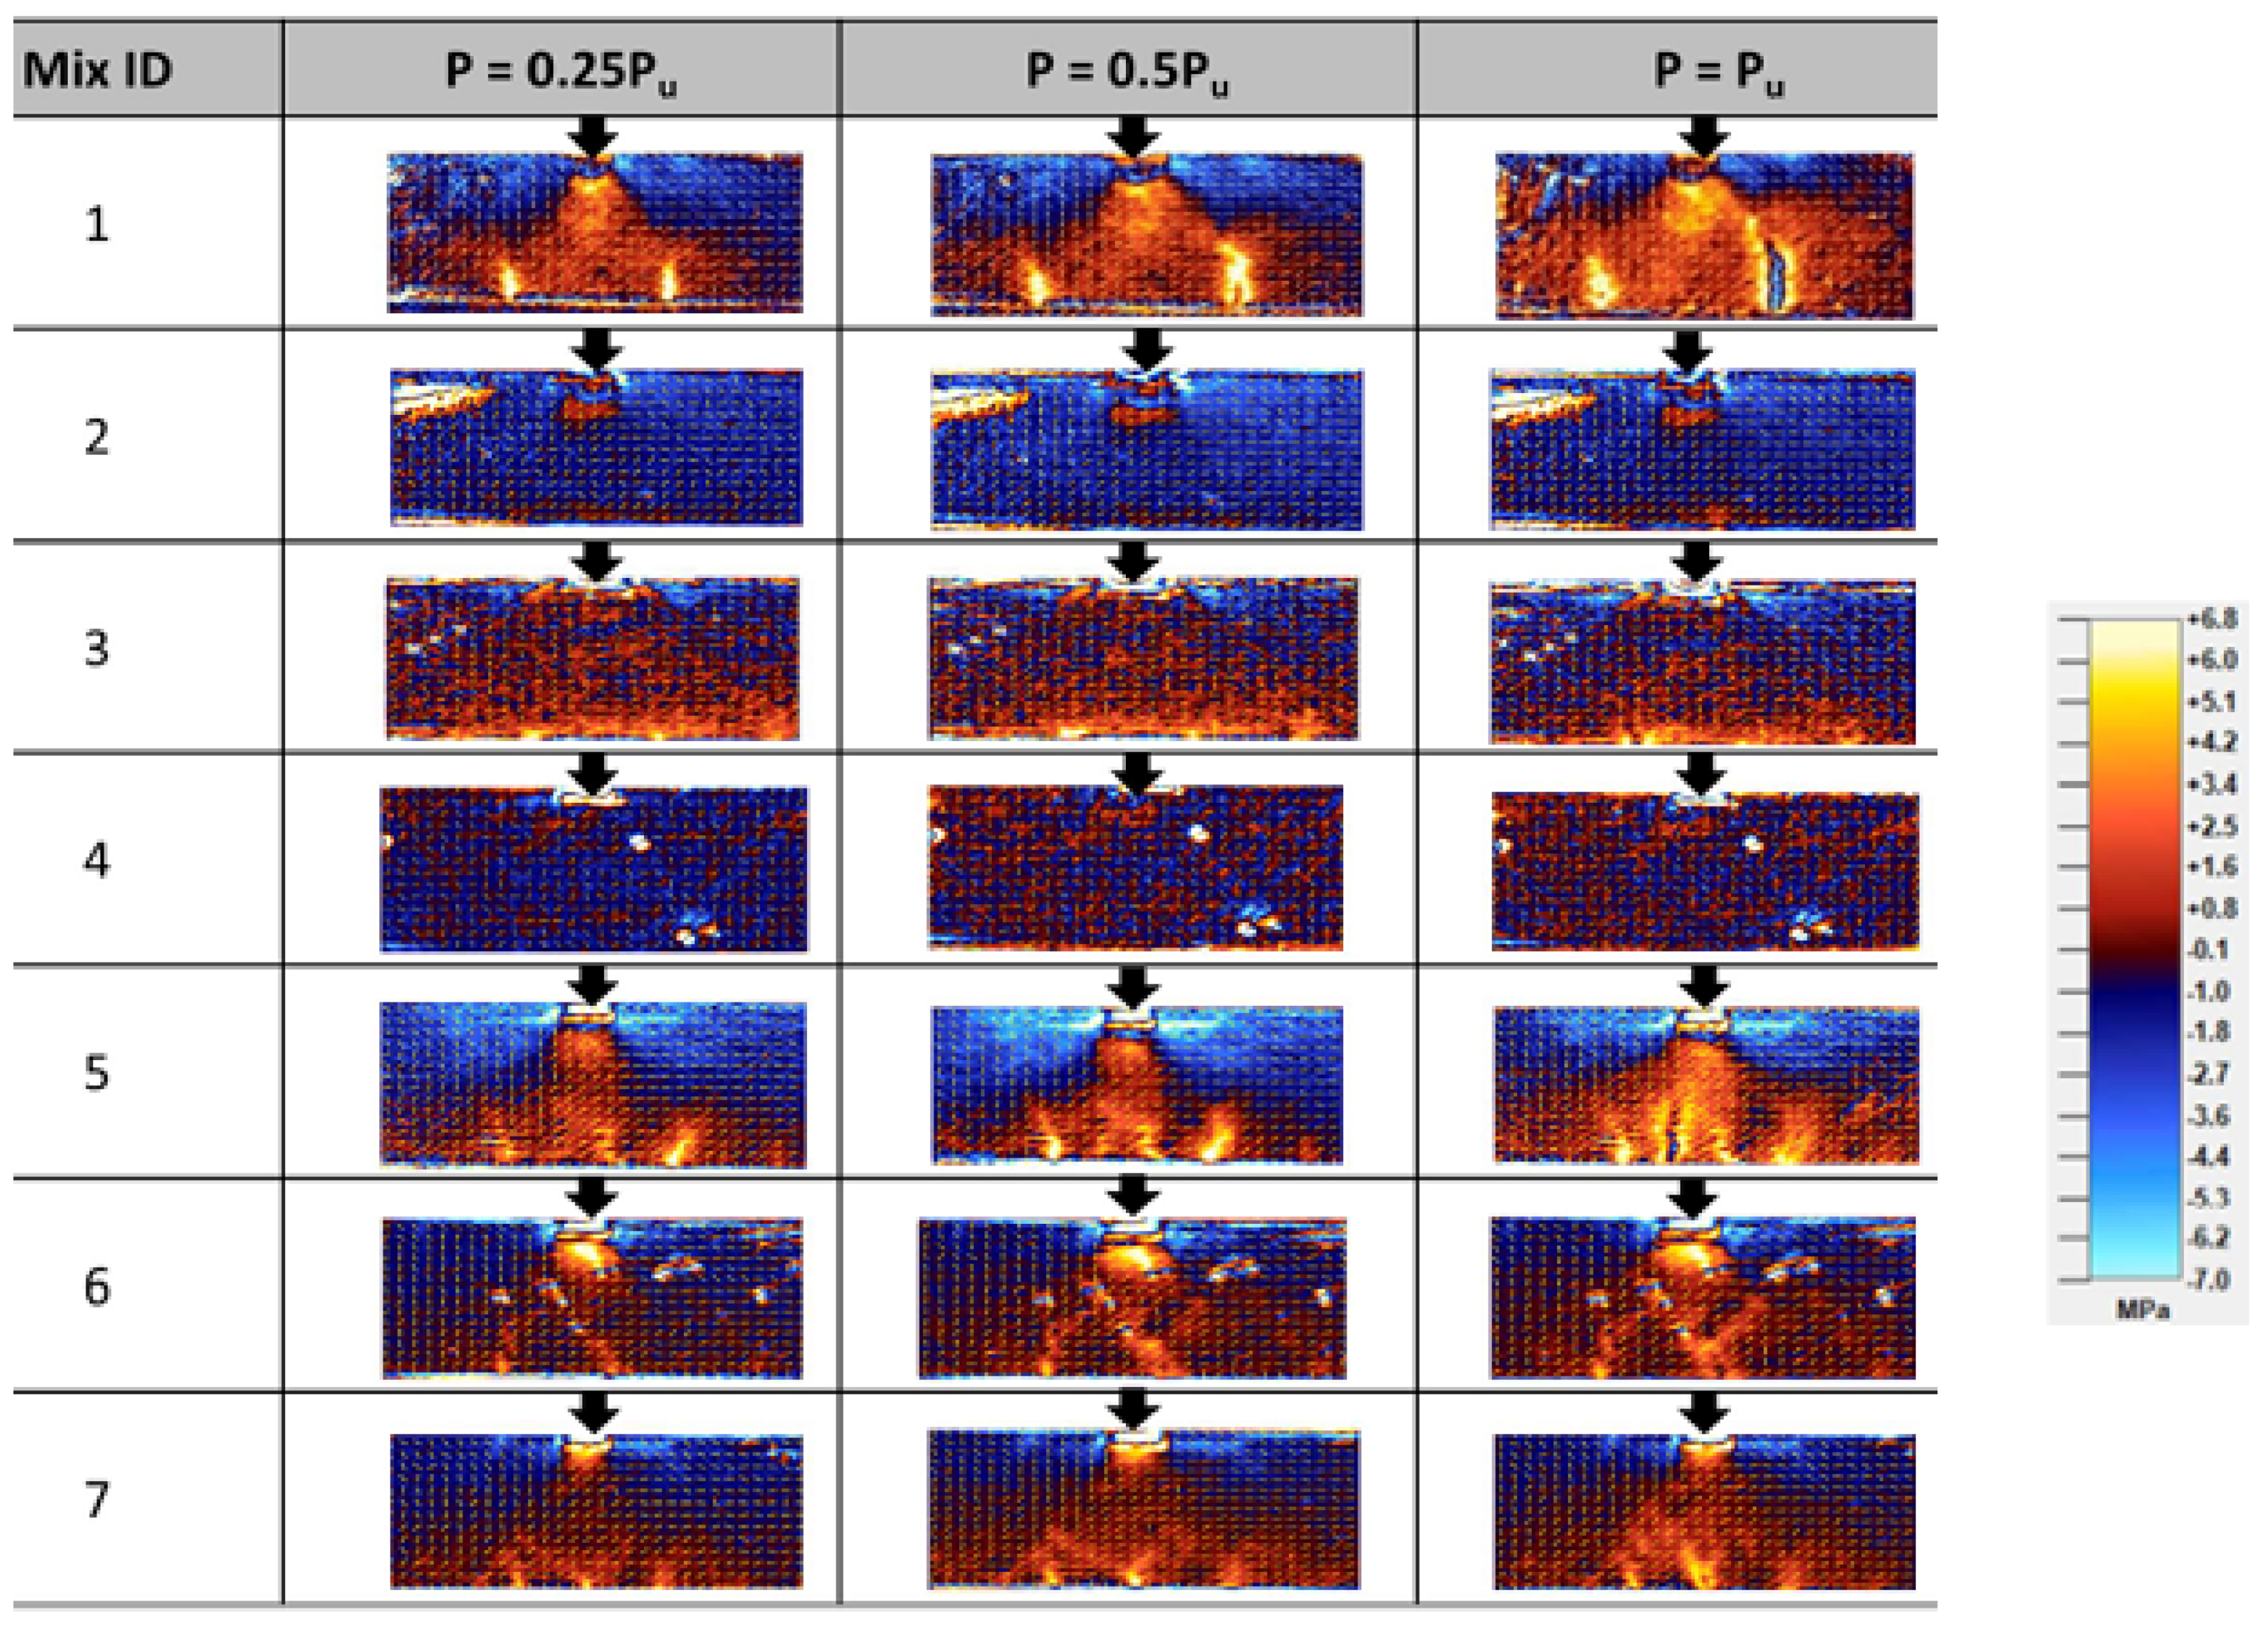
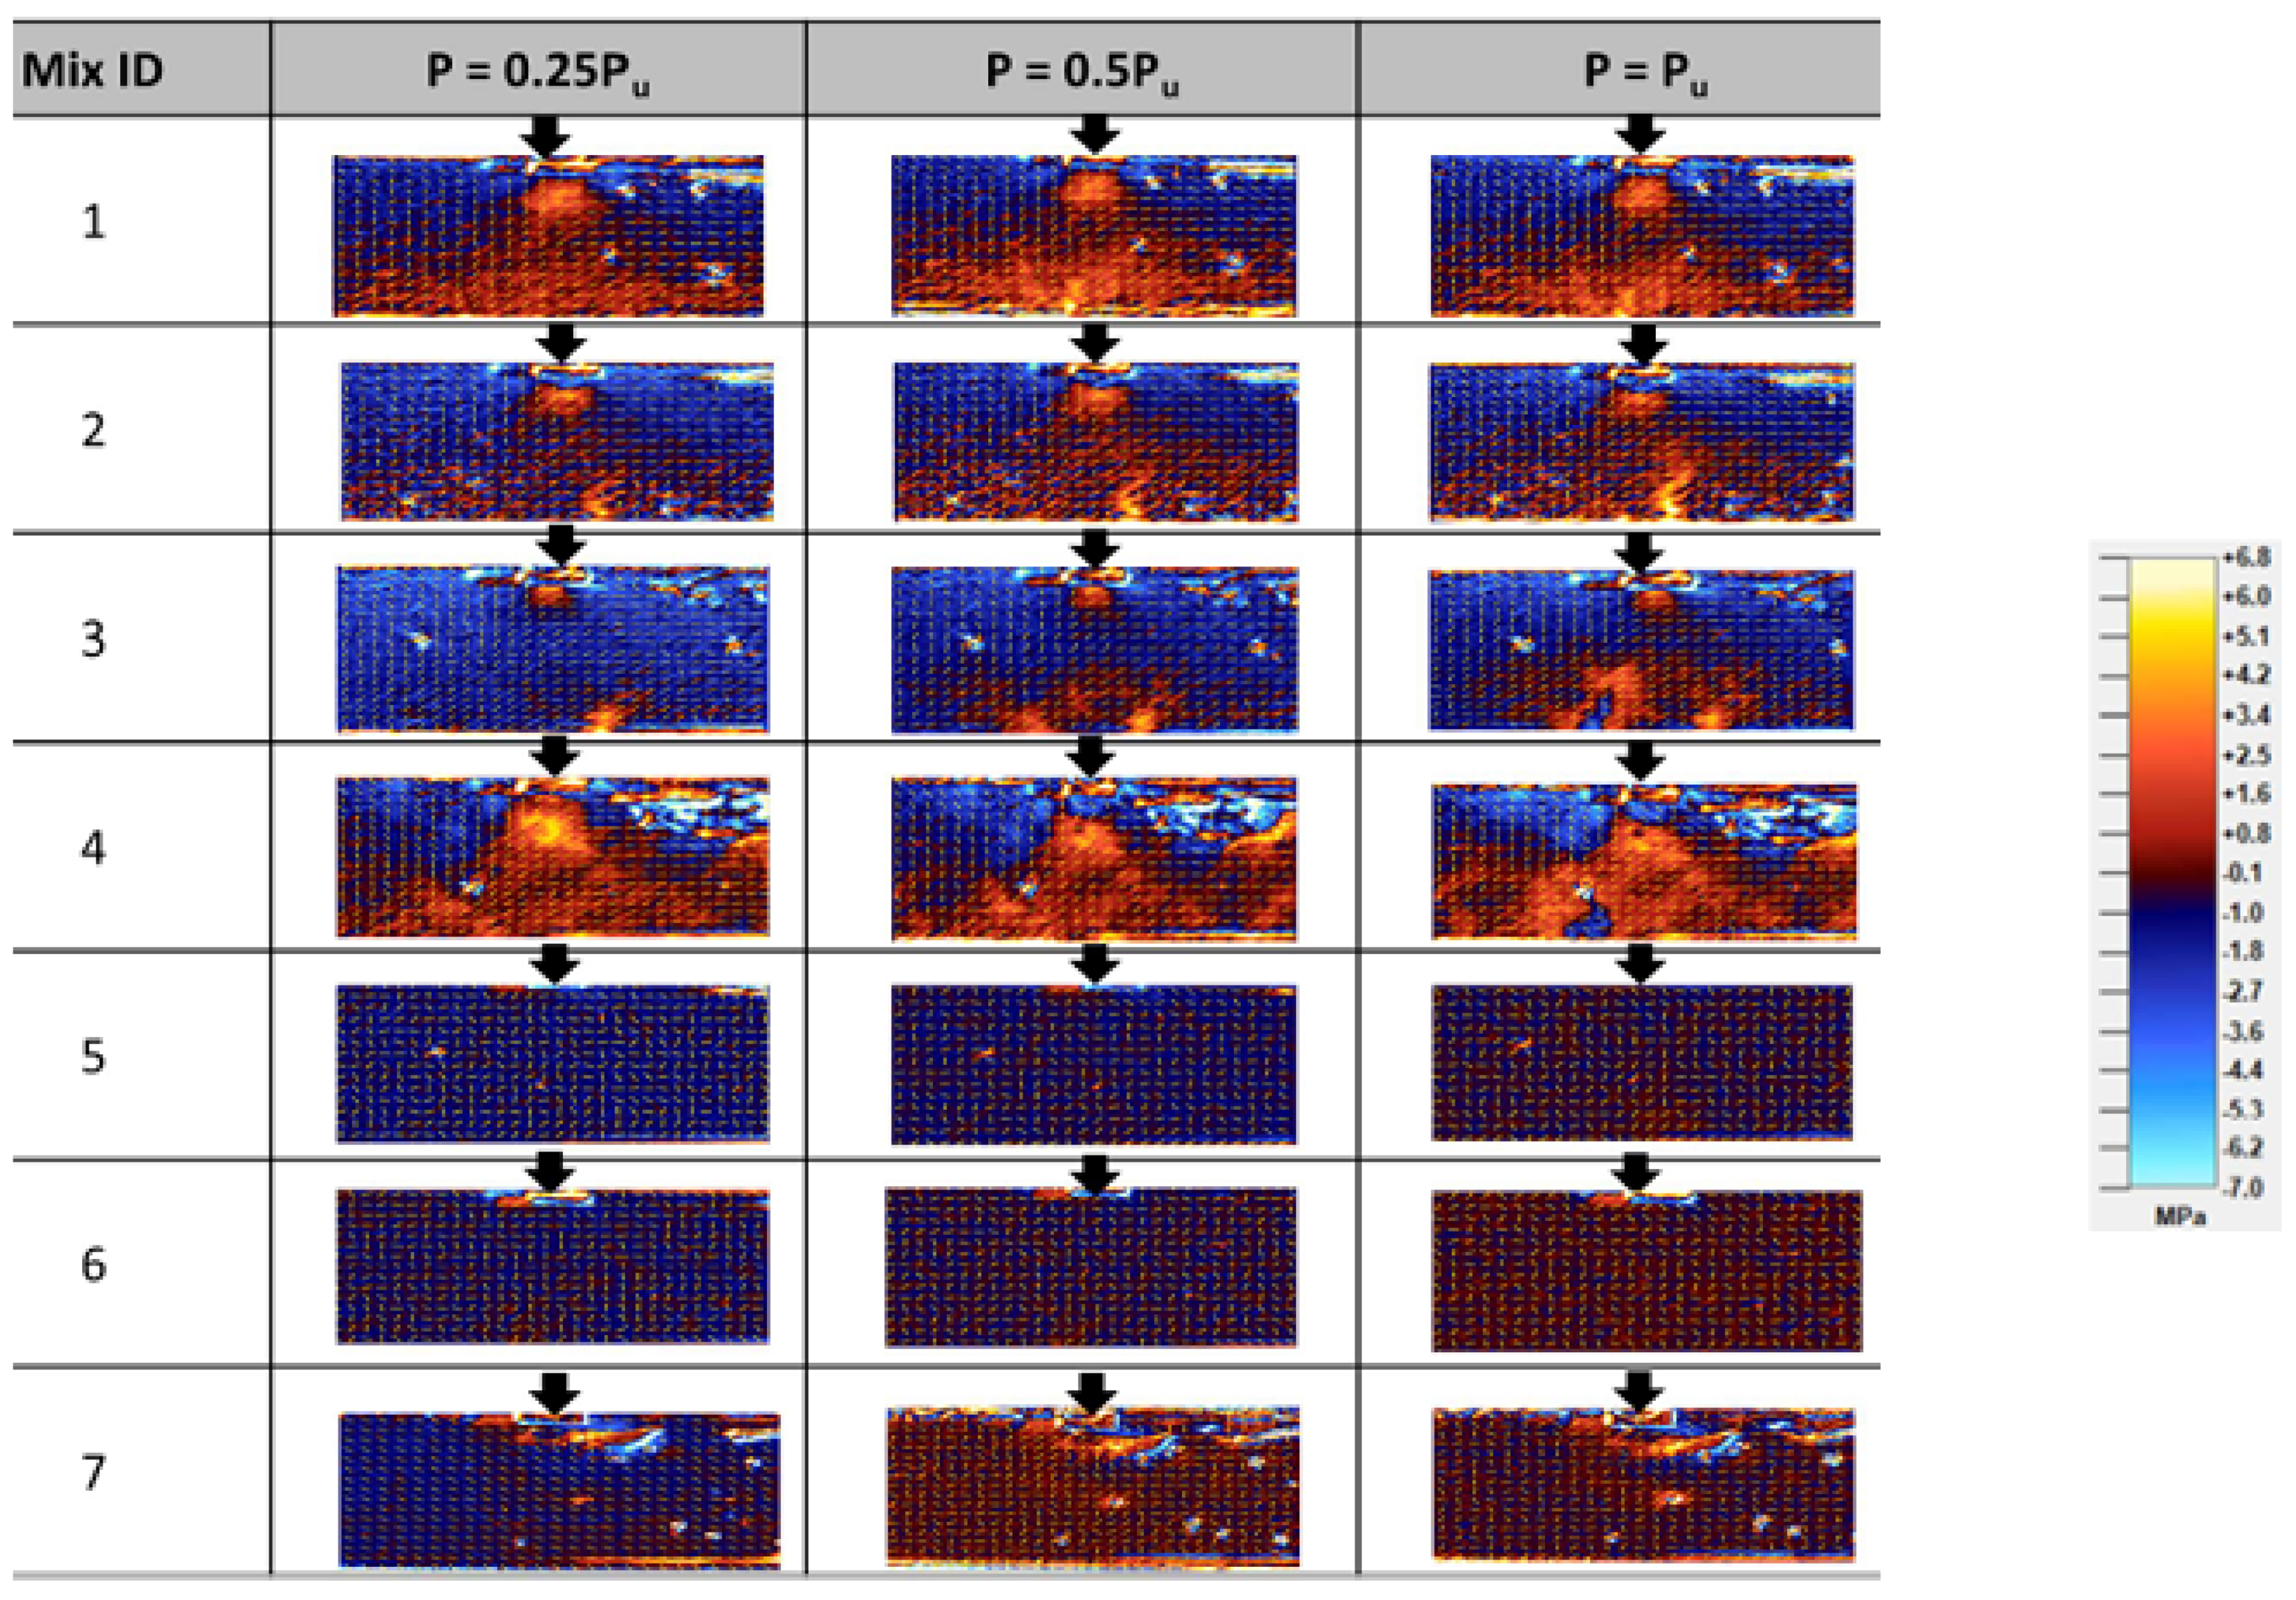
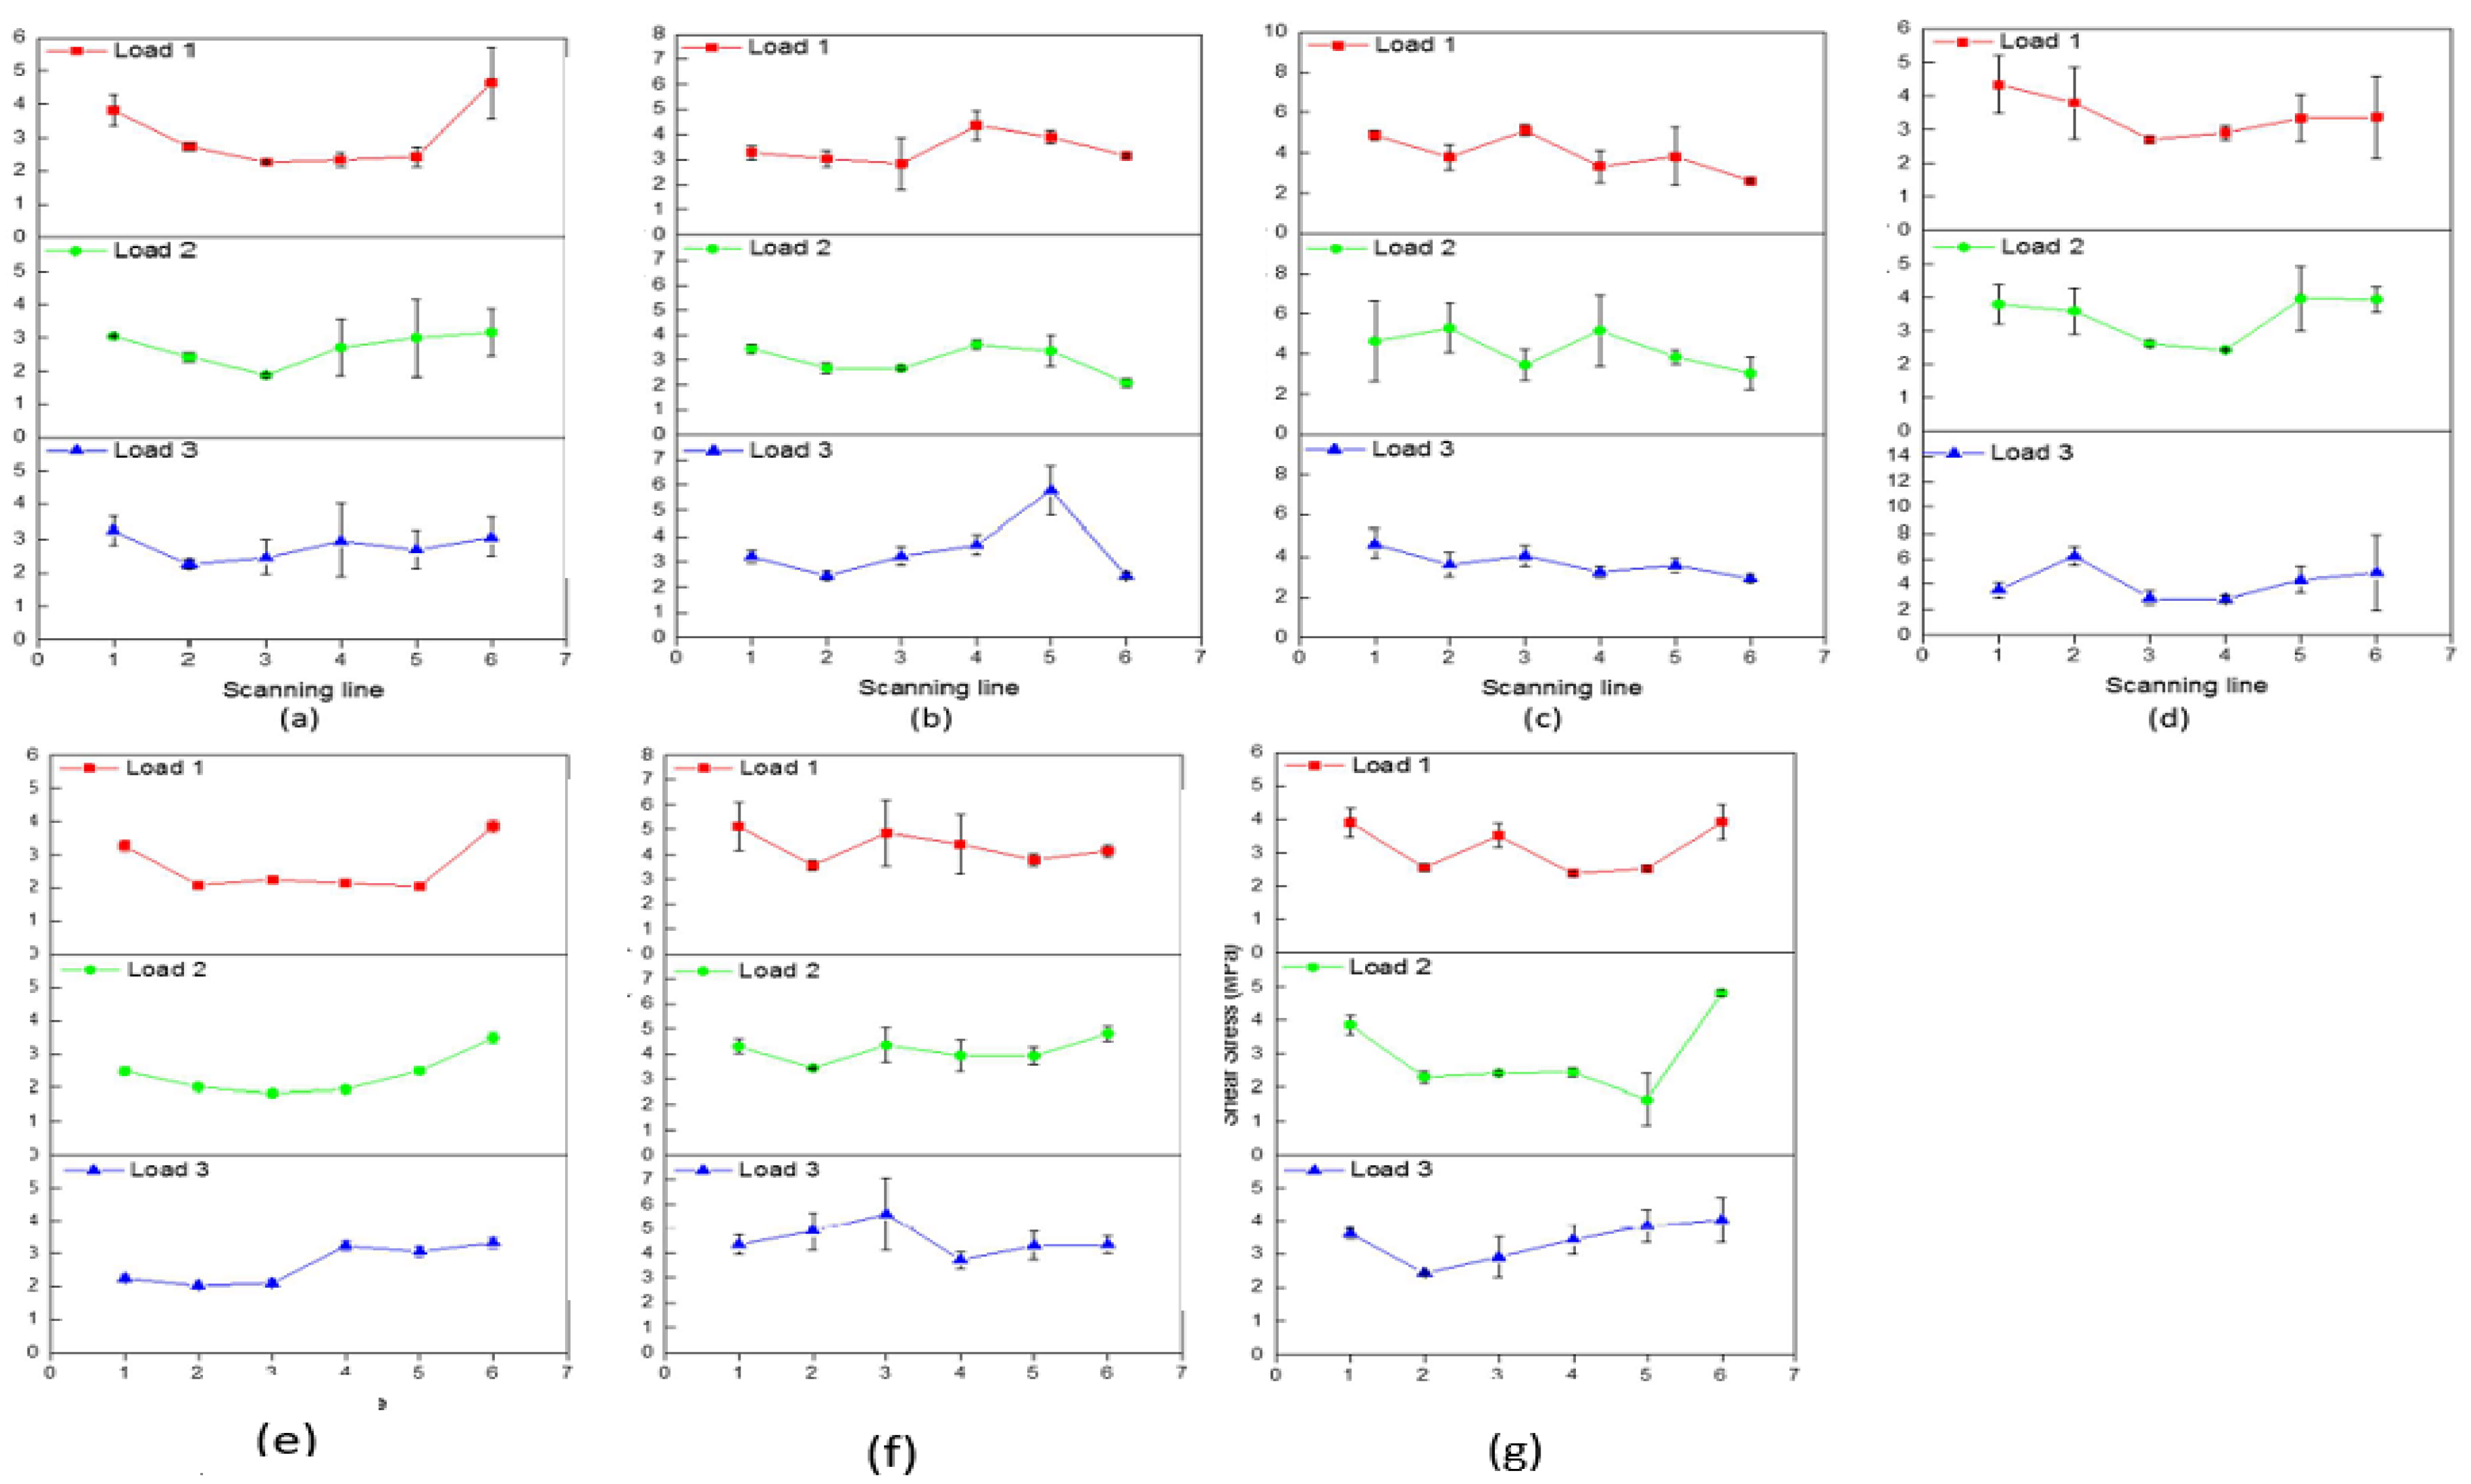
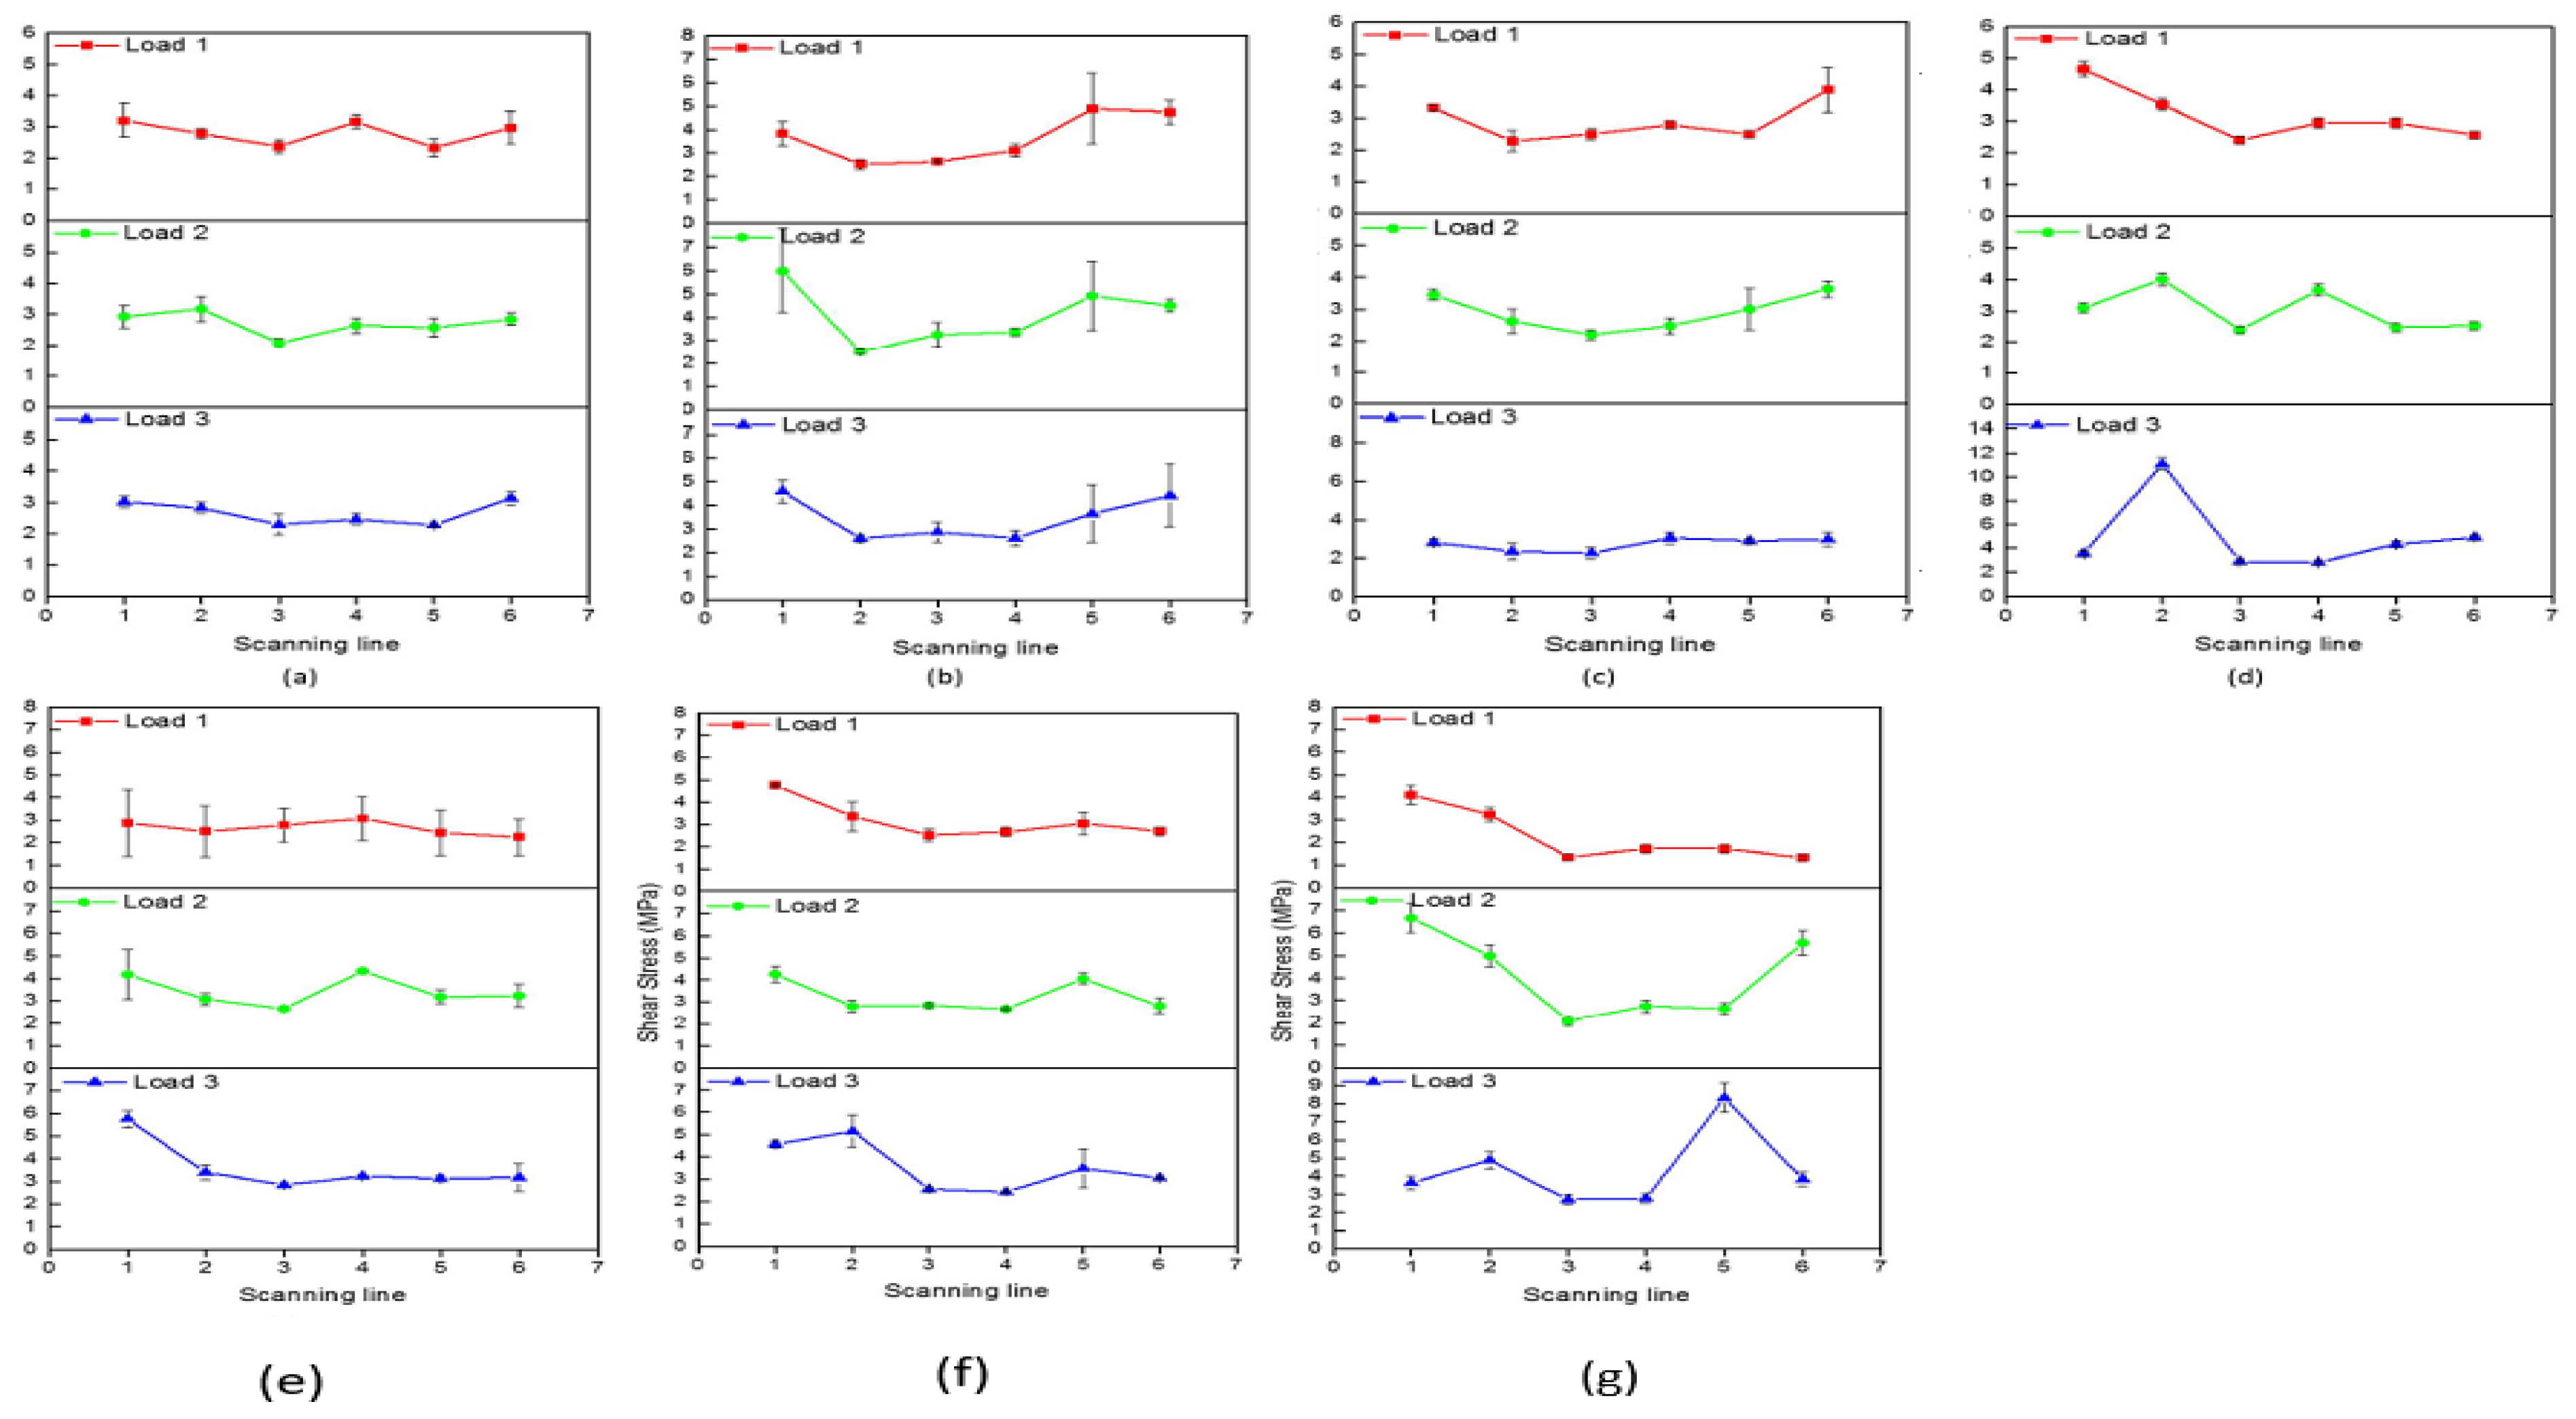
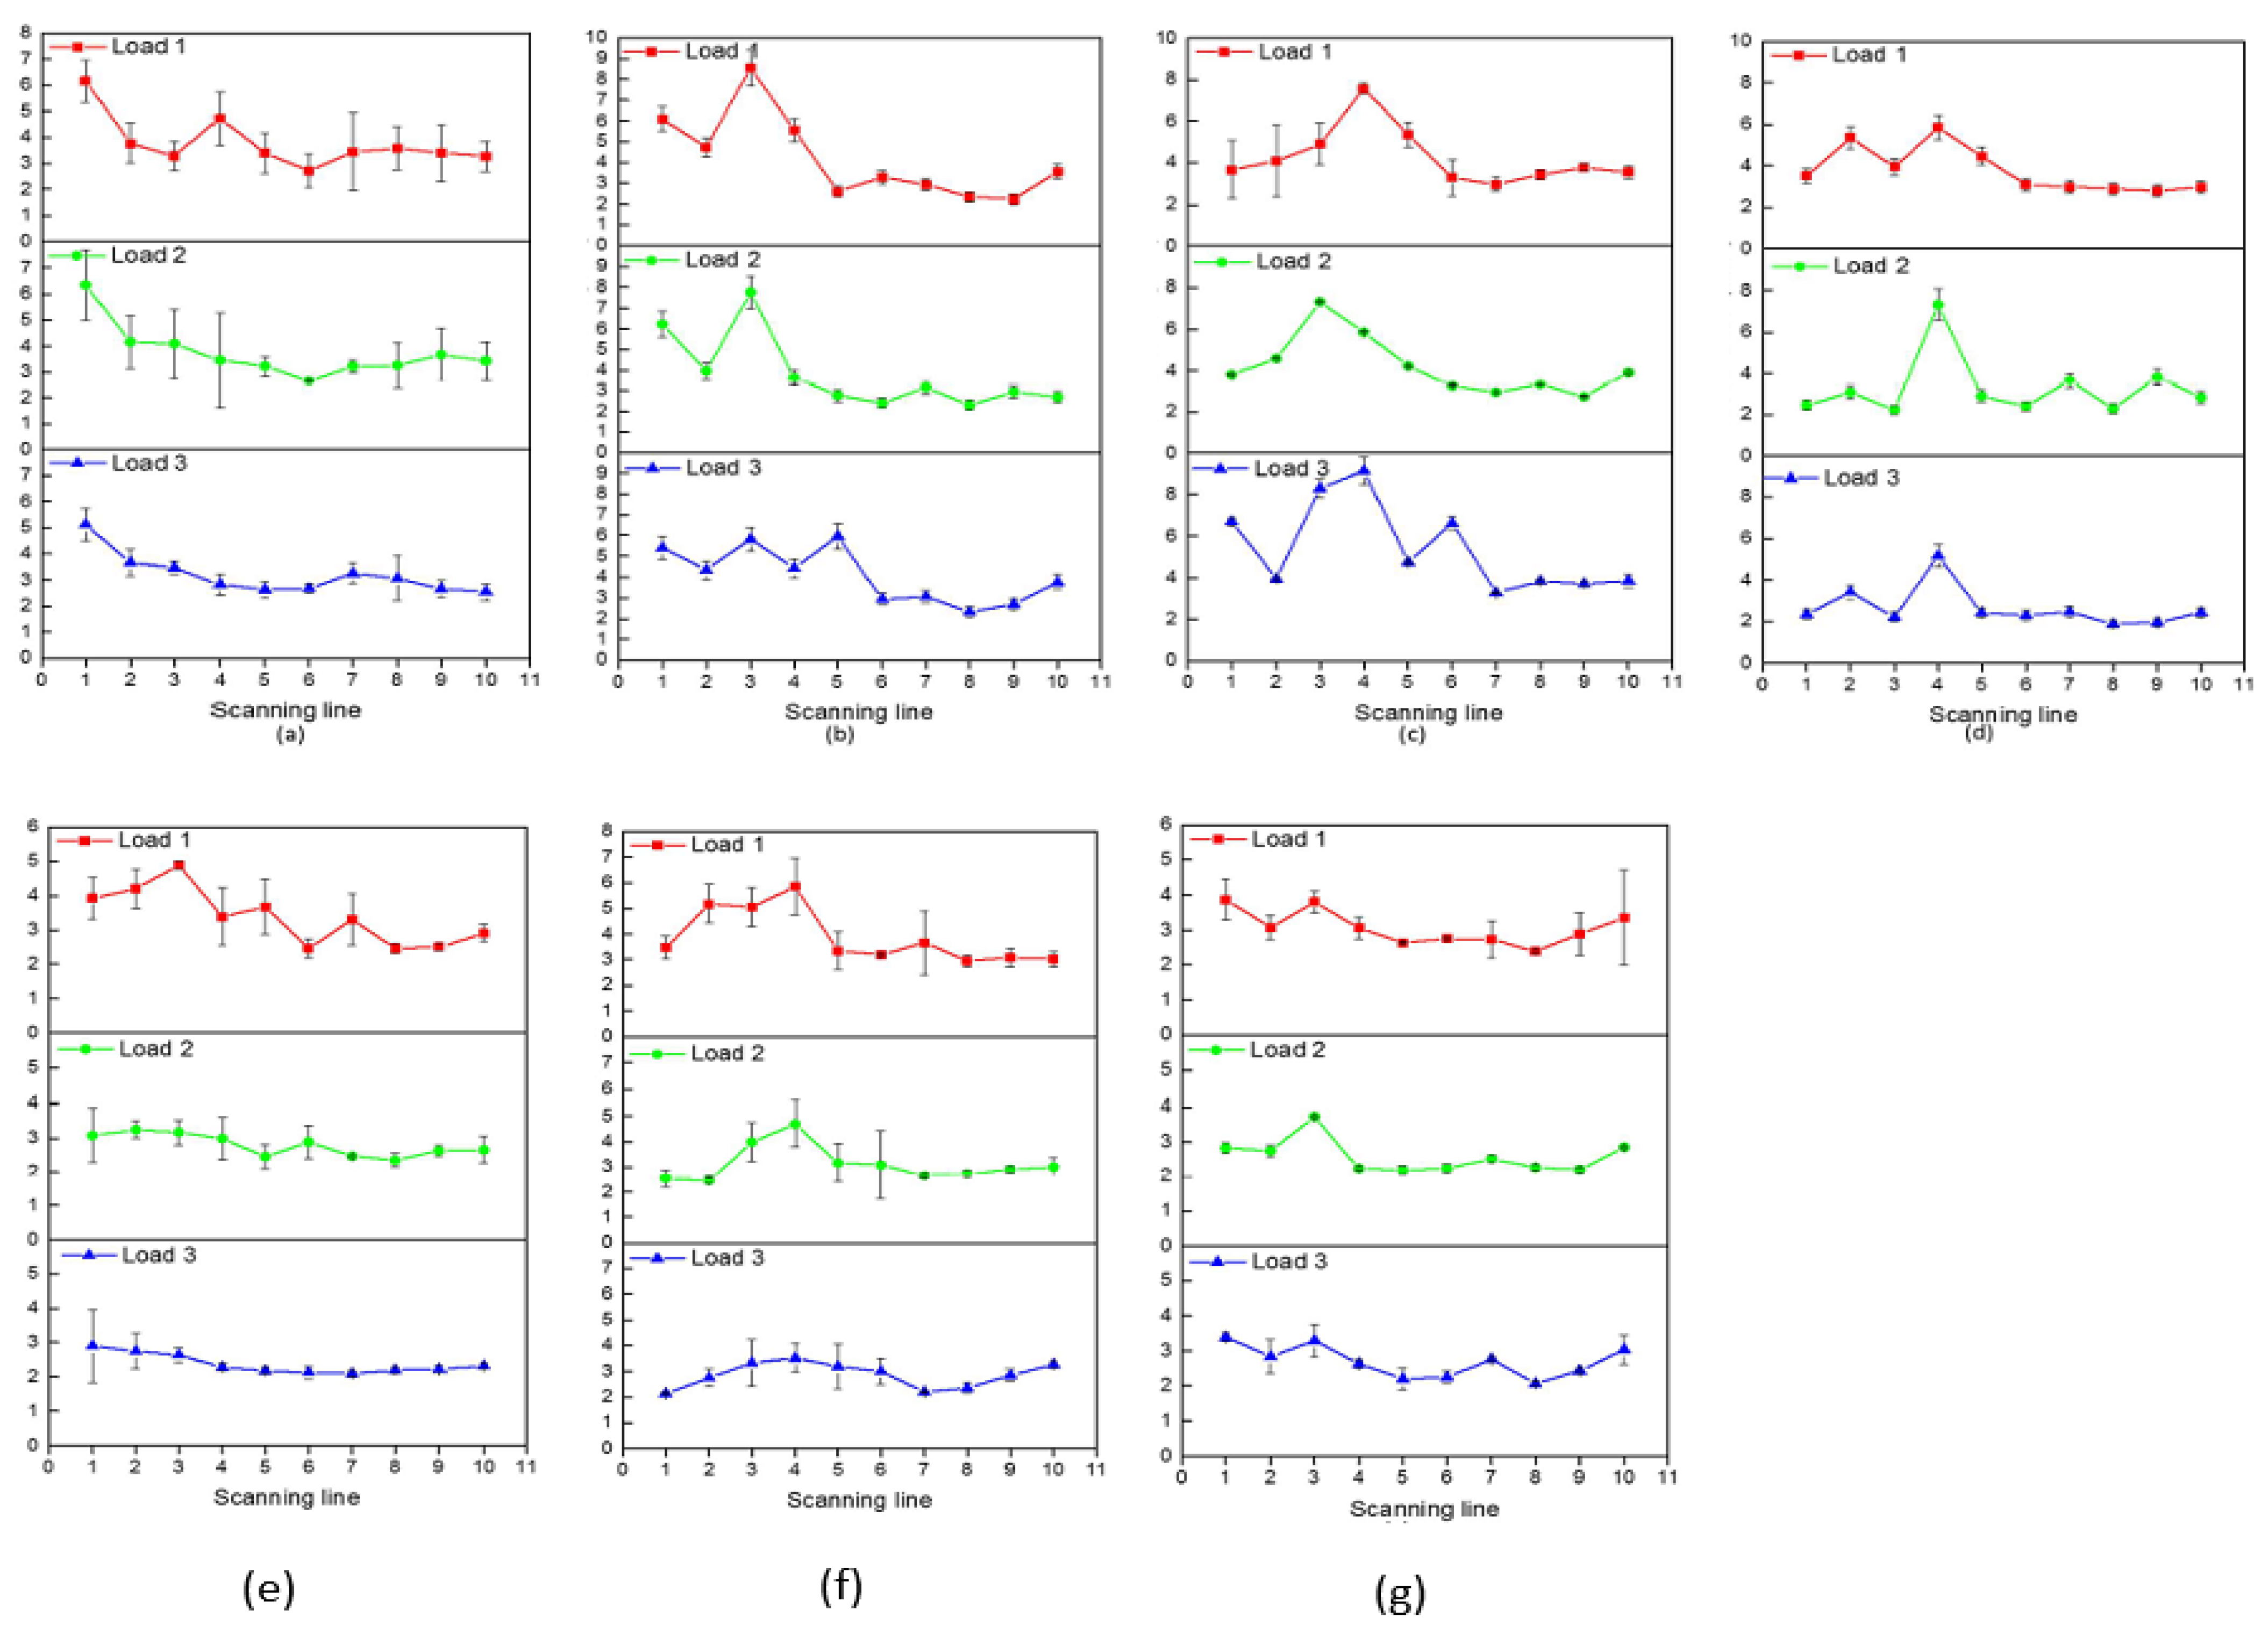
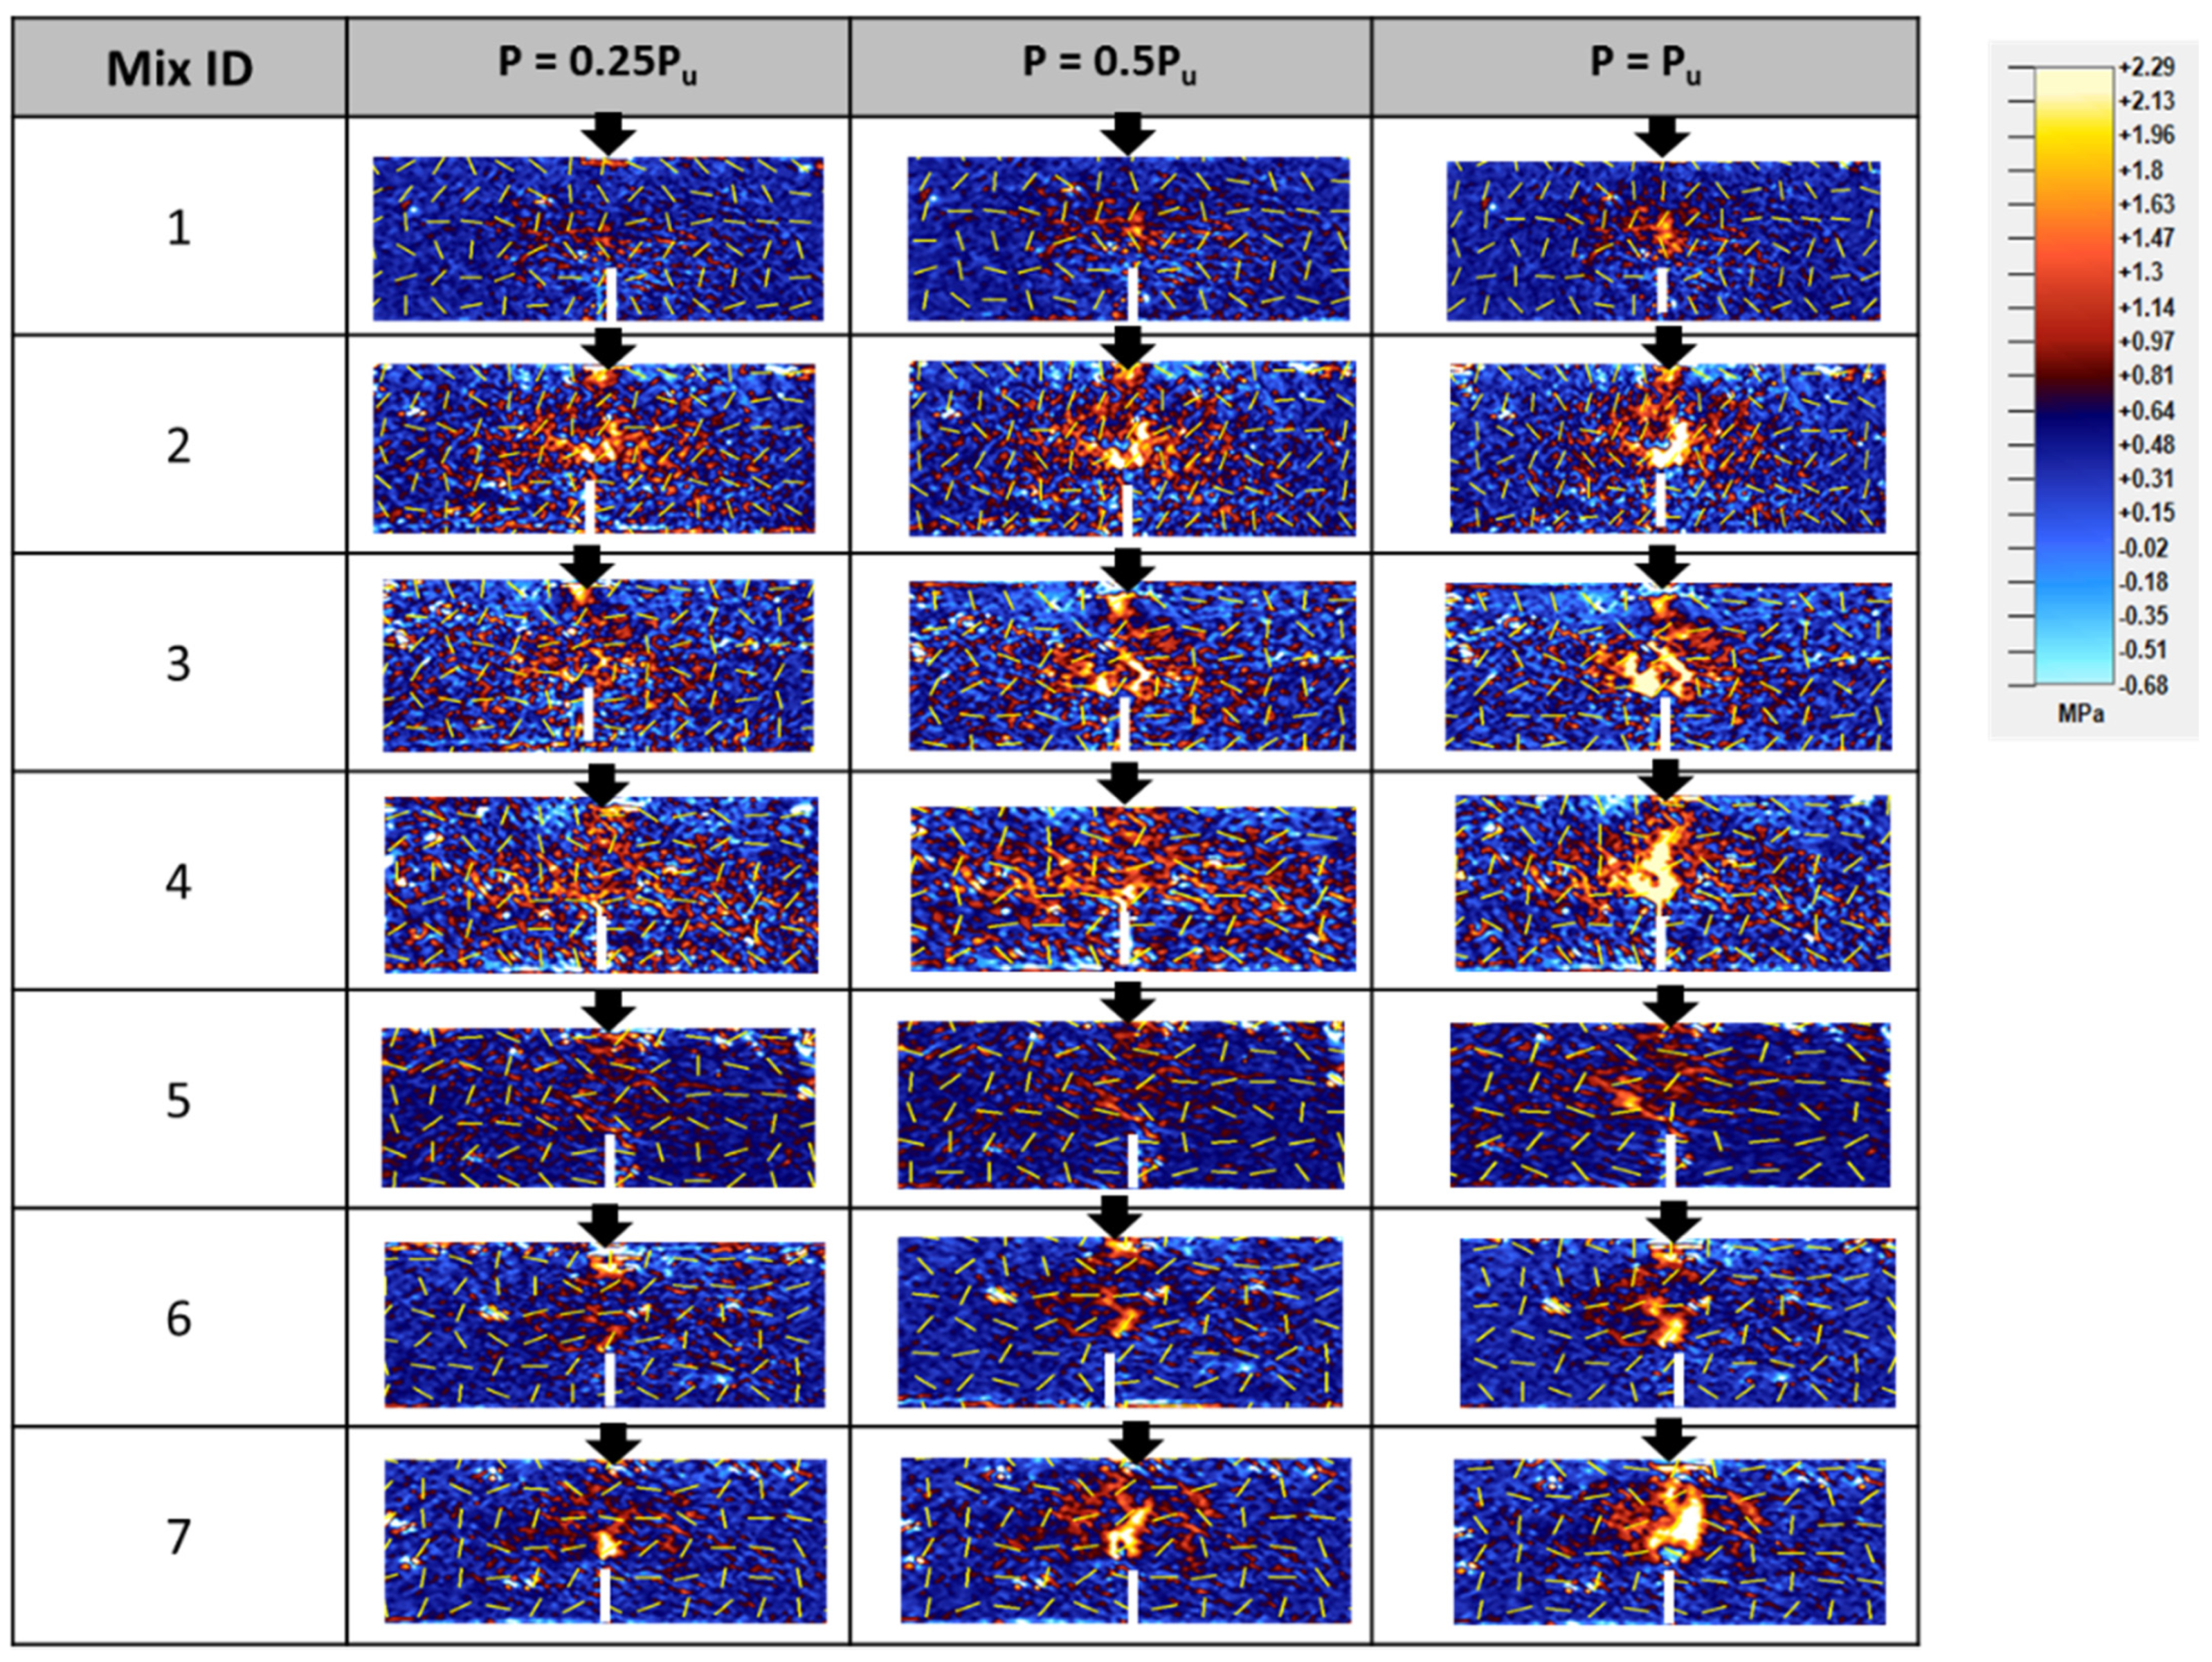
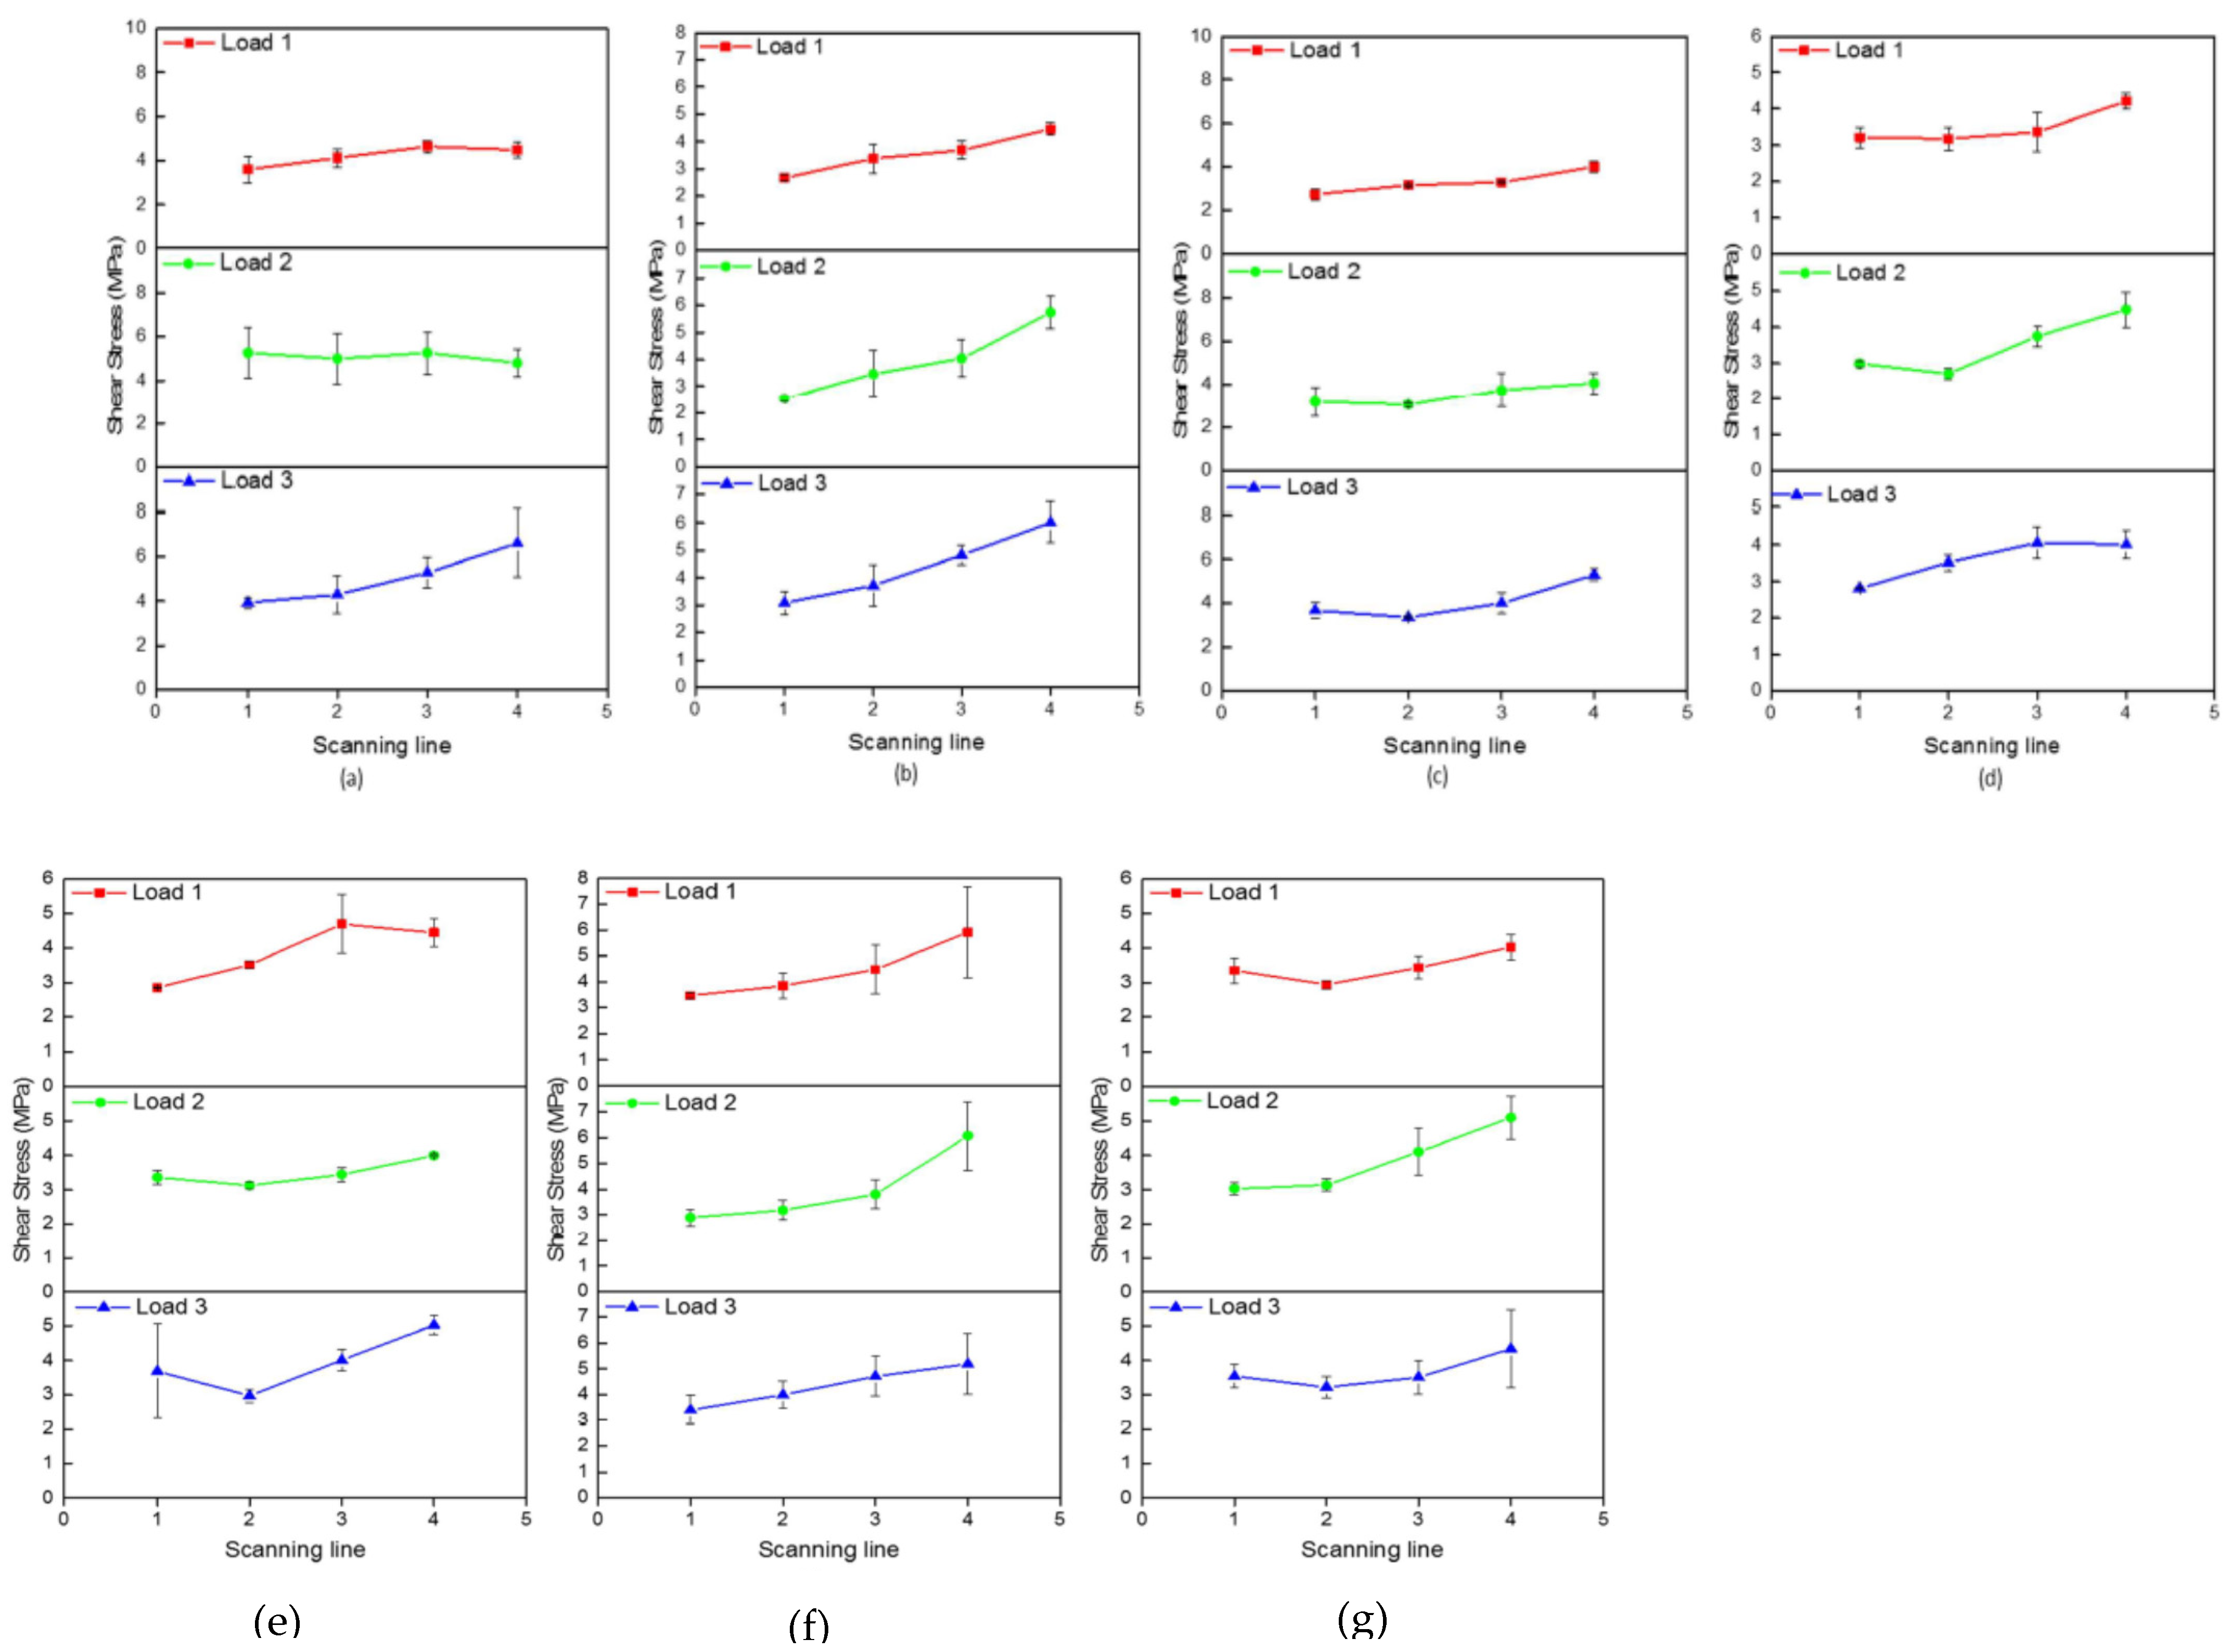
3.2. Distribution of Maximum Shear Stress and Direction of Principal Stresses

In all the following plots of maximum shear stress distribution, colour-coded scales are provided. The direction of the major principal stress is plotted as dotted lines (and the minor principal stress acts orthogonally to the direction of the major principal stress). Here, maximum shear stress distribution on the concrete samples for the unnotched prisms and cylinders under different loading levels P (in terms of different fractions of the ultimate load Pu) was analysed. It is to be noted that notched prisms will be analysed later to evaluate the fracture toughness. From Figure 10 and Figure 11, it can be seen that the maximum shear stress distribution in the prisms mostly occurs in triangular regions, starting beneath the loading point at the top of the prism, and spreads to the edges of the prism as the bottom of the prism is approached. Interestingly, the relatively low-level mobilisation of maximum shear stress distribution occurred in Mix 4 in the 28-day sample; and in Mix 5 in the 90-day samples. This trend coincided with the trends in their flexural strength (denoted as fcf in Figure 19) with its lowest value for Mix 4 in the 28-day samples and Mix 5 in the 90-day samples.
The evolution of maximum shear stress distribution is also presented for the 28- and 90-day cylinders in Figure 12 and Figure 13. Its variations across different levels will be presented later. However, interestingly, the relatively strong levels of stress distribution profile were spread across almost all parts of the sample of Mix 4 in the 28-day sample. Interestingly, Mix 4 exhibited the highest compressive strength among the 28-day samples. Similar correlative trends were also noticed in the case of samples with relatively high compressive strength for the 90-day samples (Mixes 1, 2, 4, 7 in Figure 9 and Figure 13).
Next, we analysed the shear stress concentration factor across the scanning lines (Figure 8) for both the unnotched 28- and 90-day prisms, and a typical case of 28-day cylinders. Their average values are presented in Figure 14, Figure 15 and Figure 16. It can be seen that the shear stress concentration factor varied nonhomogeneous across the sections, and the PSA was capable of giving precise information on where its maximum value occurred in the samples from the whole-field digital measurements. Such information will be useful in identifying the active deviator stress mobilisation regions in such complex samples.

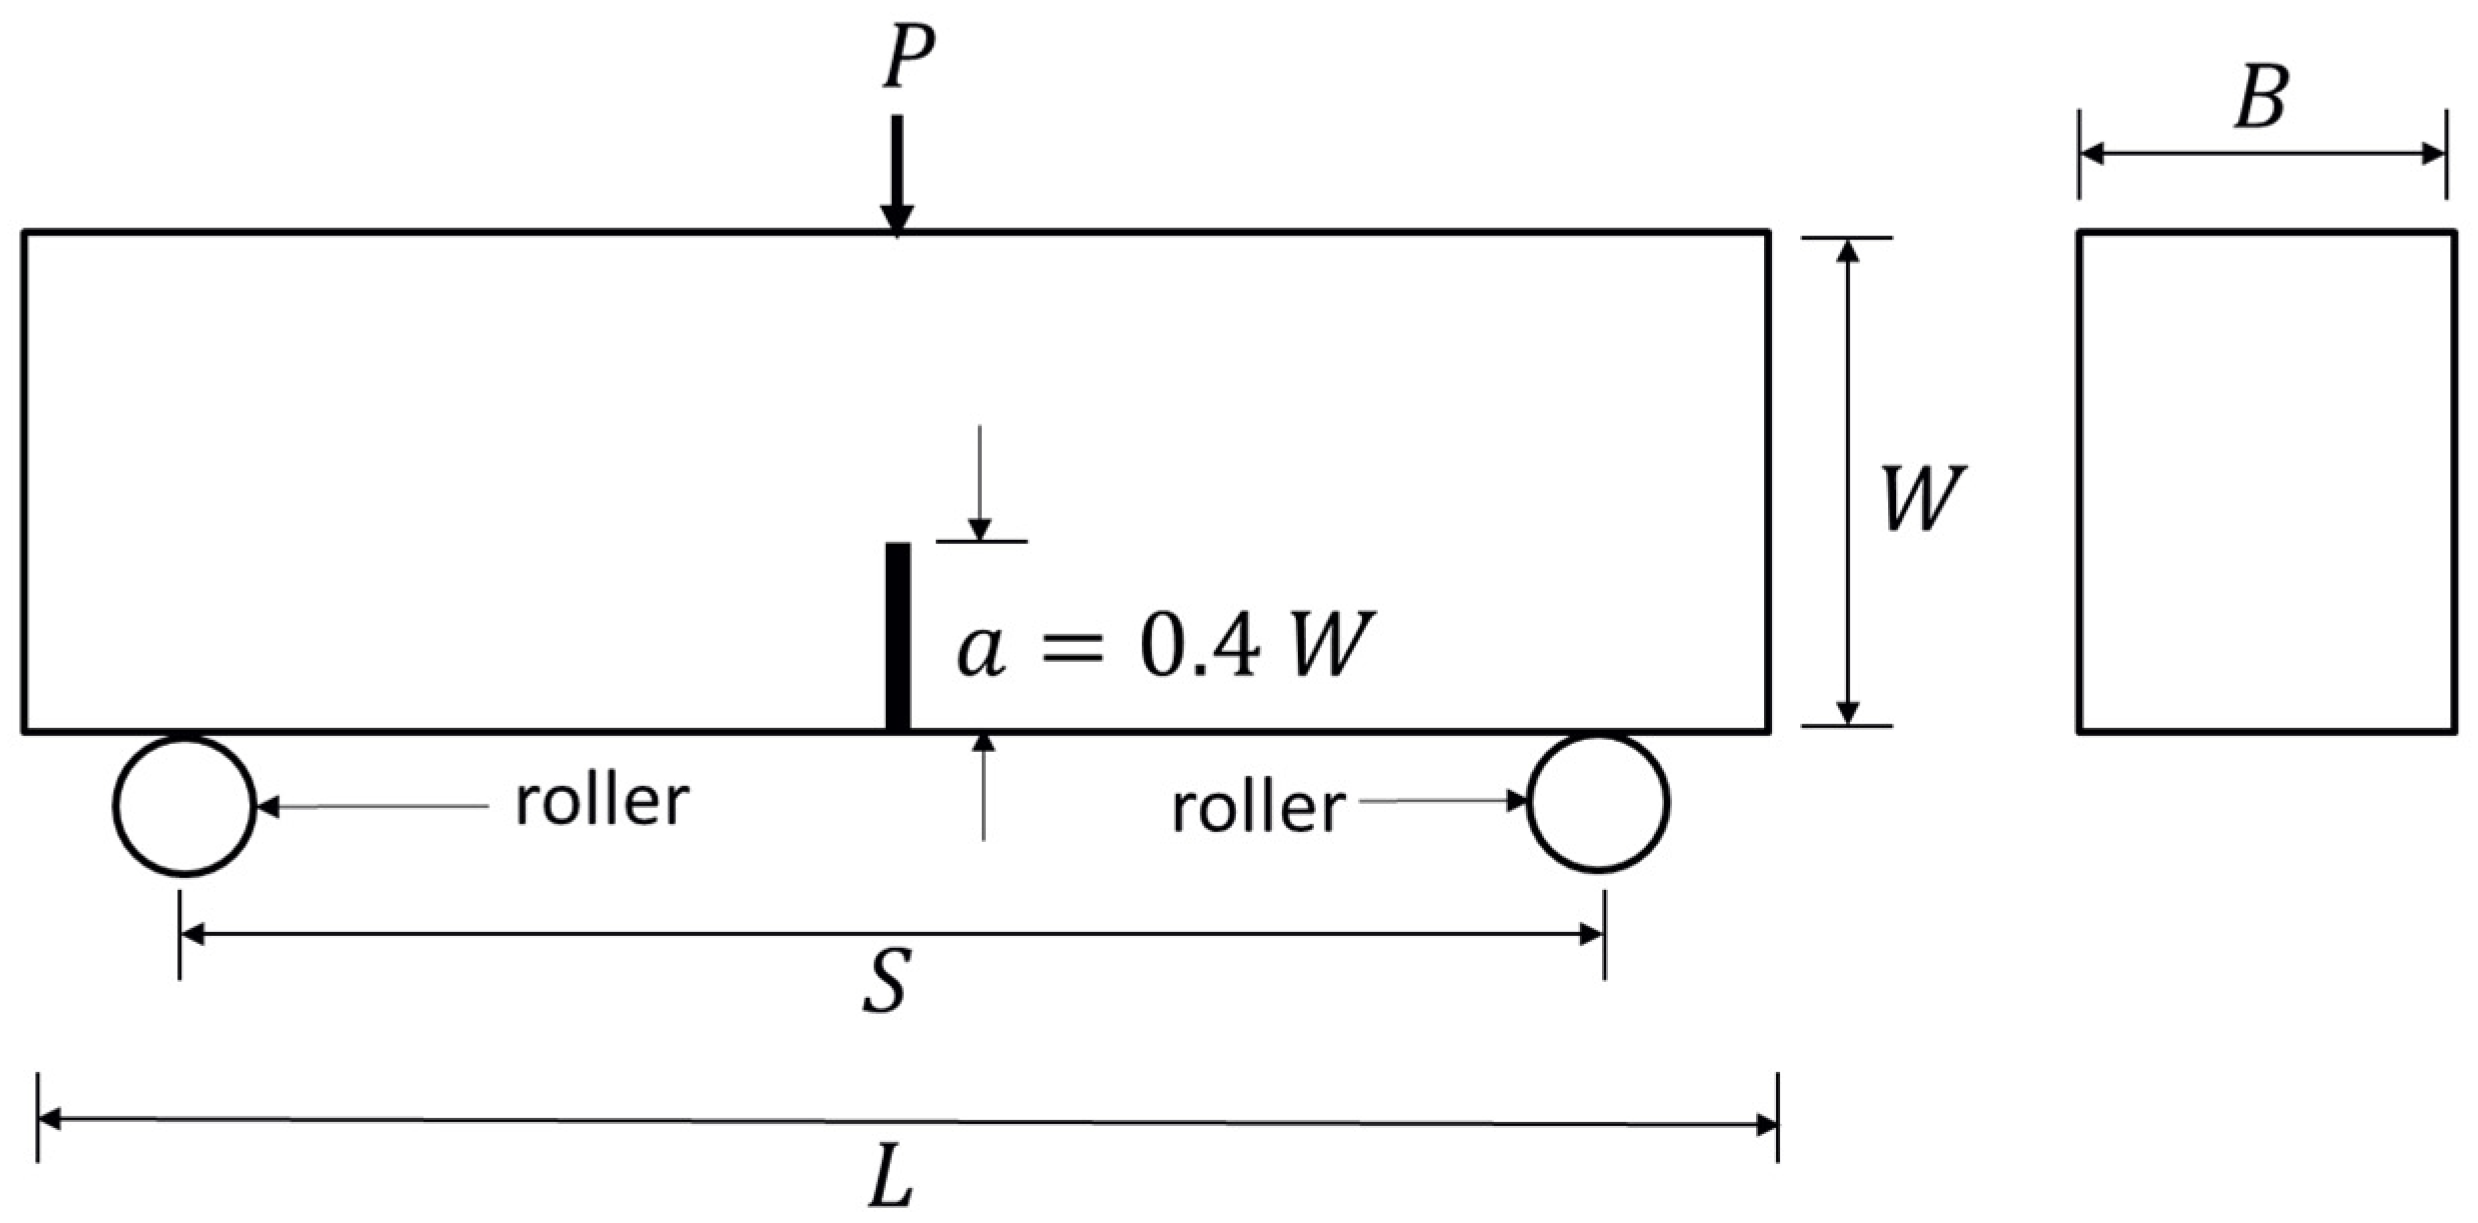
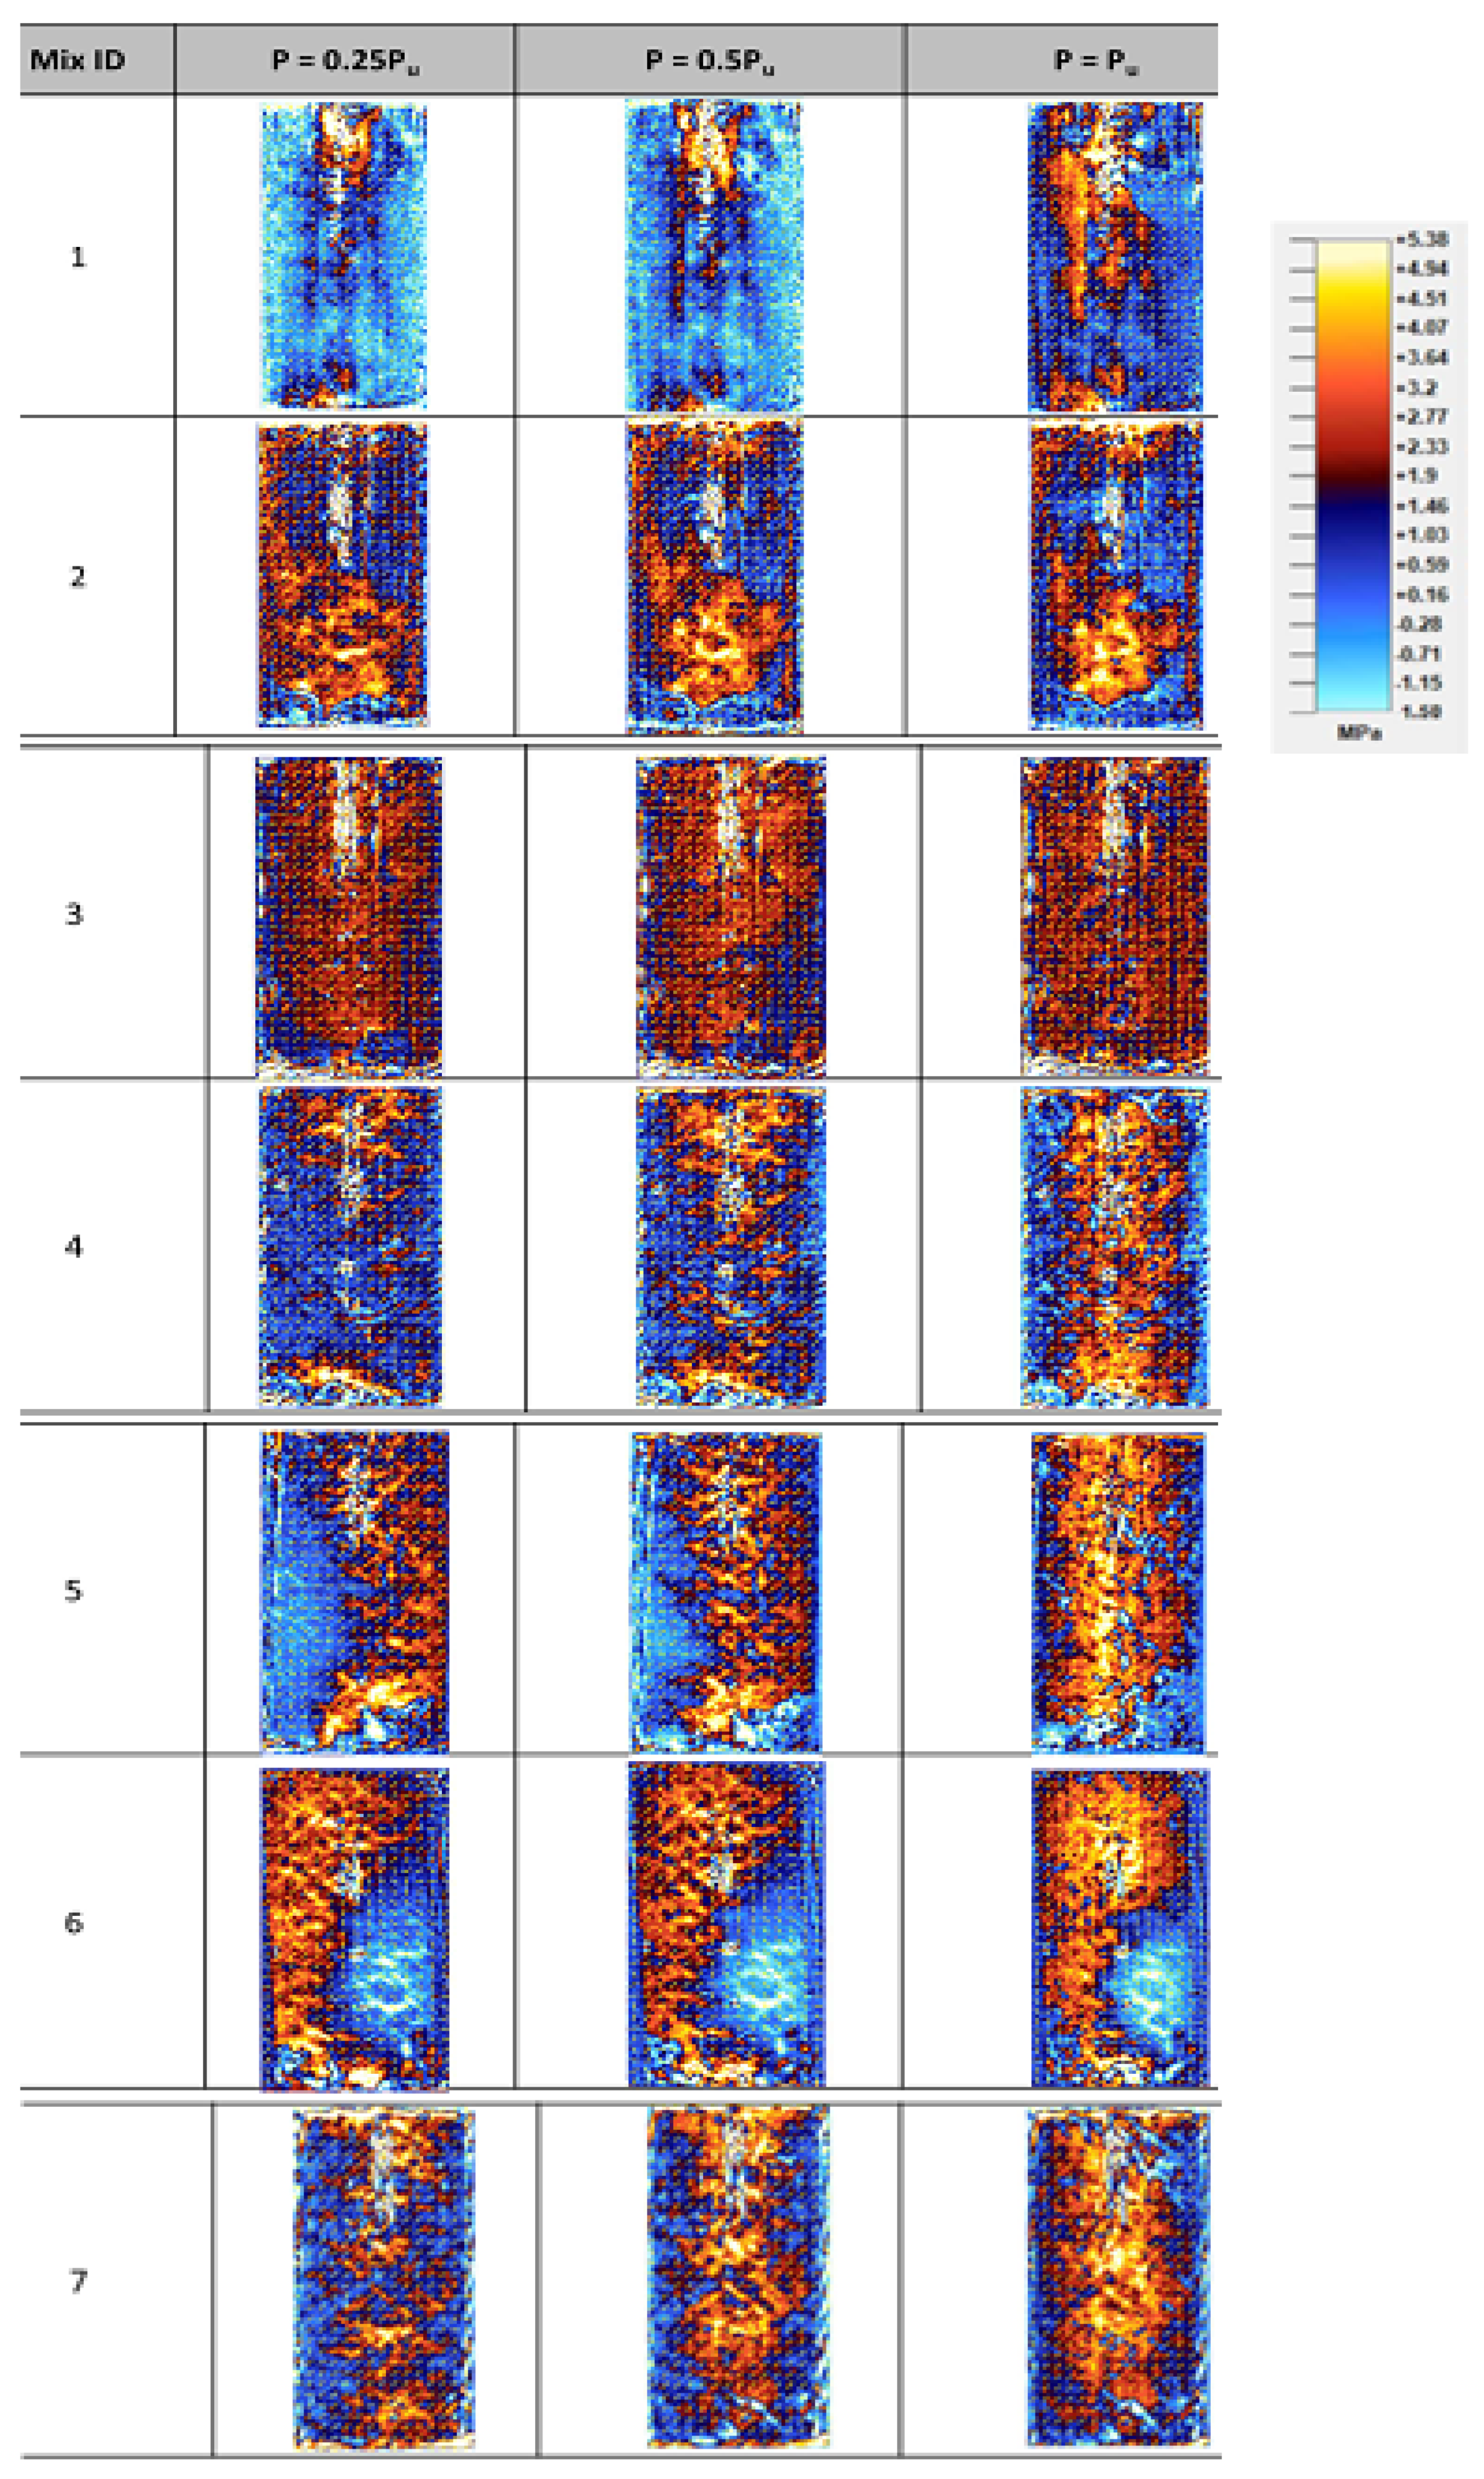
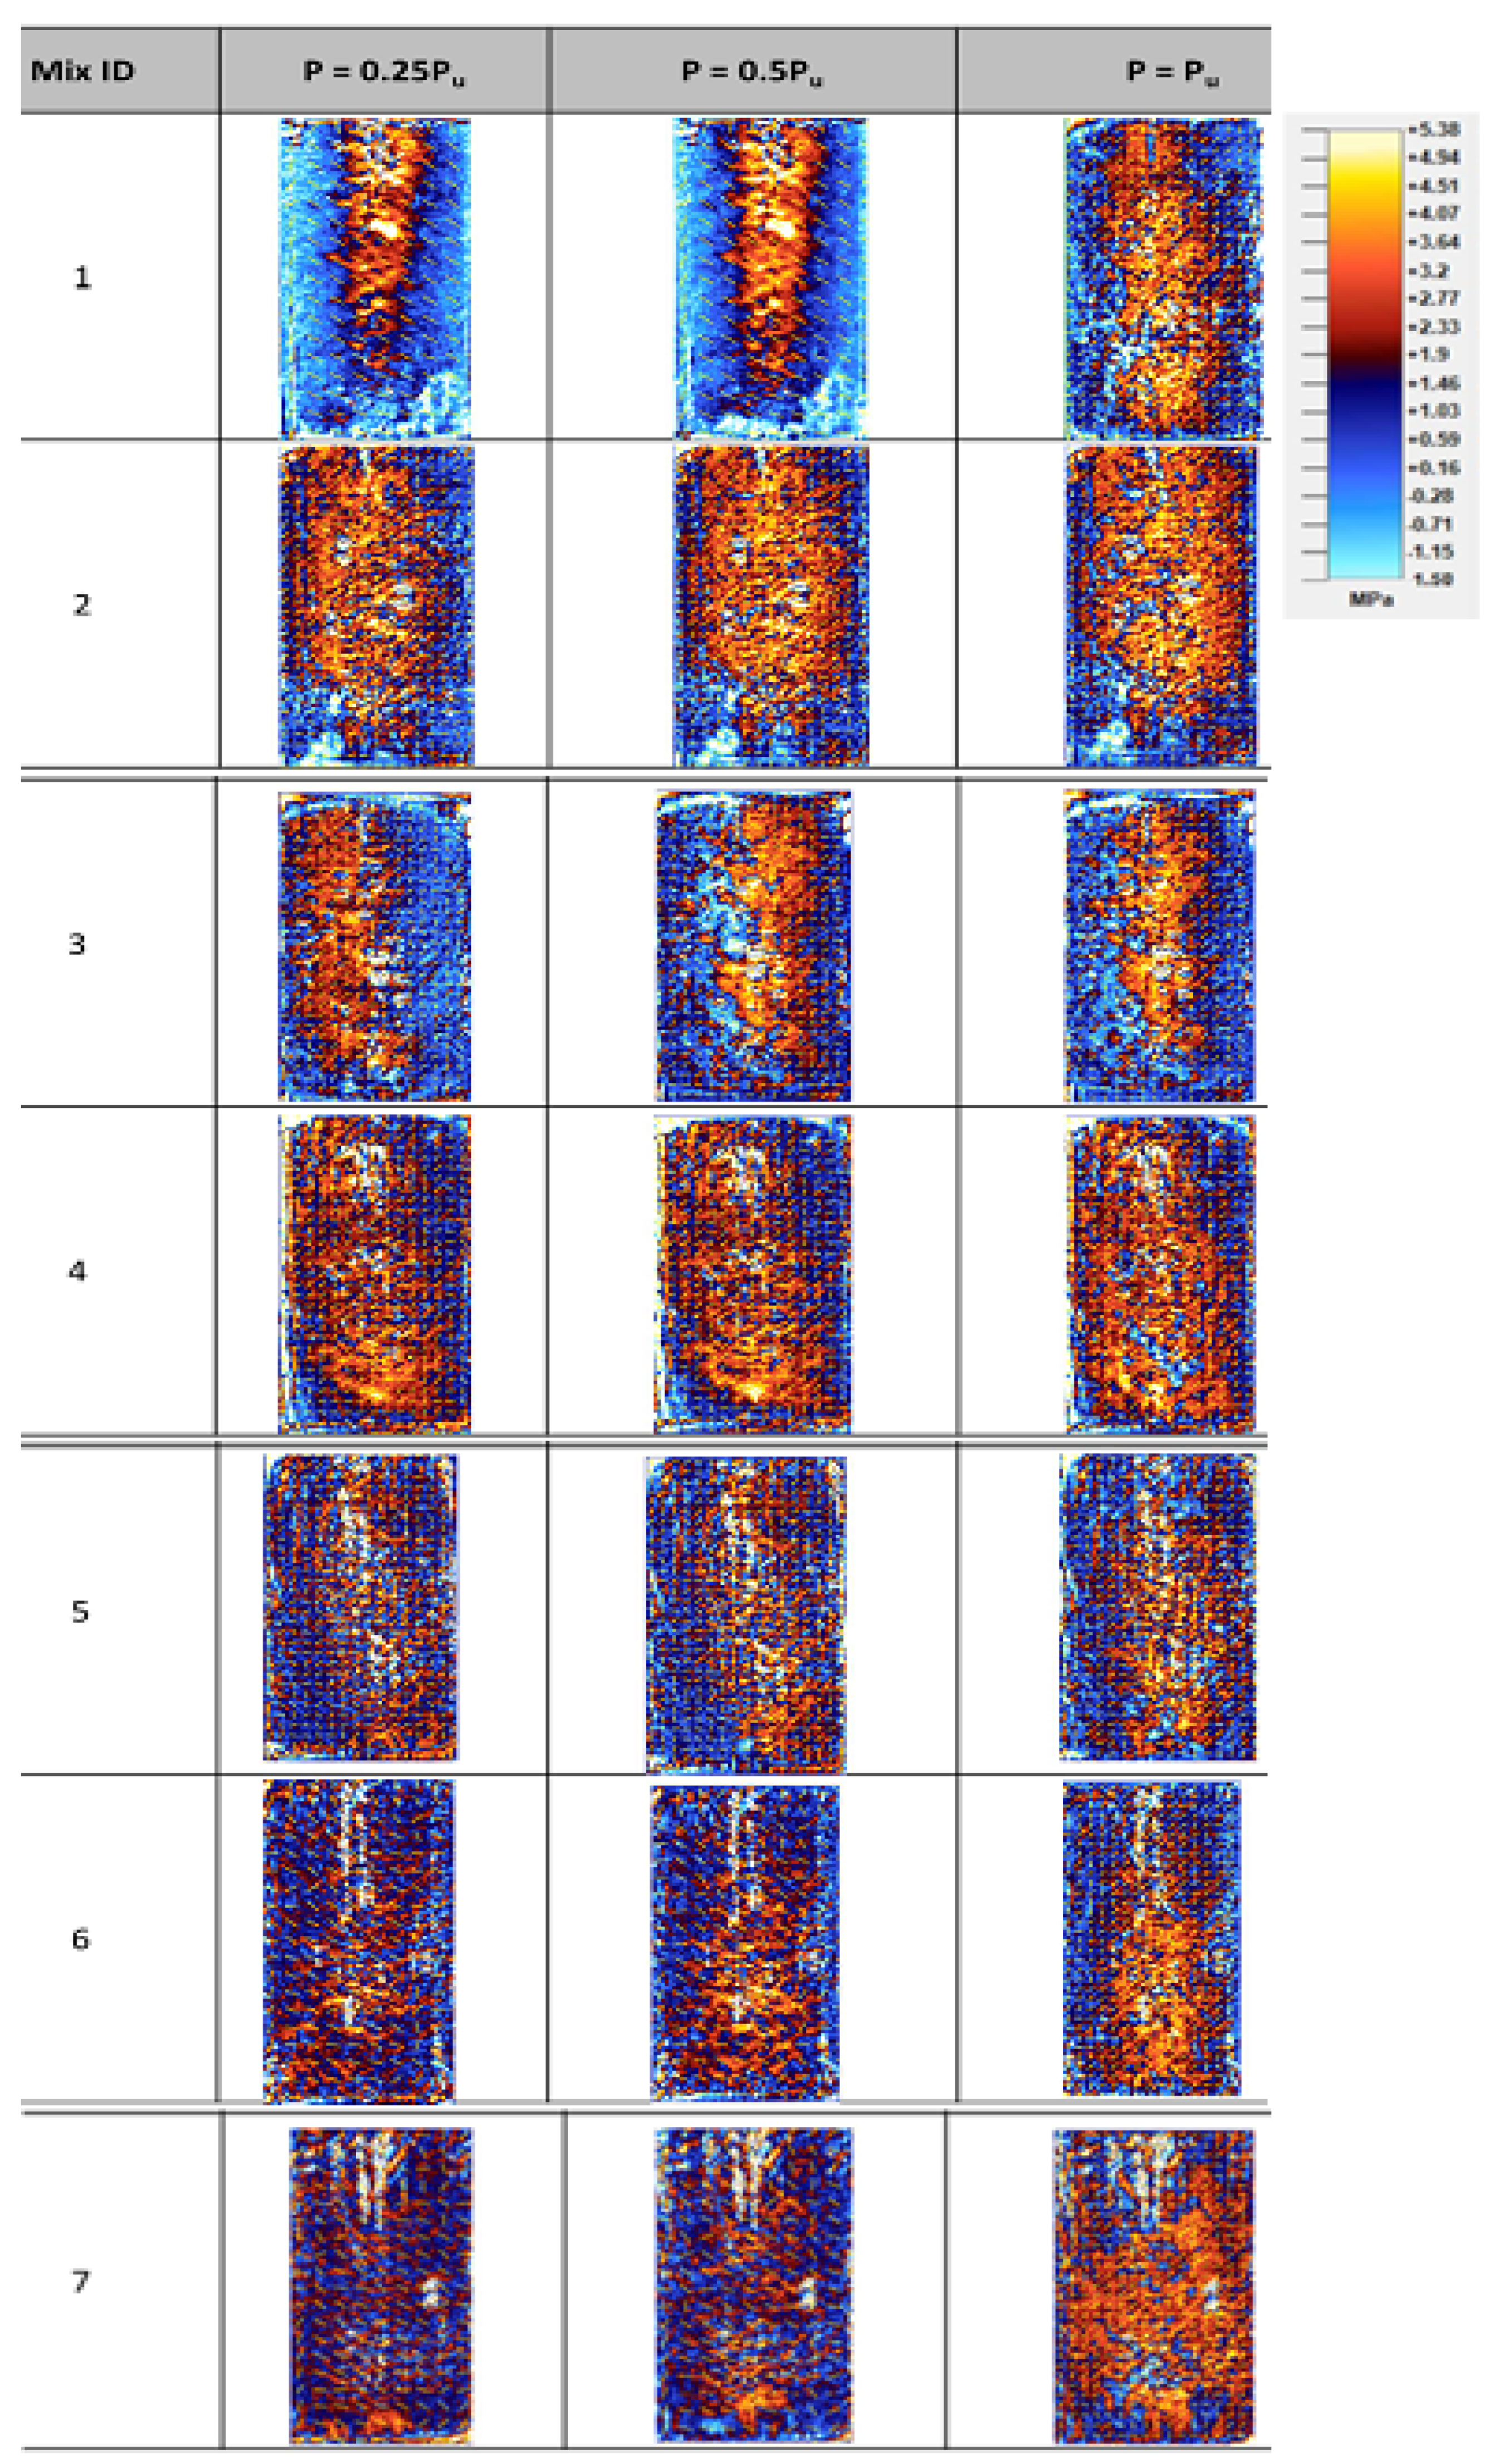
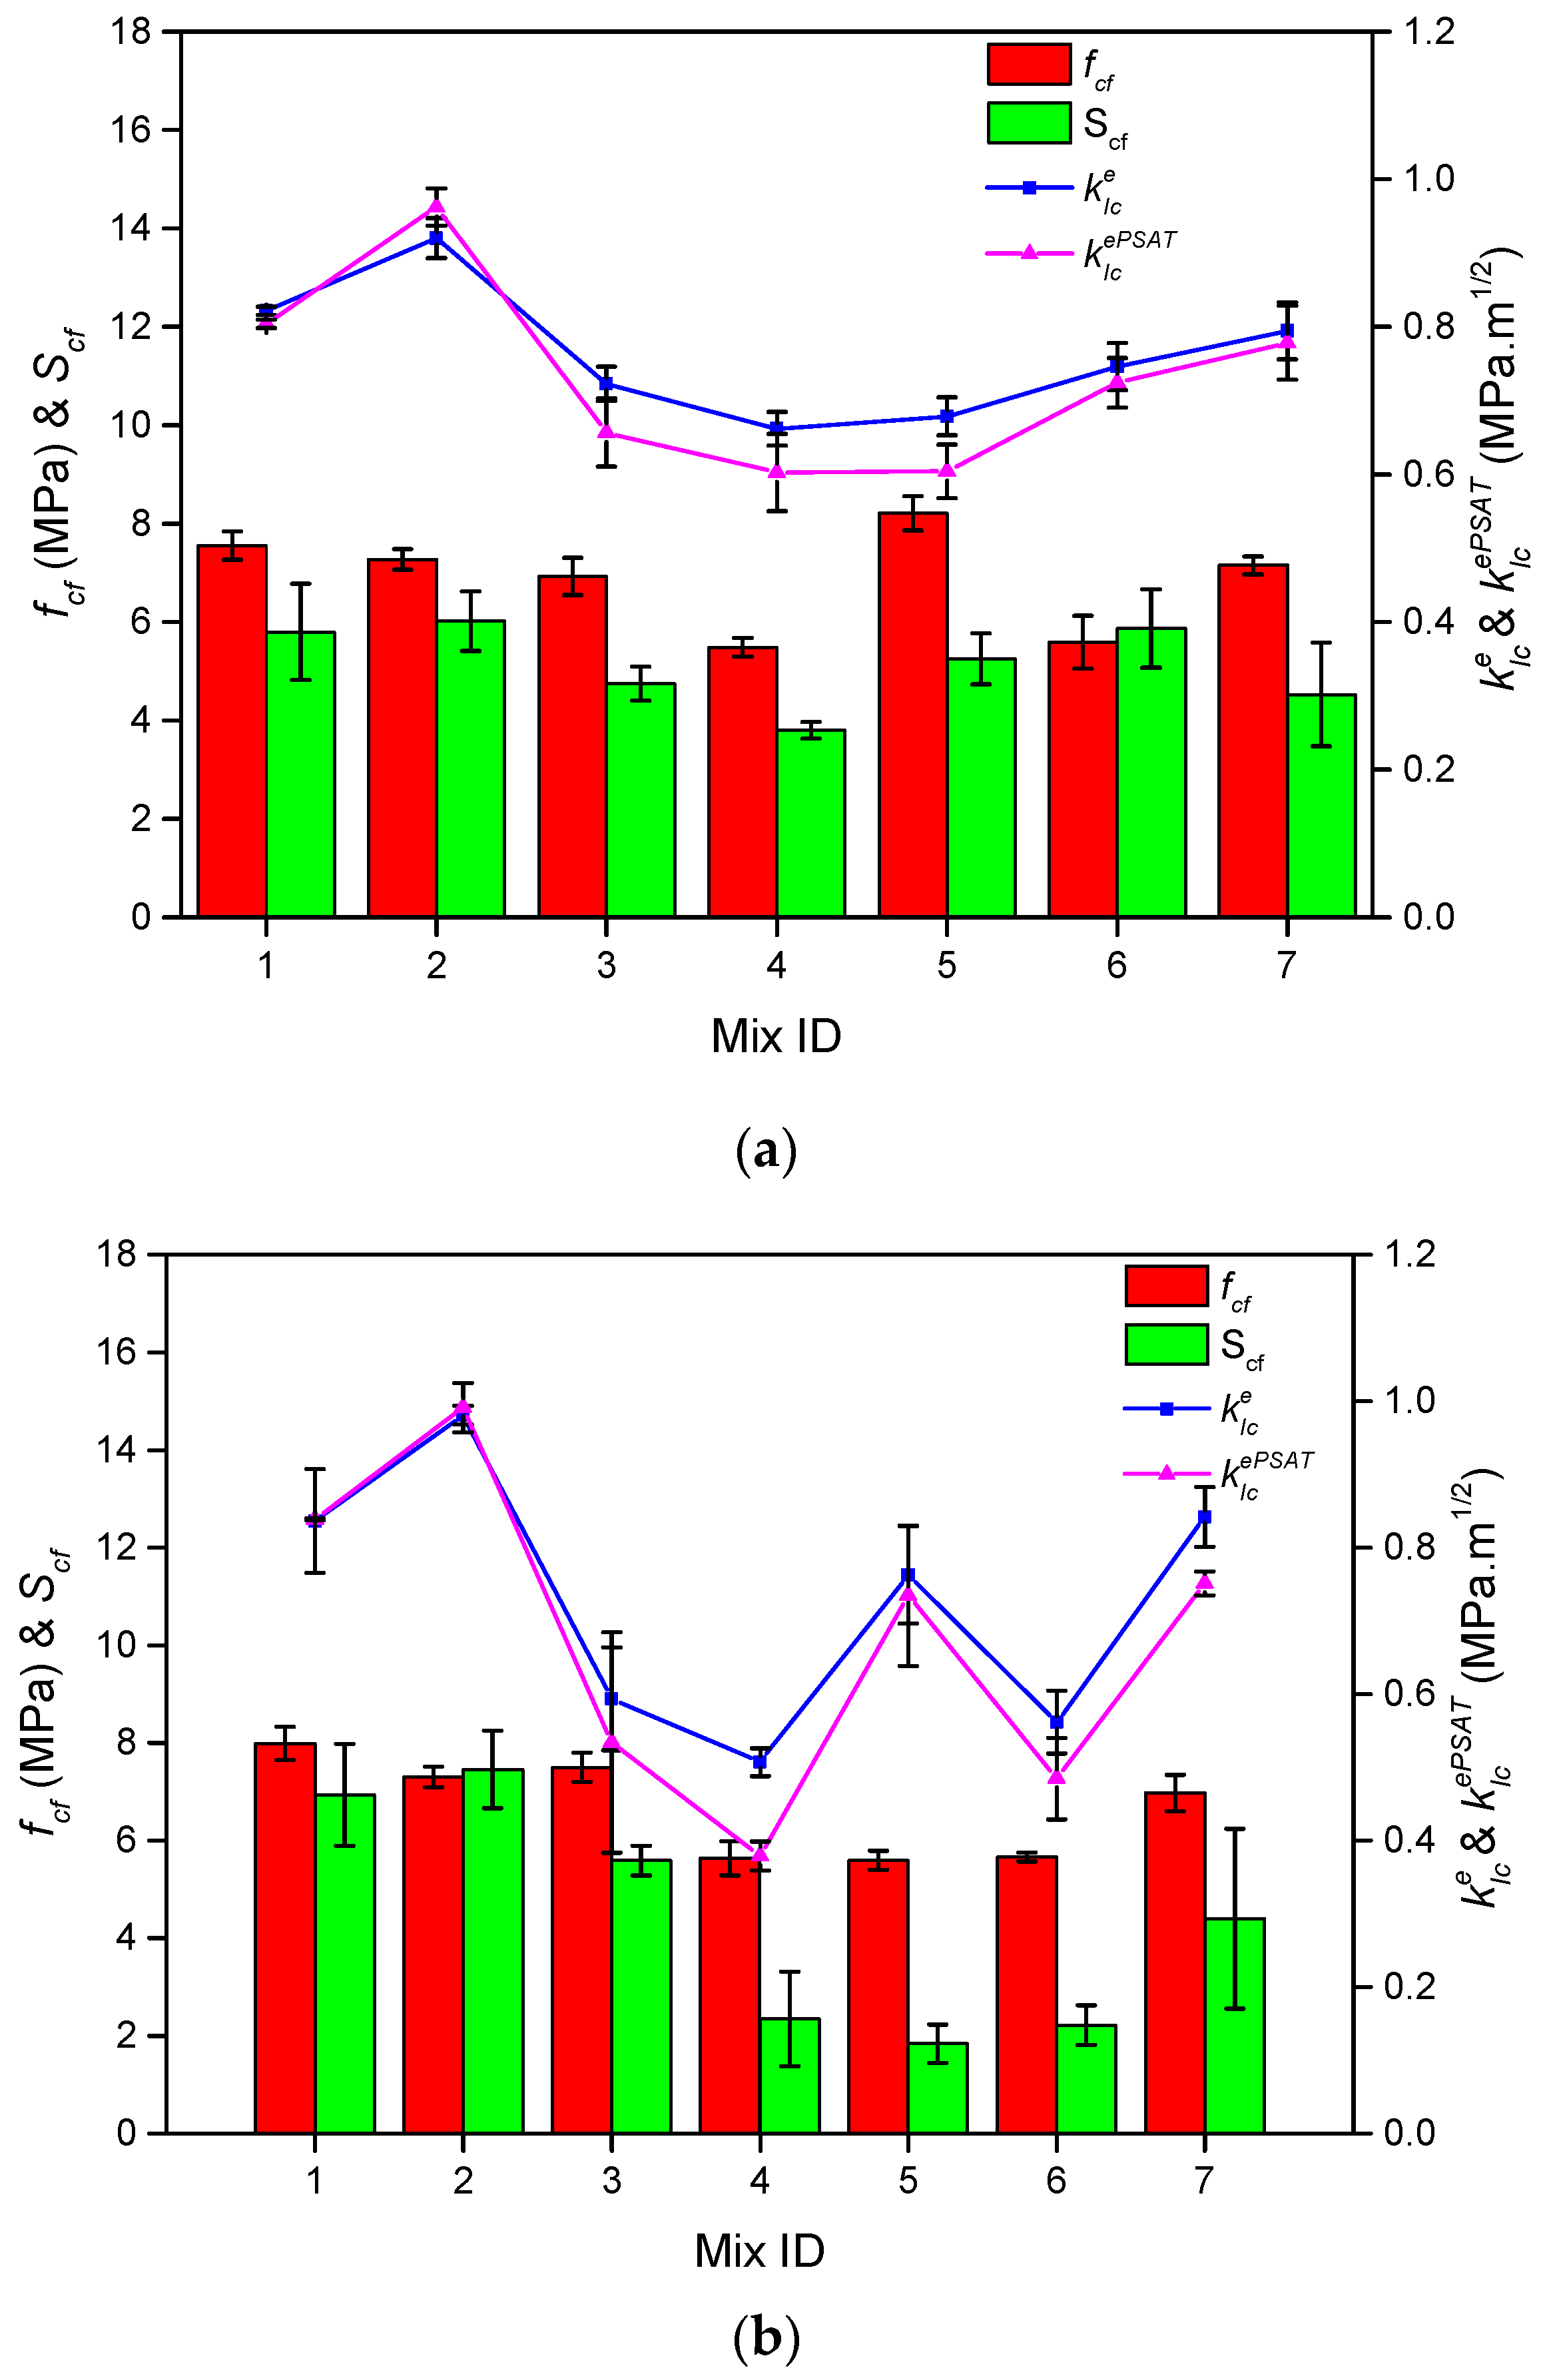
3.3. Evaluation of Fracture Toughness Using the Notched Prism Samples

The maximum shear stress profile of notched samples is presented in Figure 17 for the typical case of 28-day samples. It suggests that there was a high level of shear stress ahead of the tip of the notch/crack when the load was applied. This can also be seen in Figure 18, where shear stress concentration is plotted for different scanning lines up to the tip of the notch from the top surface of the notched prisms. It can be seen that among the scan lines chosen, scan line 4 presents the highest shear stress concentration factor ahead of the notch. However, the digital information of this for the whole region provided the ability to locate the points of its highest magnitude.
Also, in the strength analysis of materials, fracture mechanics considers the evolution of the fracture process zone (FPZ), which mobilises shear at a local scale ahead of the crack (/notch) tip. The characteristic depth of this plus the depth of the initial crack (/notch) size is considered as effective crack length (or effective depth) in the treatment of evaluating the fracture toughness using the effective crack (notch) model [48]. The determination of the effective depth is not straightforward in the existing experimental testing of concretes. Locating the evolution of cracks, their geometrical features, and the active shear mobilisation regions (at the local scale) ahead of the notch tip is difficult to measure with either the naked eye or by using a conventional microscope under progressive levels of external loading. In the current experimental work, we sensed the whole-field distribution of the deviator stress (or maximum shear stress) ahead of the notch using the birefringent properties of the coated samples as explained above. At the scale of the grain, the slippage of the grains and subsequent formation of cracks under the mechanical loading is favourable to their maximum shear stress state (or related deviatoric state) [45,49]. Hence in this study, it can be postulated that by sensing the evolution of τmax, the location of the highest value of τmax (or the point of the highest value of the retardation of light) from the initial notch tip under the ultimate load was used to evaluate the effective length of the crack ( a e ) and K I c e P S A T . The fracture toughness (denoted as K I c e ) was calculated as follows, at first using the effective crack (notch) model [48] and then using the current approach (denoted as K I c e P S A T ) by replacing the value of the theoretical effective crack length with the current experimental data of the present work [37]. These results are presented for the different mixes in Figure 19 in which the flexural strength fcf and the maximum shear stress concentration factor Scf are also included for comparison purposes. Table 3 presents the comparison of the fracture toughness evaluated for a typical case of 90-day samples, and compared the current approach ( K I c e P S A T ) with the existing effective crack length model [48] ( K I c e ), which involved empirical equations at some parts. For information, the maximum value of the shear stress concentration factor was also incorporated.
We observed that the fracture toughness values evaluated using the current approach were in good agreement with those evaluated using the conventional method approach, as said above. Overall, the mix that contained only steel fibre (Mix 2) exhibited the highest value of fracture toughness and shear stress concentration factor. However, the current method of analysing the fracture toughness was more versatile and generic and can be applied to other cases of composite materials in the future.

4. Conclusions

The current study demonstrates the usefulness of applying photo stress analysis for understanding the mechanical properties of composite concretes using recycled municipal plastic granules. This enables us to understand the mechanics of composite concretes at different scales, i.e., visualising the whole-field evolution of shear stress (/strain), and their local scale characteristics are applied further for evaluating the bulk strength characteristics of concrete mixes of different ingredients derived from municipal wastes. An improved understanding of both the local scale stress (/strain) evolution and bulk strength characteristics should in turn help us to develop more realistic theories for describing the strength characteristics of new concrete material in the future. This can lead us to develop more processes to recycle and reuse plastic wastes for manufacturing novel composites. Further studies are required to potentially add suitable new materials, including detailed material characterisations for increasing the bonding of the plastic inclusions in the concrete samples. The current approach is also suited to extend the investigations to related aspects such as size effects of the composite samples and under other loading conditions in the future. In the long term, these will help us to reutilise plastic wastes through suitably recycling them into granular and other forms, that would otherwise end up in our landfills and harm the environment.

Author Contributions

S.J.A. conceived the idea, led the research, contributed to the analysis, and wrote the manuscript. D.D.G.T. made the concrete samples and contributed to the preparation of the manuscript. N.G.O. supervised the research on the fabrication of the composite mixes. G.O. performed the experiments, prepared, and analysed the data. All authors contributed to finalising the paper. All authors have read and agreed to the published version of the manuscript.

Funding

This publication was made possible by NPRP grant No. 6-1010-2-413 from the Qatar National Research Fund (a member of the Qatar Foundation). The statements made herein are solely the responsibility of the authors.

Institutional Review Board Statement

Not applicable.

Informed Consent Statement

Not applicable.

Data Availability Statement

The data presented in this study are available on reasonable request from the corresponding author.

Acknowledgments

The authors are grateful to Keppel Sehgers and the Doha Plastic Company for providing access to their site, sharing their knowledge, and providing waste materials. The authors would like to thank Qatar Chemical Company (QCHEM) and Qatar Petrochemical Company (QAPCO) for providing virgin polymer samples.

Conflicts of Interest

The authors declare no conflict of interest. The funders had no role in the design of the study; in the collection, analyses, or interpretation of data; in the writing of the manuscript, or in the decision to publish the results.

References

  1. Mehta, K.P.; Monteiro, P.J.M. Concrete: Microstructure, Properties, and Materials, 3rd ed.; McGraw-Hill: New York, NY, USA, 2006. [Google Scholar]
  2. Aïtcin, P.C. Cements of yesterday and today—Concrete of tomorrow. Cem. Concr. Res. 2000, 30, 1349–1359. [Google Scholar] [CrossRef]
  3. Meyer, C. The greening of the concrete industry. Cem. Concr. Compos. 2009, 31, 601–605. [Google Scholar] [CrossRef]
  4. Chen, C.; Habert, G.; Bouzidi, Y.; Jullien, A. Environmental impact of cement production: Detail of the different processes and cement plant variability evaluation. J. Clean Prod. 2010, 18, 478–485. [Google Scholar] [CrossRef]
  5. Peng, J.; Huang, L.; Zhao, Y.; Chen, P.; Zeng, L.; Zheng, W. Modeling of carbon dioxide measurement on cement plants. Adv. Mater. Res. 2013, 610–613, 2120–2128. [Google Scholar] [CrossRef]
  6. Worrell, E.; Price, L.; Martin, N.; Hendriks, C.; Meida, L.O. Carbon dioxide emissions from the global cement industry. Annu. Rev. Energy Environ. 2001, 26, 303–329. [Google Scholar] [CrossRef]
  7. McNally, G.H. Soil and Rock Construction Materials; Spon Press: London, UK, 1998. [Google Scholar]
  8. Cachim, P.; Velosa, A.; Ferraz, E. Substitution materials for sustainable concrete production in Portugal. KSCE J. Civ. Eng. 2014, 18, 60–66. [Google Scholar] [CrossRef]
  9. Sua-Iam, G.; Makul, N. Utilization of coal- and biomass-fired ash in the production of self-consolidating concrete: A literature review. J. Clean. Prod. 2015, 100, 59–76. [Google Scholar] [CrossRef]
  10. Bie, R.; Chen, P.; Song, X.; Ji, X. Characteristics of municipal solid waste incineration fly ash with cement solidification treatment. J. Energy Inst. 2016, 89, 704–712. [Google Scholar] [CrossRef]
  11. Lam, C.H.K.; Ip, A.W.M.; Barford, J.P.; McKay, G. Use of incineration MSW ash: A review. Sustainability 2010, 2, 1943–1968. [Google Scholar] [CrossRef] [Green Version]
  12. Sikalidis, C.A.; Zabaniotou, A.A.; Famellos, S.P. Utilisation of municipal solid wastes for mortar production. Resour. Conserv. Recycl. 2002, 36, 155–167. [Google Scholar] [CrossRef]
  13. Tyrer, M. Municipal solid waste incinerator (MSWI) concrete. Eco-Effic. Concr. 2013, 273–310. [Google Scholar] [CrossRef]
  14. Akçaözoğlu, S.; Atiş, C.D. Effect of Granulated Blast Furnace Slag and fly ash addition on the strength properties of lightweight mortars containing waste PET aggregates. Constr. Build. Mater. 2011, 25, 4052–4058. [Google Scholar] [CrossRef]
  15. Güneyisi, E.; Gesoǧlu, M. A study on durability properties of high-performance concretes incorporating high replacement levels of slag. Mater. Struct. Mater. Constr. 2008, 41, 479–493. [Google Scholar] [CrossRef]
  16. Nochaiya, T.; Wongkeo, W.; Chaipanich, A. Utilization of fly ash with silica fume and properties of Portland cement-fly ash-silica fume concrete. Fuel 2010, 89, 768–774. [Google Scholar] [CrossRef]
  17. Biricik, H.; Sarier, N. Comparative study of the characteristics of nano silica-, silica fume- and fly ash-incorporated cement mortars. Mater. Res. 2014, 17, 570–582. [Google Scholar] [CrossRef]
  18. Sharifikolouei, E.; Canonico, F.; Salvo, M.; Baino, F.; Ferraris, M. Vitrified and nonvitrified municipal solid wastes as ordinary Portland cement (OPC) and sand substitution in mortars. Int. J. Appl. Ceram. Technol. 2020, 17, 573–583. [Google Scholar] [CrossRef]
  19. Ferraro, A.; Farina, I.; Race, M.; Colangelo, F.; Cioffi, R.; Fabbricino, M. Pre-treatments of MSWI fly-ashes: A comprehensive review to determine optimal conditions for their reuse and/or environmentally sustainable disposal. Rev. Environ. Sci. Biotechnol. 2019, 18, 453–471. [Google Scholar] [CrossRef]
  20. Achtemichuk, S.; Hubbard, J.; Sluce, R.; Shehata, M.H. The utilization of recycled concrete aggregate to produce controlled low-strength materials without using Portland cement. Cem. Concr. Compos. 2009, 31, 564–569. [Google Scholar] [CrossRef]
  21. Behera, M.; Bhattacharyya, S.K.; Minocha, A.K.; Deoliya, R.; Maiti, S. Recycled aggregate from C&D waste & its use in concrete—A breakthrough towards sustainability in construction sector: A review. Constr. Build. Mater. 2014, 68, 501–516. [Google Scholar] [CrossRef]
  22. Siddique, R.; Khatib, J.; Kaur, I. Use of recycled plastic in concrete: A review. Waste Manag. 2008, 28, 1835–1852. [Google Scholar] [CrossRef]
  23. Sharma, R.; Bansal, P.P. Use of different forms of waste plastic in concrete—A review. J. Clean. Prod. 2016, 112, 473–482. [Google Scholar] [CrossRef]
  24. Al-Maaded, M.; Madi, N.K.; Kahraman, R.; Hodzic, A.; Ozerkan, N.G. An Overview of Solid Waste Management and Plastic Recycling in Qatar. J. Polym. Environ. 2012, 20, 186–194. [Google Scholar] [CrossRef]
  25. Al-Ma’adeed, M.; Ozerkan, G.; Kahraman, R.; Rajendran, S.; Hodzic, A. Life Cycle Assessment of Particulate Recycled Low Density Polyethylene and Recycled Polypropylene Reinforced with Talc and Fiberglass. Key Eng. Mater. 2011, 471–472, 999–1004. [Google Scholar] [CrossRef]
  26. Krishnaswamy, K.T. Measurement of internal strains in concrete. Matér. Constr. 1968, 1, 361–364. [Google Scholar] [CrossRef]
  27. Popovics, S. Strength and Related Properties of Concrete: A Quantitative Approach; Wiley: Hoboken, NJ, USA, 1998. [Google Scholar]
  28. Merzbacher, C.I.; Kersey, A.D.; Friebele, E.J. Fiber optic sensors in concrete structures: A review. Smart Mater. Struct. 1996, 5, 196–208. [Google Scholar] [CrossRef]
  29. Khan, A.S.; Wang, X. Strain Measurements and Stress Analysis; Prentice Hall: Upper Saddle River, NJ, USA, 2001. [Google Scholar]
  30. Saliba, J.; Loukili, A.; Regoin, J.P.; Grégoire, D.; Verdon, L.; Pijaudier-Cabot, G. Experimental analysis of crack evolution in concrete by the acoustic emission technique. Frat. Integr. Strutt. 2015, 9, 300–308. [Google Scholar] [CrossRef]
  31. Cheng, C.C.; Cheng, T.M.; Chiang, C.H. Defect detection of concrete structures using both infrared thermography and elastic waves. Autom. Constr. 2008, 18, 87–92. [Google Scholar] [CrossRef]
  32. Fayyad, T.M.; Lees, J.M. Application of Digital Image Correlation to reinforced concrete fracture. Proc. Mat. Sci. 2014, 3, 1585–1590. [Google Scholar] [CrossRef] [Green Version]
  33. Khoo, S.W.; Karuppanan, S.; Tan, C.S. A review of surface deformation and strain measurement using two-dimensional digital image correlation. Metrol. Meas. Syst. 2016, 23, 461–480. [Google Scholar] [CrossRef]
  34. Lecompte, D.; Vantomme, J.; Sol, H. Crack detection in a concrete beam using two different camera techniques. Struct. Health Monit. 2006, 5, 59–68. [Google Scholar] [CrossRef]
  35. Dally, J.W.; Riley, W.F. Experimental Stress Analysis; McGraw-Hill: New York, NY, USA, 1978. [Google Scholar]
  36. Tokgoz, D.D.G.; Ozerkan, N.G.; Kowita, O.S.; Antony, S.J. Strength and Durability of Composite Concretes with Municipal Wastes. ACI Mater. J. 2016, 113, 669–678. [Google Scholar] [CrossRef] [Green Version]
  37. Antony, S.J.; Okeke, G.; Tokgoz, D.D.; Ozerkan, N.G. Photonics and fracture toughness of heterogeneous composite materials. Sci. Rep. 2017, 7, 4539. [Google Scholar] [CrossRef] [PubMed] [Green Version]
  38. Caputo, F.; Giudice, G. Photoelastic coating method approach to the study of stress distribution in composite materials. Fibre Sci. Technol. 1983, 18, 255–264. [Google Scholar] [CrossRef]
  39. Ramesh, K. Digital Photoelasticity; Springer: Berlin/Heidelberg, Germany, 2000. [Google Scholar]
  40. ASTMC39/C39M-14a. Standard Test Method for Compressive Strength of Cylindrical Concrete Specimens. In ASTM International; ASTM: West Conshohocken, PA, USA, 2014.
  41. ASTMC78M-10. Standard Test Method for Flexural Strength of Concrete (Using Simple Beam with Third-Point Loading). In ASTM International; ASTM: West Conshohocken, PA, USA, 2010.
  42. Antony, S.J. Imaging shear stress distribution and evaluating the stress concentration factor of the human eye. Sci. Rep. 2015, 5. [Google Scholar] [CrossRef] [Green Version]
  43. Lesniak, J.R.; Zickel, M.J.; Welch, C.S.; Johnson, D.F. An innovative polariscope for photoelastic stress analysis. In Proceedings of the SEM Spring Conference on Experimental Mechanics, Bellevue, WA, USA, 2–4 June 1997; pp. 219–224. [Google Scholar]
  44. Freddi, A.; Olmi, G.; Cristofolini, L. Experimental Stress Analysis for Materials and Structures; Springer International: Cham, Switzerland, 2015. [Google Scholar]
  45. Timoshenko, S.P.; Goodier, J.N. Theory of Elasticity, 3rd ed.; McGraw-Hill: New York, NY, USA, 1970. [Google Scholar]
  46. Batayneh, M.; Marie, I.; Asi, I. Use of selected waste materials in concrete mixes. Waste Manag. 2007, 27, 1870–1876. [Google Scholar] [CrossRef]
  47. Akçaözoǧlu, S.; Atiş, C.D.; Akçaözoǧlu, K. An investigation on the use of shredded waste PET bottles as aggregate in lightweight concrete. Waste Manag. 2010, 30, 285–290. [Google Scholar] [CrossRef]
  48. Karihaloo, B.L.; Nallathambi, P. Fracture toughness of plain concrete from three-point bend specimens. Mater. Struct. 1989, 22, 185–193. [Google Scholar] [CrossRef]
  49. Shah, S.; Carpinteri, A. Fracture Mechanics Test Methods for Concrete, 1st ed.; Taylor & Francis: Cambridge, UK, 1991. [Google Scholar]
Figure 1. (a) Distribution of contents of municipal solid wastes (normalised to a maximum fraction of 1). (b) The types of plastic wastes (presented in percentages of the available total plastic wastes) in Qatar [24,25].
Sustainability 13 00848 g001
Figure 2. Typical virgin and recycled polyethylene samples derived from municipal wastes (v-virgin; r-recycled).
Sustainability 13 00848 g002
Figure 3. Particle shape and size of polyethyline (PE) aggregates used in this study and their surface texture (a) virgin low-density polyethylene (v-LDPE), (b) virgin high-density polyethylene (v-HDPE), (c) recycled LDPE, and (d) recycled HDPE.
Sustainability 13 00848 g003
Figure 4. Schematic diagram of the notched prism sample.
Sustainability 13 00848 g004
Figure 5. Schematic diagram showing PSA experimental setup (notched beam).
Sustainability 13 00848 g005
Figure 6. Standard ASTM C78 three-point bend tests conducted on the specimens using a 500 kN Instron compression machine.
Sustainability 13 00848 g006
Figure 7. Coated samples: (a) cylinders and (b) prism specimens.
Sustainability 13 00848 g007
Figure 8. Illustration of the scan lines (equally spaced) considered on the samples of prism and cylinder for stress analysis.
Sustainability 13 00848 g008
Figure 9. Compressive strength of the concrete samples.
Sustainability 13 00848 g009
Figure 10. Distribution of maximum shear stress on the prisms of the 28-day samples under different load levels.
Sustainability 13 00848 g010
Figure 11. Distribution of maximum shear stress on the prisms of the 90-day samples under different load levels.
Sustainability 13 00848 g011
Figure 12. Distribution of maximum shear stress on the cylinders of the 28-day samples under different load levels.
Sustainability 13 00848 g012
Figure 13. Distribution of maximum shear stress on the cylinders of the 90-day samples under different load levels.
Sustainability 13 00848 g013
Figure 14. Shear stress concentration factor for unnotched prisms at 28 days. (ag) pertain to Mixes 1–7, respectively. The vertical axes present the shear stress concentration factor. Loads 1–3 correspond to 0.25, 0.5, and 1 times the ultimate load Pu, respectively.
Sustainability 13 00848 g014
Figure 15. Shear stress concentration factor for unnotched prisms at 90 days. (ag) pertain to Mixes 1–7, respectively. The vertical axes present the shear stress concentration factor. Loads 1–3 correspond to 0.25, 0.5, and 1 times the ultimate load Pu, respectively.
Sustainability 13 00848 g015
Figure 16. Shear Stress concentration factor for the cylinders at 28 days. (ag) pertain to Mixes 1–7, respectively. Loads 1–3 correspond to 0.25, 0.5, and 1 times the ultimate load Pu, respectively.
Sustainability 13 00848 g016
Figure 17. Maximum shear stress distribution on the notched beam samples under different loading levels P, presented for the mid-one-third region of the beams subjected to 28 days curing for comparison purposes. The arrows show the direction of the major principal stress.
Sustainability 13 00848 g017
Figure 18. Shear stress concentration factor for the notched prisms at 28 days. (ag) pertain to Mixes 1–7, respectively. Loads 1–3 correspond to 0.25, 0.5, and 1 times the ultimate load Pu respectively.
Sustainability 13 00848 g018
Figure 19. Flexural strength, maximum shear stress concentration factor, and fracture toughness evaluated conventionally and using PSA-Technology (PSAT) ( K I c e and K I c e P S A T respectively) for the concrete specimens: (a) 28-day samples and (b) 90-day samples.
Sustainability 13 00848 g019
Table 1. Properties of polyethylene aggregates.
Polyethylene Type
v-LDPEv-HDPEr-LDPEr-HDPE
Density (g/cm3)0.9170.9260.8990.919
Load at Maximum Load (N) 27.4533.1233.2074.34
Tensile Strength (MPa)1212.612.525.22
Elastic Modulus (MPa) 206414293672
% Total Elongation at Fracture382136348152
Table 2. Mix ID and the composition of the concrete samples.
Mix IDConstituents
1PM 1
2PM 1, MSF 2
3PM 1, Hybrid fibre 3
4PM1, MSF 2, v-LDPE 4 granule
5PM1, MSF 2, v-HDPE 4 granule
6PM1, MSF 2, r-LDPE 4 granule
7PM1, MSF 2, r-HDPE 4 granule
1 PM (Pozzolanic materials) = 10% Fly ash and 10% Silica fume (by weight of total binder). 2 MSF (micro-steel fibre of length 6 mm and diameter 160 µm) = 2% by weight. 3 Hybrid fibre = 1% micro-steel fibre and 1% r-HDPE fibre. 4 PE granule = 10% by weight of coarse aggregate.
Table 3. Fracture toughness of the 90-day samples (notched prisms).
Mix ID K I c e ( M P a   m 1 2 ) K I c e P S A T ( M P a   m 1 2 )
10.84 ± 0.070.84 ± 0.00
20.98 ± 0.010.99 ± 0.03
30.59 ± 0.070.53 ± 0.15
40.51 ± 0.020.38 ± 0.02
50.76 ± 0.070.73 ± 0.10
60.56 ± 0.040.48 ± 0.06
70.84 ± 0.040.75 ± 0.02
Publisher’s Note: MDPI stays neutral with regard to jurisdictional claims in published maps and institutional affiliations.

