Article

Removal of Pharmaceuticals from Water by Tomato Waste as Novel Promising Biosorbent: Equilibrium, Kinetics, and Thermodynamics

1
Faculty of Chemical Engineering and Technology, University of Zagreb, Marulićev trg 20, 10000 Zagreb, Croatia
2
Faculty of Mechanical Engineering and Naval Architecture, University of Zagreb, Ivana Lučića 5, 10000 Zagreb, Croatia
*
Author to whom correspondence should be addressed.
Sustainability 2021, 13(21), 11560; https://0-doi-org.brum.beds.ac.uk/10.3390/su132111560
Submission received: 18 September 2021 / Revised: 12 October 2021 / Accepted: 16 October 2021 / Published: 20 October 2021

Abstract

:
Tomato waste was studied as a low-cost biosorbent for the removal of five pharmaceuticals (dexamethasone, febantel, procaine, praziquantel, and tylosin) from water. Tomato waste was characterized chemically and microstructurally before and after simulated sorption. Sorption performance was interpreted as a function of the initial pharmaceuticals concentration, temperature, and physicochemical properties of the tomato waste. The linear, Freundlich, and Dubinin–Radushkevich (D-R) isotherms were used to describe the experimental results at different temperatures (298, 303, and 308 K). Thermodynamic parameters such as standard free energy (ΔG°), enthalpy change (ΔH°), and entropy change (ΔS°) were determined. Negative values of ΔG° in the temperature range of 298–308 K strongly indicate the spontaneous nature of the biosorption process. In addition, the values of ΔH° for the biosorption of dexamethasone, procaine, praziquantel, and tylosin on tomato waste were negative, indicating exothermic processes, while the positive value for febantel indicated an endothermic process. The kinetic data were analyzed using (i) kinetic models to determine the kinetic parameters (Lagergren’s pseudo-first order and Ho’s pseudo-second order) and (ii) adsorption–diffusion models to the describe transport mechanisms of pharmaceuticals from aqueous solution onto tomato waste as adsorbent (Weber–Morris intraparticle diffusion and Boyd film diffusion models).

Graphical Abstract

1. Introduction

In recent years, increasing attention has been paid to the entry, presence, and potential effects of pharmaceuticals in the environment. The amount of pharmacologically active substances used to treat and prevent diseases and to alleviate the stresses associated with modern life can be measured in thousands of tons per year [1]. Pharmaceuticals and their metabolites are widely distributed in surface waters from sewage treatment plant effluents [2]. Much research is currently being conducted to explore suitable methods for the elimination of pharmaceuticals from surface waters. Unfortunately, due to the physicochemical properties of these effluents, it is easy for them to pass through all natural filtration stages and reach groundwaters and drinking waters [3].
The adsorption process has emerged as a most promising option for the removal of non-biodegradable organic compounds from aqueous streams, with activated carbons being the most common adsorbent due to its effectiveness and versatility. However, activated carbon is not particularly advantageous for sorption due to its high cost. This motivated the search for cheap and efficient alternatives, where bagasse marrow, carbonized bark, peat, soil, eucalyptus bark, chitin, rice husks, wood, fly ash, and carbonized sewage sludge were investigated for the removal of organic compounds from aqueous streams [4]. From the pool of organic compounds, the majority of studies to date have focused on the removal of dyes [5,6,7], phenols [8,9], and pesticides [10], while a limited number of studies have investigated low-cost adsorbents for the removal of pharmaceuticals from aqueous systems, mainly anti-inflammatories and antibiotics [11].
Agricultural waste is a raw material that has attracted considerable attention as a candidate for water pollution control due to its low cost and availability. Large amounts of waste generated by the food industry pollute the environment. However, many of these residues can be recycled elsewhere [12], which is the main advantage of agro-waste sorbents. While a number of products have been tested for their ability to remove metal ions, such as cassava waste [13], coconut coir [14], fluted pumpkin [15], peanut skin [16], mango [17], banana peel [18,19], and peat moss [20], reports on the sorption of organics from wastewater are sparse. The potential biosorbent activity for dyes [21] and heavy metals [19] has been documented for several agricultural peels (potato, banana, grapefruit, and cucumber peels). It is important to note that plant leaves have been shown to be excellent, environmentally friendly, and cost-effective biosorbents in the removal of heavy metals, dyes, cations, and other chemical species from aqueous solutions [22].
Tomato (Lycopersicon esculentum L.) is a tasty vegetable grown in almost all parts of the world, with an annual production of 100 million tons in 144 countries [23]. Tomato processing produces very little by-product, 1% of peel and 2% of the seeds, but these materials are still considered as waste due to lack of commercial use. Tomato peel is mainly composed of carbohydrates, with an average value of 80% of the total dietary fiber [12]. Tomato seeds contain 22.2–29.6% crude fat, 15.5–21% crude fiber, 5.4–9.6% ash, and 22.9–33.9% crude protein [24]. All these compounds are rich in functional groups such as carboxyl and hydroxyl groups and therefore should have the ability to bind strongly to ionic species from aqueous solutions [25,26,27]. Mango peels were found to be a good adsorbent for the removal of toxic metals and organic substances from industrial wastewater [17], as well as banana peels [18,19], lemon peels [5], and tangerine peels [28,29]. In the case of tomato seeds and peels, there are few published data to date. All previous reports on their use as biosorbents refer to the sorption of heavy metals, which is also true for tomato leaves, for which there is evidence of good properties in the removal of Ni2+ ions from aqueous samples [30]. The only application of tomato waste as a biosorbent for the sorption of ciprofloxacin, a pharmaceutical belonging to the fluoroquinolones group, was published in our previous work [29]. This work is evidence that tomato waste has the potential to be used as a biosorbent for the removal of pharmaceuticals from water, and it was therefore chosen to extend the story to other pharmaceuticals.
In the present research, ground tomato peels and seeds from the domestic production of tomato sauce and juice were investigated for the first time as sorbents for selected model pharmaceuticals to evaluate the ability of tomato waste to remove pharmaceuticals from wastewater. Several adsorption isotherms were used to describe the experimental results as a function of drug concentrations and temperature. The thermodynamic and kinetic parameters of the adsorption of pharmaceuticals on tomato waste were determined and discussed. This information will contribute to the sorption database and help to protect natural waters in a more economical way.

2. Materials and Methods

2.1. Pharmaceutical Standards and Reagents

The pharmaceuticals studied were praziquantel (PRAZ), febantel (FEBA), procaine (PROC), dexamethasone (DEXA), and tylosin tartrate (TYL) (Table 1). The selected pharmaceuticals belong to different therapeutical classes: antibiotics (TYL), antihelmintics (PRAZ and FEBA), anestetic (PROC), and glucocorticoids (DEXA). These compounds were selected on the basis of their vast production and consumption worldwide, especially in veterinary practices.
High-purity (>99%) analytical standards of pharmaceuticals were obtained from the Veterina Animal Health Ltd. (Genera d.d., Croatia). Kemika (Zagreb, Croatia) supplied all chemicals used. Stock solutions of each pharmaceutical (75.0 mg/L) were prepared by dissolving exact amounts of the powdered standard separately in the appropriate solvent: deionized water for PROC and TYL and 12%, 20%, or 32% of acetonitrile in deionized water for DEXA, PRAZ, and FEBA. All solutions were stored protected from light at 4 °C. Working standard solutions were prepared from stock solutions by serial dilution.

2.2. Preparation and Characterization of Tomato Waste as Biosorbent

Tomato waste, TW (peel and seeds), was selected because it is one of the main crops in Croatia. Tomato was obtained from the local market in Zagreb, Croatia and TW was obtained from the domestic production of tomato sauce and juice. The collected TW were washed several times with water to remove dirt particles and water-soluble substances. Once in the laboratory, the samples were dried and crushed in an oven at 105 °C. Finally, this tomato sorbent was stored in glass bottles wrapped in foil to protect it from light.
Grounded TW was characterized, and Table 2 shows the experimentally determined physicochemical properties based on the procedure presented in the previous paper [33].
In addition, the as-prepared dry TW biosorbent was characterized by FTIR, SEM, and EDS analyses and by determining the pore size distribution and particle size distribution. A spectrometer (Vertex 70, Bruker, Karlruhe, Germany) in attenuated total reflectance (ATR) mode was used to obtain FTIR absorbance spectra in the 375–4000 cm−1 range, with a spectral resolution of 1 cm−1 as an average of 64 scans. Scanning electron microscope (SEM, Vega III Easyprobe, Tescan, Brno, Czechia) operating at 10 kV accelerating voltage was used to obtain micrographs, and the energy-dispersive spectroscopy (EDS) detector (XFlash 4010-M, Bruker, Karlsruhe, Germany) enabled a semi-quantitative elemental analysis of the samples (no standardization was used, and the Tescan software output was taken as given). Prior to examination, samples were sputter-coated with gold and palladium.
Surface area and pore volumes were determined from Brunauer–Emmett–Teller (BET) nitrogen adsorption–desorption isotherm, as measured by ASAP 2000 (Micromeritics, Norcross, GA, USA), using the Barret–Joyner–Halenda (BJH) model to estimate the pore size distribution. Particle size distribution (PSD) was determined in dry mode (with a pressure of 0.4 MPa) applying the laser diffraction method (SALD 3101, Shimadzu, Kyoto, Japan). Diffraction measurements were performed five times under identical process conditions. Averaged PSD is expressed on the basis of volume, with characteristic diameters d50, dmode, and diameter mean, d3,2, and reported via differential distribution function, dQ3(d).

2.3. Batch Adsorption Experiments

Each experiment was performed three times. The experiments were performed using a laboratory shaker (Innova 4080 Incubator Shaker, New Brunswick Scientific, USA) that ensured constant contact with the TW, and the solution containing one of the five selected pharmaceuticals. To avoid the photodegradation of selected pharmaceuticals, the experiments were performed in the dark, which was ensured by covering the shaker with a lightproof cloth.
The sorption capacity of the biosorbent was determined by contacting 1.0 g of TW with 10.0 mL of selected pharmaceutical solution of known concentration (5.0–75.0 mg L−1) in a 50 mL laboratory beaker. The stirring period of the mixture was 24 h at room temperature (25 °C), which was followed by centrifugation of the suspension at 5000 rpm for 10 min. Before analysis, the centrifugate was filtrated through 0.45 μm syringe filters.
Blank samples containing the same amount of TW in contact with 10 mL of deionized water at 25 °C were also included in the analysis. This served as a safety check during analysis to detect interfering compounds.
The effect of process temperature was also investigated. For this purpose, all experiments were repeated at two temperatures, 30 and 35 °C, with the entire procedure identical as described above. The studied pharmaceuticals (DEXA, FEBA, PROC, PRAZ, and TYL) in the filtrate samples obtained after the sorption studies were analyzed by HPLC-DAD according to the method previously described [33].

2.4. Adsorption Analysis and Calculations

The adsorption capacity of the studied investigated pharmaceuticals at equilibrium, qe (μg g−1), was determined from the following equation:
q e = ( C 0 C e ) m × V
where qe is the equilibrium sorption capacity in μg g−1; C0 and Ce are the initial and equilibrium concentrations of pharmaceuticals in μg mL−1, V is the volume of pharmaceutical solution in mL, and m is the total mass of TW in grams.
Different equations for the sorption isotherm were used to interpret the equilibrium characteristics of adsorption, and three isotherms (Table 3) were selected for this study: the linear [34], the classical Freundlich model [35], and Dubinin–Radushkevich (D-R) [36].
KD is the linear sorption constant and is defined as the ratio between the equilibrium concentration of a compound in the adsorbent and in solution.
The Freundlich isotherm is two parameters isotherm [35] whose empirical model can be applied to nonideal sorption on heterogeneous surfaces as well as multilayer sorption. KF is a constant indicative of the relative adsorption capacity of the adsorbent ((μg g−1)(mL μg−1)1/n), and n describes the isotherm curvature and gives an estimate of the adsorptive intensity. The Freundlich constants KF and n can be calculated from the intercept and slope of the linear plot of log qe versus log Ce.
The Dubinin–Radushkevich (D-R) isotherm as the two-parameter model was used to estimate the apparent free energy of sorption as well as differentiate between the physical and chemical sorption process [36], where qmax is the theoretical saturation capacity (μg g−1), β is the constant of the adsorption energy (mol2/kJ2), and ε is the Polanyi potential, which is described as:
ε = R T l n ( 1 + 1 C e ) .

2.5. Sorption Kinetics

To determine the controlling mechanism of adsorption of pharmaceuticals by TW, the kinetic data of adsorption were analyzed using Lagergren’s first-order, Ho’s pseudo-second-order, Weber–Morris intraparticle diffusion, and Boyd rate equations. In general, adsorption kinetics depend on the interactions between adsorbate and adsorbent and experimental conditions. The linear form of the Lagergren model pseudo-first order is described by the following equation [37]:
ln ( q e q t ) = ln q e k 1 t
where qe and qt are the amounts of pharmaceutical (μg g−1) adsorbed on TW (adsorbent) at equilibrium and at time t, respectively; k1 (min−1) is the rate constant of the pseudo-first order adsorption.
The linear form of Ho’s pseudo-second order equation is represented as [38]:
t q t = 1 k 2 q e 2 + t q e
where qe and qt are the amounts of pharmaceutical (μg g−1) adsorbed on TW (adsorbent) at equilibrium and at time t, respectively; k2 is the rate constant of the pseudo-second order sorption (g μg−1 min−1).
The initial adsorption rate, h, (μg g−1 min−1) is expressed as [39]:
h = k 2   q e 2 .
Lagergren’s first-order and Ho’s pseudo-second order kinetic models could not define the sorption mechanism as well as the rate-controlling steps of the sorption process. Therefore, Weber–Morris intraparticle diffusion [40] and Boyd [41] rate models were also used. The intraparticle diffusion equation is expressed as [41]:
q t = k p i t + C i
where kpi (μg g−1 min−1/2), the intraparticle diffusion rate parameter of stage i, is obtained from the slope of the straight line of qt versus t1/2. Ci, the intercept of stage i, gives an indication of the thickness of the boundary layer; i.e., the larger the intercept, the larger the boundary layer effect.

3. Results

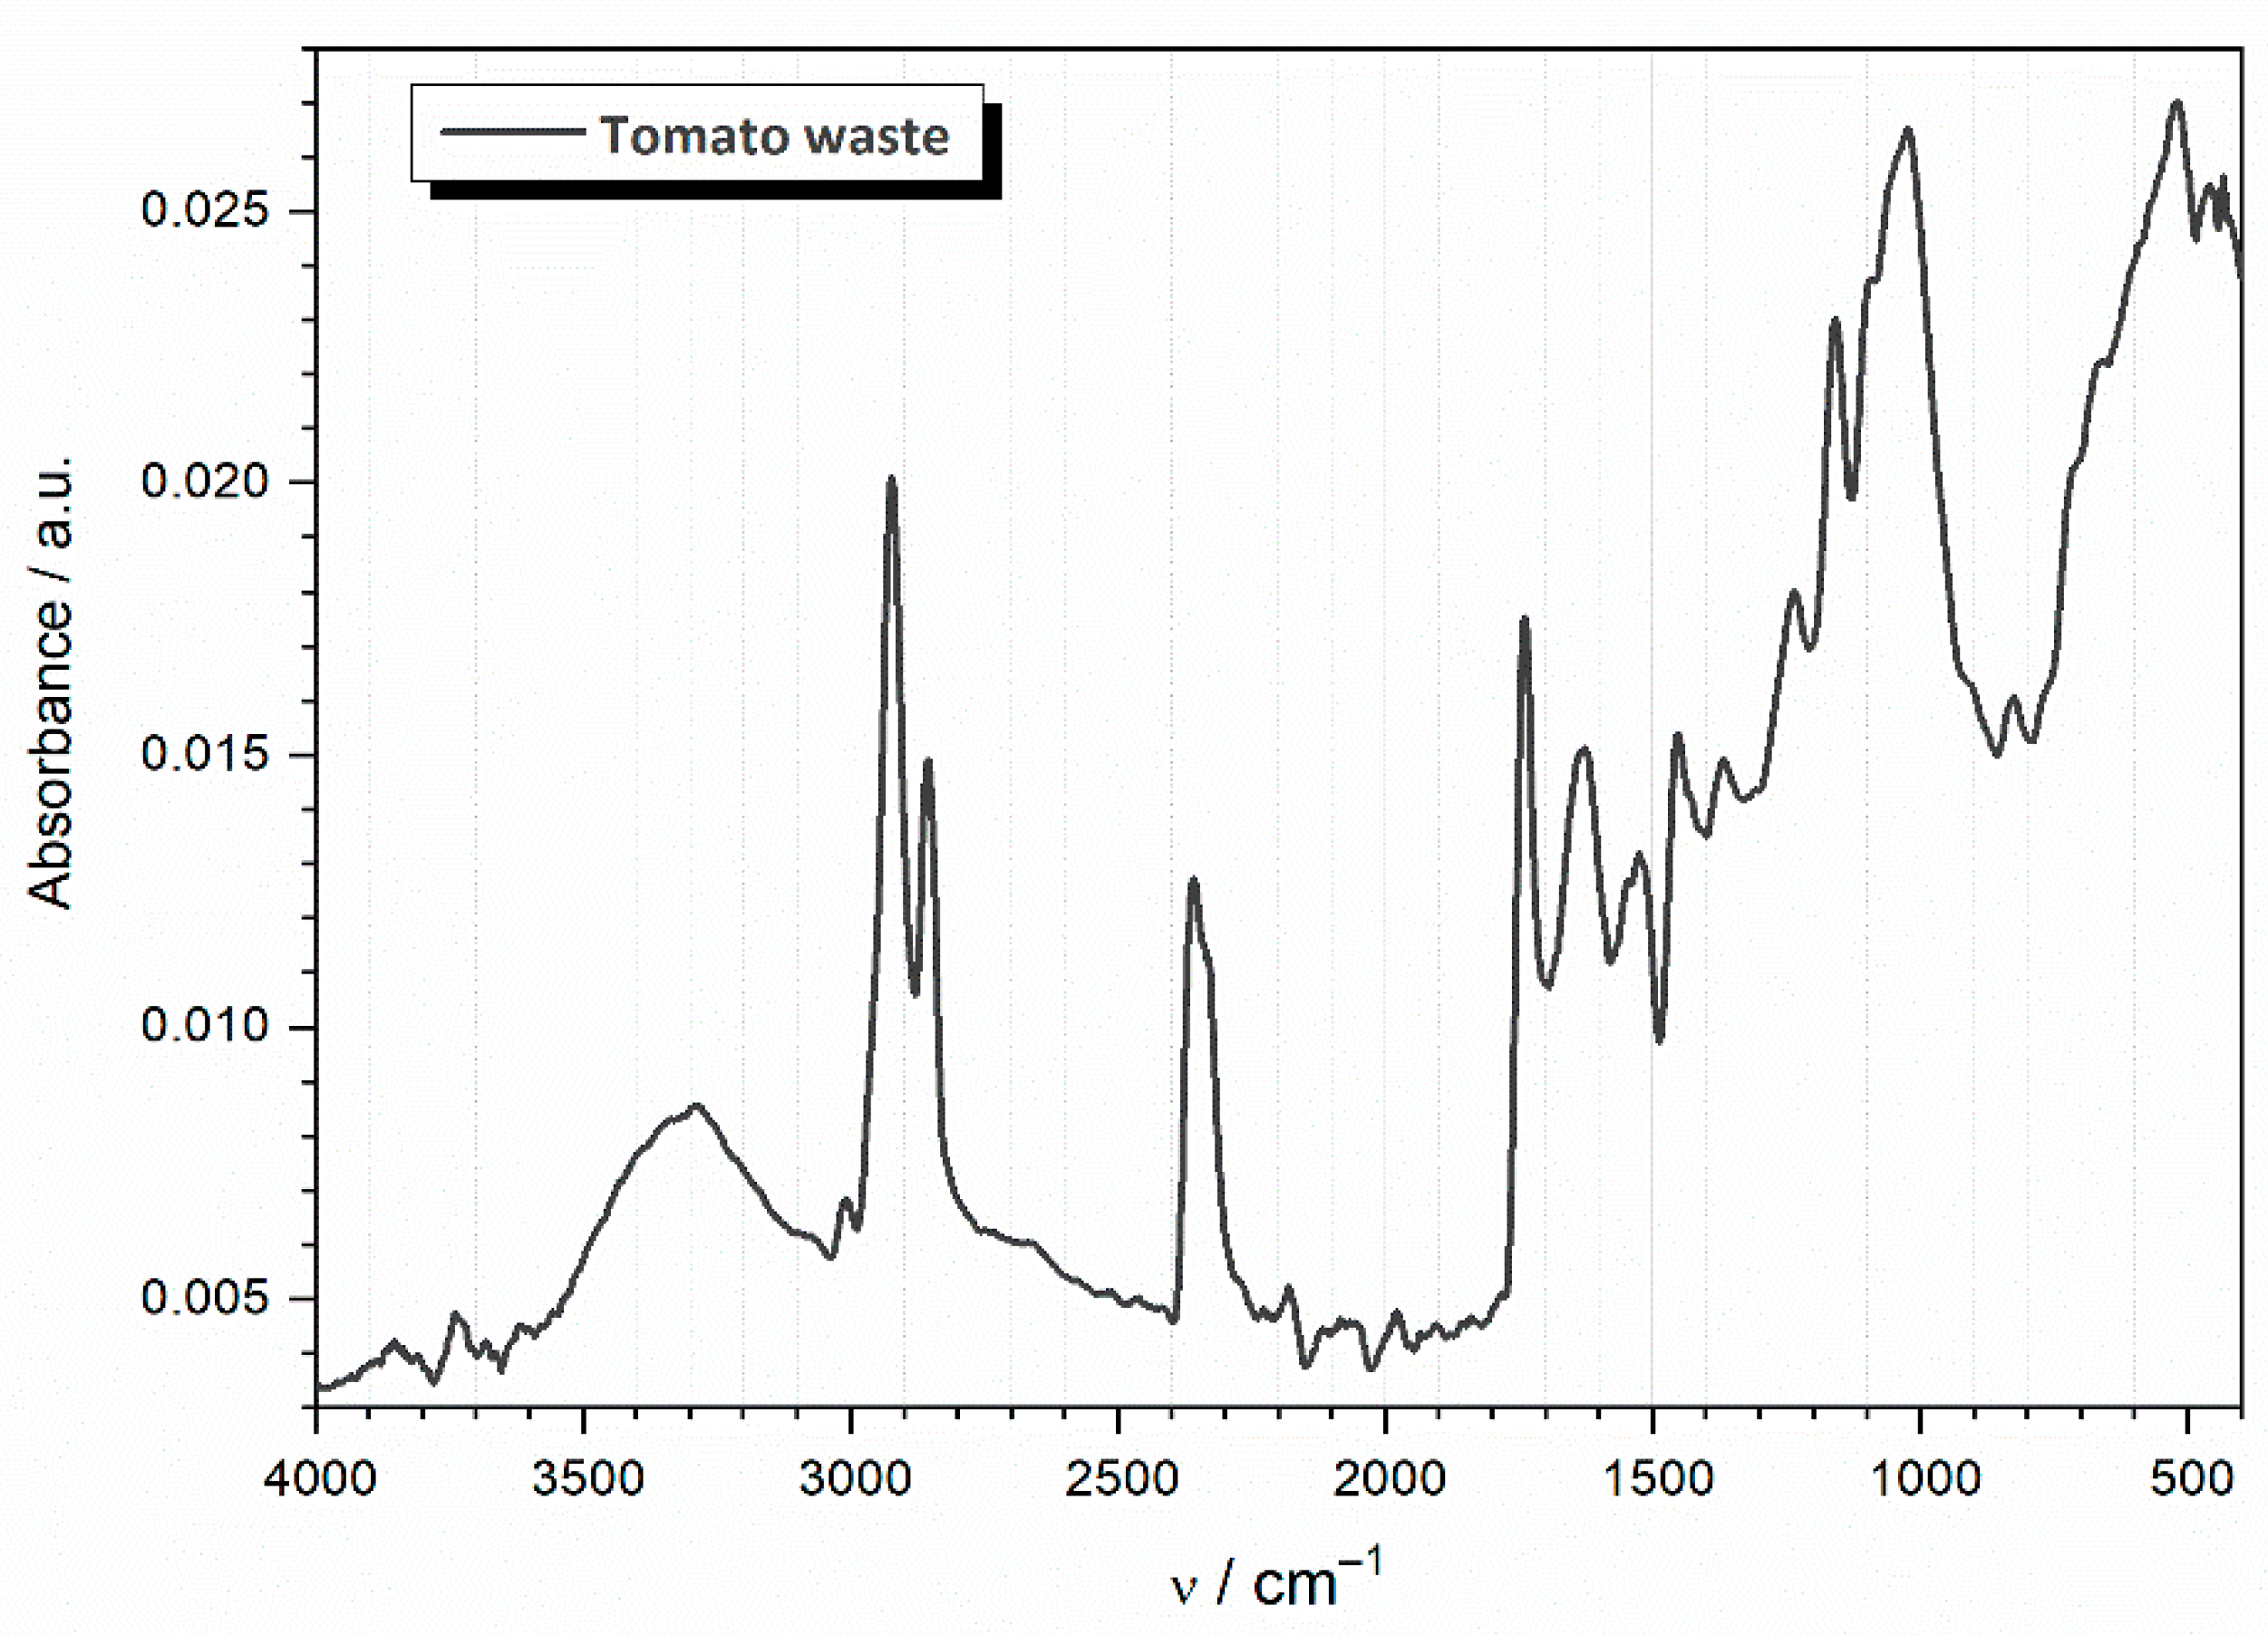
3.1. Characterization of the TW Biosorbent

Dried TW represents a complex chemical environment, which was confirmed by the obtained FTIR spectrum (Figure 1).
The main features were assigned as follows [42,43,44]. In the higher frequency range, a broad band appears, extending from 3600 to 3000 cm−1, which is due to the O–H stretching, indicating a water residue as well as the –OH group in carbohydrates. Bands at 2920 and 2850 cm−1 occur as results of C–H stretching, i.e., asymmetric and symmetric CH2 and CH3 stretching in alkanes (aliphatic methyl and methylene groups). The bands observed in the range between 2360 and 2340 cm−1 are due to C≡N stretching in nitriles.
In the lower frequency range, a strong band was observed at 1740 cm−1 attributed to carbonyl –C=O stretching in lipid molecules. Amide-related bands were a consequence of C=O and N–H stretching and vibration in the range 1660–1610 cm−1 and 1560–1510 cm−1, respectively. Moreover, these bands may overlap with the alkene band of –C=C– stretching at 1650 cm−1 and aromatic C=C ring stretch at 1530 and 1460 cm−1. Additional alkane bands were observed due to the C–H stretching at 1460 cm−1.
The OH bending band was seen at 1380 cm−1, while C–O stretching and C–C stretching occurred at 1160 and 1100 cm−1, respectively. A phosphate related band was observed at about 1240 cm−1 and overlaps with the CH=CH stretching band.
Another carbohydrate related band was observed due to O–H stretching at 1035 cm−1. In addition, weak O–H stretching bands associated with carboxylic acid or ester are observed between 900 and 800 cm−1.
The observed spectrum is consistent with the characteristic components (lipid, phosphate, sugar, water, amide, etc.), i.e., with the chemical composition of the TW biosorbent.
TW was further characterized by nitrogen adsorption–desorption porosimetry. Parameters such as the pore size distribution, average pore diameter, and specific surface area were investigated to describe the morphology and correlate with the efficiency of TW as a biosorbent for pharmaceuticals. From Figure 2A, it can be seen that the potential adsorbent has a wide distribution of pore sizes (2–120 nm), with the highest pore radii centered in the low range.
This polydispersity of pore sizes was also evident from the low values of average pore diameter (d = 3.2 nm) and specific surface area (SSA = 2.59 m2 g−1). It is well known that the capacity of the sorbent strongly depends on the particle size and thus on the specific surface area [45,46]. Studies on the adsorption of lead and copper on KOH-activated wastewater sludge [47] showed that even materials with moderate specific surface area values can be efficient in removing heavy metal contaminants. Although this research focuses on pharmaceuticals and not heavy metals, this fact certainly justifies the investigation of TW for application as a biosorbent.
The sorbent studied can be considered as a mesoporous material according to the IUPAC classification (2 nm < d < 50 nm) [48]. It is well documented that the transfer channels composed of mesopores contribute significantly to the sorption efficiency of various ions and sorbate molecules.
Figure 2B shows the experimental particle size distribution for the adsorbent particulate system studied. The particle size distribution (PSD) of the adsorbent shows a very heterogeneous behavior.
From SEM images at low magnification (not shown), it could be seen that the tomato-based adsorbent has a wide particle size distribution. Particles as large as 425 μm and those smaller than 10 μm were observed, which correlates well with the distribution range from the PSD data (Figure 2B). The fact that the largest particles were not observed is due to the small size of the sample holder and sampling bias (smaller particles adhere to the sample holder more easily). Therefore, the SEM observation was not fully representative of the TW sample, and it was intended to give an overview on the particle shapes and surface morphology rather than the true particle size distribution. It should also be noted that the microscopy and laser diffraction methods rely on a very different measurement methodology and intrinsic parameters for detecting size distributions. The particle shape and morphology of TW is very diverse and mostly irregular, although some larger particles have a regular structure, which is probably due to the cell walls of tomato (Figure 3). The presence of large asymmetric pores on the surface in the range of 10–40 μm is visible, which may provide high internal surface area and rough structure on the surface of TW, which is favorable for the biosorption of pharmaceuticals from aqueous solution. Smaller pores as detected by N2 adsorption–desorption could not be resolved by the device. EDS analysis of the powder revealed the presence of potassium (1.1%) in addition to carbon and oxygen.
The pharmaceuticals TYL and PROC are amphoteric compounds with two relevant ionizable groups, while no pKa constants are available for the other pharmaceuticals studied. Due to the pH of TW and the fact that neutral species dominate between pKa1 and pKa2, the mentioned compounds are mostly present as neutral molecules (see pKa2 in Table 1) and not in ionized form; thus, the “salting out” effect of the tomato surface is also possible [49]. While neutral molecules adsorb to solid surfaces via the relatively weak van der Waals and electron donor–acceptor interactions, charged molecules can adsorb via stronger electrostatic mechanisms [50]. The cation exchange capacity supports the use of TW, since said sorbent has a higher cation exchange capacity than other natural sorbents like soil [51].
Overall, based on the determined physicochemical properties, the prepared TW is a suitable candidate for a cost-effective sorbent for the removal of pollutants from wastewaters.

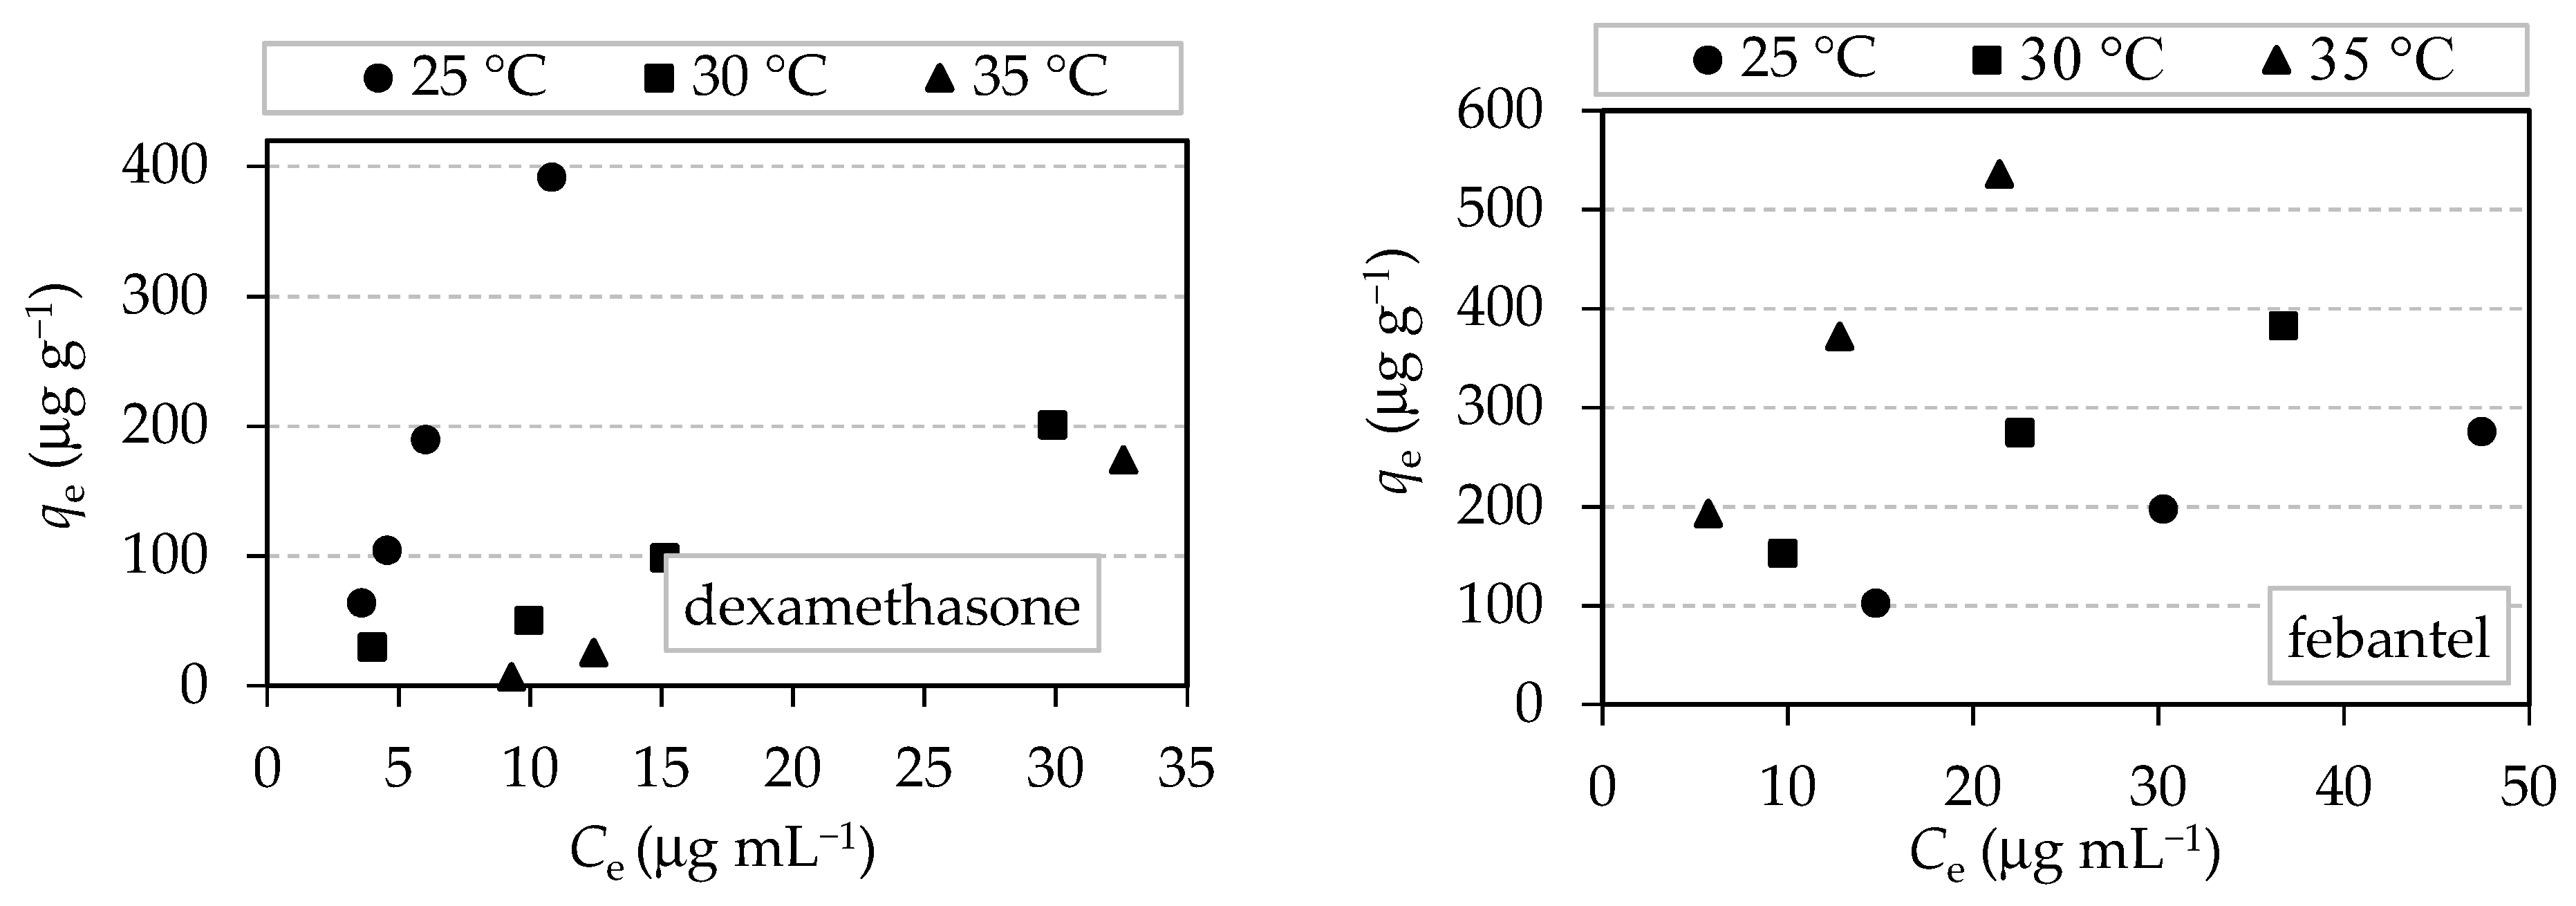
3.2. Biosorption Isotherm

In order to determine a potential sorption capacity of TW for five different pharmaceuticals and thus to investigate its suitability for the removal of these pharmaceuticals from the wastewater of the pharmaceutical industry, we chose slightly higher concentrations of pharmaceuticals than can occur in the environment. The possible sorption of the studied pharmaceuticals on the surface of the test vessels as well as their stability in solution were evaluated. For this purpose, control samples with higher concentrations (50.0 μg mL−1) of all pharmaceuticals in water were used and analyzed by HPLC-DAD. The results showed that all the studied pharmaceuticals were stable in the medium during the studied time (24 h), and no sorption occurred on the vessels. Interferences were not observed on the chromatograms of the TW matrix, confirming the appropriate selectivity of the method. The selected concentration range (5.0–75.0 mgL−1) is consistent with the literature [7,10], although many authors use a much higher concentration range to determine the sorption coefficients (5.0–500 mgL−1) [7] depending on the available instrumentation for the analysis of the remaining pharmaceuticals after sorption. The sorption correlation with concentration is the same regardless of the concentration range, although unrealistically high concentrations should be avoided.
The characteristic chromatograms of the blank TW samples in water and 50.0 μg mL−1, solutions of DEXA in water are shown in Figure 4. From Figure 4, it can be seen that DEXA is not present in the chromatographic curve, which confirms that TW does not contain DEXA. Similarly, TW does not contain any other pharmaceuticals studied.
The amounts of the studied pharmaceuticals adsorbed on TW as a function of equilibrium concentration and temperature (25, 30, and 35 °C) are shown in Figure 5. The data show that the uptake increases with increasing initial concentration of the pharmaceutical with the increase in temperature for FEBA and TYL, while it decreases with the decrease in the temperature for DEXA, PRAZ, and PROC.
Linear, Freundlich, and Dubinin–Radushkevich parameters, obtained by linear fitting, are shown in Table 4. The relative standard deviations obtained were less than 10% based on three replicates.
Similar values of correlation coefficients were obtained for all mentioned models. For some pharmaceuticals, the highest values of correlation coefficients were calculated for the linear model, while for some of them, the highest R2 value was obtained for the D-R or Freundlich model. The high value (closer to 1) of the correlation coefficient (R2) means that the applied isotherm could fit well for the adsorption process. The low coefficient of the correlation coefficient (R2) indicates that the model is not representative of the data.
The parameters obtained from the different isotherm equations are used to obtain information about the sorption mechanisms as well as the surface properties and sorption affinities. The KD parameter from the linear sorption model is very important for estimating the potential for sorption of dissolved contaminants in contact with the sorbent used.
The Freundlich isotherm predicts no saturation of the solid surface by sorbate; KF is the relative sorption capacity. A larger value of KF indicates a higher sorption capacity [52]. From Table 4, it can be seen that the maximum KF value for PRAZ was obtained at all temperatures, which means that TW has the highest sorption potential from aqueous media to PRAZ according to the Freundlich model. The constant n is an empirical parameter related to the intensity of adsorption, which varies with the heterogeneity of the sorbent. According to Hamdaoui [7], Treybal [53], and Hao [54], values of n in the range 2–10 represent good, 1–2 represent moderately difficult, and less than 1 represent poor sorption properties. Thus, the obtained values of n for FEBA and PRAZ imply that TW has moderately difficult sorption affinity for the mentioned pharmaceuticals in water samples. The values of n for DEXA and TYL were less than 1, indicating poor adsorption properties of TW. However, at a temperature of 30 °C, n for DEXA almost reached 1, indicating that the sorption of DEXA on TW is a favorable [55] but temperature-dependent process. The values of n for PROC also changed in a similar manner; i.e., at lower temperatures, the values were less than 1, while at 35 °C, the n value increased above 1, making the sorption process on TW moderately difficult. The free energy of sorption E (0.099–0.329 kJ mol−1) calculated from the Dubinin–Radushkevich indicates the physisorption (E < 8 kJ mol−1) of the studied pharmaceuticals.

3.3. Adsorption Kinetic Studies

The kinetic parameters obtained by fitting Lagergren’s pseudo-first-order and Ho’s pseudo-second-order models to the experimental data of adsorption of pharmaceuticals on TW at different initial concentrations and temperatures are shown in Table 5.
The plots of Lagergren’s first-order model and Ho’s pseudo-secondary kinetics for the sorption of DEXA on TW are shown in Figure 6A,B, respectively.
From the results, it can be seen that the linear correlation coefficient (R2) of the first-order pseudo-model is smaller than the correlation coefficient (R2) of the second-order pseudo-kinetics for all pharmaceutical and for all initial concentrations and temperatures of the adsorption process. The high value (closer to 1) of the correlation coefficient (R2) means that the applied kinetic model could fit well for the kinetic process.
As shown in Table 5, the theoretical qe, cal values of the pseudo-second-order kinetic model were closer to the experimental qe, exp values for all pharmaceuticals for all initial concentrations and temperatures of the adsorption process. These results, together with the high correlation coefficients for the pseudo-second-order kinetic model, suggest that the sorption capacity is directly proportional to the number of available active sites on the TW and that the overall sorption processes of all studied pharmaceuticals on the TW could be controlled by a second-order model mechanism.
Intraparticle diffusion often plays a major role in porous sorbents such as TW, especially when the sample is strongly stirred during sorption. To determine the rate-controlling step for adsorption, all kinetic data were analyzed using diffusion and models (Webber–Morris’s intraparticle diffusion and Boyd film diffusion) (Figure 6C–E). The graph of Webber–Morris’s intraparticle diffusion model (Figure 6C) shows that the diffusion process is multilinear, suggesting that sorption occurs in three stages. The first sorption phase (the one with the largest slope in the graph) is the transfer of the pharmaceutical under study (DEXA) from the solution to the outer surface of TW. This stage is referred to as external diffusion (or boundary layer diffusion). The second sorption stage refers to the degree of gradual adsorption corresponding to the diffusion of pharmaceutical under study (DEXA) from the outer surface into the pores of TW. This is referred to as intraparticle diffusion or internal diffusion. The third step with the lowest slope indicates the final stage of equilibrium: this step is considered to be very fast and therefore cannot be treated as the rate-determining step.
It can be seen from Figure 6C that the rate-controlling step of pharmaceutical adsorption on TW involves complex processes, including external diffusion (film diffusion) and intraparticle diffusion. The model parameters obtained from the three steps of the plots are listed in Table 6.
Figure 6D shows a Boyd plot for the adsorption of DEXA at an initial concentration of 75.0 mg L−1 and at different temperatures. The Boyd plot (Figure 6E) is linear with a non-zero intercept. These results indicate that the rate-determining step for adsorption gradually shifts from film diffusion at the beginning of the process to intraparticle diffusion at the later stage.

3.4. Adsorption Thermodynamics

Good environmental engineering practice must consider both energy and entropy factors to evaluate the feasibility of the adsorption process and determine how spontaneous the processes are. In order to obtain thermodynamic parameters, sorption experiments were performed in the temperature range of 25–35 °C (Figure 5). The most important indicator of spontaneity is the Gibbs free energy change, ΔG°. For a spontaneous adsorption process, ΔG° has a negative value [7]. The thermodynamic parameters (ΔG°, ΔH°, ΔS°) are given by these equations:
ΔG° = −RTln KD
log K D = Δ H °   2.303   R T + Δ S ° 2.303   R
where T is the temperature in K, R is the ideal gas constant (8.314 J mol−1 K−1), and KD is the linear adsorption constant. Enthalpy (ΔH°) and entropy change (ΔS°) were determined from the slope and intercept of the plot log KD versus 1/T (figure not shown here). The calculated values of thermodynamic parameters are shown in Table 7.
All negative values of ΔG° in the range of 298–308 K confirm the favorability of the process as well as the spontaneous nature of sorption in the studied temperature range. All the studied pharmaceutical compounds adsorb preferentially on TW. The increase in ΔG° with increasing temperature suggests that lower temperatures facilitate adsorption. A negative value of ΔS° (for the sorption of DEXA, PROC, PRAZ, and TYL on TW) indicates a lower randomness at the solid/liquid interface during the sorption process and suggests that the process is controlled by enthalpy. Only for the adsorption of FEBA, the ΔS° value is positive, indicating an opposite (increased) randomness at the solid/liquid interface and a good affinity of the TW toward the FEBA. Normally, an ordered arrangement of gas molecules on a solid surface lowers the entropy when gases are sorbed. However, the same may not be true for the more complicated system of sorption from solution onto the TW.
The obtained negative value of ΔH° indicates an exothermic biosorption process for all studied pharmaceutical, except for FEBA, for which it is endothermic.
Therefore, spontaneous and exothermic sorption processes were detected for the biosorption of DEXA, PRAZ, PROC, and TYL (except for FEBA). The obtained results are in agreement with those reported for the system of nonylphenol on wastewater-irrigated soil [56], 4-chlorophenol on XAD-4 resin [57], malachite green on neem sawdust [58], methylene blue on Brazil nut shell [59], and Congo red on bulrush root [60]. This ensures that TW is a potentially good sorbent for the removal of the tested pharmaceuticals from water.

3.5. Tomato Waste Biosorption Activity and Efficiency

In this study, information on the maximum biosorption capacity of TW was obtained using the Dubinin–Radushkevich isotherm. The results show that 1.0 g of TW can sorb 449 µg of PRAZ, 461 µg of DEXA, 524 µg of FEBA, 677 µg of TYL, and 1230 µg of PROC (all at 25 °C except FEBA at 35 °C). Although the knowledge of these values would allow a discussion on the sustainability of the use of TW as biosorbent, it is very difficult to compare the results obtained for the studied drugs with some other experimental results. Indeed, to the best of our knowledge, the potential of TW as a biosorbent for organic pollutants has not been studied so far. There are a handful of studies [42,61,62] investigating the sorption potential of TW, but mostly only for heavy metals (the maximum sorption capacity of TW for Cu(II) is 22.37 mg g−1 [42]; for Pb(II), it is 152 mg g−1 [61]). The exception is the application of TW for CIPRO sorption published in our previous paper [29]. Comparing the capacity of TW after CIPRO with the capacity after the pharmaceuticals tested in this paper, TW after CIPRO proved to be a better sorbent than after the pharmaceuticals tested, which is probably related to the physicochemical properties, since it is generally known that fluoroquinolones are strongly sorbed on all sorbents tested so far [33,63,64,65]. On the other hand, if we compare the results obtained for the tested pharmaceuticals with those obtained when eggshells were used as biosorbents [33], we can see that the potential of TW is much greater than that of eggshells (for some, the capacity is ten times greater).
In practice, activated carbon is the most used sorbent material with pretty good results, but its price is quite high. So, this is one of the reasons why alternative sorbents are sought. Alternative sorbents would, on the one hand, solve the problem of waste and thus have an economic aspect. The cost of sorbent material is known to be influenced by several factors, including its availability (whether natural, as industrial/agricultural/household waste, or as a by-product of synthesized by-products), processing required, and reusability. TW is available as industrial and household waste, and its purchase price is extremely low compared to activated carbon [11,12,66]. The sorbent capacity of TW according to the tested drugs cannot be compared with that of activated carbon because no data are available in the literature. However, if we consider the data for the drugs naproxen and ketoprofen [67], we see that the sorption capacity determined on activated charcoal is extremely high (517.55 and 400.92 mg g−1, respectively) compared to the sorption capacity on TW. In addition, in the review paper [11], different types of agricultural wastes (except TW) were investigated. The potentials of the tested biosorbents for the pharmaceutical group range from 2.18 to 455.33 mg g−1, which is far higher than the capacity values determined in this paper. However, it should be noted that not all biowastes mentioned in this review were available in their raw form. In particular, some researchers have processed agricultural wastes with different activators to improve their sorption properties. For this reason, the results obtained in this paper demonstrate the potential of TW as a ubiquitous and cost-effective biosorbent for the removal of pharmaceuticals from water or organic pollutants in general. It is possible to increase the sorption capacity of the tested pharmaceuticals and organic pollutants in general by modifications to the existing TW. However, it should be borne in mind that any modification to existing TW will increase the cost of the sorbent itself.

4. Conclusions

Dried tomato waste was used as a novel sorbent candidate for the removal of selected pharmaceuticals in this case study investigation.
TW represents a complex chemical environment (consistent with the characteristic lipid, phosphate, sugar, water, amide, etc. components) as confirmed by FTIR and EDS and morphology (polydisperse porous) as confirmed by the SEM and nitrogen adsorption–desorption porosimetry. In order to determine a potential sorption capacity of TW, five different pharmaceuticals were selected at slightly higher concentrations of pharmaceuticals than can occur in the environment (50.0 μg mL−1) and analyzed by HPLC-DAD one by one. Tomato waste was chemically and microstructurally characterized before and after simulated sorption, pointing to the stability of the sorbent.
To describe the sorption experiment, we used the linear, Freundlich, and Dubinin–Radushkevich (D-R) isotherms at different temperatures (298, 303, and 308 K). Results point out the spontaneous and physical nature of the biosorption. The negative enthalpy change values for the biosorption of dexamethasone, procaine, praziquantel, and tylosin on TW indicate exothermic processes, while the positive value for febantel indicates an endothermic process.
The kinetic data were analyzed using (i) kinetic models to determine the kinetic parameters (Lagergren’s pseudo-first order and Ho’s pseudo-second order) and (ii) adsorption–diffusion models to the describe transport mechanisms of pharmaceuticals from aqueous solution onto tomato waste as adsorbent (Weber–Morris intraparticle diffusion and Boyd film diffusion models).
The kinetic data of the studied pharmaceutical sorption on the TW biosorbent were best fitted to the pseudo-second order kinetic model. The applied Weber–Morris intraparticle diffusion and Boyd film diffusion models showed that the mechanism of pharmaceutical sorption on the TW biosorbent is under the combined control of intraparticle diffusion (Weber–Morris) and film diffusion (Boyd).
This case study points out that TW must be considered as an effective biosorbent for the removal of pharmaceuticals. Still, it is necessary to continue investigating its performance with respect to potentially harmful intermediate decomposition products as well as its influence on the presence of the elements critical for aquatic systems, such as P and N.

Author Contributions

Conceptualization, D.M.P. and L.Ć.; methodology, D.M.P., V.M. and J.M.; validation, D.M.P.; formal analysis, D.M.P., V.M., J.M., I.Š. and D.B.; investigation, D.M.P., V.M., J.M., I.Š. and D.B.; data curation, D.M.P., L.Ć., V.M. and J.M.; writing—original draft preparation, D.M.P.; writing—review and editing, D.M.P., L.Ć., V.M. and L.Ć.; supervision, D.M.P. All authors have read and agreed to the published version of the manuscript.

Funding

This research received no external funding.

Institutional Review Board Statement

Not applicable.

Informed Consent Statement

Not applicable.

Data Availability Statement

The data presented in this study are available upon request from the corresponding author.

Conflicts of Interest

The authors declare that they have no conflict of interest.

References

  1. Christensen, F.M. Pharmaceuticals in the environment—A human risk? Regul. Toxicol. Pharmacol. 1998, 28, 212–221. [Google Scholar] [CrossRef] [PubMed]
  2. Hernando, M.D.; Mezcua, M.; Ferńandez-Alba, A.R.; Barceló, D. Environmental risk assessment of pharmaceutical residues in wastewater effluents, surface waters and sediments. Talanta 2006, 69, 334–342. [Google Scholar] [CrossRef] [PubMed]
  3. Petrović, M.; Hernando, M.D.; Díaz-Cruz, M.S.; Barceló, D. Liquid chromatography–tandem mass spectrometry for the analysis of pharmaceutical residues in environmental samples: A review. J. Chromatogr. A 2005, 1067, 1–14. [Google Scholar] [CrossRef] [PubMed]
  4. Aksu, Z. Application of biosorption for the removal of organic pollutants: A review. Process Biochem. 2005, 40, 997–1026. [Google Scholar] [CrossRef]
  5. Kumar, K.V. Optimum sorption isotherm by linear and non-linear methods for malachite green onto lemon peel. Dye. Pigment. 2007, 74, 595–597. [Google Scholar] [CrossRef]
  6. Namasivayam, C.; Kavitha, D. Removal of Congo Red from water by adsorption onto activated carbon prepared from coir pith, an agricultural solid waste. Dye. Pigment. 2002, 54, 47–58. [Google Scholar] [CrossRef]
  7. Hamdaoui, O.; Saoudi, F.; Chiha, M.; Naffrechoux, E. Sorption of malachite green by a novel sorbent, dead leaves of plane tree: Equilibrium and kinetic modelling. Chem. Eng. J. 2008, 143, 73–84. [Google Scholar] [CrossRef]
  8. Hamdaoui, O.; Naffrechoux, E. Modeling of adsorption isotherms of phenol and chlorophenols onto granular activated carbon Part, I. Two-parameter models and equations allowing determination of thermodynamic parameters. J. Hazard. Mater. 2007, 147, 381–394. [Google Scholar] [CrossRef]
  9. Hamdaoui, O.; Naffrechoux, E. Modeling of adsorption isotherms of phenol and chlorophenols onto granular activated carbon Part II. Models with more than two parameters. J. Hazard. Mater. 2007, 147, 401–411. [Google Scholar] [CrossRef]
  10. Zhao, X.; Ouyang, W.; Hao, F.; Lin, C.; Wang, F.; Han, S.; Geng, X. Properties comparison of biochars from corn straw with different pretreatment and sorption behaviour of atrazine. Bioresour. Technol. 2013, 147, 338–344. [Google Scholar] [CrossRef]
  11. Zhou, Y.; Zhang, L.; Cheng, Z. Removal of organic pollutants from aqueous solution using agricultural wastes: A review. J. Mol. Liq. 2015, 212, 739–762. [Google Scholar] [CrossRef]
  12. Mirabella, N.; Castellani, V.; Sala, S. Current options for the valorization of food manufacturing waste: A review. J. Clean. Prod. 2014, 65, 28–41. [Google Scholar] [CrossRef] [Green Version]
  13. Abia, A.A.; Horsfall, M.; Didi, O. The use of chemically modified and unmodified cassava waste for the removal of Cd, Cu and Zn ions from aqueous solution. Bioresour. Technol. 2003, 90, 345–348. [Google Scholar] [CrossRef]
  14. Israel, U.; Eduok, U.M. Biosorption of zinc from aqueous solution using coconut. Arch. Appl. Sci. Res. 2012, 4, 809–819. [Google Scholar]
  15. Horsfall, M.; Spiff, A.I. Equilibrium Sorption Study of Al3+, Co2+ and Ag+ in Aqueous Solutions by Fluted Pumpkin (Telfairia Occidentalis HOOK f) Waste Biomass. Acta Chim. Slov. 2005, 52, 174–181. [Google Scholar]
  16. Randall, J.M.; Hautala, E.; Waiss, A.C. Removal and recycling of heavy metal ions from agricultural byproducts. In Proceedings of the 4th Mineral Waste Utilization Symposium, Chicago, IL, USA, 7–8 May 1974. [Google Scholar]
  17. Iqbal, M.; Saeed, A.; Iqbal Zafar, S. FTIR spectrophotometry, kinetics and adsorption isotherms modelling, ion exchange, and EDX analysis for understanding the mechanism of Cd2+ and Pb2+ removal by mango peel waste. J. Hazard. Mater. 2009, 164, 161–171. [Google Scholar] [CrossRef]
  18. Hossain, M.A.; Ngo, H.H.; Guo, W.S.; Nguyen, T.V. Biosorption of Cu(II) From Water by Banana Peel Based Biosorbent: Experiments and Models of Adsorption and Desorption. J. Water Sustain. 2012, 2, 87–104. [Google Scholar]
  19. Anwar, J.; Shafique, U.; Zaman, W.; Salman, M.; Dar, A.; Anwar, S. Removal of Pb(II) and Cd(II) from water by adsorption on peels of banana. Bioresour. Technol. 2010, 101, 1752–1755. [Google Scholar] [CrossRef] [PubMed]
  20. Ho, Y.S.; Wase, D.A.J.; Forster, C.F. Removal of lead ions from aqueous solution using sphagnum moss peat as absorbent. Water SA 1996, 22, 219–224. [Google Scholar]
  21. Anastopoulos, I.; Kyzas, G.Z. Agricultural peels for dye adsorption: A review of recent literature. J. Mol. Liq. 2014, 200, 381–389. [Google Scholar] [CrossRef]
  22. Adeniyi, A.G.; Ighalo, J.O. Biosorption of pollutants by plant leaves: An empirical review. J. Environ. Chem. Eng. 2019, 7, 103100. [Google Scholar] [CrossRef]
  23. Kalogeropoulos, N.; Chiou, A.; Pyriochou, V.; Peristeraki, A.; Karathanos, V.T. Bioactive phytochemicals in industrial tomatoes and their processing byproducts. LWT-Food Sci. Technol. 2012, 49, 213–216. [Google Scholar] [CrossRef]
  24. Lazos, E.S.; Kalathenos, P. Technical Note: Composition of tomato processing wastes. Int. J. Food Sci. Tech. 1988, 23, 649–652. [Google Scholar] [CrossRef]
  25. Pehlivan, E.; Yanık, B.H.; Ahmetli, G.; Pehlivan, M. Equilibrium isotherm studies for the uptake of cadmium and lead ions onto sugar beet pulp. Bioresour. Technol. 2008, 99, 3520–3527. [Google Scholar] [CrossRef]
  26. Shukla, S.R.; Pai, R.S. Removal of Pb(II) from solution using cellulose containing materials. J. Chem. Technol. Biotechnol. 2005, 80, 176–183. [Google Scholar] [CrossRef]
  27. Xuan, Z.X.; Tang, Y.R.; Li, X.M.; Liu, Y.H.; Luo, F. Study on the equilibrium, kinetics and isotherm of biosorption of lead ions onto pretreated chemically modified orange peel. Biochem. Eng. J. 2006, 31, 160–164. [Google Scholar] [CrossRef]
  28. Ribeiro, G.C.; Coelho, L.M.; Oliveira, E.; Coelho, N.M.M. Removal of Cu(II) from Ethanol fuel using mandarin peel as biosorbent. BioResources 2013, 8, 3309–3321. [Google Scholar] [CrossRef] [Green Version]
  29. Tolić, K.; Mutavdžić Pavlović, D.; Stankir, N.; Runje, M. Biosorbents from Tomato, Tangerine, and Maple Leaves for the Removal of Ciprofloxacin from Aqueous Media. Water Air Soil Pollut. 2021, 232, 218. [Google Scholar] [CrossRef]
  30. Gutha, Y.; Munagapati, V.S.; Naushad, M.; Abburi, K. Removal of Ni (II) from aqueous solution by Lycopersicum esculentum (Tomato) leaf powder as a low-cost biosorbent. Desalination Water Treat. 2015, 54, 200–208. [Google Scholar] [CrossRef]
  31. Babić, S.; Horvat, A.J.M.; Mutavdžić Pavlović, D.; Kaštelan-Macan, M. Determination of pKa values of active pharmaceutical ingredients. Trends Anal. Chem. 2007, 26, 1043–1061. [Google Scholar] [CrossRef]
  32. EPIweb 4.0. Available online: http://www.epa.gov/oppt/exposure/pubs/episuitedl.htm (accessed on 14 September 2020).
  33. Mutavdžić Pavlović, D.; Ćurković, L.; Macan, J.; Žižek, K. Eggshell as a new biosorbent for the removal of pharmaceuticals from aqueous solutions. CLEAN—Soil Air Water 2017, 45, 1–14. [Google Scholar] [CrossRef]
  34. Hörsing, M.; Ledin, A.; Grabic, R.; Fick, J.; Tysklind, M.; Cour Jansen, J.; Andersen, H.R. Determination of sorption of seventy-five pharmaceuticals in sewage sludge. Water Res. 2011, 45, 4470–4482. [Google Scholar] [CrossRef] [Green Version]
  35. Freundlich, H.M.F. Über die Adsorption in Lösungen. Zeitschrift Physikalische Chemie 1906, 57, 385–470. [Google Scholar] [CrossRef]
  36. Dubinin, M.M.; Radushkevich, L.V. Equation of the characteristic curve of activated charcoal. Chem. Zent. 1947, 1, 875–890. [Google Scholar]
  37. Lagergren, S.; Svenska, B.K. Zur theorie der sogenannten adsorption geloester stoffe. Veternskapsakad Handlingar 1898, 24, 1–39. [Google Scholar]
  38. Ho, Y.S.; McKay, G. The kinetics of sorption of basic dyes from aqueous solutions by sphagnum moss peat. Can. J. Chem. Eng. 1998, 76, 822–827. [Google Scholar] [CrossRef]
  39. Yeddou-Mezenner, N. Kinetics and Mechanism of Dye Biosorption onto an Untreated Antibiotic Waste. Desalination 2010, 262, 251–259. [Google Scholar] [CrossRef]
  40. Weber, W.J.; Moris, J.C. Kinetics of adsorption on carbon from solution. J. Sanit. Eng. Div. Am. Soc. Civ. Eng. 1963, 89, 31–60. [Google Scholar] [CrossRef]
  41. Boyd, G.E.; Adamson, A.W.; Myers Jr, L.S. The Exchange Adsorption of Ions from Aqueous Solutions by Organic Zeolites. II. Kinetics. J. Am. Chem. Soc. 1947, 69, 2836–2848. [Google Scholar] [CrossRef]
  42. Yargıç, A.Ş.; Sahin, R.Z.Y.; Özbay, N.; Önal, E. Assessment of toxic copper(II) biosorption from aqueous solution by chemically-treated tomato waste. J. Clean. Prod. 2015, 88, 152–159. [Google Scholar] [CrossRef]
  43. Kamil, M.M.; Mohamed, G.F.; Shaheen, M.S. Fourier Transformer Infrared Spectroscopy for Quality Assurance of Tomato Products. J. Am. Sci. 2011, 7, 559–572. [Google Scholar]
  44. Vermeir, S.; Beullens, K.; Mészáros, P.; Polshin, E.; Nicolad, B.M..; Lammertyn, J. Sequential injection ATR-FTIR spectroscopy for taste analysis in tomato. Sens. Actuators B Chem. 2009, 137, 715–721. [Google Scholar] [CrossRef]
  45. Gong, G.; Ye, S.; Tian, Y.; Wang, Q.; Ni, J.; Chen, Y. Preparation of a new sorbent with hydrated lime and blast furnace slag for phosphorus removal from aqueous solution. J. Hazard. Mater. 2009, 166, 714–719. [Google Scholar] [CrossRef]
  46. Zheng, Y.M.; Lim, S.F.; Chen, J.P. Preparation and characterization of zirconium-based magnetic sorbent for arsenate removal. J. Colloid Interface Sci. 2009, 338, 22–29. [Google Scholar] [CrossRef]
  47. Zaini, M.A.A.; Zakaria, M.; Alias, N.; Zakaria, Z.Y.; Johari, A.; Setapar, S.H.; Kamaruddin, J.; Yunus, A.C. Removal of heavy metals onto KOH-activated ash-rich sludge adsorbent. Energy Procedia 2014, 61, 2572–2575. [Google Scholar] [CrossRef] [Green Version]
  48. Bansal, R.C.; Donnet, J.B.; Stoeckli, F. Active Carbon; Marcel Dekker: New York, NY, USA, 1988; p. 121. [Google Scholar]
  49. Białk-Bielińska, A.; Maszkowska, J.; Mrozik, W.; Bielawska, A.; Kołodziejska, M.; Palavinskas, R.; Stepnowski, J.; Kumirska, J. Sulfadimethoxine and sulfaguanidine: Their sorption potential on natural soils. Chemosphere 2012, 86, 1059–1065. [Google Scholar] [CrossRef] [PubMed]
  50. Maszkowska, J.; Kołodziejska, M.; Białk-Bielińska, A.; Mrozik, W.; Kumirska, J.; Stepnowski, P.; Palavinskas, R.; Krüger, O.; Kalbe, U. Column and batch tests of sulfonamide leaching from different types of soil. J. Hazard. Mater. 2013, 260, 468–474. [Google Scholar] [CrossRef]
  51. Mutavdžić Pavlović, D.; Ćurković, L.; Blažek, D.; Župan, J. The sorption of sulfamethazine on soil samples: Isotherms and error analysis. Sci. Total. Environ. 2014, 497–498, 543–552. [Google Scholar] [CrossRef] [PubMed] [Green Version]
  52. Aksu, Z.; Tatlı, A.İ.; Tunç, Ö. A comparative adsorption/biosorption study of Acid Blue 161: Effect of temperature on equilibrium and kinetic parameters. Chem. Eng. J. 2008, 142, 23–39. [Google Scholar] [CrossRef]
  53. Treybal, R.E. Mass Transfer Operations, 3rd ed.; McGraw-Hill: New York, NY, USA, 1980. [Google Scholar]
  54. Hao, Y.M.; Chen, M.; Hu, Z.B. Effective removal of Cu (II) ions from aqueous solution by amino-functionalized magnetic nanoparticles. J. Hazard. Mater. 2010, 184, 392–399. [Google Scholar] [CrossRef] [PubMed]
  55. Goldberg, S. Equations and Models Describing Adsorption Processes in Soils; Chemical Processes in Soils SSSA Book Series; Soil Science Society of America Inc.: Madison, WI, USA, 2005; Volume 8, pp. 489–517. [Google Scholar]
  56. Liao, X.; Zhang, C.; Yao, L.; Li, J.; Liu, M.; Xu, L.; Evalde, M. Sorption behavior of nonylphenol (NP) on sewage-irrigated soil: Kinetic and thermodynamic studies. Sci. Total Environ. 2014, 473–474, 530–536. [Google Scholar] [CrossRef]
  57. Bilgili, M.S. Adsorption of 4-chlorophenol from aqueous solutions by xad-4 resin: Isotherm, kinetic, and thermodynamic analysis. J. Hazard. Mater. 2006, 137, 157–164. [Google Scholar] [CrossRef]
  58. Khattri, S.D.; Singh, M.K. Removal of malachite green from dye wastewater using neem sawdust by adsorption. J. Hazard. Mater. 2009, 167, 1089–1094. [Google Scholar] [CrossRef]
  59. Brito, S.M.O.; Andrade, H.M.C.; Soares, L.F.; Azevedo, R.P. Brazil nut shells as a new biosorbent to remove methylene blue and indigo carmine from aqueous solutions. J. Hazard. Mater. 2010, 174, 84–92. [Google Scholar] [CrossRef]
  60. Hu, Z.; Chen, H.; Ji, F.; Yuan, S. Removal of Congo Red from aqueous solution by cattail root. J. Hazard. Mater. 2010, 173, 292–297. [Google Scholar] [CrossRef] [PubMed]
  61. Heraldy, E.; Wahyu Lestari, W.; Permatasaria, D.; Dwi Arimurtia, D. Biosorbent from tomato waste and apple juice residue for lead removal. J. Env. Chem. Eng. 2018, 6, 1201–1208. [Google Scholar] [CrossRef]
  62. Changmai, M.; Banerjee, P.; Nahar, K.; Purkait, M.K. A novel adsorbent from carrot, tomato and polyethylene terephthalate waste as a potential adsorbent for Co (II) from aqueous solution: Kinetic and Equilibrium studies. J. Env. Chem. Eng. 2018, 6, 246–257. [Google Scholar] [CrossRef]
  63. Pereira Leal, R.M.; Ferracciú Alleoni, L.R.; Tornisielo, V.L.; Borges Regitano, J. Sorption of fluoroquinolones and sulfonamides in 13 Brazilian soils. Chemosphere 2013, 92, 979–985. [Google Scholar] [CrossRef] [PubMed] [Green Version]
  64. Peruchi, L.M.; Fostier, A.H.; Rath, S. Sorption of norfloxacin in soils: Analytical method, kinetics and Freundlich isotherms. Chemosphere 2015, 119, 310–317. [Google Scholar] [CrossRef]
  65. Carabineiro, S.A.C.; Thavorn-Amornsri, T.; Pereira, M.F.R.; Figueiredo, J.L. Adsorption of ciprofloxacin on surface-modified carbon materials. Water Res. 2011, 45, 4583–4591. [Google Scholar] [CrossRef]
  66. Kurniawan, T.A.; Chan, G.Y.S.; Lo, W.-H.; Babel, S. Comparisons of low-cost adsorbents for treating wastewaters laden with heavy metals. Sci. Total Environ. 2006, 366, 409–426. [Google Scholar] [CrossRef]
  67. Cuerda-Correa, E.M.; Domínguez-Vargas, J.R.; Olivares-Marín, F.J.; de Heredia, J.B. On the use of carbon blacks as potential low-cost adsorbents for the removal of non-steroidal anti-inflammatory drugs from river water. J. Hazard. Mater. 2010, 177, 1046–1053. [Google Scholar] [CrossRef]
Figure 1. FTIR spectra of the TW.
Sustainability 13 11560 g001
Figure 2. (A) Pore size distribution of TW, (B) particle size distribution of TW.
Sustainability 13 11560 g002aSustainability 13 11560 g002b
Figure 3. SEM images of dried tomato-based adsorbent at 1000× magnification.
Sustainability 13 11560 g003
Figure 4. Chromatogram of investigated TW matrices and DEXA standard solution with corresponding and characteristic absorption spectra.
Sustainability 13 11560 g004
Figure 5. The DEXA, FEBA, PRAZ, PROC, and TYL adsorption on TW at different temperatures.
Sustainability 13 11560 g005aSustainability 13 11560 g005b
Figure 6. (A) Lagergren’s first-order model, (B) Ho’s pseudo-second-order kinetics, (C) Webber–Morris’s intraparticle diffusion model and (D,E) Boyd plots for sorption of dexamethasone (DEXA) on a TW (c(DEXA) = 75.0 mg L−1, T = 25 °C, 30 °C, and 35 °C).
Sustainability 13 11560 g006aSustainability 13 11560 g006b
Table 1. Selected pharmaceuticals, their structures, and their physicochemical properties.
Chemical StructureCAS No.MwpKa [31]log Kow [32]
PRAZ Sustainability 13 11560 i00155268-74-1312.4n.a.2.42
TYL Sustainability 13 11560 i00274610-55-21066.23.31; 7.501.63
PROC Sustainability 13 11560 i00359-46-1236.32.24; 8.842.14
DEXA Sustainability 13 11560 i00450-02-2392.5n.a.1.94
FEBA Sustainability 13 11560 i00558306-30-2446.5n.a.1.53
Table 2. Physicochemical characterization of TW.
pHEC, μS cm−1CEC, mmol kg−1
4.581003100.63
Table 3. Linear, Freundlich, and Dubinin–Radushkevich isotherm.
IsothermLinear Form
Linear q e = K D × C e
Freundlich log q e = log K F + 1 n log C e
Dubinin–Radushkevich ln q e = ln q m a x β ε 2
Table 4. The Linear, Freundlich, and Dubinin–Radushkevich sorption isotherm parameters obtained using the linear method (KD (mL g−1), KF ((μg g−1)(L μg−1)1/n)), β (mol2 kJ−2), qm (μg g−1), E (kJ mol−1)).
PharmaceuticalIsotherm
T, KLinearFreundlichDubinin–Radushkevich
KDR2nKFR2βqmER2
DEXA29845.40.99650.618.750.97915.6 × 10−64610.2990.9757
3037.20.99640.985.490.97182.84 × 10−52440.1320.9657
3086.80.99120.4424.50.9925.11 × 10−52150.0990.9946
FEBA2985.30.99291.7410.510.99723.87 × 10−52810.1440.9649
3038.50.99571.4531.750.99991.48 × 10−53700.1840.9421
30821.70.99341.2950.610.99875.9 × 10−65240.2910.9514
PRAZ29812.70.86791.1853.230.90464.62 ×10−64490.3290.9939
3039.60.87291.7363.960.91938.1 × 10−64430.2480.9948
3088.30.89451.7460.170.88099.0 × 10−64370.2360.9999
PROC29817.80.98480.353.790.99655.4 × 10−612300.3040.9853
3033.80.98510.501.270.96003.78 × 10−59800.1150.9993
3080.70.99801.1010.500.99933.31 × 10−53220.1220.9572
TYL29828.60.99630.571.870.99983.83 × 10−56770.1140.9774
30327.00.99990.695.230.99872.54 × 10−56280.1400.9769
30825.10.99980.8312.330.99861.66 × 10−55810.1730.9705
Table 5. Lagergren’s pseudo-first-order and Ho’s pseudo-second-order kinetic parameters of adsorption pharmaceuticals by TW.
T, °CC0, mg L−1qe, exp
(µg g−1)
Kinetic Model
Lagergren Pseudo-First OrderHo’s Pseudo-Second Order
k1
(min−1) × 10−3
qe, cal
(µg g−1)
R2k2
(g µg−1 min−1) × 10−5
qe, cal
(µg g−1)
h
(µg g−1 min−1)
R2
DEXA25251904.6870.968818.291926.740.9997
753934.92310.98385.974049.740.9997
3025993.7400.993325.061002.510.9998
752604.31280.97157.352655.160.9993
3525743.8330.974443.82 752.460.9997
751633.7730.994219.931665.490.9997
FEBA25251033.6510.994014.941071.710.9997
752764.61390.99695.332804.180.9999
30251534.4820.992717.061533.990.9996
753835.02070.99427.3538610.950.9996
35251933.4670.993949.1219618.870.9995
755365.92650.94429.0354026.330.9994
PRAZ25251974.3670.967526.0519910.320.9999
754544.61760.96199.4245619.590.9999
30251803.6590.945024.431828.090.9999
754385.11920.98139.0344017.480.9998
35251743.8640.962020.321786.440.9998
754144.51920.97698.1342014.340.9998
PROC25252073.6740.938321.182089.160.9998
756875.02190.96758.2169039.090.9999
30251413.5700.969820.801444.310.9996
755384.22240.95206.7855520.880.9996
35251123.5450.964719.051152.520.9997
753173.91340.96376.353206.500.9996
TYL25251353.3580.94210.761380.140.9967
755065.22010.96890.565101.460.9986
30251504.0590.95720.531490.030.9982
755155.22120.98300.465131.210.9997
35251633.5590.95220.371650.100.9999
755184.21840.95770.455201.220.9999
Table 6. Intraparticle diffusion model constants and correlation coefficients for the adsorption of pharmaceuticals on TW, at initial concentration of 75 mg L1 and different temperature (T = 25 °C, 30 °C, and 35 °C). (kp1, kp2, kp3 µg g−1 min−1/2).
T, °CWebber’s Intraparticle Diffusion
First Stage of SorptionSecond Stage of SorptionThird Stage of Sorption
kp1C1R2kp2C2R2kp3C3R2
DEXA2532.836.780.99399.84171.40.92533.05284.890.9875
3017.7838.620.93905.10140.50.90872.04188.120.9590
359.1841.850.98292.9590.920.92161.26118.990.9314
FEBA2529.19−75.310.993610.7966.350.96551.88209.170.8853
308.76−23.260.97978.30196.150.90632.80282.980.9322
3541.5669.920.99969.98313.10.85923.21422.090.9140
PRAZ2534.6473.590.99359.18270.190.90891.99388.440.9795
308.76−23.260.97978.42251.110.91140.5910.130.9240
3515.17−50.740.97537.57228.560.91873.03306.890.9034
PROC2542.94216.840.995211.47455.510.94072.27606.010.8134
3033.46118.460.963711.79291.970.93262.89435.580.9084
3526.13−21.280.95629.10120.650.87442.51228.670.8587
TYL252.36−10.180.95209.55308.680.88720.7330.400.9428
308.76−23.260.979710.10312.010.93240.5910.130.9420
3515.17−50.740.975310.04298.460.93610.146.530.9077
Table 7. Thermodynamic parameters for the adsorption of pharmaceuticals by TW.
PharmaceuticalKD (mL g−1)Δ (kJ mol−1)Δ
(kJ mol−1)
Δ
(kJ mol−1)
298 K303 K308 K298 K303 K308 K
DEXA15.48.96.8−6.77−5.51−4.91−62.5−0.19
FEBA5.38.521.7−4.13−5.39−7.88107.40.37
PRAZ12.79.68.3−6.30−5.70−5.42−32.5−0.09
PROC7.83.81.1−5.09−3.36−0.24−149.3−0.48
TYL29.62725.1−8.39−8.30−8.25−12.6−0.02
Publisher’s Note: MDPI stays neutral with regard to jurisdictional claims in published maps and institutional affiliations.

