Article

Evaluation Model and Empirical Research on the Green Innovation Capability of Manufacturing Enterprises from the Perspective of Ecological Niche

School of Economics and Management, Harbin Engineering University, Harbin 150001, China
*
Author to whom correspondence should be addressed.
Sustainability 2021, 13(21), 11710; https://0-doi-org.brum.beds.ac.uk/10.3390/su132111710
Submission received: 7 September 2021 / Revised: 18 October 2021 / Accepted: 21 October 2021 / Published: 23 October 2021

Abstract

:
Green innovation is an important driving force in promoting the sustainable development of manufacturing enterprises and improving market competitiveness. This study selects indicators from the two aspects of ecostate and ecorole in order to reflect green research and development, cleaner production, and green marketing based on niche theory. We construct an evaluation index system to objectively and accurately assess the green innovation capability of manufacturing enterprises. Subsequently, based on the principle of relative entropy, the analytic hierarchy process, entropy weight method, and coefficient of variation method are fused to determine the combined weight of the indicators, and a multi-level, comprehensive evaluation model is constructed using cloud model tools. Finally, through an empirical analysis of the evaluation of the green innovation capability of five manufacturing enterprises, the feasibility of the model and the stability of the evaluation results are verified through three dimensions: numerical experiment, sensitivity analysis, and method comparison. The results show that the evaluation system constructed in this study is superior. It provides the basis and decision-making reference for enterprises to carry out market positioning and formulate innovation and development strategies.

1. Introduction

With the deterioration of the global environment, manufacturing enterprises that depend on resource consumption have realized that the extensive development model will end. Seeking a “harmonious coexistence” between enterprises and the environment has become a global problem [1]. “Made in China 2025” indicates that green innovation is the key to upgrading manufacturing and achieving high-quality development [2]. In the context of the vigorous development of global green technology and the business environment, green innovation is also an important way for Chinese enterprises to participate in international competition and establish a sustainable competitive advantage [3]. Therefore, the systematic analysis and scientific evaluation of the green innovation ability of enterprises can help to promote the effective diffusion of green innovation [4]. This has important theoretical value and practical significance for improving the level of green innovation of enterprises and realizing sustainable social development.
Niche theory explains the competition between organisms and their adaptability to the environment; it also describes the most suitable living position for organisms in the eco-system [5]. The enterprise niche is the link between its survival, development, and living environment, representing the enterprise’s competitiveness [6]. In recent years, the differential impact of ecological niche on different forms of technological innovation has become a research hotspot. Combined with the development of green innovation in manufacturing enterprises, this study identifies factors influencing the ecostate and ecorole of enterprises’ green innovation from the perspective of ecological niche and constructs an index system and evaluation cloud model. At the micro level, the evaluation of enterprises’ green innovation ability is helpful for correctly understanding the development status and competitive potential of green innovation as well as for providing theoretical support and practical guidance in enhancing the core competitiveness of enterprises. At the macro level, it provides policy guidance for enhancing their green manufacturing capacity and for implementing green innovation.
The remainder of this paper proceeds as follows. Section 2 reviews the relevant literature on green innovation and niche theory; Section 3 presents the evaluation index system; Section 4 introduces the methods used, including the relative entropy method, to calculate the comprehensive index weight and cloud model; Section 5 presents the empirical study report; finally, Section 6 presents the conclusion and future study directions.

2. Literature Review

2.1. Green Innovation

Green innovation refers to the development of new technologies and policies in product development, manufacturing, organization management, and marketing to reduce re-source and energy consumption, bring environmental benefits to society, and improve enterprise output efficiency [7,8]. Compared with traditional innovation, green innovation emphasizes ecology and believes that enterprises should not blindly pursue the maximization of monetary interests but fulfill the new requirements of social responsibility as well [9]. Green innovation is considered an important pathway towards sustainable development in the business sector [10]. Innovation capability is an index used to measure innovation resources, knowledge creation, enterprise innovation, innovation performance, and innovation environment [11]. It is imperative to realize the greening of innovation. Simultaneously, it is also necessary to evaluate green innovation ability in order to test the rationality of innovation investment, resource allocation, and macro policy.
At present, scholars from various countries have refined the evaluation of green innovation ability, and the design of evaluation index systems tends to be comprehensive and scientific. Many studies focus on building evaluation systems based on the green innovation process to measure innovation ability [12,13,14]. For example, García-Granero et al. [15] evaluated the level of green innovation through four aspects: product innovation, process innovation, organizational innovation, and marketing innovation. Sui et al. [16] used the growth rate of patent authorization, the proportion of new products in total products, and the conversion rate of scientific and technological achievements to measure R&D, manufacturing, and marketing performance. The perspective of the innovation process focuses on the evaluation of innovation activities according to the principle of value chain [17], which is conducive to the in-depth analysis of each sub-stage of innovation. However, the relevant research did not include a complete combination of key indicators of R&D, production, and marketing.
Green innovation capability is not limited to the ability to generate products that foment environmental protection. Some scholars pay attention to the two indicators of innovation, input and output, to evaluate the efficiency or performance of green innovation [18,19,20]. Chen et al. [21] selected input and output indicators and used the three-stage chain network slack-based measure (SBM) model to analyze the green innovation efficiency of industrial enterprises in 29 provinces of China. Yuan et al. [22] constructed an extended Crépon–Duguet–Mairesse (CDM) model and used panel data from the manufacturing industry to test the impact of environmental regulation on industrial innovation and green development. In innovation investment, expenditure is the material guarantee of an enterprise’s R&D projects, human capital is the core force of project implementation, and the government also stimulates enterprises to complete green innovation through policies such as financial support and environmental regulation [23]. Patent and new product sales revenue are common output indicators reflecting the organization’s scientific and technological R&D achievements and marketization level [24].
Others have constructed an evaluation index system based on economic, environmental, and social (EES) elements [25,26,27]. For example, the triple bottom line theory believes that practitioners should be encouraged to evaluate the level of innovation development from the economic impact and the social and environmental impacts [28]. Chan et al. established an industrial sustainability assessment of China’s capital economic circle by integrating EES factors and used the principal global component analysis method to evaluate the industrial performance of various regions [29]. Economic performance is mainly reflected by the total number of new products, market share, and other indicators. The comprehensive utilization rate of the three wastes and carbon emission intensity are often used to measure environmental performance. The EES comprehensive development perspective indicates the economic, environmental, and social benefits of green innovation from a macro perspective.
Common measurement methods include data envelopment analysis (DEA) [30,31], the fuzzy comprehensive evaluation method, factor analysis [32], principal component analysis [33], analytic hierarchy process (AHP), entropy weight, technique for order preference by similarity to ideal solution (TOPSIS), and grey correlation analysis. For example, Li et al. [34] analyzed regional innovation and green economy efficiency based on DEA and fuzzy evaluation methods. Musaad et al. [35] used AHP to calculate the index weight and used the TOPSIS grey technology to rank the green innovation capability of suppliers. Zhang et al. [36] used the entropy weight method to evaluate the quality of regional green innovation and built an index system with three aspects: the technical, economic, and ecological benefits of innovation activities. Qiu et al. [37] introduced the coefficient of variation and hierarchical model to determine the evaluation weight, and used the grey multi-level evaluation method to measure the green level of four representative eco-industrial parks.

2.2. Niche Theory

Grinnell [38] proposed the idea of niche, which is interpreted as the comprehensive composition of the population and its environmental space (living space and resource space). Niche situation theory holds that organisms include two dimensions: ecostates and ecoroles. Ecostate is interpreted as the result of past learning, social, and economic development, and the interaction with many environmental factors; ecorole is the ability to influence and dominate the environment [39]. Innovation activities have similar laws and characteristics to organisms, and their niche situation is a process of dynamic selection, which is adjusted with the change in comprehensive ability and the change of interactive relationship with the external environment [40].
Niche theory is often used to analyze the competitiveness and potential of enterprises. Wan analyzed niche for viability, development, and competitiveness and established a comprehensive ecological niche evaluation method based on production and manufacturing capacity, core technology capacity, and marketing management capacity [41]. Yan designed an index system for enterprise niche evaluation using two aspects: the ecostate and ecorole of niche, with the results capable of reflecting enterprises’ competitive potential and viability [42]. He et al. [43] believe that niche situation represents the existing ability and future development potential of enterprises; they demonstrate that the situation has a significant positive impact on cross-organizational and technological collaborative innovation. Meng et al. [44] used an extended logistic model to analyze the ecological niche of organizational open innovation capability and proposed the path for enterprise innovation development.
Some scholars apply niche theory to analyze the process of the industrial evolution and the relationship between industry and the environment. Greve et al. [45] found that learning contributes to ecological niche change in the insurance industry, and organizational growth comes from learning reflection on a failed economy. Bakker et al. [46] dis-cussed how battery vehicles and hydrogen vehicles that were developed with independent innovation modes could adapt to future market selection standards using a technology niche strategy. Sanderson et al. [47] tracked the niche evolution of the solid-state lighting industry by analyzing the technological changes in light-emitting diodes (LED). Referring to the niche construction theory, Smith et al. [48] proposed that innovation or technological progress should be evaluated under the framework of whether it is conducive to sustainable socio-economic development. Generally speaking, scholars mainly study the characteristic relationship between industry and biological systems from the industrial level, and regard industry as a part of biological system.

2.3. Brief Review

To sum up, many scholars have conducted rich research on niche theory and green innovation, but there are also deficiencies, as shown in Table 1.
Based on this, drawing on the niche situation theory and the connotation of green innovation, this paper selects the key indicators affecting the green innovation ability of enterprises from the perspectives of R&D, production, and marketing, and constructs an evaluation index system of green innovation ability from the perspective of niche. The index weight is obtained by using the principle of relative entropy and by comprehensively considering AHP [49], entropy [50] and coefficient of variation [51]. Simultaneously, we use the advantages of a cloud model [52] in the transformation of uncertainty to evaluate and study green innovation ability. Finally, through empirical analysis, the feasibility of the model is verified through the employment of a numerical experiment, sensitivity analysis, and method comparison. This method provides a scientific basis for the evaluation standard of enterprise green innovation and the optimization path of enterprise green innovation.

3. Constructing the Index System

The construction of a green innovation capability evaluation index system for manufacturing enterprises from the ecological niche perspective follows systematization, scientificity, operability, and quantification [53]. This study constructs an index system according to the following steps: First, according to the definition of green innovation and niche theory and literature, the audition indicator is determined; second, the method of expert screening is used to delete the indicators that have little impact on the evaluation results; third, delete the indicators with high correlation in the same criterion layer through correlation analysis; finally, the non-key indicators that have no impact on the ranking are eliminated through discrimination analysis. Two first-level indicators and 13 secondary-level indicators were obtained. The following are the specific meanings and contents of the indicators, while the final index system constructed in this study is presented in Table 2 [54]:
(1) The ecostate of niche is the status of enterprises’ green innovation ability, reflecting the accumulation of resources such as green innovation personnel and capital investment, mainly green R&D, cleaner production, and green marketing. Green R&D is mainly composed of the proportion of R&D personnel, R&D capital investment intensity, and the number of scientific research platforms. Cleaner production mainly comprises environ-mental management investment intensity, technological transformation investment intensity, production personnel proportion, and personnel quality. Green marketing includes three waste emissions per unit profit, energy consumption per unit profit, and patent quality.
(2) The ecorole of niche mainly reflects the development trend of enterprise green innovation activities and is a dominant force in sustainable innovation. This includes the market share growth rate, enterprise profit growth rate, and patent growth rate.

4. Research Methods

4.1. Index Weight

To measure the importance of each index, we used the relative entropy combination weighting method to determine the weight of each index, which can improve the compatibility of multiple single-weighting methods and reflects the essential characteristics of complex systems such as nonlinearity and emergence.

4.1.1. Single-Weighting Methods

The AHP is a subjective weighting method, and its specific steps are as follows:
(1) Construct the comparison judgment matrix A = ( a i j ) n × n , where a i j = x i / x j , a i j is the relative importance of the i-th index and the j-th index, the selection of x i and x j refers to the Saaty scale, and n is the number of indicators.
(2) Calculate the maximum eigenvalue λ max of A, and its corresponding eigenvector is the required weight vector W = [ w 1 , w 2 , w n ] T .
(3) Consistency inspection. Solve the consistency ratio CR = CI/RI, C I = ( λ max n ) / ( n 1 ) is the consistency index, and RI is the consistency random index. If C R < 0.1 , it is considered to meet the requirements, otherwise it needs to be reassessed.
The characteristic of the entropy weight method [60] is that the higher the order degree of an index, the lower the information entropy and the greater the index weight. The specific steps are as follows:
(1) Standardized treatment of the evaluation value is as follows:
f i j = u i j / j = 1 n u i j ,   i = 1 , 2 , , m ; j = 1 , 2 , n
(2) Calculate the entropy H j of the j-th evaluation index as follows:
H j = ( i = 1 m f i j ln f i j ) / ln m
(3) Calculate the entropy weight w j of the j-th index as follows:
w j = ( 1 H j ) / ( n j n H j )
The coefficient of variation (CV) is a method of determining the index weight by using the variation degree of the evaluated index. The specific calculation steps are as follows:
(1) Calculate the coefficient of variation v j of the j-th index as follows:
v j = 1 m i = 1 m ( x i j x j ¯ ) 2 | x j ¯ |
where x i j (i = 1, 2, …, m; j = 1, 2, …, n) represents the value of the j-th index of the evaluation object i, and x j ¯ is the average value of the j-th index.
(2) Calculate the weight w j of the j-th index as follows:
w j = v j j = 1 n v j

4.1.2. Combined Weighting Method Based on the Relative Entropy Principle

Relative entropy [61,62] is used in information theory and probability theory to describe the difference between two probability distributions. The purpose of using a combined weighting method based on the relative entropy principle is to minimize the sum of the relative entropy between the combined weight and each single weighting method. The calculation steps are as follows:
(1) Let the aggregation weight of AHP, entropy, and CV method be b = ( b 1 , b 2 , , b m ) , and y i j ( i = 1 , 2 , , n ; j = 1 , 2 , m ) is the weight of the j-th index of the i-th single weighting method, then establish the mathematical optimization model according to relative entropy. The calculation formula is as follows:
min i = 1 n j = 1 m b j log b j y i j { s . t . j = 1 m b j = 1 b j > 0 , j m
The global optimal solution b = ( b 1 , b 2 , , b m ) is as follows:
b j = i = 1 n ( y i j ) 1 / n / j = 1 m i = 1 n ( y i j ) 1 / n ,   j = 1 , 2 , , m
(2) Calculate the weight distribution coefficient β i according to the following formula:
β i = h ( y i , b ) i = 1 3 h ( y i , b ) ,   i = 1 , 2 , 3
where h ( y i , b ) is the relative entropy of single weight y i relative to aggregation weight b , and the calculation formula is as follows:
h ( y i , b ) = j = 1 m y i j log y i j b j
(3) The calculation formula of combined weight W j is as follows:
W j = i = 1 3 β i y i j

4.2. Green Innovation Capability Evaluation Model

The green innovation capability of manufacturing enterprises from the perspective of ecological niche is a comprehensive concept. It is necessary to express and deal with the fuzzy concept to establish an accurate and comprehensive ecological niche index evaluation system. The cloud model is based on fuzzy mathematics theory and probability theory. It can establish the mapping relationship between qualitative and quantitative data and realize the transformation of qualitative and quantitative data. Thus, the effective information of the qualitative expression is extracted, and the qualitative operation is processed according to the algorithm. Additionally, the scope and distribution of quantitative data are intuitive and accurate expressions of natural language, with strong interpretability.

4.2.1. Standardization of Index System

Owing to the different dimensions of evaluation indicators, the indicators are standardized as follows:
Positive   indicator :   P i j = A i j min ( A i j ) max ( A i j ) min ( A i j ) ( 1 j n )
Negative   indicator :   P i j = max ( A i j ) A i j max ( A i j ) min ( A i j ) ( 1 j n )
where P i j is the standardized value of the j-th index of the evaluation object A i , and A i j is its original data.

4.2.2. Establish the Cloud Model of Each Index

Among the evaluation indicators of green innovation capability of enterprises, there are both accurate values and fuzzy language values. The cloud model representation methods are different [63], as follows:
(1) Cloud model representation method for the accurate numerical description indicator:
{ E x = ( E x 1 + E x 2 + + E x n ) / n E n = ( max ( E x 1 , E x 2 , E x n ) min ( E x 1 , E x 2 , E x n ) ) / 6 H e = k
(2) Cloud model representation of the language value description index.
The domain of discourse corresponding to the comment set is expressed as [0,1], and each comment in the comment set corresponds to an interval of a domain. In this study, the comment set C is divided into five, that is, C = {Worst, Poor, Medium, Good, Excellent}. For the intermediate interval, select the bilateral constraint [ V min , V max ] , and the endpoint selects the semi-cloud model for representation. The change intervals corresponding to this comment are shown in Table 3. The comment representation of the symmetric cloud is calculated as follows [64]:
{ E x i = ( V max + V min ) / 2 E n i = ( V max V min ) / 6 H e i = k
The larger the known ecological niche value, the stronger the niche of green enterprise innovation, and the higher the development level of green innovation. The greater the interaction with the environment, the greater the impact on the environment and the higher the utilization rate of enterprise resources. If the niche level of green innovation is low, the role of green innovation in enterprise development is limited, and the utilization rate and advantage of innovation resources are not high. The niche situation of green innovation is a dynamic selection process, which changes with the change in its comprehensive ability and its interactive relationship with the external environment.
The comments are transformed into a cloud model according to the formula above, and the expected value constitutes the decision matrix D. The algorithm steps for calculating the numerical characteristics of the one-dimensional cloud model corresponding to each index are as follows [65]:
(1) Input the n cloud droplets x i ( i = 1 , 2 , , n ) ;
(2) Calculate the sample mean X ¯ = 1 n i = 1 n x i according to x i ;
(3) Calculate the expectation: E x = X ¯ ;
(4) Calculate the entropy: E n = π 2 × 1 n i = 1 n | x i E x | ;
(5) Calculate the sample variance: S 2 = 1 n 1 i = 1 n ( x i X ¯ ) 2 ;
(6) Calculate the hyper entropy: H e = S 2 E n 2 .
(7) Output the numerical characteristics (Ex, En, He).
If there are n adjacent cloud models in the evaluation index system, the numerical characteristics of the comprehensive cloud model of n cloud models are as follows [66]:
{ E x = E x 1 E n 1 W 1 + E x 2 E n 2 W 2 + + E x n E n n W n E n 1 W 1 + E n 2 W 2 + + E n n W n E n = E n 1 W 1 + E n 2 W 2 + + E n n W n H e = W 1 2 W 1 2 + W 2 2 + W n 2 × H e 1 + + W n 2 W 1 2 + W 2 2 + W n 2 × H e n

4.3. Evaluation Model

The specific steps of the green innovation capability evaluation model for manufacturing enterprises from the perspective of the ecological niche are as follows:
(1) Construct an index system based on niche situation theory and collect data;
(2) Data standardization processing;
(3) The index combination weight is determined based on the principle of relative entropy;
(4) Calculate the evaluation value of enterprise green innovation capability according to the multilevel comprehensive cloud model algorithm;
(5) The sensitivity analysis of criteria weight is carried out for the evaluation method, and the flow of the model is shown in Figure 1.

5. Empirical Research

5.1. Data Collection

This study selected five representative home appliance manufacturing enterprises from the list of green manufacturing enterprises published by the Ministry of Industry and Information Technology of China to verify that the above framework accurately and effectively reflects the green innovation ability of manufacturing enterprises in the actual decision-making environment. The data analyzed were from the 2018 and 2019 Corporate Social Responsibility Reports, Annual Reports, Environmental Reports, Sinofin Database, and State Intellectual Property Office Network.

5.2. Standardization of Index System and Weight Distribution

Anonymous enterprises are represented by the letters A–E. According to the index system established in Table 1, the data are standardized by Formulas (14) and (15), as shown in Table 4.
The qualitative and quantitative index data are collected according to the constructed index system, and the index weight is determined by the combined weighting method of relative entropy. Taking the indicator of the ecostate level as an example, the weight is first calculated by a single-weighting method. Let the weight determined by the AHP be y1. Based on the importance of indicators at all levels scored by experts in the field of green innovation, a two-by-two judgment matrix is established, and y1 = (0.1702, 0.1072, 0.1351, 0.0923, 0.0923, 0.0377, 0.1091, 0.1091, 0.1094) is calculated using MATLAB mathematical tools. The weights obtained by entropy weight method is y2 = (0.0607, 0.2436, 0.1277, 0.1104, 0.0743, 0.0588, 0.0685, 0.0868, 0.0836, 0.0855). The weights obtained by the CV method is y3 = (0.0709, 0.1955, 0.1119, 0.1085, 0.0847, 0.07, 0.0802, 0.0957, 0.0885, 0.0941). Second, the weight distribution coefficient is calculated. Substituting y1, y2, and y3 into formula (6), it is concluded that the indicator aggregation weight is b = (0.09, 0.18, 0.13, 0.10, 0.008, 0.06, 0.06, 0.10, 0.10, 0.10). The closeness between y1, y2, y3, and b is calculated using the relative entropy formula (9): h(y1, b) = 0.0226, h(y2, b) = 0.0085, and h(y3, b) = 0.0038. From Equation (8), the weight distribution coefficients are β1 = 0.6464, β2 = 0.2440, and β3 = 0.1096. Finally, the combined weight is calculated by substituting it into Equation (10). Similarly, the weight indicator of the ecorole level is calculated, and the weight results are shown in Table 5.

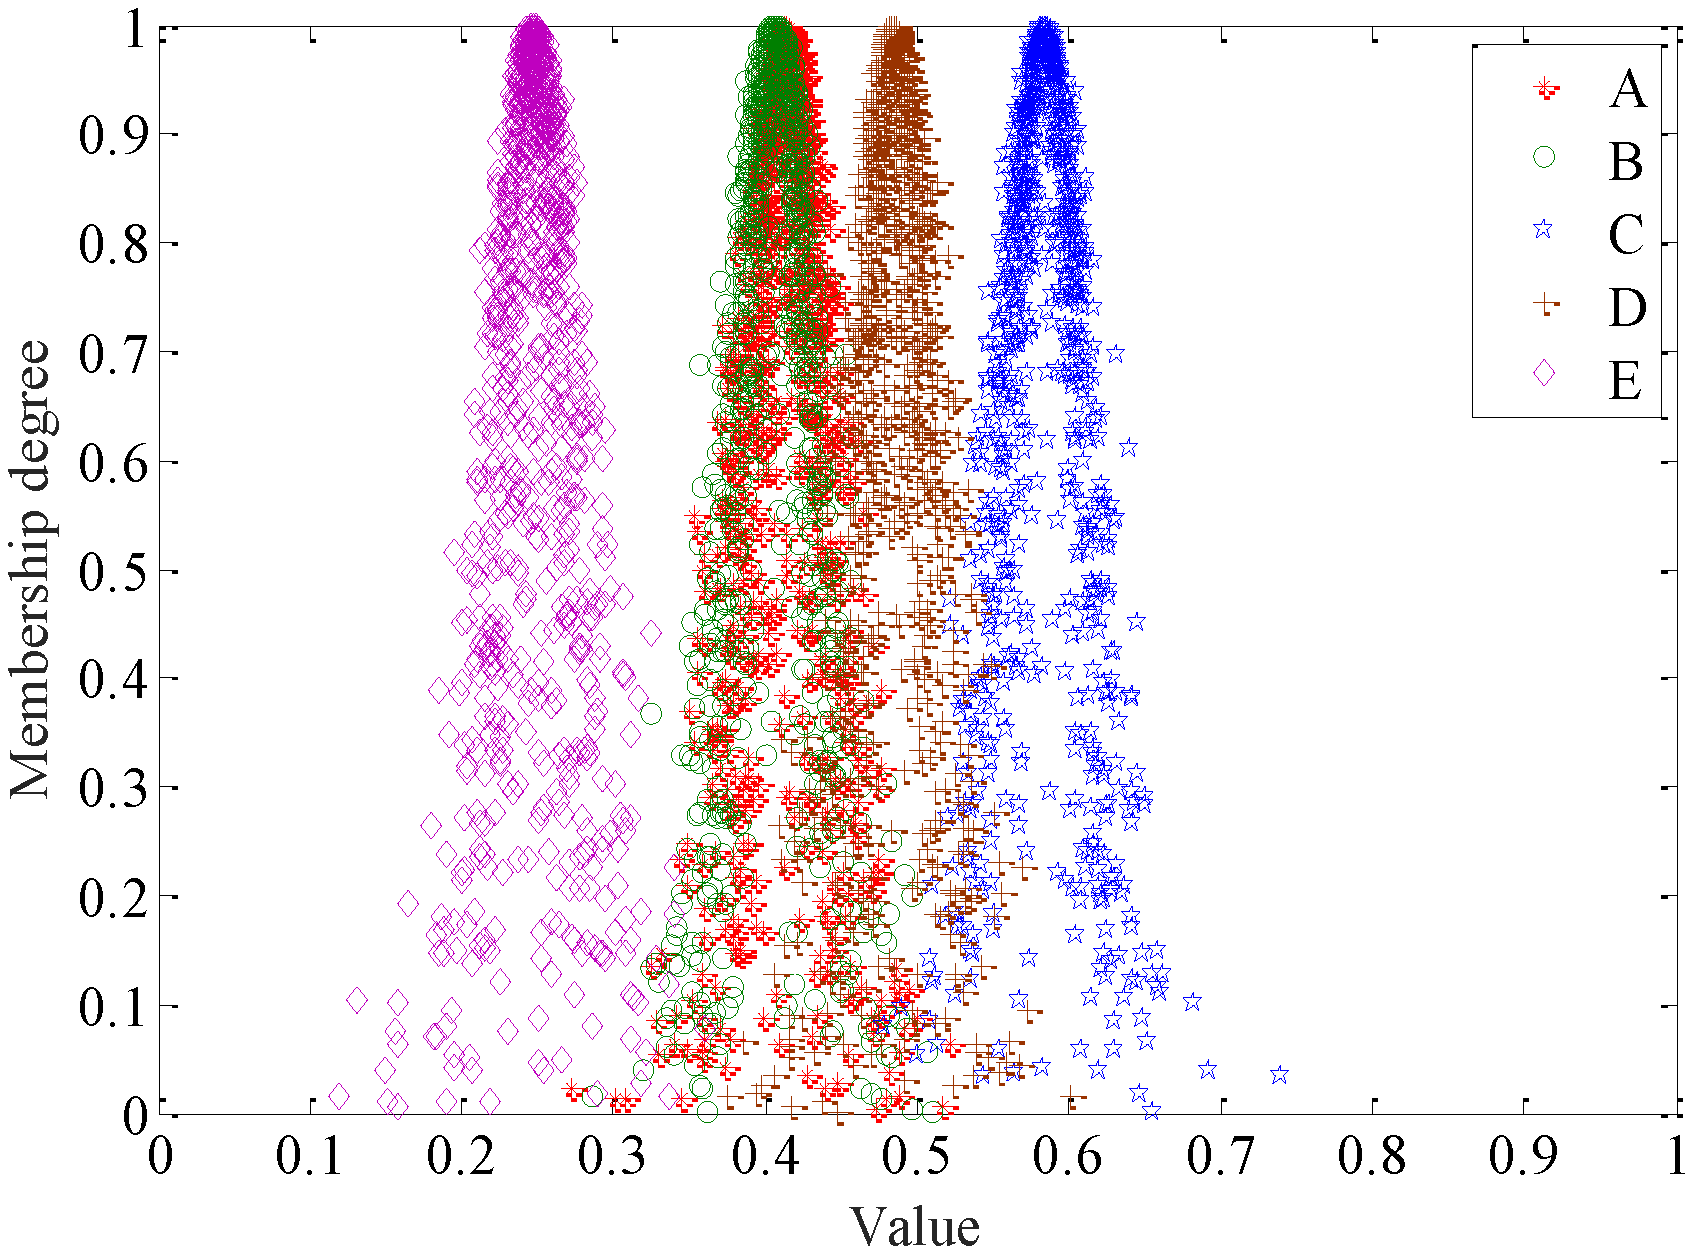
5.3. Determine the Comprehensive Evaluation Cloud Model

The green innovation ability of five enterprises is evaluated by using the constructed index system. According to the comments set in Table 2, the data of each index in Table 3 are transformed into the corresponding comment language values (the Worst, Poor, Medium, Good, and Excellent are replaced by their initials W, P, M, G, and E, respectively), as shown in Table 6.
Convert the qualitative language value of each index in Table 5 into a quantitative value, and the expected value of comments into decision matrix D:
D = [ 1 0 1 1 1 0.5 1 0 0.7 0.3 0.3 0.3 0 0.5 0 0 0 0.5 1 1 0.3 0 0.3 1 0.5 0.3 1 0 0.5 0.3 0.7 1 0.5 0 1 1 0.7 1 0.5 1 1 0 0 0.3 0.7 0 0.3 1 0 0.5 0 1 0 0 0.5 0.7 0 0 0.3 1 0 1 0 0.3 0 ]
Calculate the index Cij and its corresponding one-dimensional cloud model according to the cloud model algorithm. For example, the numerical characteristics of C11 are (0.7, 0.4512, 0.1229). The expectation Ex, entropy En, and hyper entropy He of other indicators are shown in Table 7.
According to the indicator analysis of a multi-level comprehensive cloud, the adjacent indicator cloud is comprehensively calculated using Formula (14). For example, the expectation, entropy, and hyper entropy of the C1 indicator cloud model are calculated as follows:
E x C 1 = 0.7 × 0.4512 × 0.1322 + + 0.52 × 0.4813 × 0.0965 0.4512 × 0.1322 + + 0.4813 × 0.0965 = 0.4639
E n C 1 = 0.4512 × 0.1322 + + 0.4813 × 0.0965 = 0.4182
H e C 1 = 0.1229 × 0.1322 × 0.1322 + + 0.0308 × 0.1005 × 0.1005 0.1322 × 0.1322 + + 0.1005 × 0.1005 = 0.1194
Similarly, the numerical characteristics of C2 can be calculated as (0.4017, 0.3781, 0.1194). According to the numerical characteristics of C1 and C2, the expectation, entropy, and hyper entropy of green innovation capability can be obtained as follows:
E x = 0.4639 × 0.4182 × 0.5556 + 0.4017 × 0.3781 × 0.4444 0.4182 × 0.5556 + 0.3781 × 0.4444 = 0.4378
E n = 0.4182 × 0.5556 + 0.3781 × 0.4444 = 0.4004
H e = 0.1194 × 0.5556 × 0.5556 + 0.1436 × 0.4444 × 0.4444 0.5556 × 0.5556 + 0.4444 × 0.4444 = 0.1289
Therefore, the comprehensive cloud of green innovation capability from the perspective of the ecological niche is (0.4378, 0.4004, 0.1289).
According to the calculation formula of the cloud model, the numerical characteristics of the ecostate dimension of enterprise A’s green innovation ability are as follows:
E x C 1 = 0.1322 × 1 × 0.0167 + + 0.0965 × 0.3 × 0.0333 0.0167 × 0.5556 + + 0.0965 × 0.0333 = 0.5992
E n C 1 = 0.0167 × 0.1322 + + 0.0333 × 0.0965 = 0.0208
H e C 1 = 0.013 × 0.1322 × 0.1322 + + 0.0965 × 0.0965 × 0.008 0.1322 × 0.1322 + + 0.0965 × 0.0965 = 0.0119
Similarly, the numerical characteristics of the ecostate and ecorole of the ecological niche of other enterprises’ green innovation capability are calculated, as shown in Table 8.
Combined with Table 7 and the comprehensive cloud computing formula, the numerical characteristics of the ecological niche of the green innovation capability of five enterprises can be obtained. For example, the numerical characteristics of enterprise A’s green innovation capability are as follows:
E x = 0.5992 × 0.0208 × 0.5556 + 0.2343 × 0.0273 × 0.4444 0.0208 × 0.5556 + 0.0273 × 0.4444 = 0.4122
E n = 0.0208 × 0.5556 + 0.0273 × 0.4444 = 0.0237
H e = 0.0119 × 0.5556 × 0.5556 + 0.0099 × 0.4444 × 0.4444 0.5556 × 0.5556 + 0.4444 × 0.4444 = 0.0112
Similarly, the numerical characteristics of the green innovation capability of other enterprises are shown in Table 9.

5.4. Result Analysis and Discussion

First, this section expounds on the overall ecological situation of green innovation based on the sample enterprises by analyzing the ecostate and ecorole of the ecological niche of the green innovation capability of five enterprises. Then, the ecological status of the green innovation capability of different enterprises is calculated. Finally, the methods are compared and analyzed to verify the accuracy of the evaluation results, and a weight sensitivity analysis is carried out to verify the robustness and stability of the decision-making method.

5.4.1. Analysis of Influencing Factors of Green Innovation Capability

By analyzing the components of ecostate and ecorole, the factors affecting the overall green innovation capability of the sample enterprises are intuitively displayed, and the expectation in Table 6 is drawn as a histogram, as shown in Figure 2.
As can be seen from Figure 3, the ecostate of green R&D is at the “general” level, in which the value of the number of scientific research platforms is lower than other indicators. The number of scientific research platforms reflects the enterprise’s attitude and support of green innovation activities and determines the level of green enterprise innovation investment. Dynamic capability theory holds that to obtain good performance output, enterprises need to creatively integrate multi-party resources and capabilities, promote industry–university–research cooperation and improve the output efficiency of innovation. The ecostate level of environmental management investment in cleaner production is “general.” The government should increase environmental regulation and provide subsidies to promote green innovation, optimize raw material investment, improve production technology, and strengthen the implementation of cleaner production. However, the value of the “three waste emissions per unit profit” is low, while other green marketing indicators are medium. This shows that the overall green innovation marketing of sample enterprises needs to be strengthened. The realization degree of green innovation achievements depends on the market acceptance degree, and ecological marketing can significantly improve the market acceptance degree of technological innovation achievements. The national 13th five-year plan proposes to strengthen the pace of resource conservation and environmental protection, carry out green R&D, cleaner production and green marketing, and promote the sustainable development of the manufacturing industry. At present, the green innovation of manufacturing enterprises has not yet created a scale effect, and the awareness of environmental protection and resource utilization are also low.
As for the dimension of ecorole, the levels of profit growth rate and patent application growth rate are “poor.” The government needs to take control and implement market-incentive environmental regulations to affect the green innovation behavior of enterprises. This will encourage enterprises to increase resource investment, improve the transformation efficiency of green R&D, and convert patents into products that can obtain market profits. Overall, the market share of the sample enterprises has a large room for growth. This is compatible with China’s current industrial structure adjustment, forcing the closure of highly polluting factories, promoting the greening of production services, and implementing the green transformation and upgrading of manufacturing enterprises. Additionally, while pursuing economic benefits through green innovation, enterprises also publicize the innovative concept of protecting the ecological environment, which will win the favor and recognition of consumers.

5.4.2. Evaluation Results of the Green Innovation Capability of Different Enterprises

To more intuitively display the ecostate, ecorole, and comprehensive ecological niche value of the green innovation capacity of the five enterprises, combined with the numerical characteristics of the cloud in Table 7 and Table 8, MATLAB programming was used to run the forward cloud generator in order to generate the corresponding cloud images containing 1600 cloud droplets, as shown in Figure 3, Figure 4 and Figure 5.
As shown in Figure 3, the order of the ecostate values of the green innovation capability of different enterprises is A > C > D > E > B. The ecostate value of Enterprise B’s green innovation capability is the lowest. From the analysis, it can be concluded that the R&D investment intensity in green R&D, the number of scientific research platforms, and the energy consumption per unit profit in the end treatment have become the main factors affecting the low level of green innovation. Green innovation requires more complex and diversified knowledge and skills. Enterprise B needs to creatively integrate multiple resources and capabilities, increase R&D investment, increase cooperation with scientific research institutes and universities, and have the opportunity to promote industry–university research cooperation. It also needs to obtain diversified and complementary knowledge and other R&D resources externally so as to realize high-level green innovation. Simultaneously, an improvement of the production process and the reduction of energy consumption are required.
It can be seen from Figure 4 that the order of ecorole values of the green innovation capability of different enterprises is C > D > B > A > E. The direct reason for the worst ranking of enterprise E is that it is affected by profit growth rate and patent application growth rate; the deeper reason is that its green R&D investment intensity is poor, so the growth rate of patent application is low and the achievement conversion rate is also low, resulting in the low profit growth rate of the enterprise. Enterprises in emerging economies have the advantage of backwardness in global green innovation and progress. Enterprise E needs to increase green R&D investment, such as what Huawei, Haier, and TCL have accomplished, to obtain advanced technology and knowledge and improve the patent application rate, so as to improve the achievement conversion rate. Simultaneously, the green production behavior of enterprises can significantly improve the organizational ability, including the coordination ability of stakeholders, higher learning ability, and sustainable innovation ability, which can bring more market benefits to enterprises.
It can be seen from Figure 5 that the order of the comprehensive niche value of the green innovation capability of different enterprises is C > D > A > B > E. Enterprise C only has a small number of scientific research platforms, so it needs to strengthen its construction of scientific research platforms, strengthen cooperation with universities and research institutes, and improve its capacity for green innovation according to the actual needs of the market. According to the figure above, the comprehensive ecological niche value of Enterprise A ranks third. The direct factor affecting its ranking is the low level of ecorole, and the deep-seated reasons include: first, the large investment in green R&D and cleaner production slows down the growth rate and delays the benefit period; second, the dynamic capacity of enterprise knowledge resources only stays at the acquisition level and does not form an effective core competence. The enterprise is the main body of knowledge, and the basic role of the organization is to acquire, absorb, and use knowledge. Enterprise C needs to enhance the absorption capacity within the organization and improve the output efficiency of green innovation. In view of the low comprehensive ecological niche value of Enterprise B, it is suggested that the enterprise should increase its investment intensity in green R&D and cleaner production, shut down highly polluting plants, improve awareness of protecting the ecological environment, and improve their strategic position of resource utilization. In view of the low niche level of Enterprise B, it is suggested that the enterprise must increase its investment intensity in green R&D and cleaner production. The implementation of cleaner production will improve the performance of enterprises, not only the direct financial performance, but also the internal operation status and external market environment of the enterprise. The enterprise is also advised to shut down highly polluting plants, improve their awareness of protecting the ecological environment, and improve their strategic position of resource utilization. A characteristic of emerging markets is the existence of institutional gaps, which may lead to lack of law enforcement, corruption, transaction uncertainty, and market instability. The government will have to effectively fill these institutional gaps by formulating and implementing environmental regulations in order to lead enterprises to choose green innovation strategies.

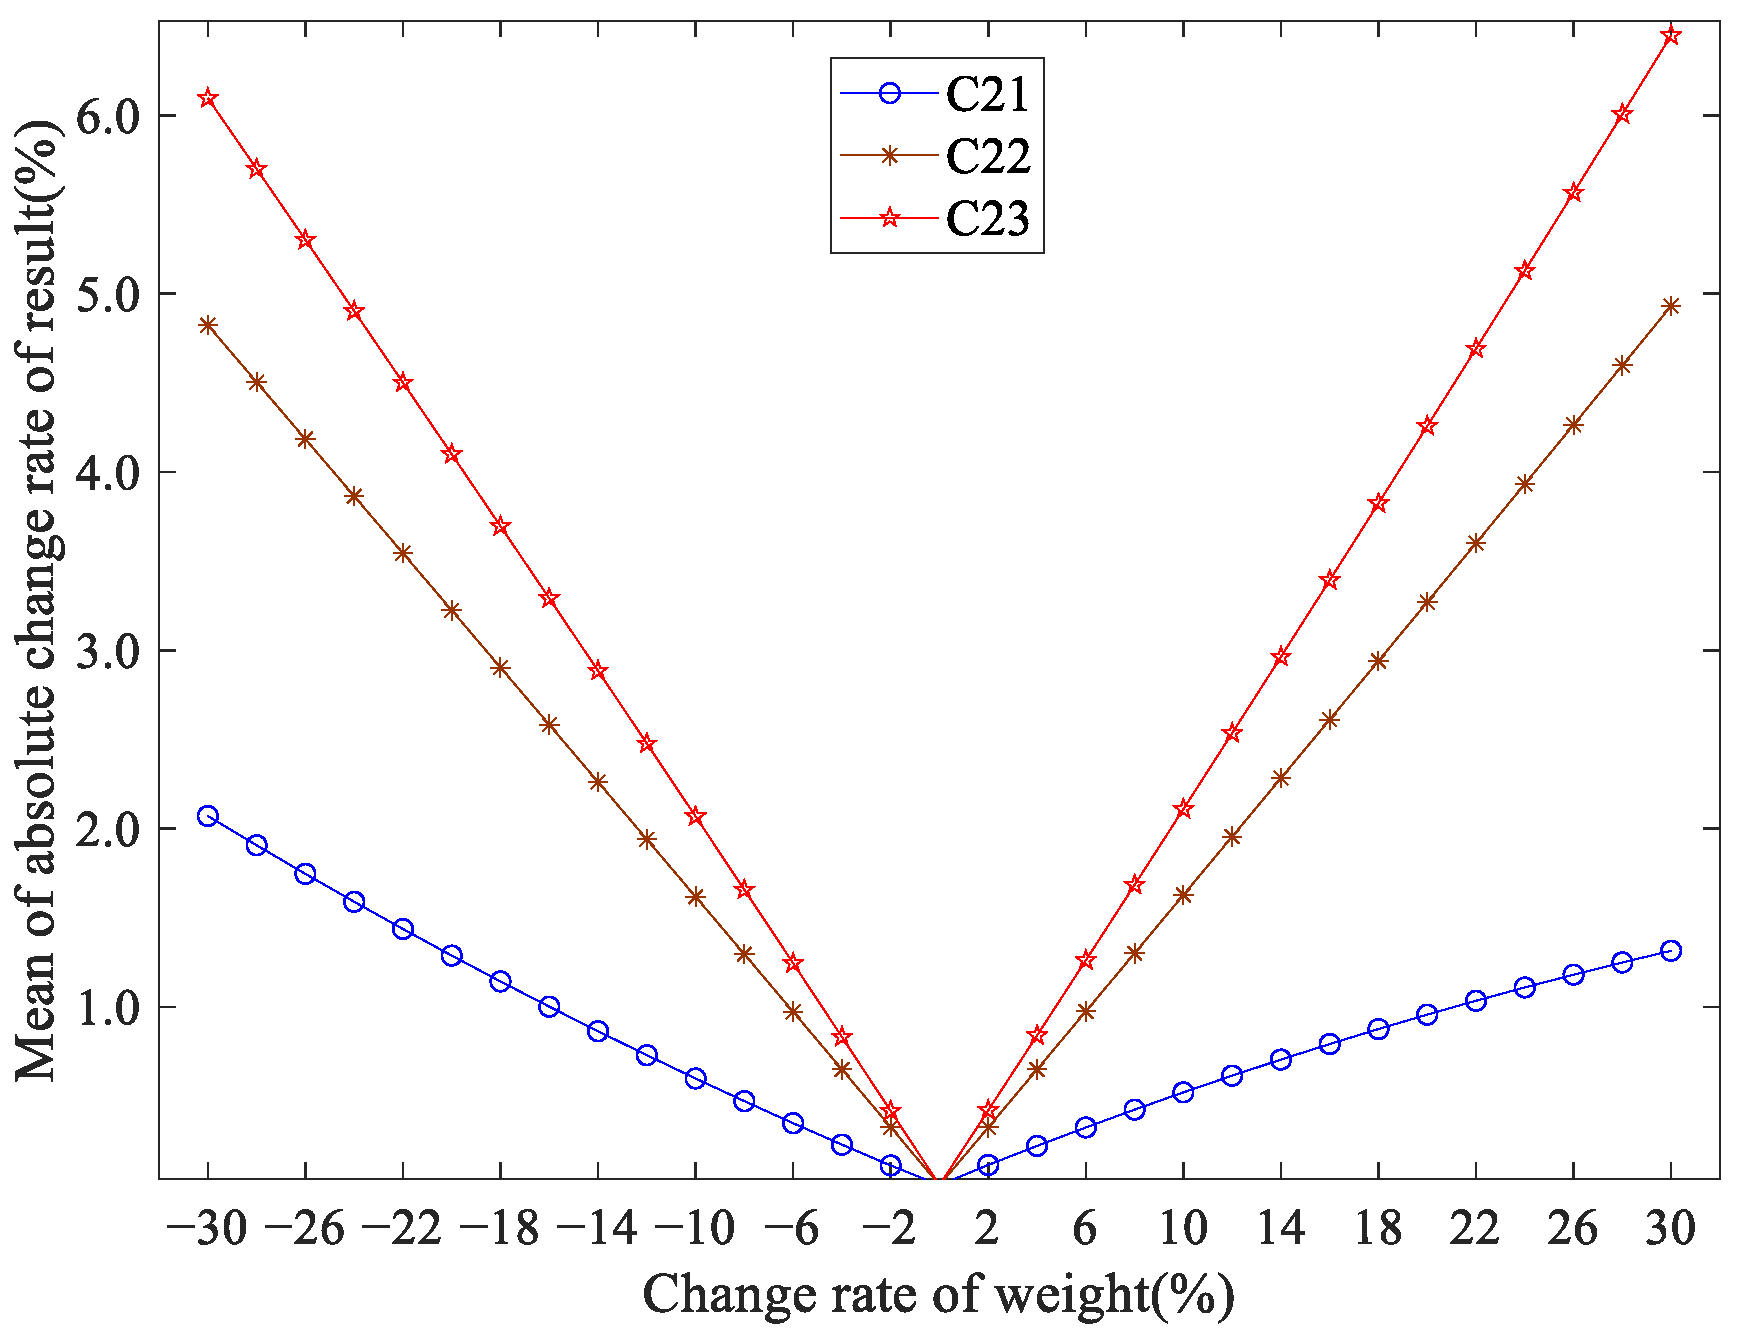
5.5. Sensitivity Analysis

5.5.1. Weight Sensitivity Analysis Framework

In this study, the one-at-a-time (OAT) [67] was used to test the sensitivity of the weight indicator. Through sensitivity analysis, it could be determined that the potential change in the evaluation criteria weight would lead to a deviation in the decision results, which is the key to the effective use of the model and the implementation of quantitative decision making. The specific steps are as follows [68]:
(1) Calculate weights. Set the range and step size of specific weight change to ± 30% and ± 2% [69], and the new adjustment weight of sensitivity is calculated using the following formula:
w j ¯ ( c r ) = ( 1 + c r ) × w j
where w j ¯ ( c r ) is the specific weight change; c r is the change rate of weight; w j is the original weight of the j-th index. The calculation formula of other weights is as follows:
w i ¯ ( c r ) = w i × 1 w j ¯ 1 w j
where w i ¯ ( c r ) is other weight adjusted by w j , i.e., i j and w i is the initial weight of the i-th index.
(2) As a traditional statistical method, the mean of the absolute change rate (MACR) can summarize the sensitive results based on the uncertainty of input parameters and display the uncertainty of evaluation results. Therefore, this study uses MACR [70] to calculate the overall index sensitivity of the sample, and the calculation formula is as follows:
MACR ( w j ¯ ( c r ) ) = k = 1 N 1 N × | R k ( w j ¯ ( c r ) ) R 0 R 0 | × 100 %
where MACR ( w j ¯ ( c r ) ) is the mean of absolute change rate of w j ¯ ( c r ) ; with the change of w j ¯ ( c r ) , the evaluation value of the k-th evaluation object is R k ( w j ¯ ( c r ) ) ; R 0 is the initial evaluation value. The higher the MACR value, the higher the sensitivity.
Select representative indicators: the number of scientific research platforms and the patent application growth rate as specific weights; the weight change rates are 10%, 20%, and ± 30%. The expectation of the cloud model of the green innovation capability of different enterprises are shown in Table 10.
It can be seen from Table 9 that the expectation of E is the smallest and that of C is the largest in the experiment, and the ranking of innovation capability is the same. When the weight change rate is −30%, A ranks fourth (in other cases, it ranks third), and A is more sensitive to C23 than other enterprises. In conclusion, the decision-making method in this study is relatively insensitive to changes in weight.
When the weight of each indicator changes from −30% to +30% and the step is 2%, the mean of the absolute change rate of the evaluation results of enterprise green innovation capability is summarized by MACR according to the change in weight (Figure 6 and Figure 7).
It can be seen from Figure 6 and Figure 7 that the MACR value increases linearly with the change rate of weight, but there are different gradients for different indicators. The MACR values of the same indicator are almost equal, with the same absolute change rate but with positive and negative values, indicating that the sensitivity to the changes in positive and negative weights is similar. The higher the gradient, the greater the change in the green innovation capability evaluation value with the weight change, and the higher the indicator’s sensitivity. The MACR ranking of each indicator follows the order of weight. Taking the 30% change rate as an example, C12 and C23 are the most sensitive indicators of weight change, and their MACR values are equal to 2.1267% and 6.0972%, respectively, whereas C16 and C21 are the least sensitive indicators, and their MACRs are only 0.1358% and 2.0705%, respectively. The MACR of the simulation results is significantly lower than the change rate of weight, indicating that the evaluation results are relatively robust. The MACRs provide information on the numerical changes in the evaluation values of green innovation capability, indicating the sensitivity of indicators associated with the size of the weights for different indicators. This result is consistent with that of a previous study [70].

5.5.2. Comparative Analysis

The coefficient of the variation-entropy weight method [71] and the grey correlation-TOPSIS method [72] were used to make decisions on the example, and the decision results obtained by the two methods are compared with the decision results of the method in this study. The results are presented in Table 11.
The results of the comparison method are relatively consistent with the ranking results obtained using the cloud model method. Only the ranking of A obtained by the coefficient of the variation-entropy weight method is inconsistent. The main reason is that the coefficient of the variation-entropy weight method is more sensitive to the amount of indicator information. The corresponding weight of indicators with a large amount of information is greater, weighting results are contrary to practical experience, and there is a lack of expert judgment on the green innovation capability of enterprises, resulting in deviations in the evaluation results. The ranking results obtained by the grey correlation-TOPSIS method are the same as those obtained by the cloud model method, but the accurate numerical method fails to consider the fuzziness and randomness of the evaluation value. It cannot compare the entropy and hyper entropy evaluation values through the cloud map. Therefore, we believe that the proposed method is effective and stable.

6. Conclusions and Prospect

Evaluating the green innovation capability of manufacturing enterprises is a complex activity that affects the market position and development strategy of enterprises. Based on niche theory, this study constructed an evaluation method for enterprise green innovation ability by using a cloud model tool. This method can comprehensively consider the impact of various subjective and objective factors in green innovation capability, which is conducive to making rapid innovation decisions according to market changes and needs.
The main contributions are as follows:
(1) Based on niche situation theory, this study constructed an evaluation index system of the green innovation capability of enterprises based on three areas: R&D, production, and marketing. This study analyzed the enterprise’s green innovation capability from the perspective of ecostate and ecorole, reflected the differential characteristics of green enterprise innovation, and widened the application scope of the niche situation theory.
(2) Using the combination weighting method of relative entropy and comprehensively considering AHP, entropy, and CV, the weight was obtained, which avoided the one-sidedness of the single weighting method. Simultaneously, it could reflect essential characteristics such as nonlinearity and the emergence of complex systems to obtain the results objectively.
(3) The evaluation model of green innovation capability was established using the cloud model theory. The evaluation indicator value of green innovation capability was transformed to the comment value so that the evaluation framework considered the fuzziness of the commentary interval and its randomness.
(4) Empirical research showed that this method could effectively evaluate the green innovation capability of enterprises, and the sensitivity analysis results showed that the proposed method is stable. This method provides a scientific basis for the evaluation standard in green innovation and the optimization path of enterprise green innovation.
In addition, the results of the empirical analysis provided some enlightenment to Chinese manufacturing enterprises that would help them to improve their green innovation ability. First, enterprises need to integrate multiple resources and capabilities, combine market incentives (special support fund and green credit), promote industry university research cooperation, and increase R&D investment to stimulate green innovation. Second, enterprises need to promote green innovation, optimize raw material investment, improve production processes, and strengthen the implementation of cleaner production in accordance with environmental regulatory policies (production technology standards and pollutant emission standards). Third, they must strengthen the organization, coordination, and control of all links in product manufacturing, and make full use of modern energy-saving and emission-reduction technologies in order to improve the utilization of materials. Fourth, enterprises must build a perfect intellectual property system to improve the patent application rate and conversion rate by increasing R&D investment and introducing high-quality R&D talents. Finally, enterprises need to make full use of market incentive policies, carry out research on key projects, break through the bottleneck of green technology, improve innovation ability, and implement the transformation to green and intelligent manufacturing.
However, this study has some limitations and deficiencies. During the construction of the index system, some factors may have been ignored, which may have affected the evaluation results. It is impossible to conduct extensive and sufficient empirical tests owing to the lack of a large number of samples. Therefore, future studies will have to expand the sample range, test, and improve the evaluation index system and model.

Author Contributions

Conceptualization, Y.S. and J.X.; formal analysis, Y.S.; investigation, J.X.; methodology, Y.S.; writing—original draft preparation, Y.S.; writing—review and editing, Y.S.; supervision, J.X. All authors have read and agreed to the published version of the manuscript.

Funding

This research was funded by the Natural Science Foundation of Heilongjiang Province (LH2019G014), the National Natural Science Foundation on Emergency Management Project of China (71841054), the Key Research Topics of Economic and Social Development in Heilongjiang Province (19023).

Institutional Review Board Statement

Not applicable.

Informed Consent Statement

Not applicable.

Data Availability Statement

Not applicable.

Conflicts of Interest

The authors declare no conflict of interest.

References

  1. Mongo, M.; Belaïd, F.; Ramdani, B. The effects of environmental innovations on CO2 emissions: Empirical evidence from Europe. Environ. Sci. Policy 2021, 118, 1–9. [Google Scholar] [CrossRef]
  2. Sun, L.; Miao, C.; Yang, L. Ecological-economic efficiency evaluation of green technology innovation in strategic emerging industries based on entropy weighted TOPSIS method. Ecol. Indic. 2017, 73, 554–558. [Google Scholar] [CrossRef]
  3. Hu, D.; Jiao, J.; Tang, Y.; Han, X.; Sun, H. The effect of global value chain position on green technology innovation efficiency: From the perspective of environmental regulation. Ecol. Indic. 2021, 121, 107195. [Google Scholar] [CrossRef]
  4. Brunel, C. Green innovation and green Imports: Links between environmental policies, innovation, and production. J. Environ. Manag. 2019, 248, 109290. [Google Scholar] [CrossRef]
  5. Seol, H.; Park, G.; Lee, H.; Yoon, B. Demand forecasting for new media services with consideration of competitive relationships using the competitive Bass model and the theory of the niche. Technol. Forecast. Soc. 2012, 79, 1217–1228. [Google Scholar] [CrossRef]
  6. Xu, X.; Wang, Z. The K-r selecting strategy of enterprise niche. Manag. Rev. 2006, 18, 35–40. [Google Scholar]
  7. Aguilera-Caracuel, J.; Ortiz-de-Mandojana, N. Green Innovation and Financial Performance: An Institutional Approach. Organ. Environ. 2013, 26, 365–385. [Google Scholar] [CrossRef]
  8. Shu, C.; Zhou, K.Z.; Xiao, Y.; Gao, S. How Green Management Influences Product Innovation in China: The Role of Institutional Benefits. J. Bus. Ethics. 2014, 133, 471–485. [Google Scholar] [CrossRef] [Green Version]
  9. Wang, Y.; Yu, L. Can the current environmental tax rate promote green technology innovation?—Evidence from china’s resource-based industries. J. Clean. Prod. 2021, 278, 123443. [Google Scholar] [CrossRef]
  10. Jang, E.; Park, M.; Roh, T.; Han, K. Policy Instruments for Eco-Innovation in Asian Countries. Sustainability 2015, 7, 12586–12614. [Google Scholar] [CrossRef] [Green Version]
  11. Guo, Y.; Xia, X.; Zhang, S.; Zhang, D. Environmental Regulation, Government R&D Funding and Green Technology Innovation: Evidence from China Provincial Data. Sustainability 2018, 10, 940. [Google Scholar] [CrossRef] [Green Version]
  12. Lai, X.; Liu, J.; Georgiev, G. Low carbon technology integration innovation assessment index review based on rough set theory—An evidence from construction industry in China. J. Clean. Prod. 2016, 126, 88–96. [Google Scholar] [CrossRef]
  13. Tian, X.; Niu, M.; Zhang, W.; Li, L.; Herrera-Viedma, E. A novel todim based on prospect theory to select green supplier with q-rung orthopair fuzzy set. Technol. Econ. Dev. Econ. 2020, 27, 1–27. [Google Scholar] [CrossRef]
  14. Zhang, J.; Xie, S.; Li, H. Positioning and Priorities of Growth Management in Construction Industrialization: Chinese Firm-Level Empirical Research. Sustainability 2017, 9, 1105. [Google Scholar] [CrossRef] [Green Version]
  15. García-Granero, E.M.; Piedra-Muñoz, L.; Galdeano-Gómez, E. Eco-innovation measurement: A review of firm performance indicators. J. Clean. Prod. 2018, 191, 304–317. [Google Scholar] [CrossRef]
  16. Sui, J.; Bi, K.; Yang, C.; Liu, G. Research on the factors of innovation performance of manufacturing green innovation system: From the perspective of MNCs’technology transfer. Stud. Sci. Sci. 2015, 33, 440–448. [Google Scholar]
  17. Veroutis, A.; Aelion, V. Design for environment: An implementation framework. Environ. Qual. Manag. 1996, 5, 55–68. [Google Scholar] [CrossRef]
  18. Wang, H.; Lian, X.; Lin, D. Effects of Green Technological Innovation Efficiency on Regional Green Growth Performance: An Empirical Analysis. Sci. Sci. Manag. S. T. 2016, 37, 80–87. [Google Scholar]
  19. Huang, L.; Zhao, X. Impact of financial development on trade-embodied carbon dioxide emissions: Evidence from 30 provinces in China. J. Clean. Prod. 2018, 198, 721–736. [Google Scholar] [CrossRef]
  20. Han, H.; Yang, Y.; Zhang, R.; Brekhna, B. Factors and Paths of Transformation and Upgradation of Chemical Industry in Shandong, China. Sustainability 2020, 12, 3443. [Google Scholar] [CrossRef] [Green Version]
  21. Chen, W.; Wang, X.; Peng, N.; Wei, X.; Lin, C. Evaluation of the Green Innovation Efficiency of Chinese Industrial Enterprises: Research Based on the Three-Stage Chain Network SBM Model. Math. Probl. Eng. 2020, 2020, 1–11. [Google Scholar] [CrossRef]
  22. Yuan, B.; Xiang, Q. Environmental regulation, industrial innovation and green development of Chinese manufacturing: Based on an extended CDM model. J. Clean Prod. 2018, 176, 895–908. [Google Scholar] [CrossRef]
  23. Fang, Z.; Bai, H.; Bilan, Y. Evaluation Research of Green Innovation Efficiency in China’s Heavy Polluting Industries. Sustainability 2019, 12, 146. [Google Scholar] [CrossRef] [Green Version]
  24. Bi, K.; Yang, C.; Huang, P. Study on the Regional Difference and Influencing Factors of Green Process Innovation Performance in China. China Ind. Econ. 2013, 22, 57–69. [Google Scholar]
  25. Luo, Q.; Miao, C.; Sun, L.; Meng, X.; Duan, M. Efficiency evaluation of green technology innovation of China’s strategic emerging industries: An empirical analysis based on Malmquist-data envelopment analysis index. J. Clean. Prod. 2019, 238, 117782. [Google Scholar] [CrossRef]
  26. Zhang, F.; Song, X.; Dong, H. Analysis of the Green Competitiveness Index of Manufacturing Industry and Its Evolution Characteristics of Time and Space Pattern in Guangdong-Hong Kong-Macao Greater Bay Area. China Soft Sci. Mag. 2019, 10, 70–89. [Google Scholar]
  27. Portillo-Tarragona, P.; Scarpellini, S.; Moneva, J.; Valero-Gil, J.; Aranda-Usón, A. Classification and Measurement of the Firms’ Resources and Capabilities Applied to Eco-Innovation Projects from a Resource-Based View Perspective. Sustainability 2018, 10, 3161. [Google Scholar] [CrossRef] [Green Version]
  28. Mainali, B.; Silveira, S. Using a sustainability index to assess energy technologies for rural electrification. Renew. Sustain. Energy Rev. 2015, 41, 1351–1365. [Google Scholar] [CrossRef]
  29. Wang, C.; Wang, L.; Dai, S. An indicator approach to industrial sustainability assessment: The case of China’s Capital Economic Circle. J. Clean. Prod. 2018, 194, 473–482. [Google Scholar] [CrossRef]
  30. Shin, J.; Kim, C.; Yang, H. Does Reduction of Material and Energy Consumption Affect to Innovation Efficiency? The Case of Manufacturing Industry in South Korea. Energies 2019, 12, 1178. [Google Scholar] [CrossRef] [Green Version]
  31. Luo, L.; Liang, S. Study on the efficiency and regional disparity of green technology innovation in China’s industrial companies. Chin. J. Popul. Resour. Environ. 2016, 14, 262–270. [Google Scholar] [CrossRef]
  32. Djoumessi, A.; Chen, S.; Cahoon, S. Factors influencing innovation in maritime clusters: An empirical study from Australia. Mar. Policy 2019, 108, 103558. [Google Scholar] [CrossRef]
  33. Ntiamoah, E.B.; Li, D.; Sarpong, D.B. The effect of innovation practices on agribusiness performance: A structural equation modelling (SEM) approach. Afr. J. Sci. Technol. Innov. Dev. 2019, 11, 671–681. [Google Scholar] [CrossRef]
  34. Li, Q. Regional technological innovation and green economic efficiency based on DEA model and fuzzy evaluation. J. Intell. Fuzzy Syst. 2019, 37, 6415–6425. [Google Scholar] [CrossRef]
  35. Musaad, O.A.S.; Zhuo, Z.; Siyal, Z.A.; Shaikh, G.M.; Shah, S.A.A.; Solangi, Y.A.; Musaad, O.A.O. An Integrated Multi-Criteria Decision Support Framework for the Selection of Suppliers in Small and Medium Enterprises based on Green Innovation Ability. Processes 2020, 8, 418. [Google Scholar] [CrossRef] [Green Version]
  36. Zhang, M.; Li, B. How to Improve Regional Innovation Quality from the Perspective of Green Development? Findings from Entropy Weight Method and Fuzzy-Set Qualitative Comparative Analysis. IEEE Access 2020, 8, 32575–32586. [Google Scholar] [CrossRef]
  37. Qiu, B.; Lou, D. A Grey Multi-Level Evaluation of Industrial Park Ecology Based on a Coefficient of Variation-Attribute Hierarchy Model. Sustainability 2021, 13, 1805. [Google Scholar] [CrossRef]
  38. Grinnell, J. The Niche-Relationships of the California Thrasher. Auk 1917, 34, 427–433. [Google Scholar] [CrossRef]
  39. Zhu, C. The niche ecostate-ecorole theory and expansion hypothesis. Acta Ecol. Sin. 1997, 17, 324–332. [Google Scholar]
  40. Chen, Y.; Chen, G. Dynamic Effect of High-tech Enterprise Certification Policy on Technological Niche: Evidences from A-share Listed Companies. Sci. Technol. Prog. Policy 2021, 38, 105–114. [Google Scholar]
  41. Wan, L. Study on the Ecological Niche of Enterprises and the Method for Measuring the Ecological Niche. China Soft Sci. Mag. 2004, 1, 73–78. [Google Scholar]
  42. Yan, A. Research on Construction of Evaluation Indexes and Model of Organization Niche. Sci. Technol. Prog. Policy 2007, 24, 156–160. [Google Scholar]
  43. He, Y.; Wu, J. Research on the impact of enterprise niche on inter-organizational technology collaborative innovation. Stud. Sci. Sci. 2020, 38, 1108–1120. [Google Scholar]
  44. Meng, F.; Tian, Z.; Chang, B.; Yu, H.; Zhang, S. Research on the Niche Evolution Game of Ecological Community Innovation of Corporate Venture Capital Based on Logistic Extended Complexity Model. Complexity 2020, 2020, 1–13. [Google Scholar] [CrossRef]
  45. Greve, H.R.; Rao, H. If It Doesn’t Kill You: Learning from Ecological Competition. Adv. Strateg. Manag. 2006, 23, 243–271. [Google Scholar]
  46. Bakker, S.; Lente, H.V.; Engels, R. Competition in a technological niche: The cars of the future. Technol. Anal. Strateg. 2012, 24, 421–434. [Google Scholar] [CrossRef]
  47. Song, Y.; Shao, L.; You, J. Electric Vehicle Enterprise Niche Evaluation Research in the Complementary Assets Perspective. Manag. Rev. 2015, 27, 108–119. [Google Scholar]
  48. Smith, A.; Voß, J.; Grin, J. Innovation studies and sustainability transitions: The allure of the multi-level perspective and its challenges. Res. Policy 2010, 39, 435–448. [Google Scholar] [CrossRef]
  49. Kim, S.; Nguyen, V.T. An AHP Framework for Evaluating Construction Supply Chain Relationships. KSCE J. Civ. Eng. 2018, 22, 1544–1556. [Google Scholar] [CrossRef]
  50. Wang, Q.; Wu, C.; Sun, Y. Evaluating corporate social responsibility of airlines using entropy weight and grey relation analysis. J. Air Transp. Manag. 2015, 42, 55–62. [Google Scholar] [CrossRef]
  51. Vu, T.T.H.; Tian, G.; Khan, N.; Zada, M.; Zhang, B.; Nguyen, T.V. Evaluating the International Competitiveness of Vietnam Wood Processing Industry by Combining the Variation Coefficient and the Entropy Method. Forests 2019, 10, 901. [Google Scholar] [CrossRef] [Green Version]
  52. Li, D.; Liu, C.; Gan, W. A new cognitive model: Cloud model. Int. J. Intell. Syst. 2009, 24, 357–375. [Google Scholar] [CrossRef]
  53. Peng, Z.; Zhang, A.; Wang, S.; Bai, Y. Designing principles and constructing processes of the comprehensive evaluation indicator system. Sci. Res. Manag. 2017, 38, 209–215. [Google Scholar]
  54. Peng, B.; Zheng, C.; Wei, G.; Elahi, E. The cultivation mechanism of green technology innovation in manufacturing industry: From the perspective of ecological niche. J. Clean. Prod. 2020, 252, 119711. [Google Scholar] [CrossRef]
  55. Xiao, S.; Shi, Q.; Zhang, Y. The Construction of Listed Companies’ Innovation Capability Index. J. Beijing Inst. Technol. (Soc. Sci. Ed.) 2020, 22, 57–69. [Google Scholar]
  56. Yin, S.; Zhang, N.; Li, B. Enhancing the competitiveness of multi-agent cooperation for green manufacturing in China: An empirical study of the measure of green technology innovation capabilities and their influencing factors. Sustain. Prod. Consum. 2020, 23, 63–76. [Google Scholar] [CrossRef]
  57. Tian, H.; Sun, Q. Research on Capability Evaluation of Green Technology Innovation of Carmakers Based on Cloud Model. Manag. Rev. 2020, 32, 102–114. [Google Scholar]
  58. Li, Y.; Chen, Y.; Li, Q. Assessment analysis of green development level based on S-type cloud model of Beijing-Tianjin-Hebei, China. Renew. Sustain. Energy Rev. 2020, 133, 110245. [Google Scholar] [CrossRef]
  59. Liu, J.; Sun, L.; Wang, J. Research on evaluation system of technological innovation capability in high-tech enterprises. Sci. Res. Manag. 2009, 30, 19–23. [Google Scholar]
  60. Luo, Y.; Li, Y. Comprehensive decision-making of transmission network planning based on entropy weight and grey relational analysis. Power Syst. Technol. 2013, 37, 77–81. [Google Scholar]
  61. Rao, C.; Yong, Z. Multi-attribute decision making model based on optimal membership and relative entropy. J. Syst. Eng. Electron. 2009, 20, 537–542. [Google Scholar]
  62. Su, Y.; Meng, X.; Kang, Q.; Han, X. Dynamic virtual network reconfiguration method for hybrid multiple failures based on weighted relative entropy. Entropy 2018, 20, 711. [Google Scholar] [CrossRef] [Green Version]
  63. Geng, X.; Xu, Y. Analysis of engineering characteristics importance degree of product service system combining cloud model and QFD. Comput. Integr. Manuf. Syst. 2018, 24, 1494–1502. [Google Scholar]
  64. Zhang, X.; Liu, Z.; Jia, C. A novel marine traffic safety assessment based on cloud models. In Proceedings of the Second International Workshop on Education Technology and Computer Science (ETCS 2010), Wuhan, China, 6–7 March 2010; pp. 60–63. [Google Scholar]
  65. Kavousi-Fard, A.; Niknam, T.; Fotuhi-Firuzabad, M. A novel stochastic framework based on cloud theory and h-modified bat algorithm to solve the distribution feeder reconfiguration. IEEE Trans. Smart Grid 2016, 7, 740–750. [Google Scholar] [CrossRef]
  66. Wu, H.; Wang, D.; Zhang, Q.; Zhang, Z. Evaluation and Comparative Study on Competitiveness of International Cruise Ports Based on Cloud Model. China Soft Sci. Mag. 2015, 2, 166–174. [Google Scholar]
  67. Zhao, X.; Ye, Y.; Zhou, J.; Liu, L.; Dai, W.; Wang, Q.; Hu, Y. Comprehensive evaluation of cultivated land quality and sensitivity analysis of index weight in hilly region of Pearl River Delta. Trans. Chin. Soc. Agric. Eng. 2017, 33, 226–235. [Google Scholar]
  68. Chen, Y.; Yu, J.; Khan, S. The spatial framework for weight sensitivity analysis in AHP-based multi-criteria decision making. Environ. Model. Softw. 2013, 48, 129–140. [Google Scholar] [CrossRef]
  69. Li, P.; Qian, H.; Wu, J.; Chen, J. Sensitivity analysis of TOPSIS method in water quality assessment: I. Sensitivity to the parameter weights. Environ. Monit. Assess. 2013, 185, 2453–2461. [Google Scholar] [CrossRef]
  70. Xu, E.; Zhang, H. Spatially-explicit sensitivity analysis for land suitability evaluation. Appl. Geogr. 2013, 45, 1–9. [Google Scholar] [CrossRef]
  71. Dong, W.; Chen, Q. Regional Development Structural Differences and Cooperative Development Path of Cities in Beijing-Tianjin-Hebei Urban Agglomeration. J. Ind. Technol. Econ. 2019, 38, 41–48. [Google Scholar]
  72. Wu, C.; Guo, L.; Yu, J. Evaluation Model and Empirical Study of Regional Green Growth System Based on TOPSIS and Grey Relational Analysis. Manag. Rev. 2017, 29, 228–239. [Google Scholar]
Figure 1. Flow chart of evaluation model.
Sustainability 13 11710 g001
Figure 2. Flow chart of evaluation model.
Sustainability 13 11710 g002
Figure 3. Cloud model of the ecostate value of green innovation capability.
Sustainability 13 11710 g003
Figure 4. Cloud model for the ecorole values of green innovation capability.
Sustainability 13 11710 g004
Figure 5. Cloud model of the comprehensive ecological niche values of green innovation capability.
Sustainability 13 11710 g005
Figure 6. Sensitivity analysis of the weight indicator at the ecostate level.
Sustainability 13 11710 g006
Figure 7. Sensitivity analysis of the weight indicator at the ecorole level.
Sustainability 13 11710 g007
Table 1. Brief Review.
ThemeClassificationPerspectiveCharacteristics
Green innovation Index system Innovation process [12,13,14] Relevant studies mainly focus on exploring one or two types of green innovation (technology, production, or marketing), and lack the combination of key indicators, including the whole process of innovation.
Inputs and outputs [18,19,20] Scholars mainly focus on the green innovation model, efficiency, and methods at the regional or industrial level, and few studies analyze the green innovation ability of enterprises based on the niche theory.
Economic, environmental, and social factors [25,26,27]
Method DEA, AHP, entropy, TOPSIS, etc. [30,31,32,33] The above methods often inevitably lead to experts’ subjective judgment and unreasonable weight distribution, and ignore the randomness and fuzziness of evaluation information.
Niche theory Application Enterprise niche [41,42,43] Scholars focus on the qualitative analysis of enterprise niche and the relationship between industrial niche and the environment while paying less attention to the quantitative analysis of niche theory from the perspective of micro-innovation subjects.
Industrial niche [45,46,47,48]
Table 2. Index system of enterprises’ green innovation capability based on ecological niche.
First-Lever IndicatorsSecond-Lever IndicatorsDefinitions and Literature Source
Ecostate C1Proportion of R&D personnel C11Number of R&D personnel/Total number of employees [21]
Number of scientific research platforms C12Number of laboratories and mobile stations [55]
R&D capital investment intensity C13R&D expenses/Operating income [21]
Environmental management investment
intensity C14
Environmental management investment/R&D
expenses [56]
Technical transformation investment
intensity C15
Technical transformation expenses/Operating
income [56]
Production personnel proportion C16Number of production personnel/Total number of employees [57]
Personnel quality C17Number of employees with bachelor’s degree or above/Total number of employees [55]
Three waste emissions per unit profit C1810,000 tons/CNY 10,000 [58]
Energy consumption per unit profit C19Standard coal tons/CNY 10,000 [21]
Patent quality C110Number of valid invention patents/Number of valid
patents [58]
Ecorole C2Market share growth rate C21(Current year’s market share/Last year’s market share) − 1 [59]
Enterprise profit growth rate C22(Current year’s profit/Last year’s profit) − 1 [55]
Patent application growth rate C23(Number of patent applications in current year/Number of patent applications in last year) − 1 [55]
Table 3. Comment set.
Comment SetWorstPoorMediumGoodExcellent
Interval[0, 0.2](0.2, 0.4](0.4, 0.6](0.6, 0.8](0.8, 1]
Expectation00.30.50.71
Entropy0.01670.03330.03330.03330.0167
Table 4. Standardized data of the green innovation capability of different enterprises.
ABCDE
C110.94190.42190.887910
C120.07430.1023010
C13100.49900.499
C14100.35410.06140.6446
C1510.4990.74750.25050
C160.466510.84250.65030
C1710.85440.422700.3901
C1800.2480.80860.28641
C190.633100.87510.1545
C1100.32310.26570.967501
C210.383610.73270.54570
C220.20530.5732100.2039
C230.16480.27350.555610
Table 5. Weight Indicator distribution.
First-Lever IndicatorWeightSecond-Lever IndicatorAHP
Weight
Entropy WeightCV
Weight
Combined
Weight
C10.5556C110.17020.06070.07090.1322
C120.10720.24360.19550.1516
C130.13510.12770.11190.1354
C140.09230.11040.10850.096
C150.09230.07430.08470.084
C160.03770.05880.070.0482
C170.03770.06850.08020.0517
C180.10910.08680.09570.104
C190.10910.08360.08850.1005
C1100.10940.08550.09410.0965
C20.4444C210.41260.19490.23590.321
C220.25990.40720.38790.3201
C230.32750.40720.37620.3588
Table 6. Comments of the green innovation capability of different enterprises.
C11C12C13C14C15C16C17C18C19C110C21C22C23
AEWEEEMEWGPPPW
BMWWWMEEPWPEMP
CEWMPGEMEEEGEM
DEEWWPGWPEWMWE
EWWMGWWPEWEWPW
Table 7. Numerical characteristics of the green innovation capability cloud model.
.C11C12C13C14C15C16C17C18C19C110C21C22C23
Ex0.70.20.40.40.50.640.560.320.540.520.50.360.36
En0.45120.40110.40110.45120.35090.3910.44120.34090.54140.48130.35090.3910.391
He0.12290.19790.1190.0160.14780.14170.01020.22540.030800.14780.14170.1417
Table 8. Numerical characteristics of ecostate and ecorole of green innovation capability of different enterprises.
ABCDE
ExC10.59920.30780.50420.45680.3905
EnC10.02080.023620.02450.02060.0214
HeC10.01190.01030.01070.01210.0111
ExC20.23430.51040.67190.51470.0728
EnC20.027340.0280.02790.0220.022
HeC20.00990.00860.008370.01050.013
Table 9. The expectation, entropy, and hyper entropy values of the green innovation capability of different enterprises.
ABCDE
Ex0.41220.40640.58420.48340.2471
En0.02370.02560.0260.02120.0217
He0.01120.00970.00980.01150.0119
Table 10. Sensitivity analysis of the green innovation capability evaluation of different enterprises.
First-Level IndicatorsSecond-Level IndicatorsWeight Change RateExpectation after Change
ABCDE
C1C12100.40750.40460.58130.48770.2445
200.40520.40380.57980.48980.2432
300.4030.40280.57830.4920.242
−300.42550.41150.59310.47060.2542
C2C23100.40990.40010.57930.49270.247
200.40770.39390.57430.50220.2471
300.40540.38780.56940.51180.2471
−300.41820.42550.59040.47230.2468
Table 11. Evaluation results of comparison methods.
ABCDE
Coefficient of variation-entropy 0.79980.81471.31100.97520.4396
Order43125
Grey correlation-TOPSIS 0.19470.19460.2480.21220.1505
Order34125
Publisher’s Note: MDPI stays neutral with regard to jurisdictional claims in published maps and institutional affiliations.

