1. Introduction
Most governments across the world are making serious efforts to reduce their consumption of fossil fuels in power generation to mitigate climate change and reduce electricity tariffs. In [
1], the case of Portugal, which increased its use of wind energy by more than 16% over ten years, was studied. The encouragement of the penetration of renewable energies at the consumer level has allowed the concept of distributed generation to be strengthened [
2,
3]. In [
4], it was shown how the use of solar panels has reduced energy bills as well as fostered the sustainability of the media. In [
5], the effects of feed-in tariff (FIT) and renewable portfolio standard (RPS) in developing the renewable energy industry, under uncertain conditions, were compared. In [
6], fractional integration was used to analyze the relationship between energy consumption and energy prices in the Iberian market.
Current trends seek to effectively reduce energy tariffs for final consumers. In [
7], the use of natural gas to replace oil and diesel, whilst offering more competitive hourly prices, was shown. The work presented in [
8] showed how the experience of combining solar panels and batteries helped reduce tariffs for residential customers. In [
9], the policy combining dynamic tariffs with clean energies as an effective means of reducing energy bills for the final consumers was reinforced. In [
10], the support policies for the photovoltaic industry were evaluated based on the premise that there is spatial dependence among regions.
Additionally, some countries are liberalizing their distribution segment to diminish tariffs for regulated clients. Thus, it is possible to find international literature references focusing on such an approach. In [
11], several strategies for the liberalization process of the distribution segment were presented. The work reported in [
12] introduced optimization models to define the energy market for the purchase and sale of electricity for traders. In [
13], a retail market liberalization policy was proposed for the case of Italy. In [
14], the experience of the final consumer in Portugal was described, while in reference [
15], the effect of liberalizing the retail market in Spain was discussed. In [
16,
17,
18], the use of renewable energies in order to reduce energy prices was described.
In some countries, such as Chile, the monthly electricity bill represents almost 8% of the minimum salary that Chilean workers earn, corresponding to USD 35 (minimum wage: USD 440 per month) and affecting 18.1% of the labor population [
19]; thus, any potential alternative to reduce the energy price is always a relief for the household economy. Unfortunately, the impact on the tariffs for residential clients is not immediate. As old contracts and regulations were implemented in other contexts, incorporating non-conventional renewable energies (NCRE) does not yield any significant benefits in the short term.
In addition, it is essential to mention that the Chilean electricity market’s liberalization occurred in 1982, which only affected the wholesale market. Distribution companies have managed the supply segment for the last 40 years, preventing new competitors’ entry. Today, the Chilean government is making significant efforts to reduce tariffs through the retail electricity market liberalization, seeking to separate the supplier role from distribution companies to allow the entry of new competitors. However, the political process associated with this reform has been prolonged and is currently stalled. Therefore, to face the current contingency while the reform is discussed, approved and implemented, the government has proposed a mechanism to stabilize energy costs between 2020 and 2023, to prevent tariffs increasing as has been the case since 2019.
In this context, the present paper intended to reveal the implications associated with the implementation of the energy price stabilization mechanism designed to freeze tariffs for regulated clients until 2023. In addition, this paper analyzed the mechanism of dependence on the exchange rate and the eventual delay in lowering the regulated tariff until 2027, causing the opposite effect to what was expected.
The present research is structured as follows:
Section 2 presents the description of the problem and the corresponding strategy to solve it;
Section 3 contains the methodology employed herein;
Section 4 shows the case studies and results obtained;
Section 5 shows the impact of the energy price stabilization mechanism on regulated clients’ tariffs. Finally,
Section 6 discusses the conclusions and suggests possible directions for future work.
The Chilean Crisis
During 2005, Chile faced a critical situation with the energy supply to regulated consumers, which are subjected to pricing policies established by the corresponding authorities [
20]. Additionally, natural gas supply problems, due to the Argentine crisis in 2001 and the tariff lack of regulation for all the different concession areas of the distribution companies, led to electricity rationing. Thus, the urgent need to establish a coherent tariff regulation for all concession zones of the distribution companies operating in the country became evident.
Therefore, the Licitaciones de Suministro para Clientes Regulados (supply tendering for regulated clients) [
20] was implemented. The main objectives of this new scheme were to assure power supply to all regulated clients, stabilize prices in the medium term, eliminate market distortions, and establish functioning limits for distribution companies. It was expected that the participation of new actors within the group of generators would effectively supply the demand of regulated clients by establishing supply contracts for a 15 to 20 years period. Such contracts between generation and distribution companies would be signed in US dollars to attract foreign investors and foster greater competition for the offerors belonging to energy groups. Unfortunately, this mechanism did not have the expected impact as no new actors participated, and the prices allocated were not particularly competitive. However, the energy supply for regulated clients was assured, although it had a high cost, positioning Chile’s as one of the most expensive regulated energy tariffs in Latin America.
In 2015, the Chilean tendering process mechanism suffered some modifications to promote the non-conventional renewable energies in the power supply for distributors and reduce the energy price in the medium and long term. First, the hourly blocks of energy electricity were reduced, allowing solar generators to opt for specific periods, which might render maximum generation. Second, it allowed the companies to obtain the 5-year contracts required for financing support and building a plant capable of supplying the power block awarded.
After the previously mentioned regulatory modifications, a very successful tendering process occurred in 2016 [
21]. At the time, historical prices for supplying regulated clients were awarded, reaching around CLD 32 per MWh. In this favorable context, authorities were able to fulfill their commitment to reducing the electricity tariffs; however, its effects would be transferred to the customers five years later, i.e., the 2016 historical prices would only be effective in the tariffs of 2021. Therefore, the high expectations resulted in the accumulation of uncertainty and dissatisfaction among consumers. Additionally, the contracts associated with the power supply tender were signed in CLD, and this fact has disadvantaged the government due to the constant appreciation of that currency.
In the regulated clients’ tariff scheme, the prices are fixed according to the corresponding decrees issued by the Comisión Nacional de Energía (National Energy Commission, CNE). Such decrees are issued during January and July. Until 2018, authorities considered the average USD value of the previous month to establish the tariff decree. However, for cost reduction, it was decided to modify this criterion and use the average USD price of the previous six months instead, considering that the tariffs of those six months would amortize the currency fluctuations.
In 2019, the contracts indexation adjusted to the dollar value, and the change in the CNE criteria showed that the tariff decrees would establish prices with an increase of between 8% and 10% semiannually. Authorities justified these rises as being due to contracts from energy-power supply tender offers carried out in 2013 and 2014. However, considering the average semiannual dollar rather than the previous one, the price to fix the tariff decrees increased the positive balance accumulation for generation companies, including those for the following tariff decree, generating a constant increase in the tariff. Note that the term balance for the generation companies indicates the debt unpaid by the regulated customers due to the stabilized mechanism fixing the electricity price, such that the customer pays a lower price than the real one. This difference is mentioned throughout the paper as the accumulated debt or the positive balances for generators. In the current tariff structure, the energy component may be 70% of the electricity bill, and this charge experienced a sustained rise. Only in 2019, the bills increased by 25%.
In this continuous energy-price rise context, the authorities relied on reducing the tariffs in 2021 by incorporating the historic tendering held in 2016. However, the high costs that clients had to pay for electricity, combined with the social outbreak that Chile went through during October 2019, led the government to take a drastic measure, which varied from what the sector had been developing since the 1980s when the Chilean electricity market was liberalized. This measure was the promulgation of Law 21.185 [
22], which established a mechanism to freeze the energy prices that regulated clients’ pay. The stabilization mechanism contemplates freezing the generation charge associated with residential bills for two years. After this period, the energy fees will only rise according to the IPC, considering mid-2023 as its final validity period. This measure will generate a debt in favor of the generators, which should be paid between 2023 and 2027.
Law 21.185 considers a maximum debt of USD 1.350 MM in favor of generators during the validity of the mechanism. This amount was calculated considering that the USD value in the national currency (Chile) would fluctuate between CLD 720 and 770 during 2019 and 2020. Unfortunately, such projections were too conservative as the average USD value has not fallen from an average of CLD 800 [
23] since the social outbreak. Additionally, the mechanism was implemented for all regulated clients, although it should have been applied only to residential regulated consumers (the most affected by the social crisis). If such had been the case, the total debt would have been reduced to 45% of the total.
2. Background: Description of the Pricing Model for Regulated Clients
2.1. Open Auction Process for the Supply of Energy to Regulated Clients
In 2005, Law N 20.018 (Short Law 2) was issued [
24], which modifies the energy contracting system for a supply tendering process, in which distribution organizations grant generation companies an energy supply service for regulated clients through an open auction. Those who offered the lowest energy price during the process were hired. The law has the following objectives:
To ensure power supply to all regulated clients;
To foster investment in the generation area, expanding the current generation market;
To obtain competitive market prices with long-term objectives;
To guarantee economic efficiency, competence, security and diversification of the electric resource.
The energy and power prices are stipulated in the submission bids, in which such prices will have an indexation (adjustment) that will be duly established in the tendering conditions. Such prices would come into force three years after the bidding. Concerning the energy case, the indexation should represent the variation in fuel costs. In contrast, the power indexation should reflect the fluctuations of the investment costs of the most economical generation unit assigned to supply power during the hours of peak demand.
When the submission process is finished, the participant with the lowest prices will be awarded the contract. The bilateral contract between the generation and distribution companies will be executed through a public deed with a registered copy to the Superintendency of Electricity and Fuels and then informed by the National Energy Commission. The energy prices bid cannot be higher than 20% of the band over the short-term nodal price (calculated by the authorities) in the decree in force at the beginning of the bidding process. If the tender is declared void, a new one can be carried out that increases the price up to 15%. If the tender is void again and the short-term nodal price decree would no longer be applicable, the new decree will apply, and the maximum price could be around 20%.
The supply contracts awarded could have a maximum validity of 15 years, allowing the generators to capitalize from their investment in the long term.
2.2. Law 20.805: Improvements by Implementing the Tendering System
After promulgating Short Law 2, Law 20.805 [
21] was enacted to rectify the existing shortcomings of the tendering processes, demonstrated by the lack of offerors and the bids declared void. The main tendering modification was the increase in the anticipation period from 3 to 5 years, providing more certainty for generation companies to initiate their investment and meet their commitments. Likewise, Law 20.805 established a maximum price for the bids, which is not of the public domain until the sale bids are open. This measure aims to assure that the generators do not speculate with the different bids proposed. In the same line, and to allow a long-term capitalization, the supply contracts are longer and are valid for between 15 and 20 years.
2.3. Supply Tendering Process
The regulatory structure between 1981 and 2005 did not provide sufficient incentive to new investment in the generator sector [
25], producing a lack of interest in generating supply contracts with distribution companies, and forcing the authorities to develop a structural redesign. Thus, in 2005, with Law 20.018 (Short Law 2), the new supply tendering mechanism was established, by which distribution companies are compelled to ensure power supply to their regulated clients. Short Law 2 ensures energy supply under contract for regulated clients; fosters generation investment; has long-term competitive prices in a market; and guarantees the system’s efficiency, competence, security and diversification. Additionally, Short Law 2 establishes how distribution companies should tender their supplies of regulated clients at least three years in advance to provide the project developers with an appropriate time frame to build their facilities and fulfill their contracts. Supply contracts are valid for 15 years, which allows project developers to capitalize their investments in the long term, maintaining stable prices that are duly indexed. This public tender only concerns the energy price bid by the supplier (generator) since the tariff decree sets the power price.
Although the first supply tender, held in 2006, was a success due to its numerous contracts awarded (98%) at an average price of CLD 53/MWh, the second process did not have the same response since only 50% of the energy was adjudicated. The authority addressed this situation by perfecting the tendering process (Law 20.805), making the structure more attractive. Likewise, to expand the adjudication criteria beyond energy issues, an indexation mechanism of the energy price was introduced concerning different commodities. Thus, other similar bids might affect the price bid, though always related to their corresponding indexations. All modifications introduced by these improvements were well received by the electricity market, increasing the competition, number of bids and reducing the energy price, as shown in
Figure 1.
2.4. Tariff Structure for Regulated Clients
The prices associated with the tenders are defined as long-term nodal prices (PNLP). Each distributor has its PNLP, and the general system also has one. This mechanism allows a long-term capitalization of the generation facilities through the supply contracts between generators and distribution companies. The PNLPs are set in USD; therefore, they are subject to this currency variability, and they are transferred to regulated clients in the form of energy charges through the electricity tariff and other existing charges.
Figure 2 shows the charges of a sample account.
It was not until 2019 that the prices passed on to regulated clients were challenged as an adequate tariff mechanism due to the increase in energy prices. The previous energy tenders explain these rises by the effectiveness of their price five years after being made available for public bidding. Thus, in 2019 and due to the 2014 processes, energy prices rose. Likewise, and to a more significant extent, the explanation of the increasing prices is the appreciation of the USD, which, as any other exchangeable product, is ruled by the principle of supply and demand, justified by external and internal factors affecting the country. The internal factors are associated with the interest rates managed by the Chilean Central Bank, which, according to the modifications established, can produce disincentives and the subsequent depreciation of the CLD (or an appreciation of the USD). Thus, in 2019, the dollar price experimented with consecutive rises, impacting the regulated tariff, becoming part of the essential elements that led to the social outbreak in October, and making the implementation of an energy price stabilization mechanism of the utmost importance for regulated clients through Law 21.185.
The USD price is associated with the appreciation or depreciation of the national currency, the management of the interest rates and, as a consequence, the credits granted by banks of not-backed money, along with international factors that might affect this asset. The leading causes contributing to the dollar strengthening price were external factors, such as the situation between the USA and China in 2019 and the social crisis in Chile during October of the same year. Thus, at the beginning of 2019, the dollar price was between CLD 640 and 720, but the exchange rate reached historical levels at the end of the year, surpassing the CLD 830 barrier.
Figure 3 shows the constant increase in the USD price of recent years (the Chilean Central Bank report [
23]).
The sudden presence of COVID-19 has aggravated this situation since the beginning of 2020, which threatens global health and severely compromises international markets. Therefore, since the spread of the virus and its subsequent declaration as a pandemic by the World Health Organization, all currencies have been highly affected, and in the particular case of Chile, it continues to impact the dollar price. Experts indicate that this currency might reach historical maximums, and this situation can jeopardize the effectiveness of the price stabilization mechanism implemented by Law 21.185.
All the current regulatory changes were implemented to solve the electricity system’s problems and the significant increase in prices resulting from the supply tendering. Although it is seen in
Figure 1 that the prices in 2006 and 2007 were approximately USD 60/MWh, during the following years, they increased substantially until reaching twice the price in 2013. Thus, in 2014, the electricity tariffs paid by families were 20% higher than in 2010. This trend of electricity tariffs continued until 2019, making the energy price one of the highest registered globally, as seen in
Figure 4.
3. Methodology for Energy Price Stabilization Mechanism
Energy price stabilization mechanisms are internationally used in different sectors, especially in essential services, and are intended to protect the client against unexpected variations of the services’ monthly costs. In the electricity market, the energy price stabilization mechanisms aim at reducing the variability of the exchange rate (dollar) and commodities. Such mechanisms operate in different countries. Their specific characteristic depends on the economic model associated with the electricity sector and the competition levels in wholesale and retail markets. Thus, countries with a free market but low competitiveness require these mechanisms to address the market failures.
One of the most common schemes is public tendering processes that the government or private entities can implement. In the former scenario, the cost is provided by public funds, while in the latter, the investors make a financial effort and, as a result, consider this price intervention as a market instability signal that might affect the capitalization of their investment.
For free-market models (such as the Chilean one), the implementation of these mechanisms responds to the revenue transfer among periods, so the costs for the user are stabilized in the long term. The impact in those cases responds to the economic flows that generation companies should sustain during the implementation period, i.e., the scheme functions as a credit. Within this group of schemes, supply contract renegotiations are also included, reducing the price and extending the deadlines. In October 2019, the Ministry of Energy presented a law proposal that stabilized energy prices for regulated clients, setting the price according to Decree 20T from 2019 [
27]. This bill was designed to provide a quick response to one of the social demands of the country. Regarding the electric market, such demands were related to the energy cost (increasing the dollar exchange) and the entry in force of supply contracts with high values.
On November 2nd, it was published that Law N 21.185 implemented a transitory price stabilization mechanism that operated by freezing the nodal price at an energy transmission–generation level () until December 2020, according to the prices of the first half of 2019 (Decree20T), producing credit in favor of the generators with a supply contract valid during that period. The debt in favor will be paid once the prices for regulated clients start reducing due to the inclusion of new cheaper contracts.
3.1. Description of the Mechanism
The scheme that operates during four periods is described in
Figure 5:
Period 1 (from 1 July 2019 to 31 December 2020): the long-term nodal prices per distributor were set, maintaining the value established by Decree 20T from 2018.
Period 2 (from 1 January 2021 to 31 December 2027): The long-term nodal prices transferred cannot be higher than the PEC value, which will be adjusted every six months according to the consumer price index (IPC). The National Statistics Institute determines this index to calculate the rise in prices or inflation. The balances generated can be positive or negative, which will add to or deduct from the general stock.
Period 3 (from July 2023): the PEC value will be adjusted so as not to generate more balances in the stock (if it corresponds); thus, the PEC adjusted every six months according to the IOC will take the PNLP value, avoiding the increase of the stock value.
Period 4 (between 2025 and 2027): the mechanism will last until all the existing balances are finalized, and if, due to projections, the authority determines that the debt extends beyond 21 December 2027, the PEC will be adjusted to finish them by that time.
Period 5 (between 2026 and 2027): all outstanding debts as of that date will have interest charges, which the regulated customers will pay.
Figure 6 shows the algorithm scheme of the energy price stabilization mechanism for regulated clients.
In general terms, the algorithm follows the procedures below:
Following the PNLP projections and the corresponding semiannual adjustments, for every commune, the energy prices () are estimated for each semester that the mechanism is applicable (2019-1 until 2027-2). The prices are calculated according to the semiannual average dollar (determined by calculating the average of the six months before fixing the prices).
The monthly demand is calculated for the operating period of the mechanism based on the information provided by CNE.
The expected monthly remuneration is obtained by weighing the by the corresponding demand of each commune.
Then, the stabilized prices for regulated clients (PEC) are determined according to the prices set in Decree 20T.
The PEC will be adjusted every six months according to IPC if they are applied after 31 December 2020, and they will match the energy price in June 2023 to not generate a higher debt.
The PEC is weighed by the demands of each commune to obtain the real remunerations.
The balances are obtained from the subtraction between expected and real remunerations, and these are, respectively, divided by the average monthly dollar of the corresponding month.
The balances calculated from the mechanism and the balances by delays (balances corresponding to the delay in the execution of the decree in 2019) are accumulated in a stock that should be paid before 31 December 2027.
3.2. Procedure for Energy Prices Estimation
The procedure for estimating the PNLP considers creating a database where all signed contracts from the public tendering process are included. All this considering the corresponding energy blocks assigned to the supply contract and other points discussed below.
The database is structured with public information from the CNE, which contains data from the contracts between generators and distributors.
Awarded generation company;
Bidding distribution company;
Tendering process;
Energy block awarded;
Commencement of the supply service;
Point of offer;
Point of Supply;
Awarded energy price;
Energy price indexation characteristics.
3.3. Algorithm for Tariff Projection
Figure 7 shows the algorithm used in this article to develop the different tariff projections considering the users’ geographic location, energy consumption, the distribution system operator who manages the users’ zone, the transmission system access and the tariff structure stipulated in the 11T Decrees. Thus, the first sub-algorithm (A) matches the input parameters with the internal database to define the variables associated with every electricity charge formula (yellow and orange squares) corresponding to the tariff.
The electricity charges are defined as follows:
Monthly fixed cost (CLD/month) is the charge applied independently of the energy consumption. The formula includes the allocation factor of sectorized fixed charges (), and the customer base fixed charge based on energy metering (), which considers inflation. Both values depend on the DSO and the energy zone defined by the 11T Decrees.
The charge for using the transmission system (CLD/kWh) is obtained directly by the input parameter and contains the national, zone and dedicated transmission systems.
Charge by public services (CLD/kWh) are destined for the national electrical financing coordinator, strips study and expert panels. It is a constant parameter, independent of the input data.
Charge for power purchase (CLD/kWh) is associated with the power price for regulated customers, which considers the power adjustment factor (), the node power price at the distribution level (), the high- and low-voltage power loss expansion factors, as defined in Decree 11T by the distribution company ( and , respectively) and the number of hours of use in the calculation of the base power coinciding with the peak of the system ().
Energy charge (CLD/kWh) is for regulated customers, which considers the high- and low-voltage energy losses ( and , respectively) and the distribution energy price (). The energy price is projected by month and year based on the load forecast developed by the National Energy Commission (CNE). Likewise, different scenarios for returns are modeled (green square) to estimate the future energy price for every energy zone. Thus, the multiple scenarios are matched with the input parameters to define the final energy price, which affects the BT1A tariff.
Base power charge in distribution component (CLD/kWh) is obtained by dividing the sectorized distribution low-voltage cost () by the number of hours of use in the calculation of the base power coinciding with the peak hour of the distribution system ().
An extra charge related to the winter limit concept is included in the algorithm for energy consumptions in the winter months greater than 430 kWh and greater than the winter limit. Additionally, the algorithm considers the option of setting which month the extra charge will be applied, following the previously defined charge structure.
The extra charges are computed as follows:
The calculation of the charge for additional winter power in the power purchases component (CLD/kWh) is similar to the charge for power purchase, differing in the number of hours of use in the calculation of the additional winter power coinciding with the system peak (). Likewise, a winter factor () is included, which is independent of the input parameters.
Charge for additional winter power in the distribution component (CLD/kWh): following the base power charge in the distribution component formulation, this new charge considers the winter factor () and the number of hours of use in the calculation of the additional winter power coinciding with the peak of the distribution system ().
Considering the calculation base, the second sub-algorithm (B) identifies the projection required by the operator generating a vector time and a tariff cost vector as appropriate. These vectors are graphically displayed in the program interface, generating a .csv data to save and analyze the supply data and the projection of the BT1 rate obtained in more detail. Likewise,
Figure 8 shows the structure for obtaining the AT4.3 tariff, similar to
Figure 7, except for the winter limits.
4. Results of the Price Stabilization Mechanism
This section reports the results and projections associated with the implementation of the mechanism established by Law 21.185. First, the results show the accumulated balances produced by the delay of entry into force of Tariff Decree 20T of 2019. Second, an energy price estimation for different scenarios related to future dollar prices is presented, which is essential due to the dollar fluctuation under the current Chilean instability. In fact, the maximum debt (1350 MM) was estimated considering a dollar range of between CLD 720 and 770 for 2019 and 2020; thus, a fluctuation out of this range may fulfill the maximum debt faster than the time expected.
Finally, the results of the accumulated debt for current and future dollar prices are displayed. The scenario in which the mechanism was applied only to residential regulated clients was also considered.
4.1. Outstanding Balances from the Delay of the Entry into Force of Decree 20T of 2019
The mechanism considers the balances generated from the energy stabilization prices, as well as the defaulted amounts from updating the Tariff Decrees 20T of 2019 [
27] and 7T of 2018 [
28].
Figure 9 shows a timeline that compares the prices expected from Decrees 20T of 2019 [
27] and 7T of 2019 [
29], with real prices applied to regulated client tariffs. In practice, Decree 7T of 2019 never came into force, and Decrees 7T of 2018 and 20T of 2019 were used to calculate such tariffs.
The balances from delays are calculated by subtracting the expected price (
), defined by the decree corresponding to the pertinent semester, and the real price (
) associated with the decree in force at that time.
Energy prices, expected and real, corresponding to that period were determined in Decrees 20T from 2019 and 7T from 2018, published by CNE. Additionally, the demand in the months considered in calculating the balance for delays is published by CNE in the respective demand projections.
Figure 10 shows the balances for delays estimated from the considerations previously indicated.
4.2. Demand Projection to Estimate the Accumulated Debt
The demand was obtained from the reports of CNE regarding the regulated clients’ demand projection. This projection considers the regulated demand at the system level without differentiating by distributor or commune, see
Table 1.
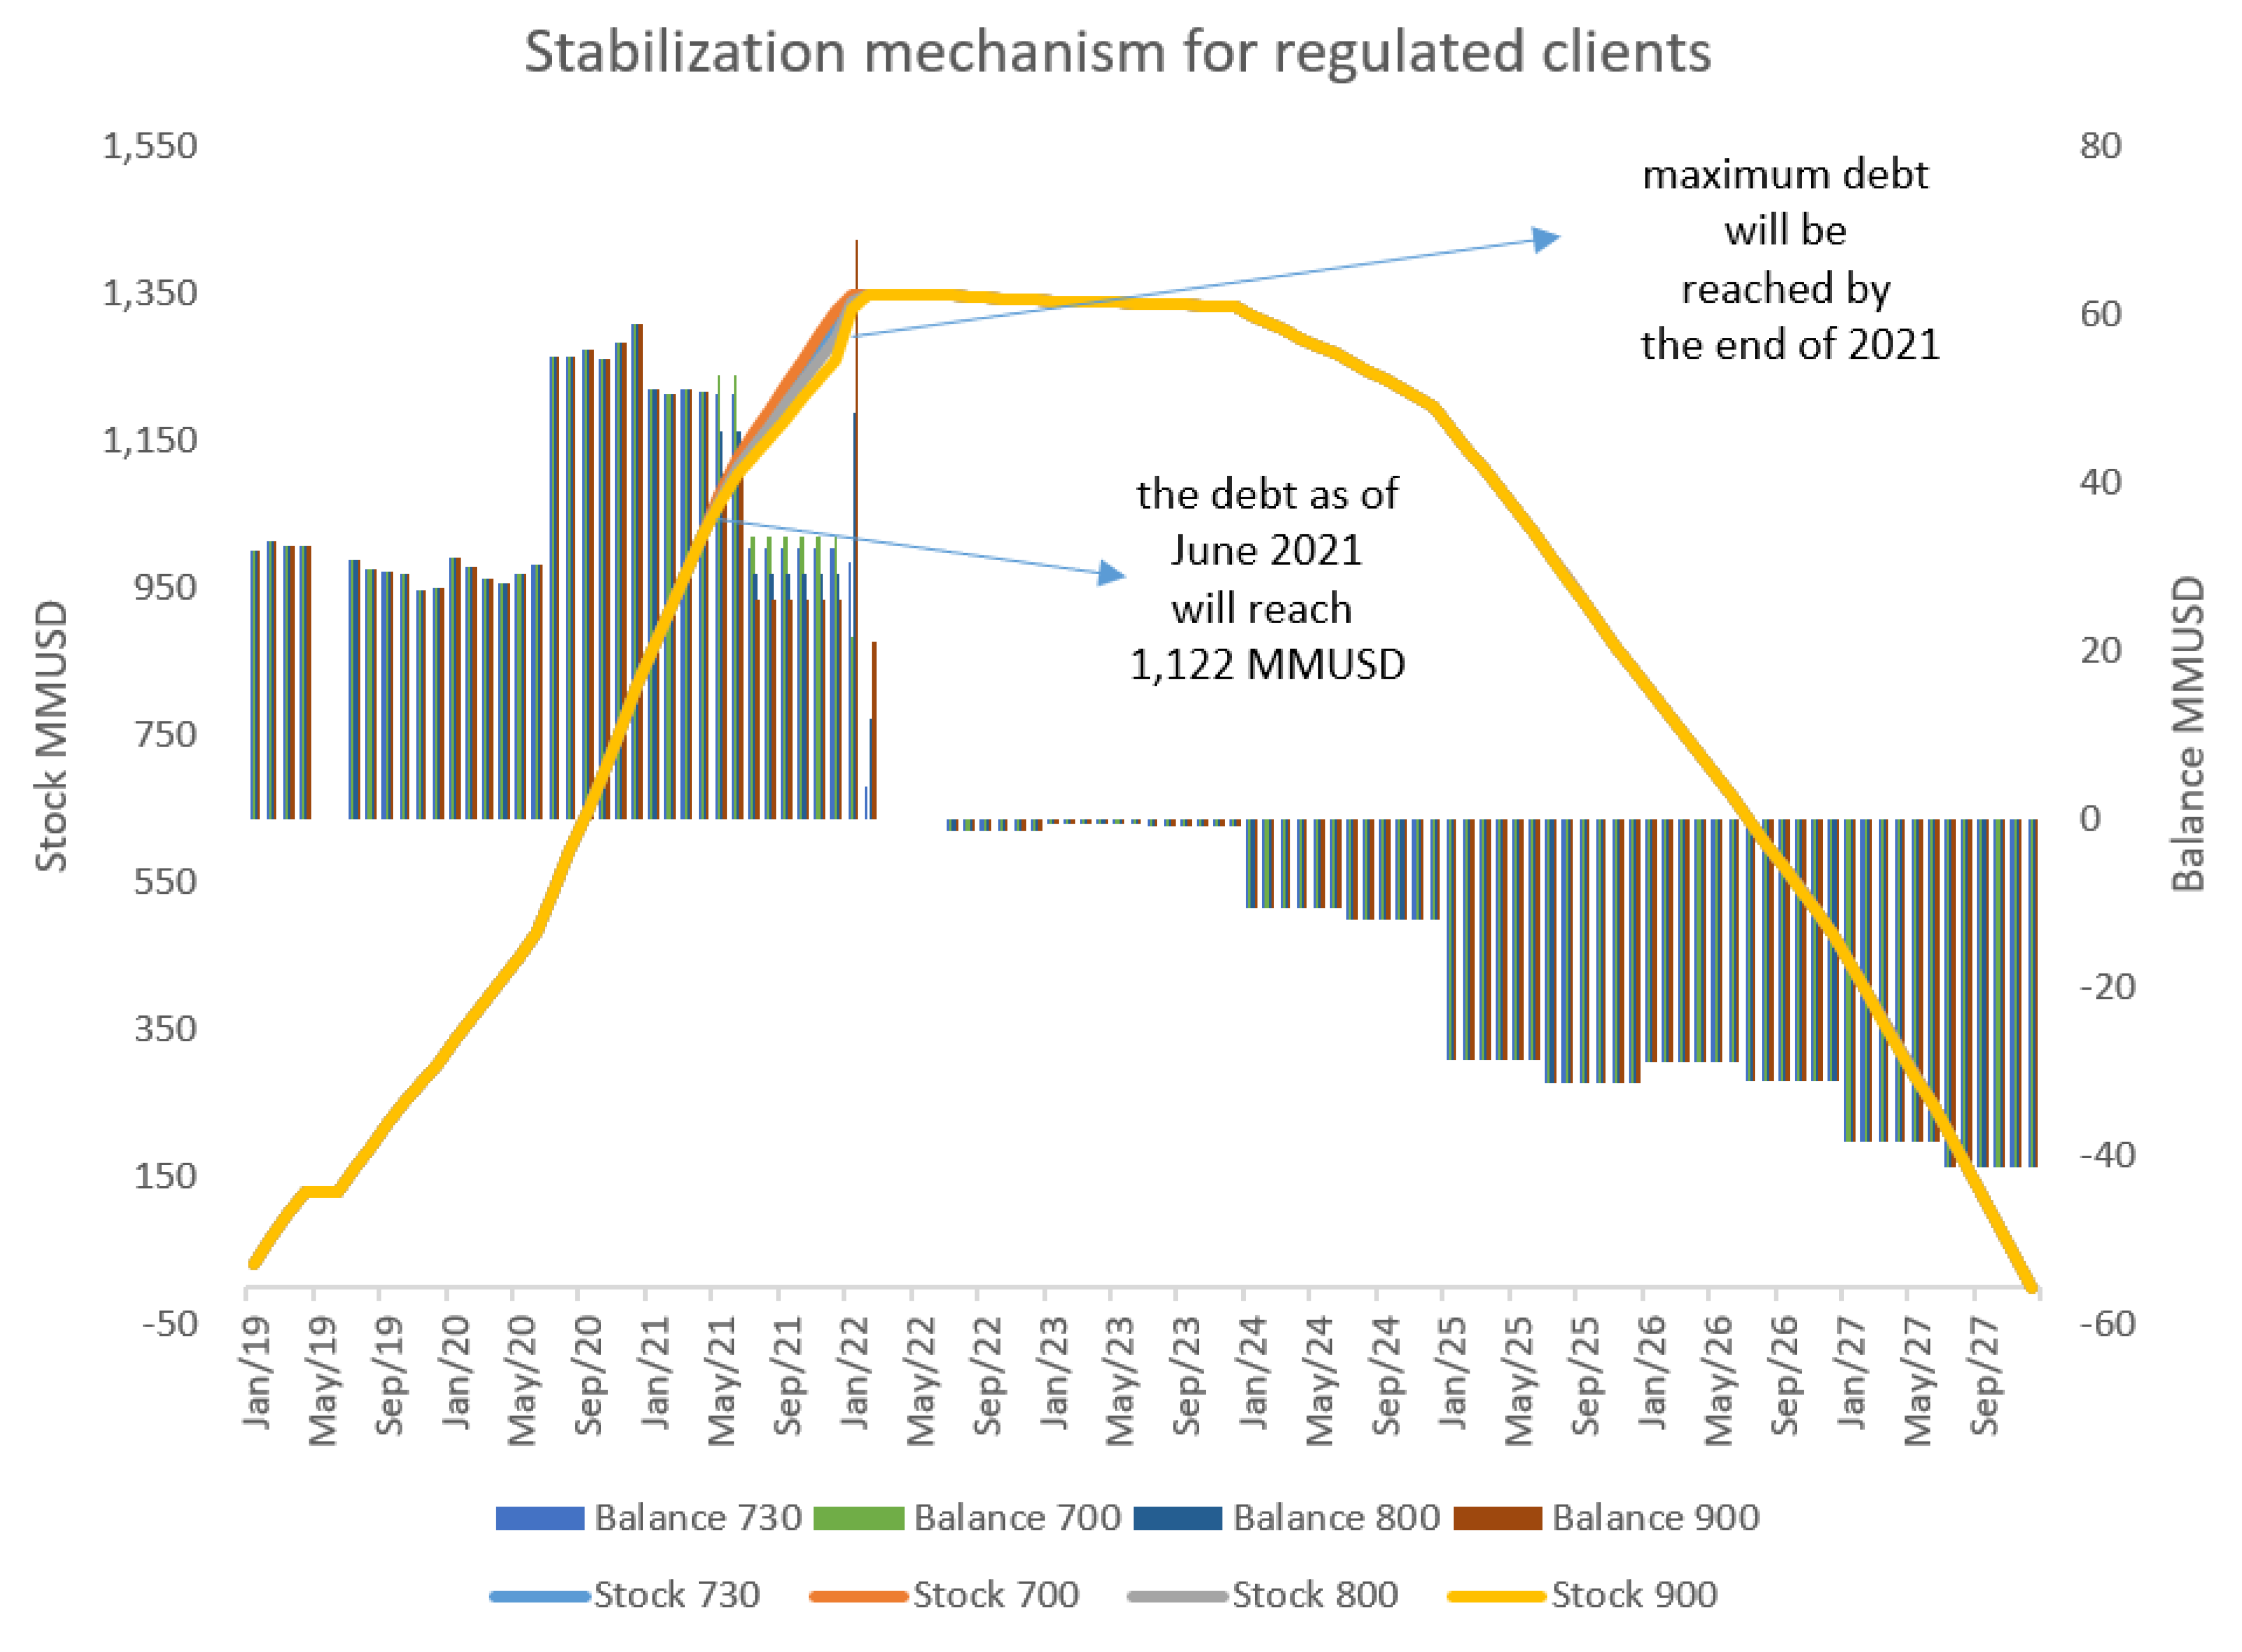
4.3. Total Accumulated Debt
The analysis of the complete system considers the summation of all the present cases for each studied community with their respective demands at a system level. Such balance summations allow an estimate of the systemic behavior of the price stabilization mechanism to be obtained.
Figure 11 shows the behavior of the stabilization mechanism concerning the balances and the general stock considering a dollar price of CLD 700, 730, 800 and 900.
During the first semester of 2019, the stock accumulated the balances corresponding to the delay of Decree 20T, corresponding to USD 160 MM. Likewise, by March 2020, the amount in the stock was USD 394 MM from the price differences of and PEC. According to our projections, during June 2021, the accumulated amount will be approximately USD 1.127 and 1.103 MM.
In the case of the dollar price of CLD 900, 800 and 730, the stock will reach the USD 1350 MM between January and February 2022. As energy prices are determined by the dollar value of the previous six months, it can be seen that the six-month dollar values are vital elements to determine the stock saturation period. In this respect, initial projections of the authority were wrong as they indicated that the dollar values would be around CLD 720 and 770 for the following years.
The authority assumed that with the dollar value of between CLD 720 and 770, the stock would reach its permissible maximum in June 2023. However, this is not going to happen, and the mechanism will not accomplish its objective.
The debt repayment will be completed for each case in December 2027, as the studies were carried out with a fixed dollar price. Thus, by making the debt refund, the behavior of the stock and balances in each case are identical. This is logical as, considering the months from January 2021, the average monthly dollar compared with the average six-month dollar is equal, which generates the same revenues. However, it does not mean that the prices to which regulated clients are subjected would not be higher as the dollar increases, but that the fundraising in dollars would be the same for these case studies.
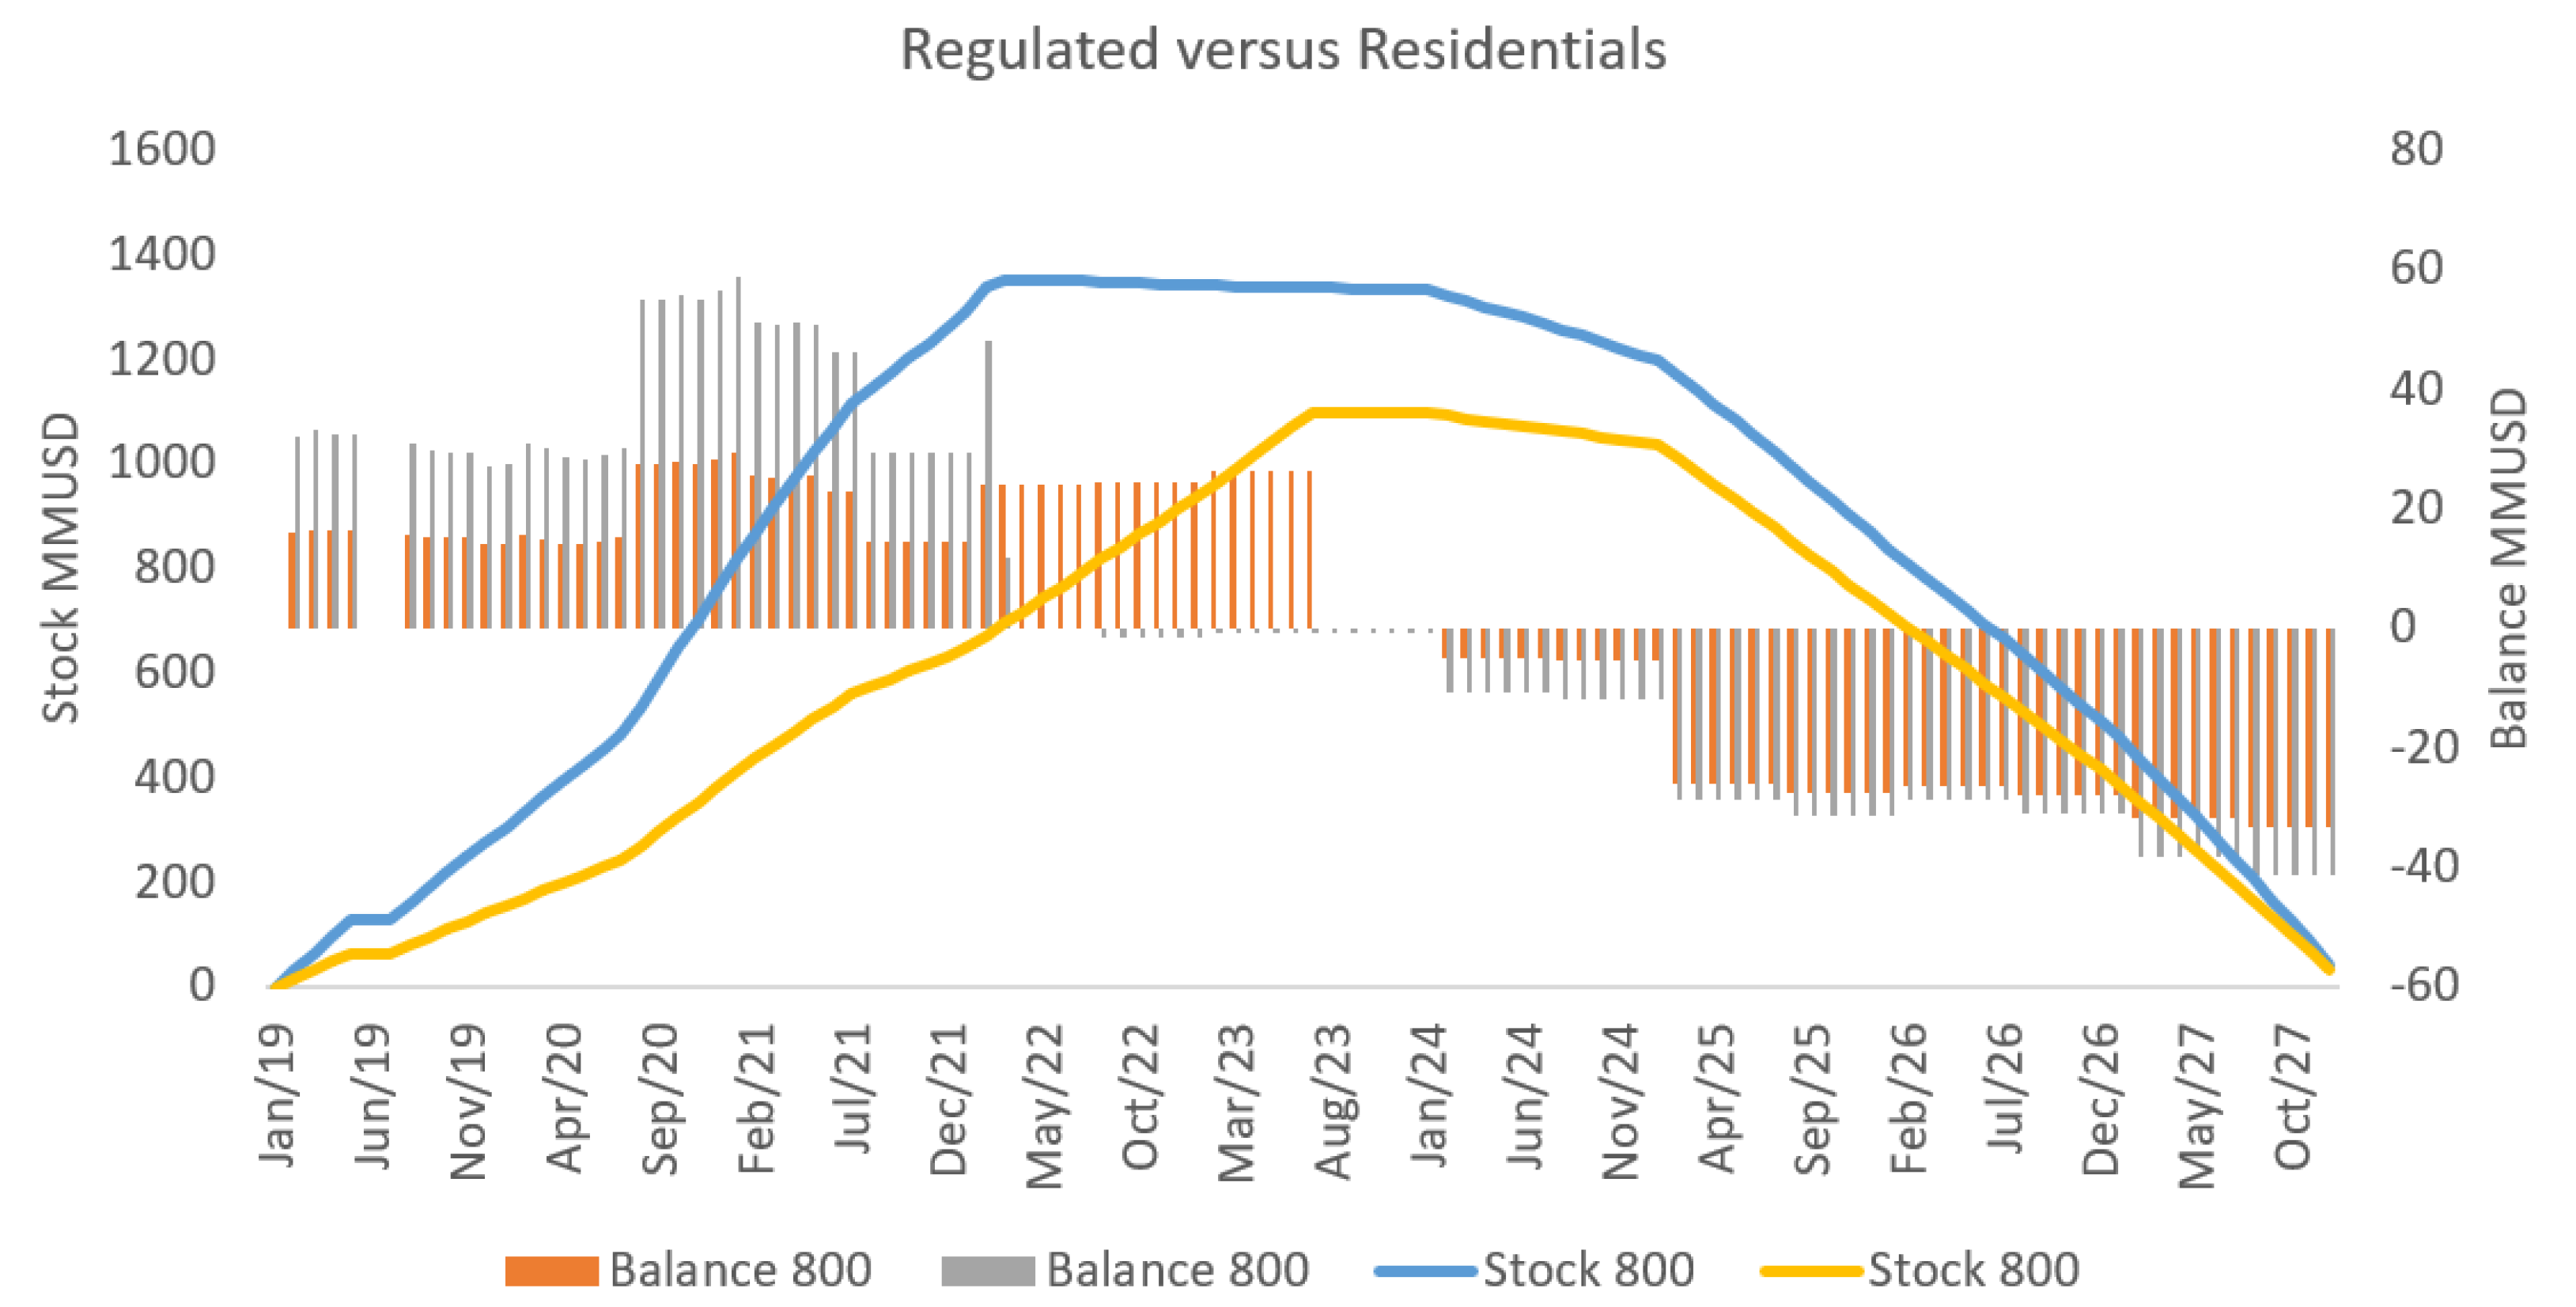
4.4. Stabilization Mechanism Considering Only Residential Clients
One of the first observations was that regulated clients should not be considered for the mechanism. Specifically, the article proposed that the system should have been for residential and domestic clients only (corresponding to 45% of all regulated clients demand). This section presents the stock estimations and their respective compliance periods when only residential and domestic clients are considered. Additionally, the results show dollar scenarios corresponding to CLD 700 (Case 1), 730 (Case 2), 800 (Case 3) and 900 (Case 4).
Figure 12 shows the mechanism focus on a reduced group of clients; thus, in February 2020, the stock would reach USD 185 MM. Moreover, note that the debt would reach USD 871 in June 2023, which is not its maximum (1350), as we previously mentioned.
In
Figure 13, it is observed that when considering the total demand of regulated clients, the stock will finish in February 2022. Thus, similar to the previous case, applying the mechanism only for residential clients, the stock would reach USD 945 in 2023 and not the maximum allowed (1350).
In
Figure 14, it is observed that when considering the total demand of regulated clients, the stock will finish in February 2022. Thus, as in the previous case, by applying the mechanism only to residential clients, the stock would reach USD 1096 in 2023.
In
Figure 15, it is observed that, when considering the total demand of regulated clients, the stock will finish in February 2022. Thus, as in the previous case, by applying the mechanism only to residential clients, the stock would reach USD 1272 in 2023.
As the authors mentioned initially, the results show that the mechanism will not have the effect of freezing tariffs until June 2023. The dependency on the six-month dollar value and its constant upward trend indicates that, as a result of the global crisis, the debt stock would be achieved much earlier. In the worst-case scenario, the mechanism would cease to be effective 17 months earlier than anticipated, whereas, in the worst situation, the authorities will have to adjust the tariffs in June 2021. Nevertheless, if the mechanism had been applied only to residential clients, the stock would not be reached in the worst situation.
5. Impact of the Energy Price Stabilization Mechanism on Regulated Client Tariffs
The previous section mentioned that the mechanism aimed to replace the real energy price for another that allowed the stabilization of the tariff until the second half of 2023, according to the requirement of Decree 20T of 2019. Thus, all regulated clients would pay a lower price than the real one until 2023, such that the difference between the real and stabilized price would produce a debt in favor of the generator, which should not exceed USD 1.350 MM. After 2023, the accumulated debt must be recovered through an additional charge in the monthly bill. The debt should be paid before December 2027.
Unfortunately, the amount accrued as of June 2021 was USD 1.127 MM, and it was projected that the maximum amount of USD 1.350 MM will be reached between January and February 2022, fifteen months earlier than projected. Thus, the regulated clients’ tariffs will grow considerably to pay back the accumulated debt. This scenario occurred in Spain between 2000 and 2013 when its electricity market generated a high debt such that at the end of 2019, the debt was still EUR 16,602 million [
30]. For Spain’s political consequences related to this debt, see [
31].
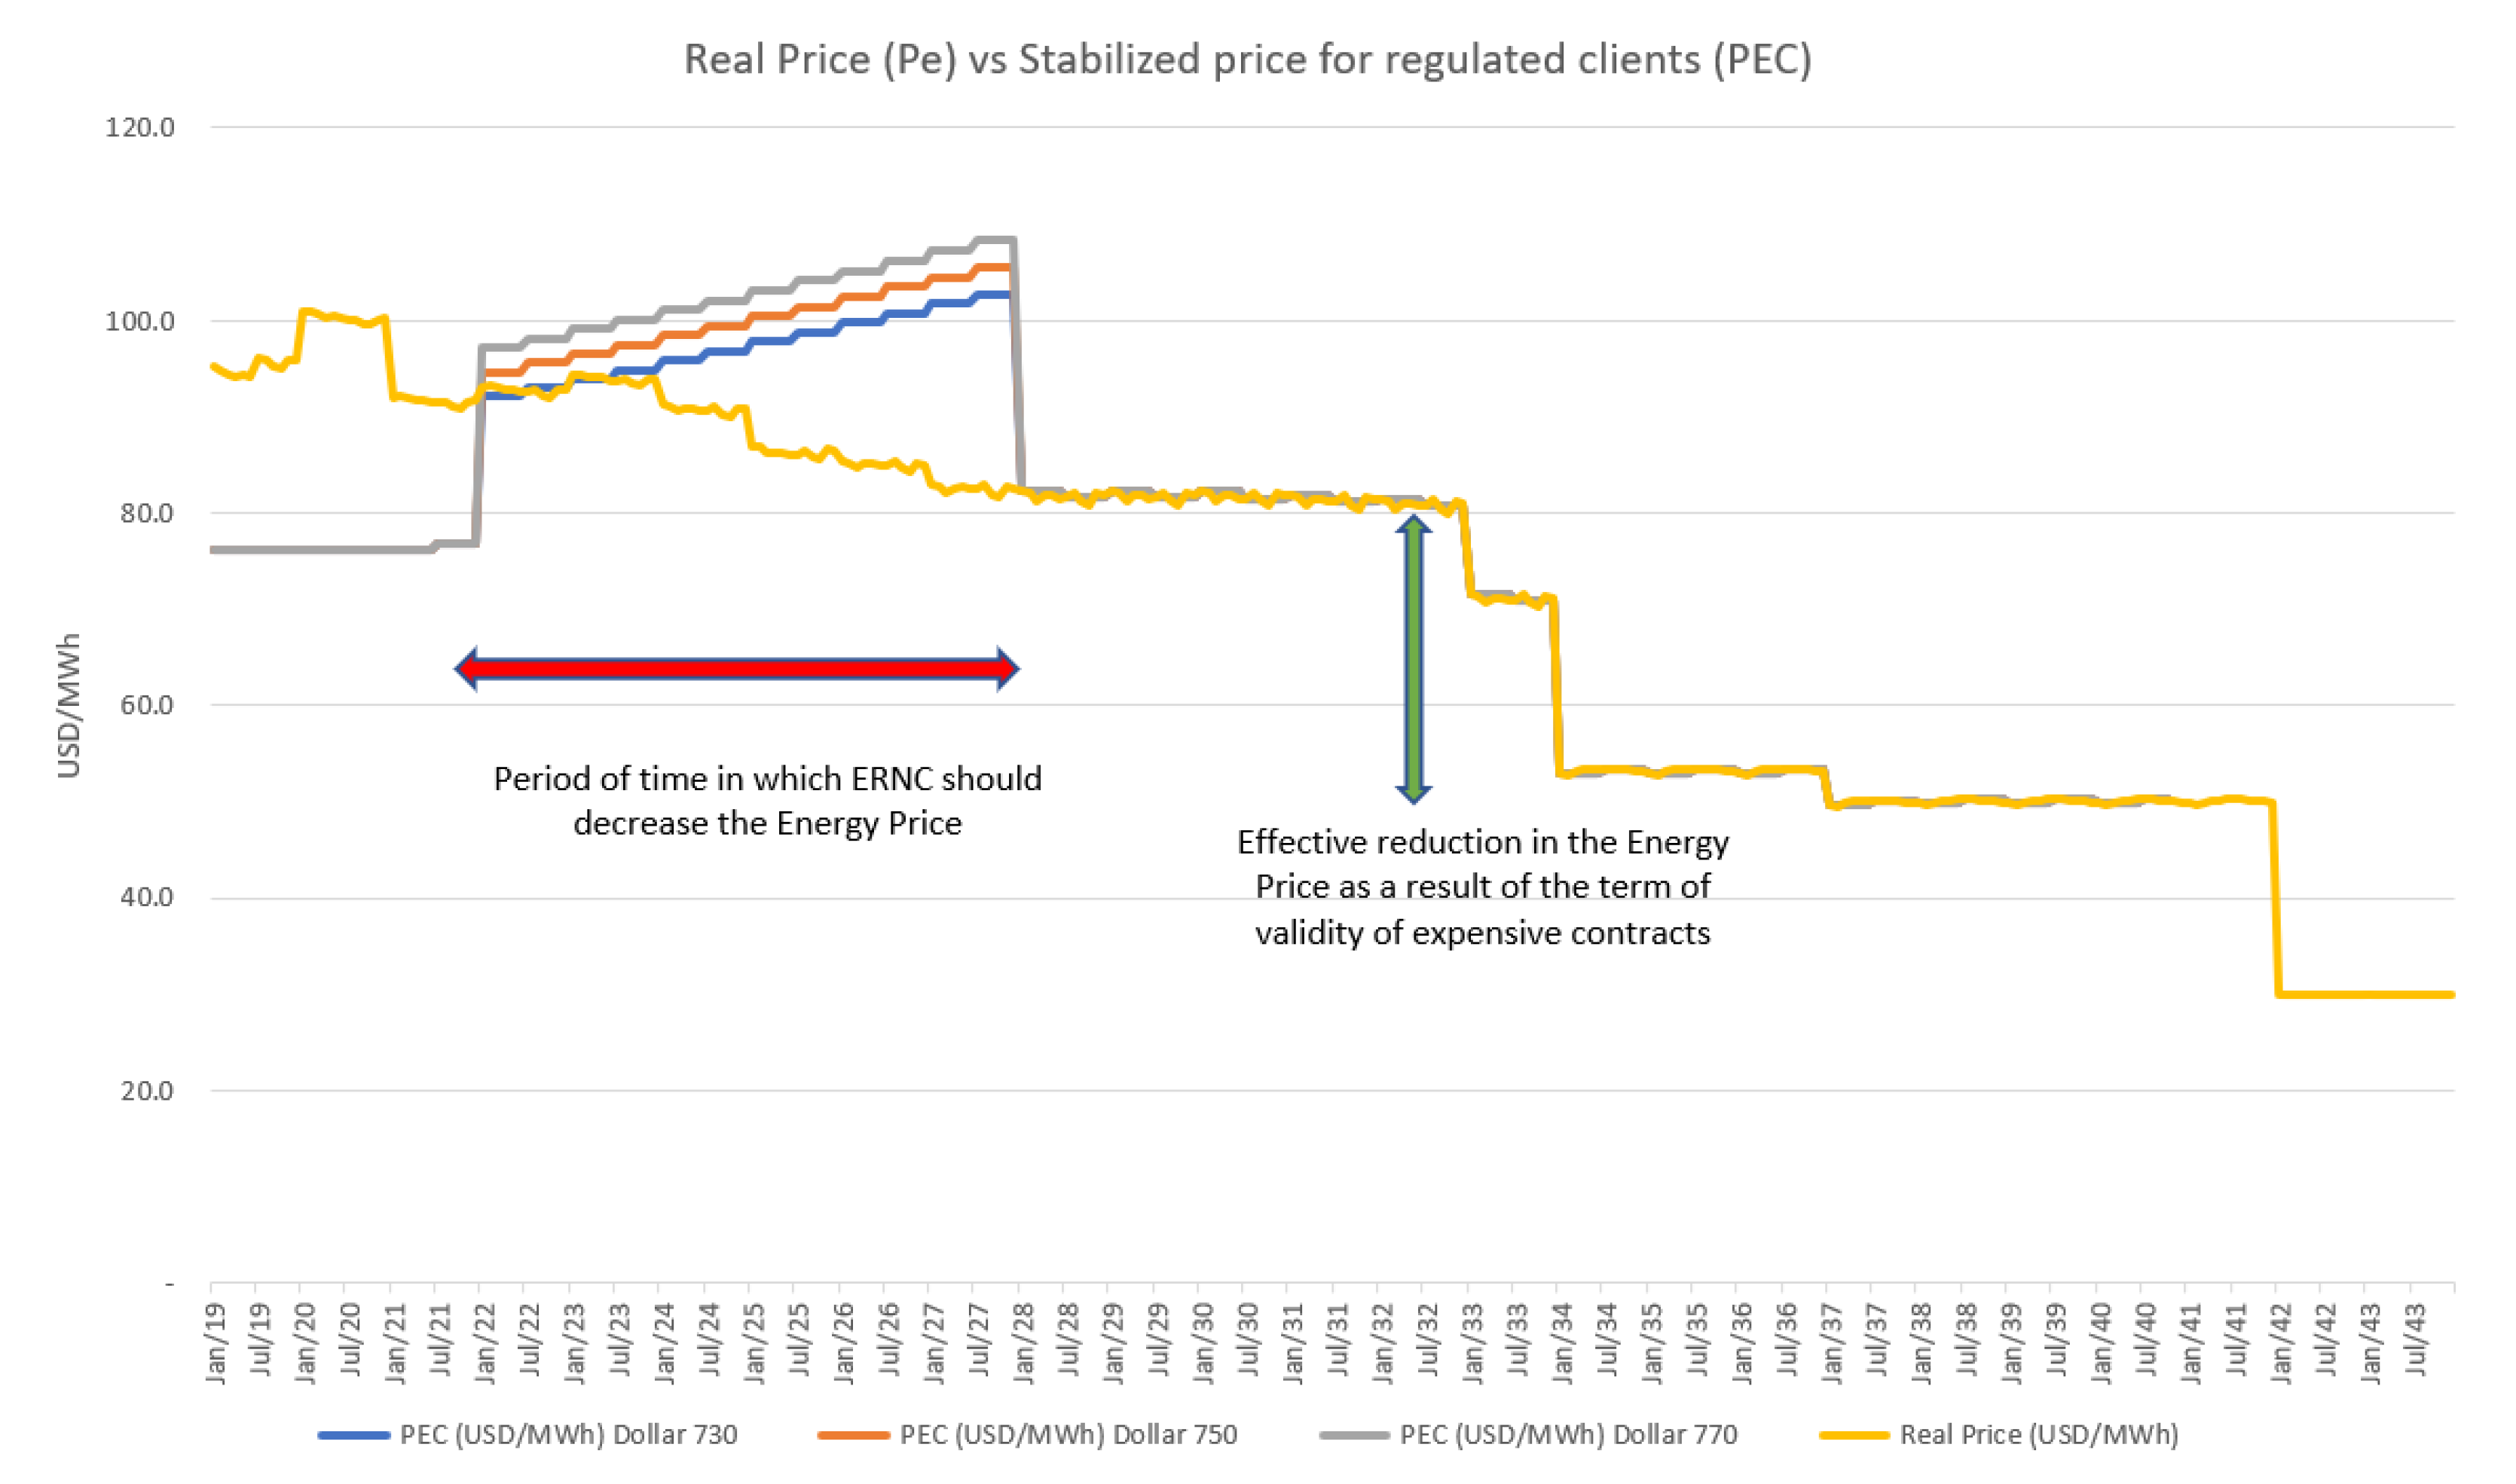
5.1. Impact at a Systemic Level
Figure 16 shows the behavior of energy prices associated with the real prices established by the current supply contracts (yellow line). Additionally, gray, red and blue lines show the projections for the PEC prices once the maximum debt of USD 1.350 MM is reached and when the return period starts. Thus, the PEC stabilization mechanism does not allow visualization of the energy price reduction projected for 2021 and 2025, considering the last supply tendering process.
When the implementation of this mechanism was discussed, it was never considered as a feasible scenario that the debt would be reached. However, such conditions will be met close to February 2022 and will have, as an immediate consequence, an increase in the energy cost to pay before 2027.
In this context, it will be challenging to reduce the energy price in the short term, and probably, only once the expensive current contracts expire will it be possible to visualize a reduction that would occur in 2034.
Figure 17,
Figure 18 and
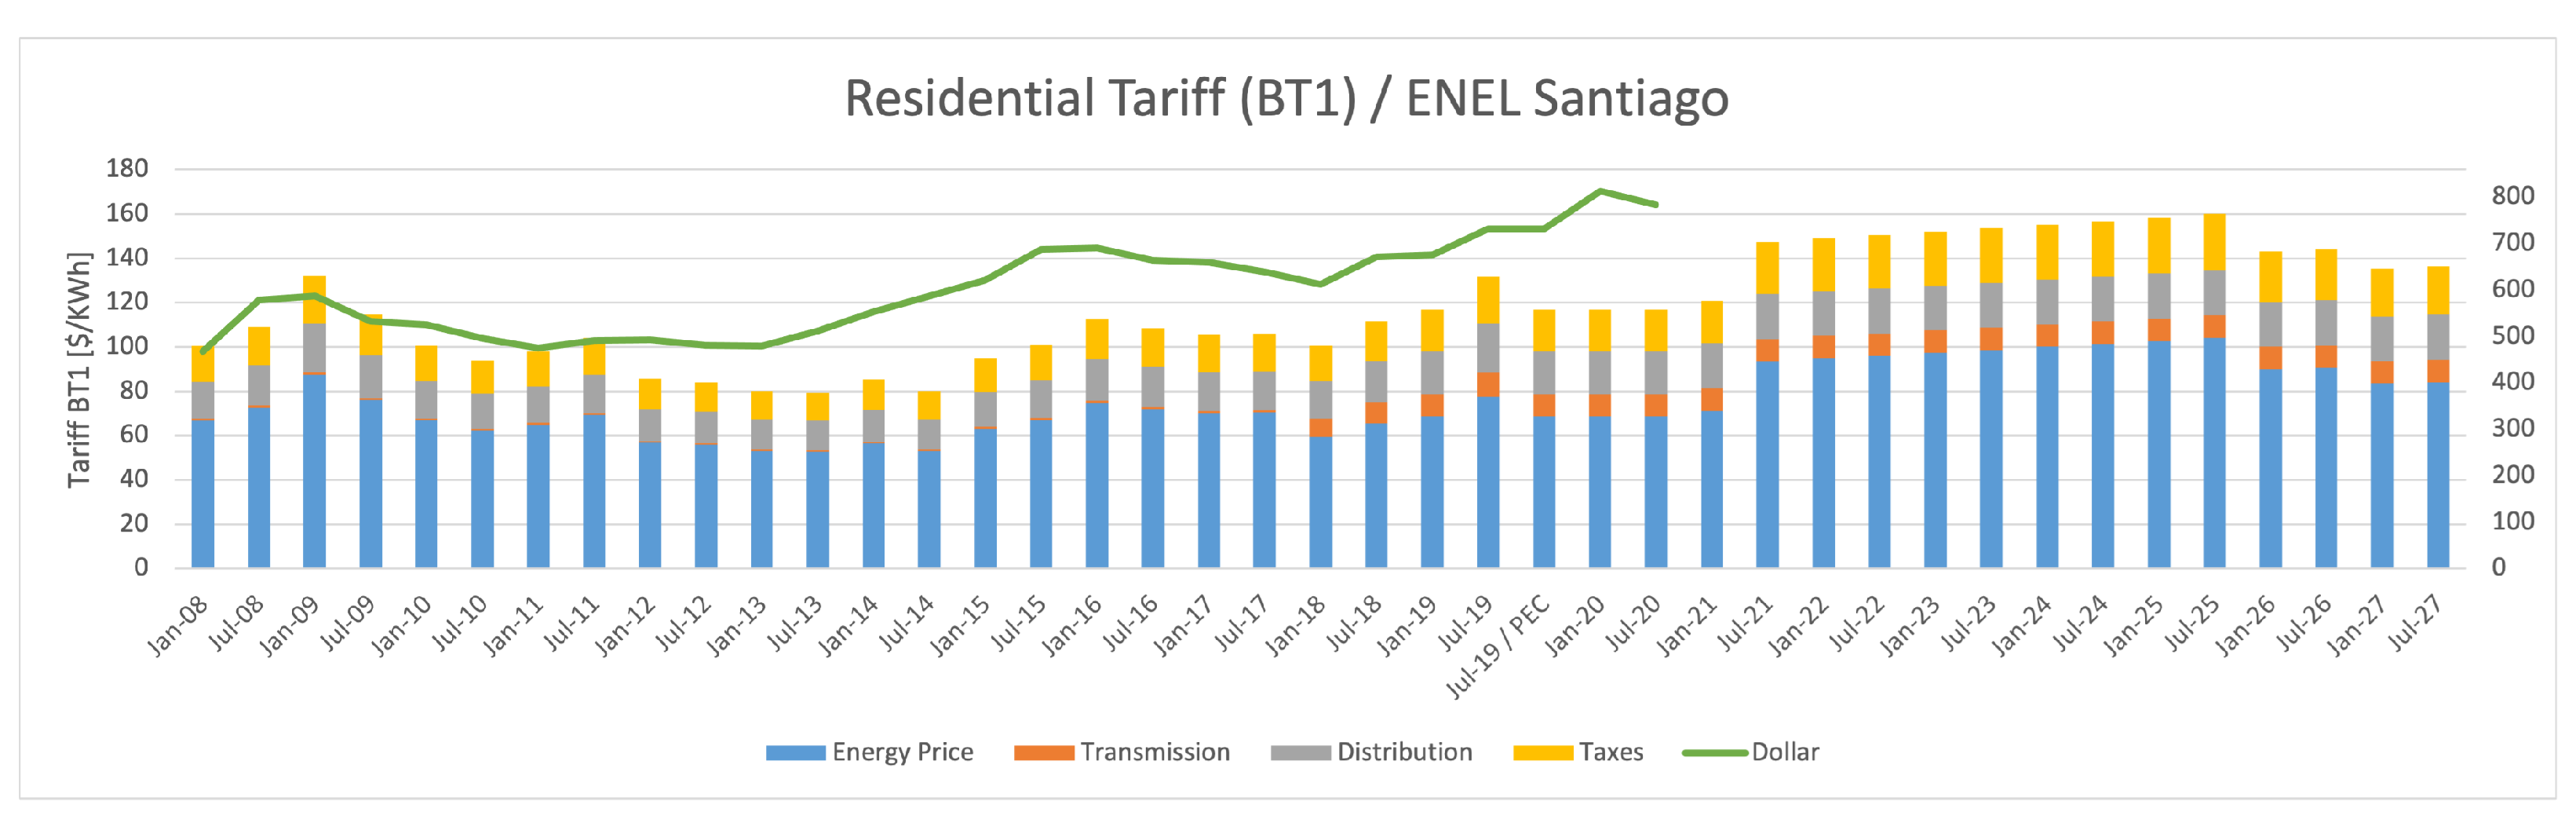
Figure 19 show the tariff reductions in three major cities in Chile, where it is considered that an additional charge associated with the energy price, which will allow the accumulated debt of USD 1.3450 MM to be cancelled.
5.2. Impact at the Distribution Level
Figure 17 presents the energy price to be charged until 2027 for clients living in the capital of Chile. Nowadays, there are 6.7 million regulated clients, of which 97% are residential ones, mostly living in Santiago.
It is almost paradoxical that between 2022 and 2027, the tariffs will be higher than those presented during 2019, which fostered the implementation of a stabilization mechanism.
Figure 18 shows the situation in a city located in the far north of Chile and where there is a high solar energy potential. It is incomprehensible for the people in that area that the tariffs remain high considering that they produce clean and sustainable energy.
On the other hand,
Figure 19 displays the case of a city in the far south, where the same phenomena as those described above occur. Tariffs for future years are higher than those registered for 2019.
6. Conclusions and Policy Implications
This work analyzes the Chilean energy price stabilization mechanism established in Law N 21.185, which seeks to freeze the electricity tariff for regulated customers due to the constant variability of the dollar produced by social and economic instability. The results show that the indexation of contracts to the last six-month average dollar price negatively impacts the initial objective established by the law.
The government authority had anticipated freezing electricity tariffs at least until July 2023. However, due to a conservative projection of the future dollar price, the mechanism will stop being effective, in the best-case scenario, by February 2022. This time limit is much shorter than what was established by the authority. Therefore, three main problems related to the implementation of this law are detected:
The USD 1350 MM was calculated by estimating the fluctuation of the dollar price between CLD 720 and 770 during the next two years.
It was not accurate to consider all the demands of regulated clients to apply the energy price stabilization mechanism. If the residential clients’ demand had been considered, the total demand would have been reduced to 65%.
When considering only the residential demand, the worst-case scenario of a CLD 900 price, the mechanism would stop being applicable only three months before the period was established. Thus, assuming that the exchange rate would not increase further, the mechanism would stop being effective 15 months earlier.
As the maximum debt will be reached sooner than expected, the payment of it might cause an increase in the tariffs for all the cities in the country. In some cases, the final tariff could be even higher than that of those forced to implement the stabilization mechanism.
Finally, a collateral impact detected by the authority was that this mechanism would affect the funding systems of companies producing non-conventional renewable energies. This is due to the fact that, in practice, the prices of supply contracts involved are being modified.


 ,
, 


