
Eco-Productivity Analysis of the Municipal Solid Waste Service in the Apulia Region from 2010 to 2017


Department of Industrial Engineering, University of Naples Federico II, 80125 Naples, Italy
Sustainability 2021, 13(21), 12008; https://0-doi-org.brum.beds.ac.uk/10.3390/su132112008
Submission received: 26 September 2021
/
Revised: 23 October 2021
/
Accepted: 26 October 2021
/
Published: 29 October 2021
(This article belongs to the Special Issue Sustainable Ecological Efficiency)
Abstract
:This paper presents a dynamic efficiency study of the solid waste management in the municipalities of the Apulia region (Southern Italy). The study employs the non-parametric Global Malmquist Index to measure the change in productivity of the municipal solid waste service from 2010 to 2017. Three different DEA-based models are implemented to measure productivity. The first model computes the service productivity solely from the economic perspective, while the second and third models compute the service productivity from both the economic and environmental perspectives. Adopting two distinct perspectives provides a more comprehensive insight into the performance of the waste management service considering the productivity and the eco-productivity of service provision. The results from the productivity analysis show that, between 2010 and 2017, the municipal solid waste sector was still facing a transitional period characterized by low cost-efficiency and productivity growth measurements. Vice versa, the efficiency and productivity indicators improve when the analysis is performed accounting for the environmental impact. Indeed, both the eco-efficiency and eco-productivity measures increase from 2010 to 2017. Findings demonstrate the critical importance to include environmental indicators in the efficiency and productivity analysis.
1. Introduction
The management of municipal solid waste (MSW) has become an important problem for many municipalities. The growing urbanization and the increasing number of people living in cities, the expanding consumption trends and changing lifestyles, the extreme variety of refuse generated in the urban context, and the complexity of the activities related to the management of waste have made the delivery of the MSW service very challenging [1,2].
In April 2010, Italy adopted the new EC Directive about Waste [3], which was introduced de facto by Decree no. 205 of 3 December 2010 [4]. This new directive privileged the concepts of material re-use and recycling. However, in a great number of municipalities, the waste management policy remains focused on the main objective of increasing the percentage of MSW that is selectively collected rather than increasing the amount of waste materials that are finally recycled. Hence, collecting urban waste selectively is an important step of MSW management, and a critical activity for achieving circularity. The MSW collection and transportation tasks are managed under the responsibility of municipalities in accordance with national and regional legislations, which set quantitative targets that should be achieved. The collection of MSW is generally entrusted by the municipality administration to private or in-house companies, and collection models and performance differ widely [5]. The average rate of the selectively collected fractions of MSW has steadily increased to 58.1% in 2018, for the most part thanks to the municipalities where curbside schemes have been successfully adopted [6]. Nevertheless, this figure is still below the target of 65% that should have been achieved by the end of 2012, as established by Decree no. 152/2006.
As for most public services, the search for increasing cost efficiency in the provision of the MSW service has been a major goal of municipalities in the last few years because of the scarcity of resources and budget constraints [7]. For this reason, municipality administrators, policy makers, and scholars are increasingly interested in evaluating the efficiency of the MSW service. Scholars have generally employed either parametric or non-parametric methodologies to obtain measurements of the MSW service efficiency [8].
Nonetheless, the new growing concern about sustainability issues, not only in terms of more efficient usage of economic resources, but also in terms of a reduced impact on the environment, has convinced researchers to include environmental indicators into the evaluation of the MSW service efficiency. Hence, a high level of eco-efficiency has become a necessary condition to achieve sustainable development.
The concept of eco-efficiency dates back to the early 1990s, when the World Business Council for Sustainability Development (WBCSD) proposed it as a new management model that every business should adopt to become more sustainable. More recently, the World Business Council for Sustainable Development (WBCSD) has extended the eco-efficiency concept to the urban context [9]. Over time, this concept is increasingly employed in the Public Sector to evaluate the effect of the combination of tools such as the policies, regulations, and adopted innovations aimed at improving the economic and environmental performance in the water management industry, energy production, and waste management [10].
Eco-efficiency can be defined as the ratio of the environmental performance measurement to the financial performance measurement. In this perspective, the goal is to obtain the lowest negative environmental impact (or, correspondingly, the highest environmental benefit) with the lowest consumption of economic resources. Following this view, scholars have employed linear programming methods to generate eco-efficiency indicators in the MSW sector [11,12].
This paper presents a study that employs the non-parametric Global Malmquist Productivity Index (GMPI) to analyze dynamic changes in the MSW service efficiency and eco-efficiency in the Apulian municipalities (southern Italy) between 2010 and 2017. As in previous research, different model specifications are used to obtain separate measurements for the efficiency and the eco-efficiency changes over time [13]. Adopting two different perspectives, i.e., one focusing only on cost-efficiency and the other one focusing on the environmental efficiency as well, allows to better assess the impact of the environmental concern (and benefit) on efficiency and productivity. Differently from existing research, a radial distance with a non-oriented approach was used to compute the efficiency, eco-efficiency, and GMPI measurements, because reducing the cost of the MSW service and increasing the environmental benefit are two goals that municipalities must achieve at the same time. Recent research has showed that these goals are compatible [14]. Maximizing the environmental benefit by increasing the quantity of sorted waste collected also allows to increase the revenue streams from selling recyclable raw materials, which compensate the costs borne by users who pay for the MSW service. Finally, as this paper adopts a dynamic perspective to analyze efficiency changes over time, the eco-productivity concept is introduced in addition to that of eco-efficiency [15]. The eco-productivity change is further decomposed into the eco-efficiency change and eco-technology change components. The relationship between the municipality size and the eco-efficiency and eco-productivity measures is also explored. Scholars who evaluated the performance of the MSW service in a non-parametric methodology framework generally privileged a static perspective to estimate eco-efficiency.
Henceforth, this study makes the following major contributions. Firstly, it employs the non-parametric eco-productivity concept to measure the productivity changes in the provision of the MSW service in the Apulian municipalities accounting for the environmental benefit owing to separate waste collection and recycling. Secondly, a non-oriented DEA modeling approach is applied to measure productivity and eco-productivity assuming that improving both the cost-efficiency and environmental benefit are compatible and important goals to achieve.
This paper is organized as follows. Section 2 presents the literature regarding efficiency and eco-efficiency measurement in the MSW sector. Section 3 describes the methodology employed in the study, illustrates sample, variables, and data sources. The results of the study are reported in Section 4, while Section 5 offers concluding remarks.
2. Literature Review
2.1. The Measurement of Efficiency in the MSW Sector
Simões and Marques [8] conducted an extensive literature review of studies on economic performance research in the municipal solid waste management industry. Their review includes 107 papers, covering the period from 1965 to the end of 2010. Scholars identified major quantitative methods and techniques used to measure economic performance in municipal solid waste management. These include parametric and non-parametric methods. Measuring the municipal solid waste management efficiency and identifying its major determinants was the main goal of these studies. Parametric methods employ either cost and/or production functions. Generally, scholars privilege these methods when the aim is to investigate the various types of service economies that might affect the average cost. The first econometric study that focused on cost saving in the waste collection sector dated back to the early 1960s. Hirsch [16] estimated the production cost function of the urban waste collection service in the St. Louis County (MI, USA). The author used a sample including 24 municipalities and collected data relative to fiscal year 1960. Hall and Jones [17] investigated the relationship among the per capita cost, waste quality characteristics, and community population for small-size rural communities in Texas. Kitchen [18] performed statistical analysis to determine variables that influence the average cost of the waste collection service and to what extent it is affected by scale economies. Antonioli and Filippini [19] estimated a translog cost function to examine the cost structure (total cost and variable cost functions) of a sample containing 30 utilities in the MSW industry in Italy between 1991 and 1995. The total volume of urban waste is one of the independent variables introduced in the regression model. The results showed a positive relationship between the waste quantity and the total and variable costs of service. Scholars who conducted these studies did not differentiate among the various fractions of waste. Thus, they were unable to account for the environmental concern and evaluate its effect on the cost and efficiency of the urban waste management service.
2.2. Linking Efficiency and Environment
Since the early 2000s, researchers, also as a result of an increasing environmental concern, have given greater attention to the different fractions of waste produced in the municipality context, linking cost-efficiency and environmental concerns. Callan and Thomas [20] implemented a simultaneous system of two cost functions, one for waste disposal and the other for recycling services. This joint system of both functions allowed them accounting for complementarities between these two services, investigating whether there are scope economies apart from scale economies. Dijkgraaf and Gradus [21] employed regression analysis to estimate the total cost function of the MSW service using data collected from 120 Dutch municipalities. They considered the paper, glass, and organic fractions of urban waste as independent variables affecting the cost of service. Bel and Fageda [22] used parametric analysis to estimate the cost structure of the MSW service of a sample including 65 municipalities in the region of Galicia (Spain) for the year 2005. The total cost of service delivery was included in the regression equation as the dependent variable, whereas the total quantity of waste and the percentage of waste designated for recycling were included in the group of independent variables. They found that the service cost depends on the total volume of collected waste, but they were unable to find a significative relationship between cost and recycling percentage. Bae [23] estimated the cost function of the MSW service for a sample of municipalities in North Carolina (USA). A hybrid translog cost function and data collected from 1997 to 2003 were used for empirical estimation. In this equation, the solid waste collection cost per site is a function of a set of exogenously determined input prices, waste volume, and some fixed factors related to MSW management (the implementation of recycling and reuse programs, landfill utilization, institutional setting, and so on). No significant differences in terms of cost saving emerged across municipalities with respect to the adoption of recycling and reuse programs. Bohm et al. [24] estimated two cost functions, one for the municipal solid waste collection and disposal services, and one for the curbside recycling service considering major drivers of cost and characteristics of recycling programs. They used a sample containing 428 municipalities. Factors describing the service characteristics were included in the cost equation as independent variables. Particularly, they hypothesized the existence of a non-linear relationship between the quantity of collected waste and the marginal and average costs of services. They found that several program-specific characteristics may affect recycling costs. Additionally, the results indicate that there are scale economies in the MSW collection and disposal sector, while the average costs increase when recycling amounts expand. Carvalho et al. [25] measured the cost-efficiency of the MSW service for 184 municipalities in New South Wales (NSW) and investigated the economies of size and density. The data used in the empirical analysis covered a period of six years, between 2000 and 2005. The scholars employed a stochastic frontier analysis method to estimate the cost functions of household recycling services under the assumptions of ‘true’ fixed-effects and ‘true’ random-effects. The total costs to provide the MSW service were included in the regression equation as the dependent variable, whereas the amounts of the collected unsorted household waste and recycling waste were included in the group of independent variables. They found that the NSW municipal waste services are not cost-efficient, and smaller utilities are more efficient than larger ones. Their study also revealed that there are significant economies of output density for the unsorted and the recycled fractions of municipal waste collection. Greco et al. [26] examined the drivers of cost in waste collection in Italy utilizing data gathered from both technical literature and field analysis. They estimated the full costs for different typologies of waste, i.e., paper and paperboard, heavy multi-material, organic, and unsorted waste, by implementing regression analysis. The full costs per capita for each waste type were introduced as the dependent variables in the regression equations. The percentage of separate waste on total waste collected and the total waste collected per capita were included in the equation as drivers of cost service. The findings showed that the collection of unsorted waste has the lowest cost when the amount of collected waste increases, while the collection of sorted waste generally has the highest cost.
2.3. Non-Parametric Efficiency and Eco-Efficiency Analysis
Recently, Campitelli and Schebek [27] reviewed 366 research articles that evaluated the performance of the municipal waste management service. Although the largest number of studies they examined were focused on a single city, in many studies, researchers performed benchmarking analyses to compare countries, regions, or cities. Their review highlighted that, over time, various non-parametric DEA-based models are frequently used in these studies to construct performance indicators to carry out benchmarking analyses. DEA has become increasingly popular in the measurement of productive efficiency, and the number of empirical applications in the MSW sector is now very large. Indeed, DEA has several strengths in comparison with parametric methods. The adoption of DEA does not require the knowledge of the production function, i.e., how the outputs depend on the inputs. Furthermore, more than one output can be used in the efficiency analysis. The first non-parametric DEA-based study dated back to the end of the 1980s. Vilardell i Riera [28] applied DEA to estimate the waste collection efficiency of 46 municipalities in Catalonia (Spain). Worthington and Dollery [29] employed an input-oriented DEA model to measure the technical and scale efficiencies of 103 municipalities in New South Wales (Australia) in the provision of the MSW service. Although they include the total amount of waste and the recyclable waste as discretionary outputs at the same time, their model specification considers only the cost-efficiency performance dimension and not the environmental one. García-Sánchez [30] employed DEA to estimate the efficiency of the street cleaning and waste collection services in 38 Spanish municipalities with more than 50,000 inhabitants. The DEA model specification includes three inputs measuring resource usage to provide services, i.e., staff, vehicles, and containers. However, the model does not include any financial data measuring the cost of service. Four variables (tonnage of waste, number of collection points, collection point density, and surface of the washed area) are used to measure the output of the services. The study is aimed at measuring the operational efficiency of the service and there is no differentiation between sorted and unsorted waste. Other researchers also privileged the measurement of the technical efficiency of the MSW service. Marques and Simões [31] applied DEA to calculate the efficiency of 29 Portuguese MSW operators in the secondary market. Data for fiscal year 2005 were used in the empirical analysis. Their basic model utilizes data relative to the operational expenses and capital costs as inputs, and the quantities of recycled waste and solid waste sent to landfills or to composting and incineration plants as outputs. Additionally, they assumed an input orientation. The basic DEA model was further specified assuming either constant or variable returns to scale to characterize the production technology. Benito-López et al. [32] applied bootstrapped DEA to calculate the efficiency of 1072 Spanish municipalities providing public street-cleaning and refuse collection services. They evaluated the impact of exogenous factors to correct the efficiency scores (i.e., the per capita income, the urban population density, and the comparative index of the importance of tourism as well as that of economic activity as a whole). Their model specification includes one input (the per capita cost of service) and two outputs (the annual production of residues and an index measuring the suitability of the service). Data relative to the year 2005 were used in the efficiency analysis. Simões et al. [33] estimated the efficiency of 196 waste collection services in Portugal, employing robust m-order non-parametric analysis. They used three inputs (staff, vehicles, and remaining operational expenditure) and one output (the total amount of waste collected). An input orientation and both constant and variable returns to scale were assumed. Guerrini et al. [34] implemented a robust non-parametric conditional order-m based method to estimate the efficiency of the waste collection service in 40 municipalities in the province of Verona (Italy). The total cost of waste collection was used as the production function input, while the volume of collected waste including the recyclable and residual fractions was the output. Exogenous variables related to the customer, household, and operational features were introduced into the analysis to measure efficiency while assuming input orientation to minimize the cost of service.
In the last few years, scholars using non-parametric methods also started to take into account the environmental performance in the evaluation of the MSW service efficiency. As Sarra et al. ([11], p. 757) highlight, conducting benchmarking studies in the MSW sector adopting only the economic perspective does not allow to usefully identify best practices and support decision-making. The scholars suggest evaluating the MSW service performance taking into account its cost efficiency and environmental impact. They estimated the efficiency of 289 municipalities in the Abruzzo region (Italy) between 2011 and 2013, applying a modified DEA model. Their model includes the unsorted waste as an undesired output to minimize, the separate waste as a desirable output to maximize, and the cost of service as an input to minimize. Díaz-Villavicencio et al. [35] proposed a directional distance function (DDF)-based eco-efficiency indicator to evaluate the joint economic and environmental performance of the MSW service in 143 municipalities in Catalonia (Spain) between 2000 and 2003. They differentiate between two types of outputs, desirable (recyclable waste, i.e., glass, paper and cardboard, and light packaging) and undesirable (other waste). Yang et al. [36] measured the efficiency of a sample of 33 Chinese cities collecting data relative to the year 2016. The scholars employed three-stage DEA to eliminate bias due to exogeneous variables and random disturbance. Inputs include the number of vehicles and equipment used to provide the service, as well as the fixed asset investment of treatment facilities. The quantity of MSW collected and transported and the rate of MSW harmless treatment are the outputs. Exposito and Velasco [37] evaluated the efficiency of the recycling market in the Spanish regions by adopting a DEA model specification having two inputs (fixed capital and labor cost), two desirable outputs (operational revenue and percentage of total recyclable waste), and one undesirable output (mixed collected waste). Agovino et al. [38] applied three different output-oriented DEA models to calculate the efficiency of MSW management in the Italian provinces from 2004 to 2011. The first and the second models estimate the waste service efficiency from the municipality and citizen perspective, respectively. The third model estimate efficiency from both perspectives. The model specification includes the volume of sorted and unsorted waste produced by each province. Scholars considered the unsorted fraction of waste as a bad output that should be minimized. Thus, they utilized a monotonic decreasing transformation to convert this output into a desirable one. Romano and Molinos-Senante [12] measured the eco-efficiency of 225 Tuscan municipalities performing meta-frontier DEA. The type of ownership of the MSW operator was used to cluster municipalities with respect to different production technologies. The study employed data for the year 2016. The model specification included three cost variables as inputs (total cost of unsorted and recyclables waste, and other costs), the unsorted waste as an undesirable output, and the sorted waste as a desirable output. A DDF DEA approach maximizing the desirable output generation and simultaneously minimizing the undesirable output was used to compute efficiencies. Delgado-Antequera et al. [39] adopted a non-radial weighted Russell directional distance model to estimate the eco-efficiency of 56 municipalities in Andalusia (Spain) using data for the year 2017. The model specification includes the total cost of MSW service as an input, three types of recyclable waste fractions as desirable outputs (paper, glass, and plastic collected), and the unsorted fraction of waste as an undesirable output. Exogeneous factors were used to group municipalities and investigate their influence on the efficiency measure. Llanquileo-Melgarejo et al. [13] implemented DEA to calculate the efficiency and eco-efficiency of the MSW service in 298 Chilean municipalities in the year 2018. Particularly, they adopted two different DEA model specifications, the first one for measuring the MSW operational efficiency and the second one for measuring the MSW eco-efficiency. Both models include the total costs of MSW collection and disposal as an input. The first model specification uses the quantity of MSW collected and disposed as the only output. The second model utilizes the quantities of four types of recyclable waste (paper and cardboard, glass, plastic, and organic waste) as desirable outputs and the quantity of unsorted waste as an undesirable output. All models adopted an input orientation and variable returns to scale. lo Storto [14] implemented a two-stage DEA approach to investigate the effectiveness–efficiency nexus in the evaluation of the MSW performance in the municipalities of the Apulia region (Southern Italy). In the first stage, an output-oriented DEA model specification was employed to measure technical, scale, and congestion efficiencies. In the second stage, panel Tobit analysis with random parameters was applied to analyze the effectiveness–efficiency nexus, considering municipality heterogeneities and context-specific variables.
2.4. Efficiency Changes over Time and Productivity Measurement
Few scholars conducted efficiency analyses adopting a dynamic perspective. Worthington and Dollery [40] applied the Malmquist Productivity Index (MPI) to evaluate the productivity of urban waste management, recycling services, planning, and regulatory services in New South Wales municipalities from 1993 to 1996. They adopted different sets of inputs and outputs for the specific services. In particular, they distinguished between the total domestic waste and the recyclable fraction of waste and considered the rate of recycling. Marques et al. [41] carried out a benchmarking study with the aim to calculate the X factor adopted in the waste sector regulation based on a tariff setting mechanism. They computed the Törnqvist index to measure the dynamic efficiency of 278 Portuguese municipalities in the waste collection, evaluating the catch-up effect and production technology shift. They used three different DEA models to estimate the efficiencies for the various waste management activities regulated by the authority (treatment of unsorted waste, selective collection, and treatment of pre-sorted waste). Each model employs the staff expenses and the other operational expenses as inputs and the quantity of waste as an output. Tüzüner and Alp [42] computed the non-parametric Malmquist Total Factor Productivity index to evaluate changes in efficiency and productivity of the solid waste management in Turkey and EU countries. Particularly, they adopted two model specifications using two distinct sets of inputs and outputs, the first one privileging the environment and the second one the economic perspective. In the first model, waste generation excluding the mineral fractions and municipal waste generation were used as inputs, while the municipal waste recycle ratio, the packaging wastes recycle ratio, and the packaging waste recovery ratios were used as outputs. In the second model, the environmental investment in the public sector and the environmental protection expenditure were employed as inputs, whereas the municipal waste recycle ratio, the packaging waste recycle ratio, and the packaging waste recovery ratio were employed as outputs. Data relative to the period 2006–2012 were used in the study. Pérez-López et al. [43] developed a novel non-parametric conditional order-m data panel methodology to generate a robust measure of average efficiency over a broad time horizon accounting for the impact of environmental constraints on efficiency. The methodology was implemented to analyze the waste collection service delivered in Spanish municipalities from 2002 to 2014. The total cost of the waste collection service, including capital and operational costs, was used in the model as an input, while the number of containers available to citizens for each type of waste collection, the annual production of waste, and the annual production of waste corrected by a factor measuring service quality were used as outputs.
This literature review showed that the largest part of the empirical research on the efficiency of the MSW service that employed a DEA methodological framework was conducted adopting a static perspective. Furthermore, even scholars who adopted a dynamic perspective did not measure both the productivity and the eco-productivity of the MSW service, comparing these metrics to assess the importance of the environmental benefit on productivity. Finally, scholars implemented either an input or an output orientation, prioritising the minimization of cost or the growth of the quantity of waste collected. However, meeting both of these goals at the same time is essential to improve the overall performance of the MSW service. Such a gap in the literature justifies the need for this study.
3. Materials and Methods
3.1. The Global Malmquist Productivity Index
DEA is a non-parametric method applied for the evaluation of a group of homogeneous units denominated decision making units (DMUs) that perform a production process converting multiple inputs into a set of outputs. DMUs are compared with respect to a performance indicator that measures the efficiency of the production process [44]. The method does not need any assumption regarding the functional form of the production function as it derives the distance functions by solving a linear program [45]. The efficiency scores are estimated by calculating the distance of the individual DMU from a benchmarking frontier generated by enveloping the efficient DMUs.
Scholars have suggested how to model dynamic efficiency changes calculating the Malmquist productivity index in a DEA setting [46]. However, the conventional approach adopted to measure the MPI suffers from problems determined by infeasibility and a lack of circularity. To avoid these problems, Pastor and Lovell [47] have proposed the Global Malmquist Productivity Index (GMPI), in which the index value is calculated measuring the distance against a global benchmark. The GMPI for DMU k can be defined as follows:
The GMPI can be further decomposed into two components, the first one measuring the efficiency change (EC) and the second one measuring the technology change (TC), as shown:
where
Let us suppose there are n DMUs having the input and output matrices X = (xij) ∈ Rm × n and Y = (yrj) ∈ Rp×n. The values s−∈ Rm and s+∈Rp indicate the input surplus and output shortage, respectively. Under the assumptions of variable returns to scale (VRS), the distance measurement for DMU k can be calculated by solving the following generalized linear program [48]:
where wI and wO are user-defined non-negative numbers, with at least one of them being positive. Under the assumption of non-orientation, wI = wO = 1.
3.2. Sample and Data Sources
This study considered all 258 municipalities of the Apulia region. Apulia is located in the south-east part of Italy and has a total extension of 19,366 square kilometers and population of 3,953,305 (as of the year 2019). Data utilized in the efficiency and productivity analysis cover the interval time from 2010 to 2017 and were retrieved from several sources (Istituto Superiore di Statistica-ISTAT; Catasto Rifiuti-Istituto Superiore per la Protezione e la Ricerca Ambientale; OpenBilanci-Banca dati dei bilanci dei comuni italiani; Dipartimento per gli Affari Interni e Territoriali-Ministero degli Interni). Specifically, data used in the study are relative to the years 2010, 2013, and 2017. The productivity analysis calculated the Malmquist index for two periods of time, the first from 2010 to 2013 and the second from 2013 to 2017. Two main reasons led to the adoption of the year 2013 to separate the two periods. Firstly, the Apulia government approved the regional urban waste management plan in 2013, establishing the targets for the sorted collection schemes of urban waste, treatment plants capacity, and administrative and organizational settings. Secondly, the year 2013 marks the end of the EU funds programming period of 2007–2013 and the beginning of the next 2014–2020 programming period. In this latter period, a large amount of public subsidies were granted to the Apulia municipalities to support innovation and performance improvement in urban waste management.
3.3. Model Specification and Variables
Three DEA model specifications were used in the efficiency analysis. These models share the same input, although they have different sets of outputs. Both input and output variables were measured with reference to the municipality size in terms of the number of inhabitants. Per capita indicators provide more granular information and allow a more effective comparison of municipalities having various sizes. The per capita annual cost to provide the MSW service was utilized as the unique input of the production process employed by the municipality to deliver service. Several scholars used cost measurements as inputs [11,29,31,34].
The output indicators employed to specify each model provide measurements of the per capita quantity of waste collected in the municipality [12,30,31]. However, the first model of this study (M1) considers the quantity of solid waste as a whole, without differentiating between its various typologies. This model was applied to calculate the MSW service efficiency and productivity. On the contrary, the second and third models (M2 and M3) take into account the different nature of waste, as in previous studies [11,14]. These models were implemented to calculate the MSW service eco-efficiency and eco-productivity following previous studies [12,13]. In the second model M2, the collected waste quantity was split into the sorted and unsorted amounts, considering this latter as a “bad” or “undesirable” output, consistent with the request of the European Union to reduce the quantity of unsorted waste in accordance with the European waste strategy. In the third model M3, the sorted quantity of waste was further broken down into six fractions to have a more refined measurement of the eco-efficiency and eco-productivity scores (i.e., organic, plastic, metal, paper and cardboard, glass, and “other materials” that include minor fractions of the selectively collected waste) [14]. Because, in the second and third models, the unsorted quantity of solid waste is an undesirable output, the linear monotonic decreasing transformation proposed by Seiford and Zhu [49] was applied to convert this output into a desirable one. Thus, a greater measurement of the new variable indicates a higher performance of the municipality with respect to the MSW service. Finally, in all models, variable returns to scale and non-orientation assumptions were adopted while running the linear program (4) to balance the need to increase the quantity of sorted waste, reduce the quantity of unsorted waste, and reduce the cost of service. Table 1 presents the model specifications for the three DEA models. Table 2 presents major statistics for variables. For the sake of brevity, statistics are reported only for the year 2017.
4. Results
As efficiency measurements are greatly sensitive to extreme values, data were preliminarily examined to identify outliers by implementing the procedure suggested by lo Storto [14]. Moreover, to generate more robust efficiency estimates, the bootstrap procedure suggested by Simar and Wilson was performed [50,51]. As common, 2000 replicates were used to bootstrap efficiency scores.
4.1. Efficiency and Productivity Trends
Figure 1 shows the average scores of the MSW service efficiency calculated for the three years covered by the study. Over the entire period, the measurement of the operational efficiency computed by model M1 is lower than the measurements of the eco-efficiencies calculated when performing the remaining two models (M2 and M3). Such a difference between efficiency scores estimated using different models greatly increases in 2013 and in 2017, close to about 45% and 34%, respectively. This difference between the efficiency and the eco-efficiency metrics also emerged from previous studies [13]. However, the different orientation employed in the specification of the DEA models in this study makes the comparison of relatively scarce significance. Furthermore, the findings also highlight that the eco-efficiencies estimated by models M2 and M3 have almost the same values. While efficiency firstly diminished from 0.58 (in the year 2010) to 0.49 (in the year 2013) and then increased to 0.59 (in the year 2017), during the period covered by the study, the eco-efficiency has progressively risen, from 0.63 to 0.70 according to model M2, and from 0.71 to 0.81 with respect to model M3. These figures suggest that both the regional waste management plan adopted since 2013 and the public policies supporting investment in the MSW sector had a positive impact, improving efficiency and eco-efficiency scores. Particularly, the implementation of the regional waste management plan contributed to boost the sorted waste collection rate by establishing targets and a more effective management of the waste materials’ flow. Additionally, the public policies supported by the EU and the national funds allowed to increase the capacity of the regional waste pre-treatment facilities and the municipal equipment used for the collection of waste, and implement campaigns aimed at raising the citizens’ awareness and commitment to environmental concerns. Indeed, the quantity of waste processed by mechanical and biological treatment plants to further refine the pre-sorted fraction of waste has significantly increased from 2007 to 2015, as shown by recent research [52].
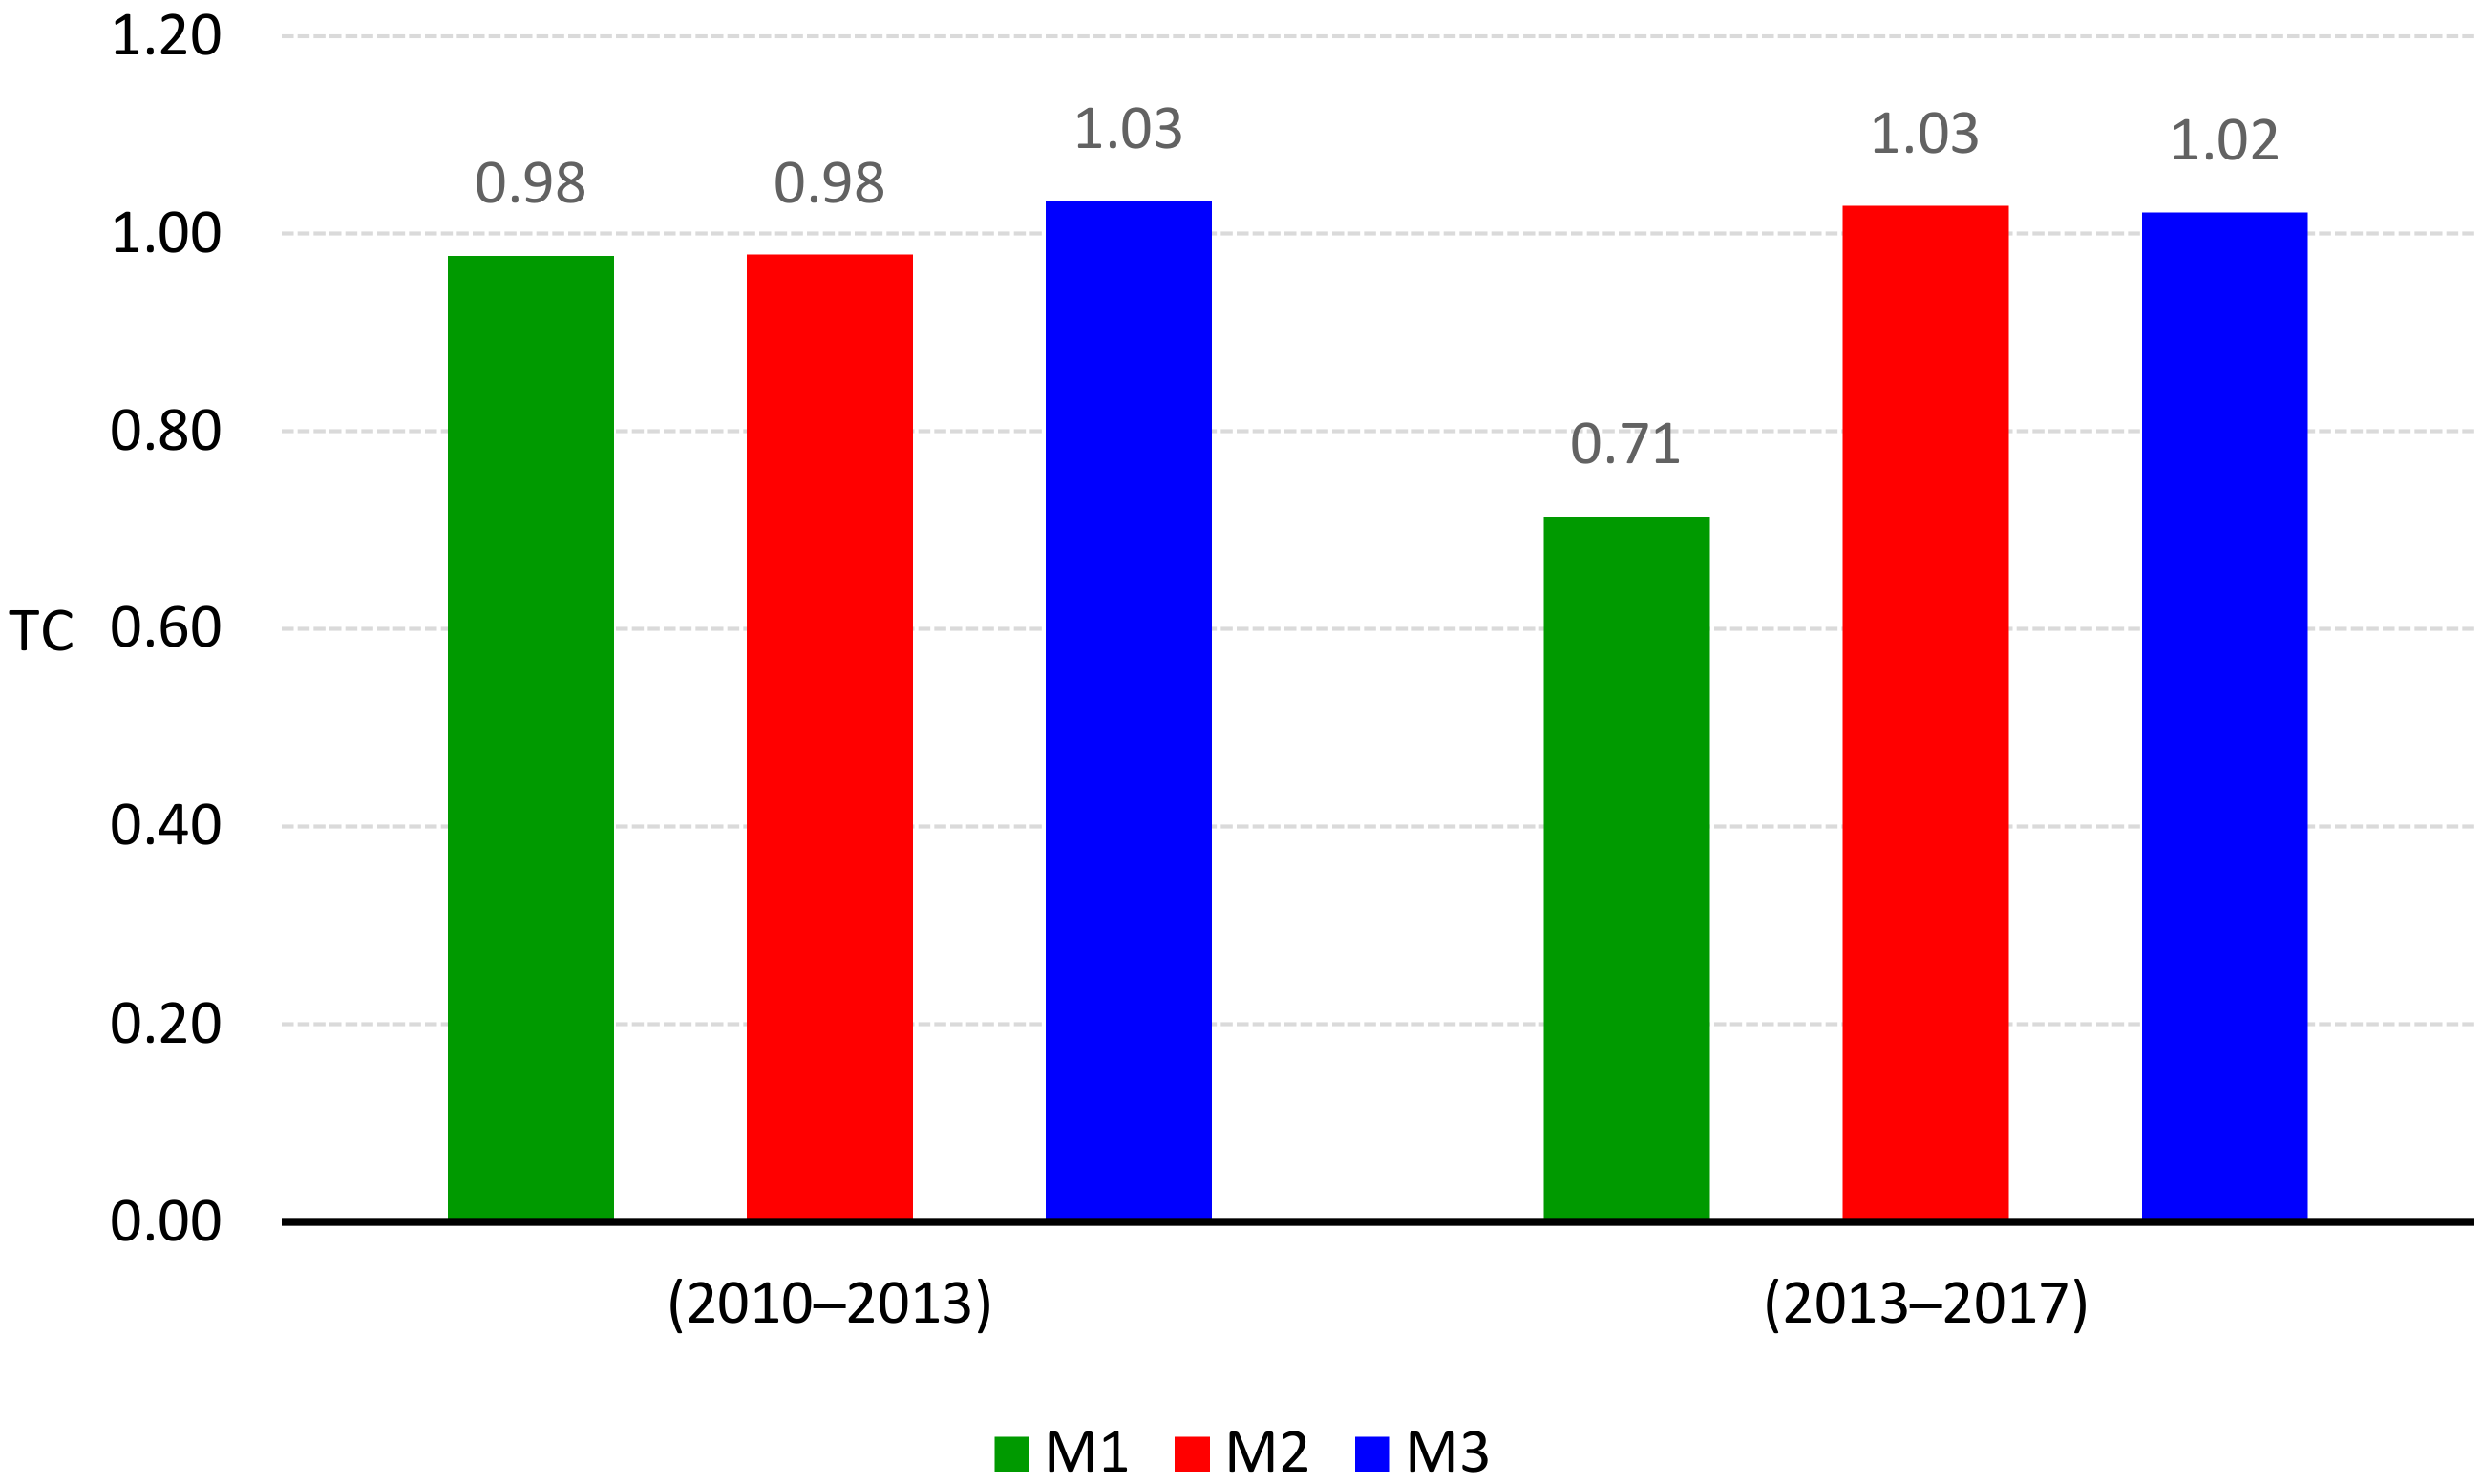
Figure 2 exhibits the quantification of the Global Malmquist Productivity Index for the periods 2010–2013 and 2013–2017. A GMPI value greater than the unity indicates that productivity is growing, while a value smaller than the unity indicates that productivity is decreasing. The same is true for the eco-productivity measurement in models M2 and M3. In both periods, the MSW service productivity index is lower than 1, emphasizing that, since 2010, there has been diminishing productivity measured from the economic perspective only. On the contrary, in both periods 2010–2013 and 2013–2017, there was an increase in the MSW service eco-productivity. This increase was slightly higher in the second period. The GMPI calculated for models M2 and M3 was 1.15 in the period 2010–2013 and ranged between 1.15 and 1.17 in the period 2013–2017. These findings are in line with what emerged from the static efficiency analysis, emphasizing that accounting for the environmental benefit linked to the sorted waste collection and recycling produces higher productivity measurements in comparison with those produced by restricting the analysis to economic concerns. Likewise, the figures highlight that the GMPI scores remained almost stable for all three models. However, the examination of the two productivity components, TC and EC, indicates that the influence of the latter on productivity differed across models and time periods. The higher measure of the eco-productivity index was determined to a large extent more by the positive change in the eco-efficiency EC than by the change in the eco-technology TC (Figure 3 and Figure 4). The EC values for models M2 and M3 were between 1.12 and 1.20 during the period from 2010 to 2013 and between 1.13 and 1.14 in the period 2013–2017. Conversely, the TC component adversely affected the productivity index between 2013 and 2017 in model M1, which did not account for the environmental benefit of the selectively collected waste. The productivity decrease was a consequence of the diminishing TC value (equal to 0.71), caused by an inward shift of the production frontier. The low TC score was partly compensated by an increase in the efficiency change value (EC = 1.26). However, between 2010 and 2013, in this model, the decrease in the MSW service economic productivity has been largely driven by a reduction in the economic efficiency change EC (equal to 0.86), as the TC score was very close to the unity (0.98). As the TC values indicate, there was almost no change in the production technology in the MSW sector from 2010 to 2013. Indeed, the TC measure was between 0.98 and 1.03 for the three DEA models, and the production technology frontier remained essentially stable in each model. From 2013 to 2017, the technology frontier for models M2 and M3 continued to remain stable despite the investment made by the operators to adopt innovative waste collection schemes and by the regional Government to increase the waste treatment plants’ capacity, as well as the changes in the institutional setting and governance of the MSW sector. However, such an innovation effort allowed the MSW service operators to utilize resources more efficiently, despite the increase in the cost for service provision. In this period, the transfer of financial contributions from the regional Government to renew the fleet of vehicles used to collect urban waste and enhance the infrastructure capacity allowed several municipalities to improve the rate of the selectively collected waste, approaching the targets stated in the waste management plan, at the same time increasing the general level of efficiency (EC = 1.26) and eco-efficiency (EC = 1.13 for model M2 and EC = 1.14 for model M3, respectively).
4.2. Municipality Size and Productivity
The sample was split into four equal-sized groups to explore the relationship between municipality size and productivity change using the quartiles of the municipality population to separate the single groups. Table 3 shows the groups obtained from the quartile analysis, with the population lower and upper bounds. Population data for this analysis were generated by averaging the population data relative to the three years considered in the study.
The measurements relative to the rate of waste selectively collected, the efficiency and eco-efficiency scores, and the productivity and eco-productivity were compared across the four groups. The non-parametric Kruskal–Wallis test was used for testing whether groups originate from the same distribution. For the sake of brevity, the DEA model M2 was excluded from this analysis because both eco-efficiency and eco-productivity scores obtained from the previous analysis do not substantially differ from those estimated through model M3.
Table 4 displays the average value of the rate of the sorted waste collection for each of the four groups in the three years. The rate of sorted waste was calculated as the ratio of the quantity of the selectively collected waste to the total quantity of waste collected in the municipality. In this table, changes in the rate of selectively collected waste between two consecutive years are included, too. Figures in this table indicate that, in 2010, on average, the small municipalities belonging to group G1 achieved the highest level of sorted waste collection, whereas the large municipality of group G4 had the worst performance with respect to the sorted waste collection rate. Nevertheless, differences between groups are not statistically significant. The rather high measurement of the standard deviation highlights that there was a not homogeneous situation across municipalities in group G1.
However, over time, the situation gradually evolved in 2013 with a generalized increase in the average rate of the sorted waste. Indeed, in the year 2013, the average rate of the sorted waste collection was almost the same in all groups, although there was a great dispersion of values as marked by the relatively high standard deviation measure. In 2017, the measurement of the percentage of the sorted waste collected in the municipalities further increased. This increase was especially pronounced for the municipalities of group G4. Even in 2017, the picture was quite not homogeneous within the individual groups, confirming the transient state of the urban solid waste sector in Apulia at that time. The non-parametric Kruskal–Wallis test attests to the statistical significance of differences between the average collection rates of the sorted waste fraction of the larger and smaller municipalities in groups G1 and G2. The examination of the average values of changes in the sorted waste collection rates confirms the better performance trend of the larger municipalities. These results diverge from what emerged in previous research, which showed that the waste recycling rate is negatively correlated with the population size [55]. Nevertheless, the rate of separately collected waste is influenced by a great number of interacting factors that should be accounted for in addition to municipality size [14]. Particularly, local policies, the level of citizens’ participation, and socio-demographic characteristics are critical factors that positively affect the sorted waste collection rate [56,57]. Hence, the results should be interpreted with caution. At the same time, however, the results indicate that, from 2010 to 2017, the MSW sector was a highly dynamic sector, still evolving in search of a steady configuration, and actors were constantly adapting to changing conditions set by new requirements, regulatory frameworks, consumer behaviors, availability of advanced technologies for the waste materials’ treatment, and financial resources [14,58,59].
Table 5 displays the average efficiencies and eco-efficiencies estimated by implementing models M1 and M3. The results indicate that, in 2010, the smaller municipalities of group G1 were on average less cost-efficient (slightly more than 53%), but more eco-efficient (about 74%), consistent with the highest rates of the separately collected waste highlighted in Table 4. The larger municipalities of group G4 were a little more efficient (about 57%). However, they achieved a lower eco-efficiency (67.10%). As shown in Figure 1, the average efficiency level diminishes by about 10% in comparison with the efficiency level in the year 2010. The smaller municipalities in group G1 were the worst performers. On the contrary, the average measurement of the eco-efficiency grew by about 3% across groups. The year 2017 witnessed a generalized growth in the MSW service efficiency common to all groups, bringing again the efficiency score to the level of the year 2010. At the same time, there was an increase in the average eco-efficiency level in all groups. In 2017, the average eco-efficiency measurements achieved by groups were between 80% and 82.22%. The findings indicate that, during the overall period considered in this study, the smaller municipalities in group G1 achieved the lowest efficiency scores, whereas efficiency was the highest in municipalities belonging to group G3. This suggests that economies of scale may be important to achieve efficiency in the provision of the MSW service, but there might be an optimal threshold, as emerged in earlier research [25]. However, the relationship between efficiency and municipality size needs further investigation. Indeed, the results emerging from earlier empirical research were either inconclusive or conflicting [33,60]. Contrarily, municipality size seems to have affected differently the eco-efficiency metrics in 2010 and 2013, as smaller municipalities were more eco-efficient when, on average, the percentage of the sorted waste collection was still low. With the general increase in the sorted waste collection rate from 2010 to 2017, the scale diseconomies of the first period left room for the emergence of constant returns to scale with a plausible negligible impact of size on the eco-efficiency measurement.
The results of the productivity and eco-productivity analysis across groups are presented in Table 6. The productivity measurement (GMPI_M1) was always below the unity level for the four groups in both the periods 2010–2013 and 2013–2017, even though there was a small productivity increase in the latter period. Conversely, the eco-productivity value (GMPI_M3) was always above the unity for all groups in both periods. The most significant improvement in the eco-productivity score was found in groups G1 (the period 2010–2013) and G2 (the period 2013–2017), achieving a score of 1.259 and 1.288, respectively. As in the previous section, the analysis of the TC and EC indicators provides important insights into the determinants influencing both productivity and eco-productivity changes. In the interval 2010–2013, the technological change associated with productivity (TC_M1) is always lower than the unity, except for group G1. Hence, the smaller municipalities experienced an outward shift in the MSW service production frontier, slightly increasing their waste management capacity and showing a better capability to adapt to the changing landscape. However, in the following period, with the increase in the percentage of separate waste collection and the growing cost to provide the MSW service, there was an inward shift of the technology frontier for all groups, independently of the municipality size. The TC_M1 measure further diminished from 2013 to 2017, having values between 0.703 and 0.723. The low measurements of the TC indicator suggest that, over time, there has been a technological change in the production process underlying the delivery of the MSW service that negatively affected the municipality productivity. In the DEA modeling framework, this regression of the production technology that manifests itself as an inward shift of the production boundary indicates that there were constraints to the municipalities’ capability to exploit better opportunities. The scores of the technological change linked to the measurement of the municipality eco-productivity (TC_M3) were always greater than the unity. In both time intervals and for all groups, there was a shift forward in the MSW service production technology, unlike what has emerged from the analysis of the productivity measured from the economic perspective alone. However, the Kruskal–Wallis test reveals that there were significant differences between groups only in the period 2010–2013. Specifically, there were statistically significant differences between group G4 and the remaining three groups. The largest sized municipalities of group G4 experienced the highest improvement in the production technology evaluated from the joint economic and environmental perspectives. There were no significant differences between groups from 2013 to 2017. These differences between the measurements of the TC scores calculated for models M1 and M3 in the last period suggest that the adoption of innovative waste collection schemes, selection, and disposal gradually modified the production function of the MSW service as the quantity of the separately collected waste has acquired relevance. Hence, measuring the MSW service productivity changes without discriminating between the different kinds of output (i.e., the unsorted and sorted fractions of waste) provides a biased performance measure.
Figures relative to the EC indicator measured from the economic perspective alone (EC_M1) bring to light important differences between the two time-intervals considered in the productivity analysis. In the first period (2010–2013), we observe a negative efficiency change (EC), with no important differences across groups. This efficiency reduction also emerged in Figure 1. However, after 2013, the results indicate a quantum leap ahead of the efficiency, as emphasized by the EC measurements varying from 1.228 to 1.300. In this case as well, there is no significant difference between groups. This significant efficiency improvement was mostly linked to the inward movement of the efficiency frontier caused by the change of the production function. The analysis of the EC values computed from the eco-efficiency perspective (EC_M3) shows a different picture. Indeed, EC was always greater than the unity. This indicates that, since 2010, on average, all municipalities improved the efficiency level in the provision of the MSW service, regardless of their population size. However, no relevant differences emerged from the comparison between EC scores in the two periods. This growing trend of the MSW efficiency measure also emerged in other empirical studies adopting different DEA modeling frameworks [14,61].
5. Conclusions
This paper has presented a dynamic efficiency study of the urban solid waste management service in the municipalities of the Apulia region in the south of Italy. Particularly, the study employed the non-parametric Global Malmquist Productivity Index (GMPI) to evaluate the productivity change in the MSW service from 2010 to 2017. Three different DEA-based model specifications were implemented to calculate the GMPI, having different grades of refinement. The first model calculated the MSW service productivity from the economic (cost-efficiency) perspective alone, whereas the second and third models calculated the MSW service productivity from the economic and environmental (environmental impact) perspectives at the same time. The adoption of these two distinct perspectives allowed having a more comprehensive insight into the performance of the MSW sector in Apulia considering the productivity and the eco-productivity of service provision.
Figures relative to the rate of the separate collection of urban waste indicate that, on average, the large as well as small municipalities in 2017 were far from achieving the target of 65% set by national and regional laws. These data, together with findings emerging from the efficiency and productivity analysis, suggest that, from 2010 to 2017, the MSW sector was still facing a transitional period. Even in 2017, the picture of the sector remained rather not homogeneous within the groups of municipalities of a similar size.
During the period covered by the study, the governance of the waste management system at the regional level has undergone several changes. The Legislative Decree no. 22/1997 (the so called “Ronchi Decree”) and Legislative Decree no. 152/2006 provided for the introduction of optimal management areas (ATOs) to organise the municipal waste collection and management to exploit scale and scope economies linked to the construction and management of facilities, waste collection, and transport to treatment plants and landfill. However, following the continuous evolution of the national and Apulia regional legislations, the original fifteen ATOs were firstly merged into six ATOs, one for every province, and finally merged into one single regional ATO. At the same time, in accordance with regional legislation, the Apulia territory was further divided into 38 waste collection macro-areas (AROs) in order to improve the efficiency of waste collection, optimise the flows of collected waste transported to the treatment facilities, and raise the quality of materials destined for recycling. However, these AROs were very heterogeneous in terms of their size, partly to respond to the demographic and territorial characteristics, and partly under the influence of localistic pressures that often led to identifying sub-optimal boundaries for them. Additionally, the low cost of waste disposal in landfills (about €50 per ton of waste, lower than in the other Italian regions), as well as the postponement of the entry into force from 2011 to 2014 of the “ecological tax” introduced by the Regional Law no. 38/2011, discouraged municipalities to increase the rate of separate collection and recycling and reduce the amount of unsorted waste sent to landfills. Consequently, until 2014, MSW management in Apulia was still largely dependent on the utilization of landfills, exposing the region to EU penalties and, at the same time, generating considerable negative environmental externalities and increasingly unacceptable socio-sanitary risk conditions.
Hence, the framework for the adoption of the municipality waste management plans, public measures, and actions aimed at supporting the implementation of more effective waste management policies and, particularly, at increasing the amount of waste fractions separately collected and subsequently recycled, was characterized by a high level of uncertainty and complexity. Contrary to expectations from the adoption of the Legislative Decree no. 152/2006, the MSW sector has remained very fragmented, preventing municipalities from making the most of scale economies and increasing their cost efficiency. The effects of such complexity and uncertainty have been a low percentage of sorted waste collection and recycling and an inefficient waste management service, as marked by the reduced score of the average economic efficiency between 2010 and 2017, and particularly in 2013, resulting from the study. The productivity analysis performed from the economic perspective has showed that the efficiency values achieved in 2017 within the single municipality groups do not substantially differ from those obtained in 2010. However, the efficiency measurements improve when the productivity analysis is performed accounting for the environmental impact, too. The eco-efficiency increased steadily from 2010 to 2017 in all municipality groups, although at different rates. Similarly, the productivity analysis performed from the economic and environmental perspectives produces better results than the productivity analysis that disregards the environmental benefit of the sorted waste collection. Indeed, eco-productivity has been constantly growing from 2010 to 2017, unlike the economic productivity alone. Both the technology and the efficiency change components contributed to the increase in the eco-productivity measurement. These findings may help policy makers and municipality administrators to identify best practices and implement improvement plans for the mid and long term, aimed at increasing the percentage of the sorted waste collection without increasing, or even reducing, the MSW service costs.
The results suggest that, between 2010 and 2017, the MSW sector in the Apulia region was still evolving in search of a stable and efficient configuration. The changes brought upon by the regulatory framework, consumer trends, innovation in the waste materials treatment technology, and scarcity of financial resources forced the actors to constantly adapt to modifying conditions. Therefore, not taking into account such variability may bias the efficiency analysis when a short-term or a static viewpoint is assumed. Moreover, the results of this study demonstrate the critical importance of including environmental indicators in the efficiency analysis, because estimating the MSW productivity while adopting the economic perspective alone may be reductive and provide incomplete or even incorrect insights.
Funding
This research received no external funding.
Institutional Review Board Statement
Not applicable.
Informed Consent Statement
Not applicable.
Data Availability Statement
Data used in the study are available in publicly archived datasets. Links to the archives are as follows: Istituto Nazionale di Statistica—ISTAT (https://www4.istat.it/it/prodotti/banche-dati, accessed on 20 January 2019); Catasto Rifiuti—ISPRA (https://www.catasto-rifiuti.isprambiente.it, accessed on 15 January 2019); Openbilanci (https://openbilanci.it, accessed on 17 January 2019); Ministero degli Interni (https://finanzalocale.interno.gov.it, accessed on 25 January 2019).
Conflicts of Interest
The author declares no conflict of interest.
References
- Contreras, F.; Hanaki, K.; Aramaki, T.; Connors, S. Application of analytical hierarchy process to analyze stakeholders preferences for municipal solid waste management plans, Boston, USA. Resour. Conserv. Recycl. 2008, 52, 979–991. [Google Scholar] [CrossRef]
- Zhu, D.; Asnani, P.U.; Zurbrügg, C.; Anapolsky, S.; Mani, S. Improving Municipal Solid Waste Management in India: A Sourcebook for Policy Makers and Practitioners; WBI Development Studies; World Bank: Washington, DC, USA, 2008; Available online: https://openknowledge.worldbank.org/handle/10986/6916 (accessed on 3 October 2020).
- EC. Directive 2008/98/EC of the European Parliament and of the Council of 19 November 2008 on Waste and Repealing Certain Directives. 2008. Available online: https://eur-lex.europa.eu/legal-content/EN/TXT/PDF/?uri=CELEX:32008L0098&from=IT (accessed on 27 September 2020).
- MATTM. Decreto Legislative n. 205 del 3 Dicembre 2010—Disposizioni di Attuazioni della Direttiva 2008/98/CE. 2010. Available online: https://www.minambiente.it/sites/default/files/dlgs_03_12_2010_205.pdf (accessed on 10 September 2020).
- Volta, G. Sistemi di Raccolta e Trasporto dei Rifiuti in Provincia di Bologna: Analisi Tecnico-Economica, e di Impatto Ambientale di Soluzioni Organizzative Finalizzate all’Aumento della Raccolta Differenziata; Franco Angeli Edizioni: Milan, Italy, 2011. [Google Scholar]
- ISPRA. Rapporto Rifiuti Urbani—Edizione 2019; Rapporti 313/2019; Istituto Superiore per la Protezione e la Ricerca Ambientale (ISPRA): Rome, Italy, 2019. Available online: https://www.isprambiente.gov.it/it/pubblicazioni/rapporti/rapporto-rifiuti-urbani-edizione-2019 (accessed on 10 January 2021).
- Lo Storto, C. The trade-off between cost efficiency and public service quality: A nonparametric frontier analysis of Italian major municipalities. Cities 2016, 51, 52–63. [Google Scholar] [CrossRef]
- Simões, P.; Marques, R.C. 2012 Influence of regulation on the productivity of waste utilities. What can we learn with the Portuguese experience? Waste Manag. 2012, 32, 1266–1275. [Google Scholar] [CrossRef]
- UNESCAP. Are We Building Competitive and Liveable Cities? Guidelines for Developing Eco-Efficient and Socially Inclusive Infrastructure; United Nations: Bangkok, Thailand, 2011; Available online: https://www.unescap.org/sites/default/files/Guides%20for%20developing%20eco%20efficient%20infra_full.pdf (accessed on 20 March 2021).
- Ehrenfeld, J.R. Eco-efficiency. Philosophy, theory, and tools. J. Ind. Ecol. 2005, 9, 6–8. [Google Scholar] [CrossRef]
- Sarra, A.; Mazzocchitti, M.; Rapposelli, A. Evaluating joint environmental and cost performance in municipal waste management systems through data envelopment analysis: Scale effects and policy implications. Ecol. Indic. 2017, 73, 756–771. [Google Scholar] [CrossRef]
- Romano, G.; Molinos-Senante, M. Factors affecting eco-efficiency of municipal waste services in Tuscan municipalities: An empirical investigation of different management models. Waste Manag. 2020, 105, 384–394. [Google Scholar] [CrossRef] [PubMed]
- Llanquileo-Melgarejo, P.; Molinos-Senante, M.; Romano, G.; Carosi, L. Evaluation of the Impact of Separative Collection and Recycling of Municipal Solid Waste on Performance: An Empirical Application for Chile. Sustainability 2021, 13, 2022. [Google Scholar] [CrossRef]
- Lo Storto, C. Effectiveness-efficiency nexus in municipal solid waste management: A non-parametric evidence-based study. Ecol. Indic. 2021, 131, 108185. [Google Scholar] [CrossRef]
- Mahlberg, B.; Luptacik, M. Eco-efficiency and eco-productivity change over time in a multisectoral economic system. Eur. J. Oper. Res. 2014, 234, 885–897. [Google Scholar] [CrossRef] [Green Version]
- Hirsch, W.Z. Cost functions of an urban government service: Refuse collection. Rev. Econ. Stat. 1965, 47, 87–92. [Google Scholar] [CrossRef]
- Hall, J.P.; Jones, L.L. Costs of solid waste management in rural Texas communities. J. Agric. Appl. Econ. 1973, 5, 115–119. [Google Scholar] [CrossRef] [Green Version]
- Kitchen, H.M. A statistical estimation of an operating cost function for municipal refuse collection. Public Financ. Rev. 1976, 4, 56–76. [Google Scholar] [CrossRef]
- Antonioli, B.; Filippini, M. Optimal Size in the Waste Collection Sector. Rev. Ind. Organ. 2002, 20, 239–252. [Google Scholar] [CrossRef]
- Callan, S.J.; Thomas, J.M. Economies of scale and scope: A cost analysis of municipal solid waste services. Land Econ. 2001, 77, 548–560. [Google Scholar] [CrossRef]
- Dijkgraaf, E.; Gradus, R.H. Cost Savings of Contracting Out Refuse Collection. Empirica 2003, 30, 149–161. [Google Scholar] [CrossRef]
- Bel, G.; Fageda, X. Empirical analysis of solid management waste costs: Some evidence from Galicia, Spain. Resour. Conserv. Recycl. 2010, 54, 187–193. [Google Scholar] [CrossRef] [Green Version]
- Bae, S. Public versus private delivery of municipal solid waste services: The case of North Carolina. Contemp. Econ. Policy 2010, 28, 414–428. [Google Scholar] [CrossRef]
- Bohm, R.A.; Folz, D.H.; Kinnaman, T.C.; Podolsky, M.J. The costs of municipal waste and recycling programs. Resour. Conserv. Recycl. 2010, 54, 864–871. [Google Scholar] [CrossRef]
- Carvalho, P.; Marques, R.C.; Dollery, B. Is bigger better? An empirical analysis of waste management in New South Wales. Waste Manag. 2015, 39, 277–286. [Google Scholar] [CrossRef]
- Greco, G.; Allegrini, M.; Del Lungo, C.; Gori Savellini, P.; Gabellini, L. Drivers of solid waste collection costs: Empirical evidence from Italy. J. Clean. Prod. 2015, 106, 364–371. [Google Scholar] [CrossRef]
- Campitelli, A.; Schebek, L. How is the performance of waste management systems assessed globally? A systematic review. J. Clean. Prod. 2020, 272, 122986. [Google Scholar] [CrossRef]
- Vilardell, I.; Riera, I. L’eficiéncia en l’actuació de les administracions municipals: Una avaluació del servei de recollida de residus sólids urbans. Rev. Econ. Catalunya 1989, 11, 20–33. [Google Scholar]
- Worthington, A.C.; Dollery, B.E. Measuring efficiency in local government: An analysis of New South Wales municipalities’ domestic waste management function. Policy Stud. J. 2001, 29, 232–249. [Google Scholar] [CrossRef] [Green Version]
- García-Sánchez, I.M. The performance of Spanish solid waste collection. Waste Manag. Res. 2008, 26, 327–336. [Google Scholar] [CrossRef]
- Marques, R.C.; Simões, P. Incentive regulation and performance measurement of the Portuguese solid waste management services. Waste Manag. Res. 2009, 27, 188–196. [Google Scholar] [CrossRef] [PubMed]
- Benito-López, B.; Moreno-Enguix, M.; Solana-Ibañez, J. Determinants of efficiency in the provision of municipal street-cleaning and refuse collection services. Waste Manag. 2011, 31, 1099–1108. [Google Scholar] [CrossRef] [PubMed]
- Simões, P.; Carvalho, P.; Marques, R.C. Performance assessment of refuse collection services using robust efficiency measures. Resour. Conserv. Recycl. 2012, 67, 56–66. [Google Scholar] [CrossRef]
- Guerrini, A.; Carvalho, P.; Romano, G.; Marques, R.C.; Leardini, C. Assessing efficiency drivers in municipal solid waste collection services through a non-parametric method. J. Clean. Prod. 2017, 147, 431–441. [Google Scholar] [CrossRef]
- Díaz-Villavicencio, G.; Didonet, S.R.; Dodd, A. Influencing factors of eco-efficient urban waste management: Evidence from Spanish municipalities. J. Clean. Prod. 2017, 164, 1486–1496. [Google Scholar] [CrossRef]
- Yang, Q.; Fu, L.; Liu, X.; Cheng, M. Evaluating the Efficiency of Municipal Solid Waste Management in China. Int. J. Environ. Res. Public Health 2018, 15, 2448. [Google Scholar] [CrossRef] [Green Version]
- Exposito, A.; Velasco, F. Municipal solid-waste recycling market and the European 2020 Horizon Strategy: A regional efficiency analysis in Spain. J. Clean. Prod. 2018, 172, 938–948. [Google Scholar] [CrossRef]
- Agovino, M.; D’Uva, M.; Garofalo, A.; Marchesano, K. Waste management performance in Italian provinces: Efficiency and spatial effects of local governments and citizen action. Ecol. Indic. 2018, 89, 680–695. [Google Scholar] [CrossRef]
- Delgado-Antequera, L.; Gémar, G.; Molinos-Senante, M.; Gómez, T.; Caballero, R.; Sala-Garrido, R. Eco-efficiency assessment of municipal solid waste services: Influence of exogenous variables. Waste Manag. 2021, 130, 136–146. [Google Scholar] [CrossRef]
- Worthington, A.C.; Dollery, B.E. Empirical analysis of productivity in Australian local government, 1993/94 to 1995/96. Public Adm. Q. 2002, 26, 234–269. [Google Scholar]
- Marques, R.C.; Simões, P.; Pinto, F.S. Tariff regulation in the waste sector: An unavoidable future. Waste Manag. 2018, 78, 292–300. [Google Scholar] [CrossRef] [PubMed]
- Tüzüner, Z.; Alp, İ. Comparison of solid waste management performances of Turkey and EU countries associated with Malmquist Index. Politek. Derg. 2018, 21, 75–81. [Google Scholar] [CrossRef] [Green Version]
- Pérez-López, G.; Prior, D.; Zafra-Gómez, J.L. Modelling environmental constraints on the efficiency of management forms for public service delivery. Waste Manag. 2021, 126, 443–453. [Google Scholar] [CrossRef]
- Cooper, W.W.; Seiford, L.M.; Tone, K. Data Envelopment Analysis: A Comprehensive Text with Models, Applications, References and DEA-Solver Software, 2nd ed.; Springer: New York, NY, USA, 2007. [Google Scholar]
- Färe, R.; Grosskopf, S.; Weber, W.L. Measuring school district performance. Public Financ. Q. 1989, 17, 409–428. [Google Scholar] [CrossRef]
- Färe, R.; Grosskopf, S.; Lindgren, B.; Roos, P. Productivity change in Swedish pharmacies 1980–1989: A non-parametric Malmquist approach. J. Prod. Anal. 1992, 3, 85–102. [Google Scholar] [CrossRef]
- Pastor, J.T.; Knox Lovell, C.A. A global Malmquist productivity index. Econ. Lett. 2005, 88, 266–271. [Google Scholar] [CrossRef]
- Cheng, G.; Qian, Z.; Zervopoulos, P.D. Overcoming the Infeasibility of Super-Efficiency DEA Model: A Model with Generalized Orientation; MPRA Paper 31991; University Library of Munich: Munich, Germany, 2011; Available online: https://mpra.ub.uni-muenchen.de/31991/1/MPRA_paper_31991.pdf (accessed on 12 February 2021).
- Seiford, L.M.; Zhu, J. Modeling undesirable factors in efficiency evaluation. Eur. J. Oper. Res. 2002, 142, 16–20. [Google Scholar] [CrossRef]
- Simar, L.; Wilson, P.W. Sensitivity analysis of efficiency scores: How to bootstrap in nonparametric frontier models. Manag. Sci. 1998, 44, 49–61. [Google Scholar] [CrossRef] [Green Version]
- Simar, L.; Wilson, P.W. Statistical inference in nonparametric frontier models: The state of the Art. J. Prod. Anal. 2000, 13, 49–78. [Google Scholar] [CrossRef]
- Lo Storto, C. La Raccolta Differenziata dei Rifiuti Solidi Urbani in Puglia: Valutazione Ex-Post degli Interventi di Policy Finanziati nel Ciclo di Programmazione 2007–2013; Unpublished Research Report; Regione Puglia, Nucleo di Valutazione e Verifica degli Investimenti Pubblici: Bari, Italy, 2019; Available online: https://por.regione.puglia.it/documents/43777/346647/PdV+Regione+Puglia+2014-20+-+ricerca+RSU+ex+post+2007-13.pdf/90c87394-5c6f-098e-9351-54f73af5cd14?t=1596734909457 (accessed on 10 July 2021).
- Shaffer, J.P. Multiple Hypothesis Testing. Ann. Rev. Psychol. 1995, 46, 561–584. [Google Scholar] [CrossRef]
- Perneger, T.V. What’s Wrong with Bonferroni Adjustments. Brit. Med. J. 1998, 316, 1236–1238. [Google Scholar] [CrossRef]
- Gaeta, G.L.; Ghinoi, S.; Silvestri, F. Municipal performance in waste recycling: An empirical analysis based on data from the Lombardy region (Italy). Lett. Spat. Resour. Sci. 2017, 10, 337–352. [Google Scholar] [CrossRef]
- Folz, D.H. Municipal Recycling Performance: A Public Sector Environmental Success Story. Public Adm. Rev. 1999, 59, 336–345. [Google Scholar] [CrossRef]
- Rybova, K. Do Sociodemographic Characteristics in Waste Management Matter? Case Study of Recyclable Generation in the Czech Republic. Sustainability 2019, 11, 2030. [Google Scholar] [CrossRef] [Green Version]
- Magrini, C.; Biagini, G.; Bellaera, F.; Palumbo, L.; Bonoli, A. Evolution of the urban waste management system in the Emilia-Romagna region. Detritus Multidiscip. J. Waste Resour. Residues 2021, 15, 152–166. [Google Scholar]
- Sannino, D.; Ludovica, B.; Buzzi, I.; Ceccantoni, G.; Conte, I.; De Palma, C.; Ferrari, E.; Gualtieri, S.; Guerrieri, V.; Magris, C.; et al. Assetti Organizzativi e Gestionali del Servizio Rifiuti Urbani. National Technical Report. 2019. Available online: https://reopenspl.invitalia.it/banche-dati/monitor-spl/monitor-rifiuti (accessed on 10 July 2021).
- Carvalho, P.; Marques, R.C. Economies of size and density in municipal solid waste recycling in Portugal. Waste Manag. 2014, 34, 12–20. [Google Scholar] [CrossRef]
- Lombardi, G.V.; Gastaldi, M.; Rapposelli, A.; Romano, G. Assessing efficiency of urban waste services and the role of tariff in a circular economy perspective: An empirical application for Italian municipalities. J. Clean. Prod. 2021, 323, 1029097. [Google Scholar] [CrossRef]
Figure 1.
MSW service efficiency and eco-efficiency scores in 2010, 2013 and 2017.

Figure 2.
MSW service productivity and eco-productivity in the periods 2010–2013 and 2013–2017: GMPI measurements.
Figure 2.
MSW service productivity and eco-productivity in the periods 2010–2013 and 2013–2017: GMPI measurements.

Figure 3.
MSW service productivity and eco-productivity in the periods 2010–2013 and 2013–2017: TC measurements.
Figure 3.
MSW service productivity and eco-productivity in the periods 2010–2013 and 2013–2017: TC measurements.

Figure 4.
MSW service productivity and eco-productivity in the periods 2010–2013 and 2013–2017: EC measurements.
Figure 4.
MSW service productivity and eco-productivity in the periods 2010–2013 and 2013–2017: EC measurements.


Table 1.
Input and output variables used in DEA models’ specification.
| Variable | Description | Type | DEA Models | ||
|---|---|---|---|---|---|
| M1 | M2 | M3 | |||
| Per capita cost of service | annual cost of the MSW service per inhabitant | input | ✓ | ✓ | ✓ |
| Per capita total waste | total annual waste per inhabitant | output (good) | ✓ | ||
| Per capita total sorted waste | total annual sorted waste per inhabitant | output (good) | ✓ | ||
| Per capita unsorted waste | annual amount of unsorted fraction of waste per inhabitant | output (bad) | ✓ | ✓ | |
| Sorted waste fraction amounts per capita: | |||||
| Organic | annual amount of organic fraction of sorted waste per inhabitant | output (good) | ✓ | ||
| Plastic | annual amount of plastic fraction of sorted waste per inhabitant | output (good) | ✓ | ||
| Metal | annual amount of metal fraction of sorted waste per inhabitant | output (good) | ✓ | ||
| Paper and cardboard | annual amount of paper fraction of sorted waste per inhabitant | output (good) | ✓ | ||
| Glass | annual amount of grass fraction of sorted waste per inhabitant | output (good) | ✓ | ||
| Other materials | annual amount of sorted waste not included in the preceding categories | output (good) | ✓ | ||
Table 2.
Main statistics of input and output variables for the year 2017.
| Variable | Measurement Unit | Mean | Max | Min | Source of Data |
|---|---|---|---|---|---|
| Per capita cost of service | €/inhab. | 164.02 | 512.68 | 83.54 | OpenBilanci; Ministero degli Interni |
| Per capita total waste | kg/inhab. | 439.94 | 1628.90 | 143.53 | Catasto Rifiuti-ISPRA |
| Per capita total sorted waste | kg/inhab. | 166.48 | 514.59 | 2.12 | Catasto Rifiuti-ISPRA |
| Per capita unsorted waste | kg/inhab. | 273.46 | 1356.62 | 58.54 | Catasto Rifiuti-ISPRA |
| Sorted waste fraction amounts per capita: | |||||
| Organic | kg/inhab. | 53.73 | 202.38 | 0 | Catasto Rifiuti-ISPRA |
| Plastic | kg/inhab. | 18.69 | 62.59 | 0 | Catasto Rifiuti-ISPRA |
| Metal | kg/inhab. | 2.23 | 22.45 | 0 | Catasto Rifiuti-ISPRA |
| Paper and cardboard | kg/inhab. | 34.68 | 127.59 | 0 | Catasto Rifiuti-ISPRA |
| Glass | kg/inhab. | 25.09 | 78.42 | 0 | Catasto Rifiuti-ISPRA |
| Other materials | kg/inhab. | 27.34 | 272.27 | 0.05 | Catasto Rifiuti-ISPRA |
Note: for the year 2017, the sample includes 245 municipalities after the removal of outliers.
Table 3.
Groups of municipalities by population size.
| Group | Population | Number of Municipalities | |
|---|---|---|---|
| Lower Bound | Upper Bound | ||
| G1 | 458 | 3705 | 62 |
| G2 | 3706 | 7804 | 61 |
| G3 | 7805 | 16,079 | 61 |
| G4 | 16,080 | 319,231 | 61 |
Table 4.
Main statistics relative to the sorted waste rate for the four groups.
| Variable | G1 | G2 | G3 | G4 | K–W Test Statistics | Asymptotic Significance (Two-Tailed) p-Value a | Pairwise Comparison between Groups b |
|---|---|---|---|---|---|---|---|
| Mean (St.Dev) | Mean (St.Dev) | Mean (St.Dev) | Mean (St.Dev) | ||||
| %SW (2010) | 19.21% | 16.60% | 16.95% | 13.91% | 5382 | 0.146 | |
| (14.13%) | (8.97%) | (11.46%) | (6.20%) | ||||
| %SW (2013) | 23.79% | 20.37% | 24.89% | 23.74% | 4361 | 0.225 | |
| (14.07%) | (14.63%) | (15.99%) | (18.04%) | ||||
| %SW (2017) | 36.08% | 33.86% | 40.99% | 47.89% | 13,820 | 0.003 | (2–4) ***; (1–4) ** |
| (21.10%) | (20.00%) | (21.19%) | (20.83%) | ||||
| Δ%SW (2010–2013) | 4.58% | 3.77% | 7.94% | 9.83% | 4669 | 0.198 | |
| (14.39%) | (11.98%) | (13.80%) | (18.14%) | ||||
| Δ%SW (2013–2017) | 12.28% | 13.49% | 16.10% | 24.15% | 15,473 | 0.001 | (1–4) ***; (2–4) ** |
| (21.59%) | (21.28%) | (19.93%) | (21.92%) |
Table 5.
Main statistics relative to model M1 and M3 efficiencies for the four groups.
| Variable | G1 | G2 | G3 | G4 | K–W Test Statistics | Asymptotic Significance (Two-Tailed) p-Value a | Pairwise Comparison between Groups b |
|---|---|---|---|---|---|---|---|
| Mean (St.Dev) | Mean (St.Dev) | Mean (St.Dev) | Mean (St.Dev) | ||||
| Eff_M1 (2010) | 53.88% | 58.99% | 60.89% | 57.47% | 9033 | 0.029 | (1–3) ** |
| (13.83%) | (15.25%) | (13.81%) | (12.25%) | ||||
| Eff_M3 (2010) | 74.03% | 70.69% | 71.15% | 67.10% | 13,702 | 0.003 | (4–2) **; (4–1) *** |
| (12.28%) | (17.29%) | (13.58%) | (12.15%) | ||||
| Eff_M1 (2013) | 43.72% | 49.88% | 51.80% | 48.85% | 19,762 | 0.000 | (1–2) *; (1–4) **; (1–3) *** |
| (11.51%) | (15.08%) | (11.44%) | (10.16%) | ||||
| Eff_M3 (2013) | 77.13% | 71.24% | 74.58% | 71.10% | 12,602 | 0.006 | (4–1) ***; (2–1) * |
| (11.04%) | (13.97%) | (10.45%) | (11.19%) | ||||
| Eff_M1 (2017) | 54.74% | 60.23% | 62.14% | 58.40% | 11,788 | 0.008 | (1–2) **; (1–3) *** |
| (11.61%) | (11.12%) | (13.48%) | (9.95%) | ||||
| Eff_M3 (2017) | 80.92% | 80.02% | 81.88% | 82.22% | 4397 | 0.222 | |
| (12.56%) | (9.31%) | (11.98%) | (12.83%) |
Table 6.
Main statistics relative to model M1 and M3 MPI, TC, and EC for the four groups.
| Variable | G1 | G2 | G3 | G4 | K–W Test Statistics | Asymptotic Significance (Two-Tailed) p-Value a | Pairwise Comparison between Groups b |
|---|---|---|---|---|---|---|---|
| Mean (St.Dev) | Mean (St.Dev) | Mean (St.Dev) | Mean (St.Dev) | ||||
| GMPI_M1 (2010–2013) | 0.841 | 0.851 | 0.834 | 0.819 | 1862 | 0.601 | |
| (0.192) | (0.189) | (0.161) | (0.168) | ||||
| GMPI_M3 (2010–2013) | 1.259 | 1.031 | 1.146 | 1.162 | 17,464 | 0.001 | (2–4) ***; (1–4) *** |
| (1.794) | (0.181) | (0.540) | (0.271) | ||||
| GMPI_M1 (2013–2017) | 0.908 | 0.904 | 0.886 | 0.876 | 0.419 | 0.936 | |
| (0.220) | (0.226) | (0.205) | (0.174) | ||||
| GMPI_M3 (2013–2017) | 1.094 | 1.288 | 1.114 | 1.197 | 10,115 | 0.018 | (1–4) **; (2–4) * |
| (0.296) | (0.757) | (0.237) | (0.234) | ||||
| TC_M1 (2010–2013) | 1.012 | 0.991 | 0.964 | 0.942 | 12,297 | 0.006 | (4–2) *; (4–1) *** |
| (0.127) | (0.102) | (0.084) | (0.052) | ||||
| TC_M3 (2010–2013) | 1.031 | 1.002 | 1.032 | 1.068 | 26,914 | 0.000 | (1–4) ***; (2–4) ***; (3–4) * |
| (0.324) | (0.136 | (0.132) | (0.083) | ||||
| TC_M1 (2013–2017) | 0.703 | 0.714 | 0.723 | 0.715 | 2992 | 0.393 | |
| (0.084) | (0.095) | (0.085) | (0.056) | ||||
| TC_M3 (2013–2017) | 1.016 | 1.043 | 1.008 | 1.020 | 1813 | 0.612 | |
| (0.080) | (0.182) | (0.071) | (0.051) | ||||
| EC_M1 (2010–2013) | 0.840 | 0.865 | 0.866 | 0.872 | 0.373 | 0.946 | |
| (0.209) | (0.201) | (0.154) | (0.186) | ||||
| EC_M3 (2010–2013) | 1.250 | 1.037 | 1.116 | 1.088 | 4741 | 0.192 | |
| (1.709) | (0.196) | (0.513) | (0.220) | ||||
| EC_M1 (2013–2017) | 1.300 | 1.285 | 1.228 | 1.229 | 3067 | 0.381 | |
| (0.307) | (0.353) | (0.260) | (0.246) | ||||
| EC_M3 (2013–2017) | 1.070 | 1.205 | 1.115 | 1.172 | 8809 | 0.032 | (1–4) ** |
| (0.223) | (0.497) | (0.215) | (0.206) |
Publisher’s Note: MDPI stays neutral with regard to jurisdictional claims in published maps and institutional affiliations. |
© 2021 by the author. Licensee MDPI, Basel, Switzerland. This article is an open access article distributed under the terms and conditions of the Creative Commons Attribution (CC BY) license (https://creativecommons.org/licenses/by/4.0/).
Share and Cite
MDPI and ACS Style
lo Storto, C. Eco-Productivity Analysis of the Municipal Solid Waste Service in the Apulia Region from 2010 to 2017. Sustainability 2021, 13, 12008. https://0-doi-org.brum.beds.ac.uk/10.3390/su132112008
AMA Style
lo Storto C. Eco-Productivity Analysis of the Municipal Solid Waste Service in the Apulia Region from 2010 to 2017. Sustainability. 2021; 13(21):12008. https://0-doi-org.brum.beds.ac.uk/10.3390/su132112008
Chicago/Turabian Stylelo Storto, Corrado. 2021. "Eco-Productivity Analysis of the Municipal Solid Waste Service in the Apulia Region from 2010 to 2017" Sustainability 13, no. 21: 12008. https://0-doi-org.brum.beds.ac.uk/10.3390/su132112008
Note that from the first issue of 2016, this journal uses article numbers instead of page numbers. See further details here.