
A Parametric Analysis for Short-Term Residential Electrification with Electric Water Tanks. The Case of Spain


1
Research Development and Innovation Department, Instituto Valenciano de la Edificación, 46022 València, Spain
2
Instituto Tecnológico de la Energía, 46980 Paterna, Spain
*
Author to whom correspondence should be addressed.
Sustainability 2021, 13(21), 12070; https://0-doi-org.brum.beds.ac.uk/10.3390/su132112070
Submission received: 8 September 2021
/
Revised: 27 October 2021
/
Accepted: 28 October 2021
/
Published: 1 November 2021
(This article belongs to the Special Issue Human-Centric Building Energy Efficiency Research for Sustainable Development)
Abstract
:Buildings are great contributors to global GHG emissions, because they are responsible for direct and indirect emissions. In light of increased renewable energy share in the electricity mix, it is crucial to boost residential electrification for building decarbonization. Consequently, building regulation ought to send the proper signals to the market to encourage electrification and avoid establishing new fossil fuel-based infrastructure, which may lock in future interventions and seriously compromise climate change mitigation. This paper studies short-term residential electrification with electric water tanks in Spain using a parametric analysis considering several water heater configurations with various sizes and management strategies, using different draw-off profiles, actual time-dependent electricity prices, and CO2 factors. The results demonstrate significant GHG savings when substituting fossil fuel boilers for any water heater configuration. However, current electricity prices are such that technology change is only cost effective for low hot water demands (1–2 people) and the provided fossil fuel supply is completely removed from dwellings. The exploitation of implicit demand response increases cost-effectiveness. The analysis of Spanish regulation shows that some elements of current policies on energy efficiency in buildings hamper residential electrification, consequently policy changes are proposed.
1. Introduction
Anthropogenic climate change has been knocking at our door for a long time, and it stands as the greatest menace humanity must face in the XXI century, even above the COVID-19 pandemic. Hence, the adhesion to the international Paris Agreement [1] and declaration of climate and environmental emergency by the European Parliament [2]. Accordingly, the European Green Deal [3] drafted the ambition of responding to the climate crisis by transforming the EU into a fair, modern, resource-efficient, and competitive economy based on a just transition leaving no one behind. All of which yielded the specific mission to turn the EU into a zero net emissions of greenhouse gases society in 2050. In order to reach such ambitious objective, the Climate Target Plan 2030 [4] proposed the milestone of cutting greenhouse gas (GHG) emissions in the EU by at least 55% by 2030 compared with 1990 levels. The impact assessment [5] demonstrated that such emission reduction is economically feasible, strategic for technology industry leadership, and can create jobs at the same time [6]. The Clean Energy for all Europeans Package [7] previewed the revisions of key legislative instruments affecting all sectors of the economy and mandated through a governance regulation [8] for each member state (MS) to develop a National Energy and Climate Plan 2021. Such a plan constitutes the strategic roadmap towards meeting the national decarbonization targets, adapted to each regional context and they must be updated each five years and are subject to biannual progress reports.
Although fully decarbonizing our societies requires a multidimensional approach, it is widely acknowledged that the energy supply sector must play a key role. Not only because it is the greatest contributor to GHG emission in the EU [9], but more importantly due to its unique ability to substitute fossil fuels with renewable alternatives for electricity production. The decarbonization of the EU’s energy generation sector started more than a decade ago [9] and is “unstoppable worldwide” according to the World Economic Forum [10]. Furthermore, such renewable generated electricity indirectly decarbonizes other major polluting sectors such as transport, industries, and buildings [11]. However, the prerequisite for that to happen is that electrification on the demand side meets the rapid growth of renewable production of the supply side. According to IEA, electrification is the main driver for the decarbonization of the building sector [12]. Yet in 2018, 47.55% of the household final energy consumption over the average EU-28 was fossil fuel-based. Thus, immediate and widespread deployment of existing technology towards increasing the electrification of buildings is needed.
Buildings represent, during their use and operation, approximately 40% of the energy consumption and over one third of the equivalent direct and indirect GHG emissions [13]. Direct emissions mainly due to their high energy needs and poor efficiency, and indirect because a high share of the emissions in the power and heat sector are caused by the energy buildings’ demand. Approximately 75% of the EU building stock is not up to current building standards [13]; most lack thermal insulation, use old technologies and wasteful appliances. Furthermore many of them still rely on fossil fuels, representing more than 53% for space heating over 2018 EU-28’s household final energy consumption, almost 60% for water heating, and over 50% for cooking [14]. In addition to being great contributors to climate change, inefficient buildings often imply energy poverty, and relevant impacts in occupant’s health [15]. Although there are high hopes for the large scale renovation behind the EU renovation wave [16] and the revision of key policy instruments [3], there are several voices who are claiming that direct equipment change may be a better option towards accelerating the energy transition [17] and rapidly increase end-use electrification. Shallow and medium interventions are the most common in the EU [18]. Further, most residential buildings have a duplicity of energy supply, having to pay both the electricity and the fossil fuel bills. Hence, removing direct fossil fuel use from buildings not only would help decarbonize the urban environment, but also have a positive effect on the domestic economy. Nevertheless, the EU policy has contributed to the “silo” thinking [19], placing greater emphasis on the tightening of minimum energy performance requirements for new buildings and increasing energy efficiency through the revised Energy Performance In Buildings Directive (EPBD) [20]; increasing the renewable energy share in buildings and in the electricity production mix through the revised Energy Efficiency Directive [21] and Renewable Energy Directive [22], respectively; and energy market design [23,24] through the Internal Market for Electricity Directive, rather than directly promoting electrification in buildings as a horizontal cross-cutting approach.
There is an urgent need to rapidly remove fossil fuels from buildings [12,19,25]. Whereas new developments should aim to the positive energy building paradigm, existing buildings are in urgent need of dedicated renovation action plans. The heating service accounts for 77.29% of the fossil fuel consumption in EU buildings, natural gas being the preferred fuel [14]. Increasing retrofit rates and deep renovation, with joint interventions covering envelope improvements and equipment change, are key strategies for building decarbonization [12,26] as well as for leveraging actions towards economic recovery [16]. However, in spite of deep renovation being the flagship initiative, it requires public support in order to be widespread and cost-efficient [27,28]. On the contrary, the direct equipment change for individual domestic hot water production with electric water tanks represents a cost-effective action towards rapidly removing fossil fuel use from dwellings. Researchers have not treated this in much detail on account of electric resistance technology having a negative reputation [29], and being less efficient than heat pumps. However, the considerable lower capital cost of electricity resistance water heaters compared with heat pump technologies [30] places the former as a key element for the immediate and massive electrification in buildings. In addition to directly removing fossil fuels, widespread introduction of thermal energy storage represents a key infrastructure deployment able to provide flexibility services to the electricity market [31] and shifting demand to off-peak hours [32].
Several researchers have considered the question of building electrification as a relevant decarbonization strategy [17,29,33,34,35], focusing on electric heat pump technologies [33,34,35] and electric resistances [36,37,38]. However, to date, research has given considerably more attention to the former than the latter, with special emphasis on the heating service [35,39] over water heating in dwellings [30,36,37,38]. Moreover, existing research places greater emphasis on the impact on grid stability and capacity [35,39], and environmental impact [17,38,40], rather than the economic benefits for the occupants of the building. S.V. Raghavan, et al. [36] included electric water heaters among the scenarios for the water heating of buildings in California, finding that high electricity prices made it the least cost-effective technology. However, the focus was not at a dwelling level, thus not considering the impact on the occupants’ comfort. They left flexibility services and demand shifting out of the analysis. C.M. Keinath and S. Garimella [30] performed an analysis at dwelling level, including tankless and storage electric water heaters, finding that resistance water heaters were the least cost-effective alternatives only behind oil fueled technologies. Notwithstanding, in the analysis, a single water heater configuration was used, and variable electricity prices were neglected. Alternatively, M. Casanovas-Rubio and J. Armengou [37] included variable electricity prices in the analysis, and reached analogous conclusions with respect to electric water heaters. In this study a single configuration of water heater and occupant behavior was analyzed. W. Liu, et al. [38] performed a cradle-to-cradle analysis of several water heating technologies, finding that electric water tanks were the worst performers. Nevertheless, the authors pointed out that such poor environmental results were affected by the high presence of fossil fuels in the electricity mix. In fact, electric water tanks were found to have the lowest materials and products use, and end-of-life environmental impact compared with other alternatives.
The main scope of this paper is to identify which concrete building policy instruments can boost building electrification, and to provide an assessment of the benefits a widespread short-term electrification of domestic hot water with electric water tanks may have following a user-centered approach. The remainder of this paper is structured as follows: Section 2 provides context information about building electrification in Spain. Section 3 presents the methodology used for the comparative assessment of electrification options for water heating. Section 4 presents results and discusses them. Finally, in Section 5 conclusions are set together and policy recommendations for the case of Spain are proposed.
2. Building Electrification. The Case of Spain
2.1. Enabling Policy and Market Conditions
Spain’s National Energy and Climate Plan (PNIEC 2021–2030) [41], includes several concrete measures for the electrification of the energy system; i.e., boosting major renewable generation projects, distributed generation, deployment of self-consumption and renewable integration measures into the electricity system and the market. Concerning major generation projects, Spain launched at the end of 2020 the first renewable energy auction mechanism with calendarized implementation up to 2025 [42]. Regarding distributed generation, new regulation was passed in October 2018 [43], removing previous barriers for self-consumption of on-site electricity generation. The norm was further improved in 2019 [44], simplifying administrative requirements, although there are regions and municipalities that have not adapted their policy accordingly. In June 2020, the first definition of renewable energy communities was introduced in the country’s legislation [45]. These regulations will promote citizens’ empowerment while changing electricity production into a mix with high shares of renewable energy. Furthermore, citizens’ empowerment can also be achieved through demand response mechanisms. As defined in the European Directive 2019/944 [23], “demand response means the change of electricity load by final customers from their normal or current consumption patterns in response to market signals, including in response to time-variable electricity prices or incentive payments, or in response to the acceptance of the final customer’s bid to sell demand reduction or increase at a price in an organized market”. In this sense, it is possible to divide the demand response into two possibilities:
- Implicit demand response: This implies a change in load profile due to time-variable electricity prices (indexed prices to the pool market, two or more periods’ tariffs), which exist in most countries. This kind of demand response is easy to implement and affordable for citizens as it does not require technological improvements or automatic control. For residential users, electric water heaters with storage tanks whose electric consumption can be programmed into the most inexpensive hours of the day, represent an affordable and effective enabler of this kind of demand response.
- Explicit demand response: This takes place when it is possible to offer an increase or reduction in electricity consumption in exchange for economic remuneration. However, implementation of this kind of demand response presents some barriers:
- ○
- Technology: it requires automatic control of loads;
- ○
- Market and regulatory: specific markets to sell the flexibility provided by users must exit. In Spain, there are markets related to balance services where this flexibility can be offered, but they are not open to residential agents, since a minimum flexibility capacity of 1 MW is required [46] and the aggregator figure is not fully defined in Spanish regulation, being there a lack of technical specifications [45].
As mentioned, the aggregator may play a key role in the development of explicit demand response as it acts as an intermediary between final users and organized flexibility markets. Currently, residential users can only participate in implicit demand response.
With regards to building electrification, although the PNIEC 2021–2030 included a declaration of intent, there is no direct policy banning fossil fuels from being installed in dwellings. Thus, contravening the recommendation from the International Energy Agency [12], unlike some countries which have removed technology neutrality from their building policy [47,48].
The main energy performance in building regulation at a country level is the national building code (CTE-DB-HE), with its most recent update made in 2019 [49], and the energy performance certification [50,51]. For a review of the Spanish transposition of the EPBD refer to [52]. The details of the calculation methodology and requirements in relation to the EPB standards can be found in [53], and are common for the justification of the minimum energy performance requirements and for energy performance certification.
The residential building stock in Spain amounts to 25.7 million dwellings, with more than half being constructed before the first regulation with requirements on the minimum thermal insulation in buildings (NBE-CT 79). Moreover, less than 15% of the existing building stock was built after the first version of the building code was passed [54]. The Spanish Long Term Renovation Strategy (LTRS) set the ambition of reaching a total of 1.2 million dwellings for envelope intervention up to 2030 which posits a considerable challenge given the current annual residential renovation figure is less than 30,000 [55], with almost 80% being shallow, and less than 1% deep renovations [54]. The main difficulties to widespread building renovation in Spain were identified by the ODYSSEE-MURE project [54] and are related to huge payback periods, mainly due to reduced energy savings on account of the milder weather compared with other countries; energy tariffs with a significant share of fixed costs [56], and the prominence of multifamily buildings, which require broad agreements between building owners towards renovating the building envelope [57]. Consequently, although contravening the “energy efficiency first” principle, directly intervening on the building technical systems and incorporating on-site renewable generation are gaining more attention as strategies to decarbonize the building stock more rapidly.
Regarding the thermal installations, most dwellings are equipped with individual technical systems, with fossil fuels accounting for 56.53% of the energy used for space and sanitary water heating. There is a prominence of several devices for heating (1.3 devices per household according to SECH-SPAHOUSEC project), with natural a gas conventional boiler being the most popular generation system for space and water heating [58]. The poor building quality along with the inefficient and fossil fuel-based equipment cause Spanish buildings to absorb 29.5% of the final energy, slightly below the EU average, considering the milder weather [54]. According to Spain’s LTRS and PNIEC 2021–2030, by 2030 3.5 million of thermal installations need to be renovated, leveraging several incentive plans linked to improvements on the calculated building energy performance certificate (EPC). Current legislation calls for any intervention in existing buildings to propose to replace fossil fuel-powered equipment with others that take advantage of waste energy or use renewable energy, provided the intervention is feasible economically [59]. Regarding new buildings, the regulation requires to justify the heating, air conditioning and sanitary hot water production system chosen from the point of view of energy efficiency. In both cases, the project for a thermal installation should include an estimate of the monthly and annual energy consumption expressed in primary energy and carbon dioxide emissions [59]. This policy aims at increasing the market share of heat pump technology, along with other options such as district energy or cogeneration, although centralized installations are scarce in the country, and almost neglectable in coastal locations [58,60]. However, due to poor building envelopes, existing hydronic installations in buildings tend to operate at high temperatures, which hinders the substitution of direct-fuel generators for a heat pump alternative [60], increasing the overall cost of the intervention. Furthermore, there is no explicit ban to install fossil fuel-based technical building systems in new buildings, so conventional boilers tend to be substituted by condensing technology, rather than an electric alternative.
A special case within Spanish building regulation is domestic hot water (DHW) production. The publication of the first version of the building code in 2006 [61] required for a share of the DHW demand in buildings to be covered with solar thermal technologies. Although there were municipal ordinances that stated such ambitious obligations as early as 2000 [62]. Such policies caused a substantial boost for the market, resulting in a strong and progressive market uptake of the technology in the country. The revision of the building code in 2013 admitted heat pump technologies with a seasonal performance factor above 2.5 to be equivalent to the solar thermal share [63]. The last update of the building code modified the requirement, allowing any renewable source to be eligible for the DHW demand renewable contribution [49]. Nevertheless, such requirement does not affect dwellings with daily DHW demand below 100 l, which according to Annex F [49] is linked to dwellings with less than four bedrooms. In Spain, 90% of the main residential buildings have three bedrooms or less, considering one bathroom, one kitchen, and one living room in [64]. Furthermore, the regulation regarding sanitary hot water only applied to existing buildings when there is a complete renovation of the thermal generation system, which causes voluntary renovation to hardly ever consider energy efficiency.
Lastly, no specific mandate to install onsite renewable production is established for new residential developments or interventions in existing dwellings. Nevertheless, voluntary installation is possible, although some practical barriers still exist [65].
For the calculation of energy performance in buildings, the weighting factors established in [66] apply. These factors were defined in 2016, are considered constant, and are subject to small geographic variation to account for the differences between the peninsular and extrapeninsular territories (see Table 1). They are used for a myriad of policies: minimum energy performance requirements, the energy performance certificate class [67], incentives and rebates on equipment, etc.
From Table 1, it can be inferred that the electrification of a certain service would represent 14% more CO2 emissions than its equivalent in oil, 40% more than LPG or natural gas, and almost 20 times more than biomass alternatives. This constitutes a strong barrier for building electrification of the services considered in the regulatory energy performance calculations in the country. It does not correlate with current situation, considering the amazing leap renewable energy has taken in the share of electricity generation [68], mainly due to the increase in photovoltaics and wind generation [69]. The mean actual electricity CO2 factor at the consumption level for 2020 was 0.117 kgCO2/kWh [70], almost three times lower than the associated primary weighting factor for peninsular electricity. Similar situations apply to other countries [19]. Globally, primary energy weighting factors have been identified as responsible for sub-optimal environmental end-use energy decisions [29], and its regular update proves paramount to level the playing field on energy end-use decisions.
To summarize, current Spanish national building regulation sets a clear vision to increasing building quality, but it keeps some elements which behave as barriers for the needed decarbonization of existing buildings. Of special relevance are the primary energy weighting factors, which fail to represent the actual building environmental impact by benefiting fossil fuels and significantly penalizing grid electricity. With a view of removing fossil fuels from thermal installations in buildings, the code placed high hopes on high efficiency alternatives, such as heat pumps. However, although the market share of air-to-air heat pumps has increased in the past years, they still face barriers for its adoption in existing buildings [71]. This constitutes a major threat for dwelling decarbonization in Spain, because the average age of boilers in buildings is 15 years [58], which indicates many generation systems are close to their life’s end [47]. If no explicit ban is put on fossil fuels and no cost-effective alternative is offered, there is the risk of final users substituting current boilers with other fossil fuel-based equipment, locking in future interventions. In addition to compromising building decarbonization, it will also hinder the massive uptake electrification and digitalization needed for renewable integration, energy community widespread, and prosumer participation in electricity markets. Therefore, it is crucial to propose electric alternatives towards building electrification, following a comprehensive analysis.
2.2. Electrification Potential in Dwellings
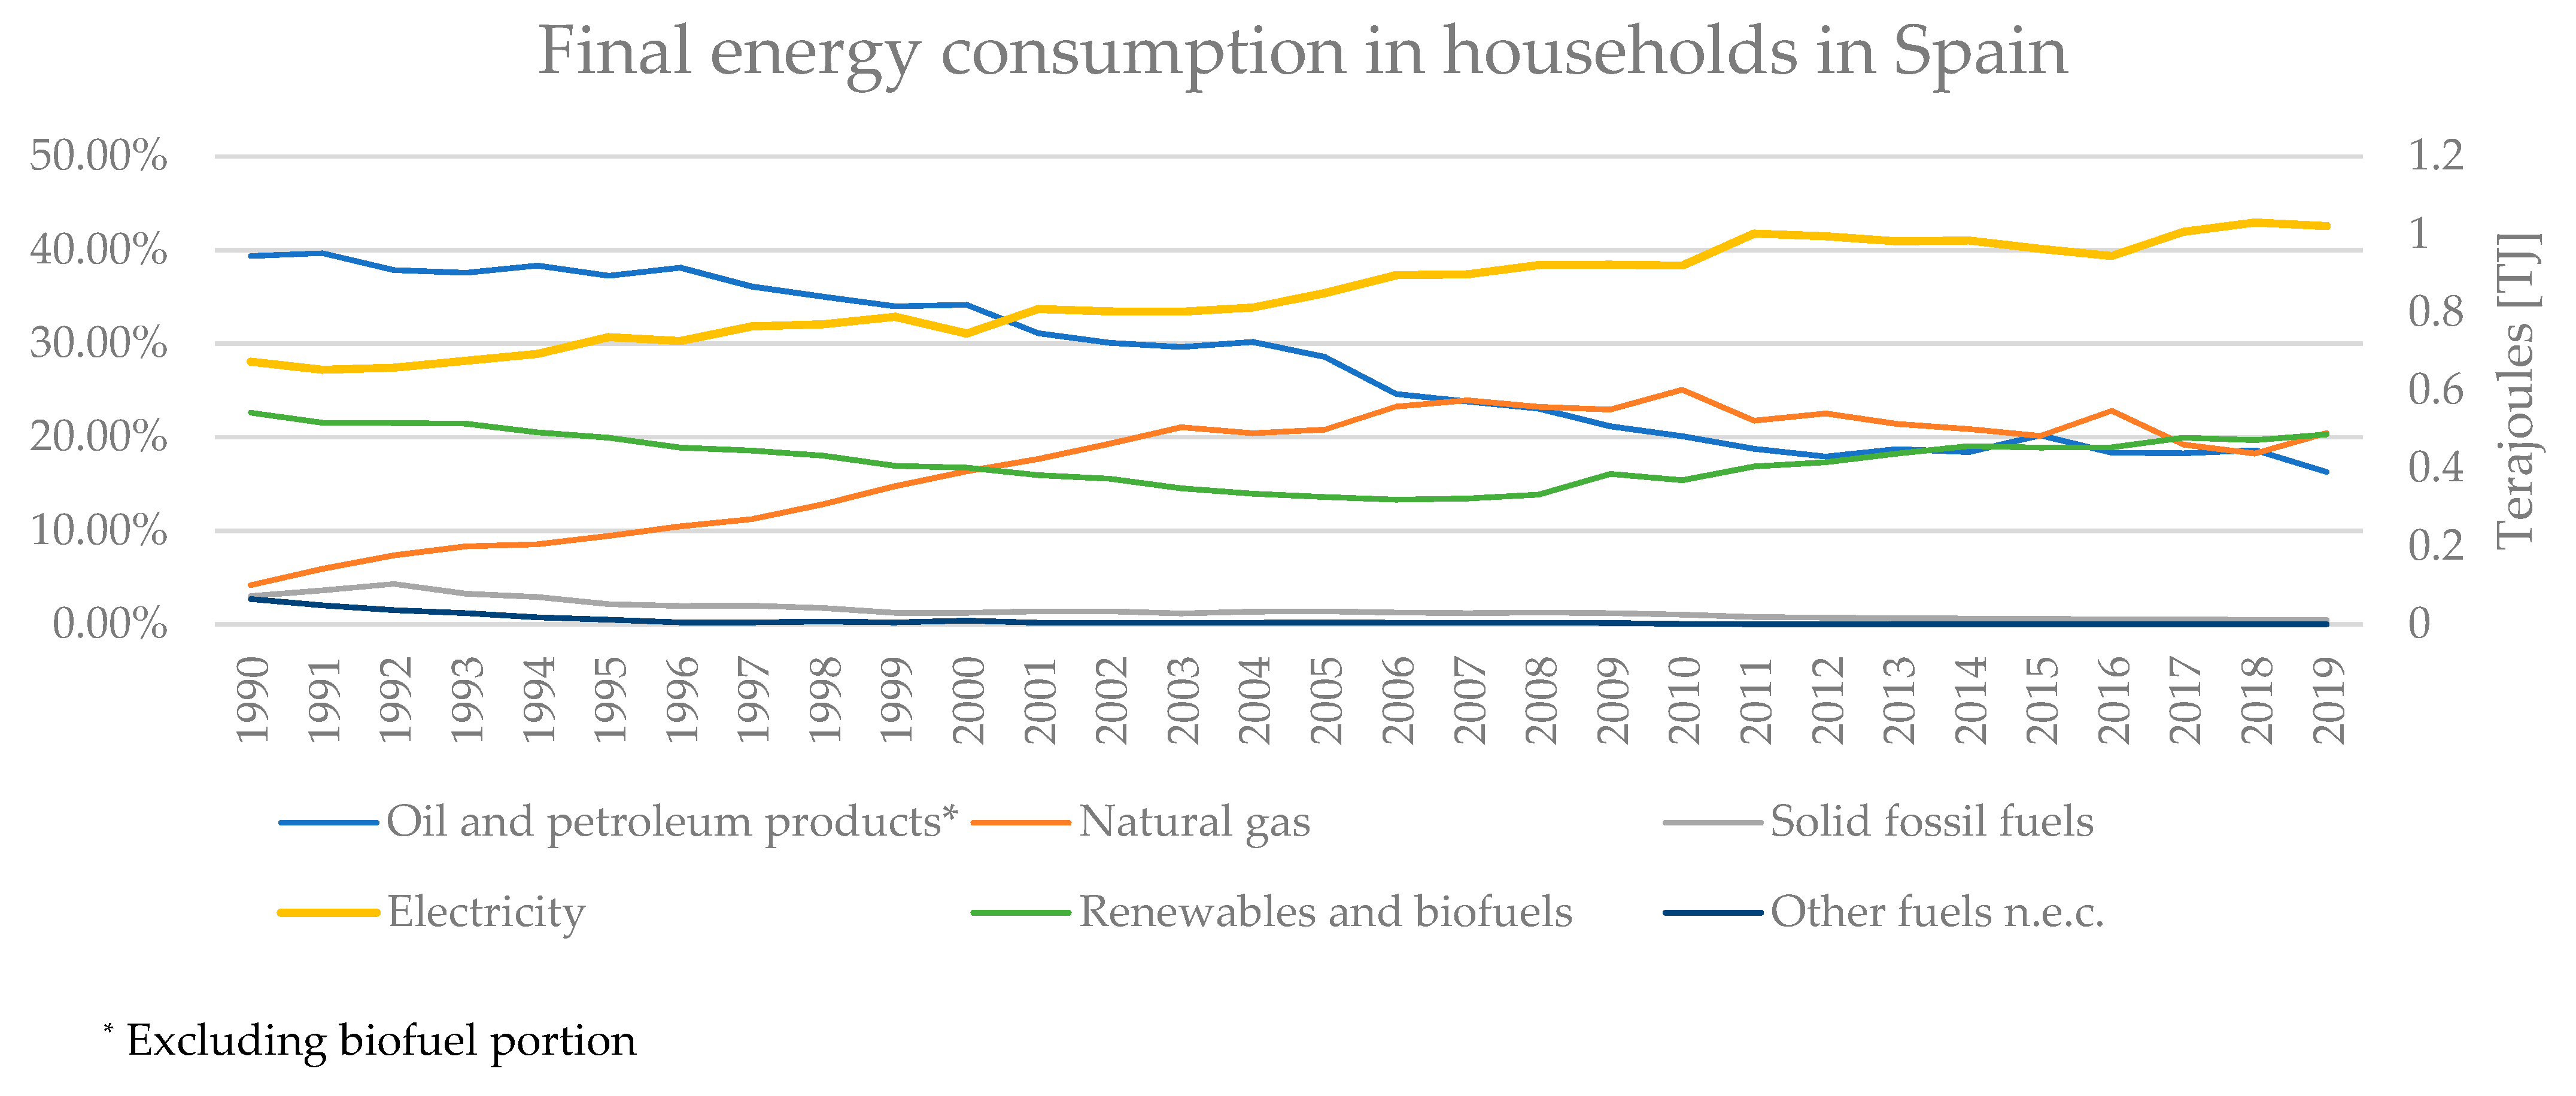
When considering all the energy uses in dwellings, the prominence of electricity as a single main final energy vector arises (see Figure 1). Although electricity usage in buildings has been increasing since at least 1990 [72], there is no direct correlation with reduction in the use of fossil fuels. The last available data for 2019 show that fossil fuels amount for 37.13% residential final energy consumption.
Consequently, dedicated action is needed in the fuel-friendly services, heating, DHW production, and cooking. For this, it is crucial to leverage shallow and medium interventions in residential buildings towards fossil fuel equipment substitution for electric alternatives [73], given they are the most common in the country.
The current degree of heating electrification is minimal, compared with the 29.52% (2019) of oil and petroleum products or the 13.23% of natural gas [72]. Electrification of heating demand in Spain through the use of heat pumps has strong potential [60], specifically for the air-to-air technology on account of the prominent warm weather. In addition to the positive effect that substituting boilers for heat pumps can have in terms of demand response and increased grid stability [74], it would also allow buildings to satisfy the heating, cooling, and DHW services with the same system. According to [35], Spain is ready for full electrification of the heating demand; however, the reality is that heat pumps are present in just 17.94% of the main dwellings, and the sales developments are not increasing at the needed rate [75]. Furthermore, the heating service does not represent a key lever for country-wide decarbonization, given that 18.77% of the main dwellings do not have a fixed heating installation [58], since low operation hours do not justify the investment. Moreover, the final energy consumption for space heating is highly conditioned by the building’s energy demand [35], which is dependent on the building quality and tradition, with strong regional differences [76]. As exposed in the previous section, many barriers still hamper building renovation in Spain.
With regard to water heating, the situation is different. Sanitary hot water production is a basic service present in every building, with the individual conventional fossil fuel boiler representing 61% of the water heating technical systems in the country [77]. This situation favors leveraging small interventions towards water heating equipment change, since no collective agreement is needed between neighbors, unlike for the case of most building renovations. DHW production is independent from the building’s energy performance, so a direct equipment change does not represent the risk of locking in future interventions in the building envelope. Moreover, water heating is used throughout the year, which increases the profitability of any equipment substitution. Furthermore, if the intervention completely removes natural gas use from the building, the additional saving of not having to front the fixed costs of the supply should be considered, further increasing the cost-effectiveness.
Several researchers have studied different alternatives for water heating [30,36,37,38]. Among the electricity-based, electric water tanks appeared as the most inexpensive, followed by instantaneous water heaters and heat pump units. Heat pump technologies’ high efficiency outperforms resistance-based water heaters in terms of lower annual operating cost [30]. However, several studies have shown that the cost of affordability of heat pump systems is the major barrier hindering its widespread use as the preferred water heating technology [38,71,78]. With regards to comparing electric resistance water heaters, the ones with storage become more attractive, not only because of their lower capital cost, but also for their capability of dislocating energy consumption and hot water use, benefitting from variable electricity prices [29]. Moreover, thermal energy storage enables participation in flexibility services for the electricity market in the near future through explicit demand response [79]. Nevertheless, despite thermal energy storage being an added value, if building occupants are not educated on its proper use, they may perceive it as a disadvantage in terms of comfort compared with their instantaneous fuel counterparts [34], creating a rebound effect.
3. Materials and Methods
For the purpose of this investigation the research team proposed a parametric simulation considering different domestic hot water demands, with variable electric resistance water heater configurations and management strategies. The purpose was to study whether electric heaters can substitute natural gas boilers for DHW production, and if so which configuration of water heater provided the greatest economic profit benefiting from implicit demand response.
For the generation of the domestic hot water draw-off profiles (), DHWcalc [80] was used, seeking to rely on one of the reference statistical profile generators used in scientific publications. For the annual water heating parametric simulation, the stratified water heater object from EnergyPlus [81] was used, this with a view of relying on one of the most accurate software for energy simulation in buildings. The simulation used a timestep of one minute. The output results were the timestep tank temperature (), and the energy rate () for each simulation case. These variables were converted into the analysis parameters of annual discomfort hours (), energy cost (), and CO2 emissions () using Equations (1)–(3).
From (1), discomfort occurs when there is hot water demand and the draw-off temperature is below the desired use temperature (i.e., 42 °C). For instantaneous water heating technologies, discomfort is assumed to be always zero. In this study a more restrictive approach than in [82] was used.
The energy cost included all taxes and levies with a view of representing the situation that the user faces. However, for the electricity price, the fixed term related to the energy power was excluded from the analysis.
Note that the energy source in all scenarios is electricity, except for the reference case, whose energy source is natural gas. In order to calculate annual energy bills related to each case, historic price data (specifically, from 2020) were applied. As electricity regulation in Spain modified the term of access tolls and charges of energy invoicing prices as of 1 June 2021, the considered historic price data were updated to include such changes (see Appendix A). Once the energy cost is obtained, savings due to implicit demand response can be calculated (4). Note that these savings can be under the assumption that the natural gas supply is maintained or considering complete fossil fuel removal.
Similarly, CO2 emission savings were calculated for each scenario (5). For electricity consumption, hourly CO2 emission factors were considered. These factors include CO2 emissions due to generation [70] and transport losses [83]. As previously introduced, the mean electricity CO2 factor at the consumption level for 2020 was 0.117 kgCO2/kWh, while the natural gas CO2 factor was 0.252 kgCO2/kWh, considered constant for the whole year.
3.1. Domestic Hot Water Draw-Off Profiles
For the generation of the various DHW draw-off profiles, the approach adopted by [84] was followed as closely as possible, adapting them to the Spanish context.
For the DHW daily demand, the reference value of 28 L/(day·person) at 60 °C proposed by the building regulation in Spain [49] was used. The demand was converted to a use temperature of 42 °C [85] using Equation (6), as in [84].
The DHW daily demand per person defined the four cases according to the variable occupation considered in a single household, 1–4 people. Those values were used as the total mean daily draw-off volume in DHWcalc to generate the draw-off profiles. Table 2 shows the reference conditions for the draw-off profiles, Table 3 the reference conditions for draw-off categories, Table 4 the probability distribution for the base case scenario, the “base case”, and Table 5 for a scenario with the people adapting DHW use to implicit demand response electricity prices, the “flexible case”. The latter aims at capturing user behavior and was used to assess its impact in each of the water heating configurations.
The scenarios for the DHW use yield two types of annual draw-off profiles for each occupation of the building, 1–4 people.
3.2. Water Heating Modelling
The different water heater configurations were defined in EnergyPlus using the WaterHeater:Stratified object according to Table 6.
Given the case study is a single building, no distribution losses nor circulation pump energy use were considered.
The timestep water mains temperature was defined using the weather data file for the city of València [86], using the correlation developed by Craig Christensen and Jay Burch described in [87].
The parametric simulation changed the definition of the water heater by modifying the variables in the ranges indicated in Table 7.
For the definition of the storage volume [88] was followed, using an actual volume 10% lower than the declared value.
For the modelling of the reference case of a natural gas instantaneous boiler, the WaterHeater:Stratified object was used, adapting it to represent a tankless natural gas boiler with a nominal heating efficiency of 85% and rated heating power of 21 kW.
3.3. Energy Prices and Tariff Periods
For the consideration of the demand response, the different periods from the 2.0 TD Tariff (Table 8), enforced in Spain since 1 June 2021 [89] were used.
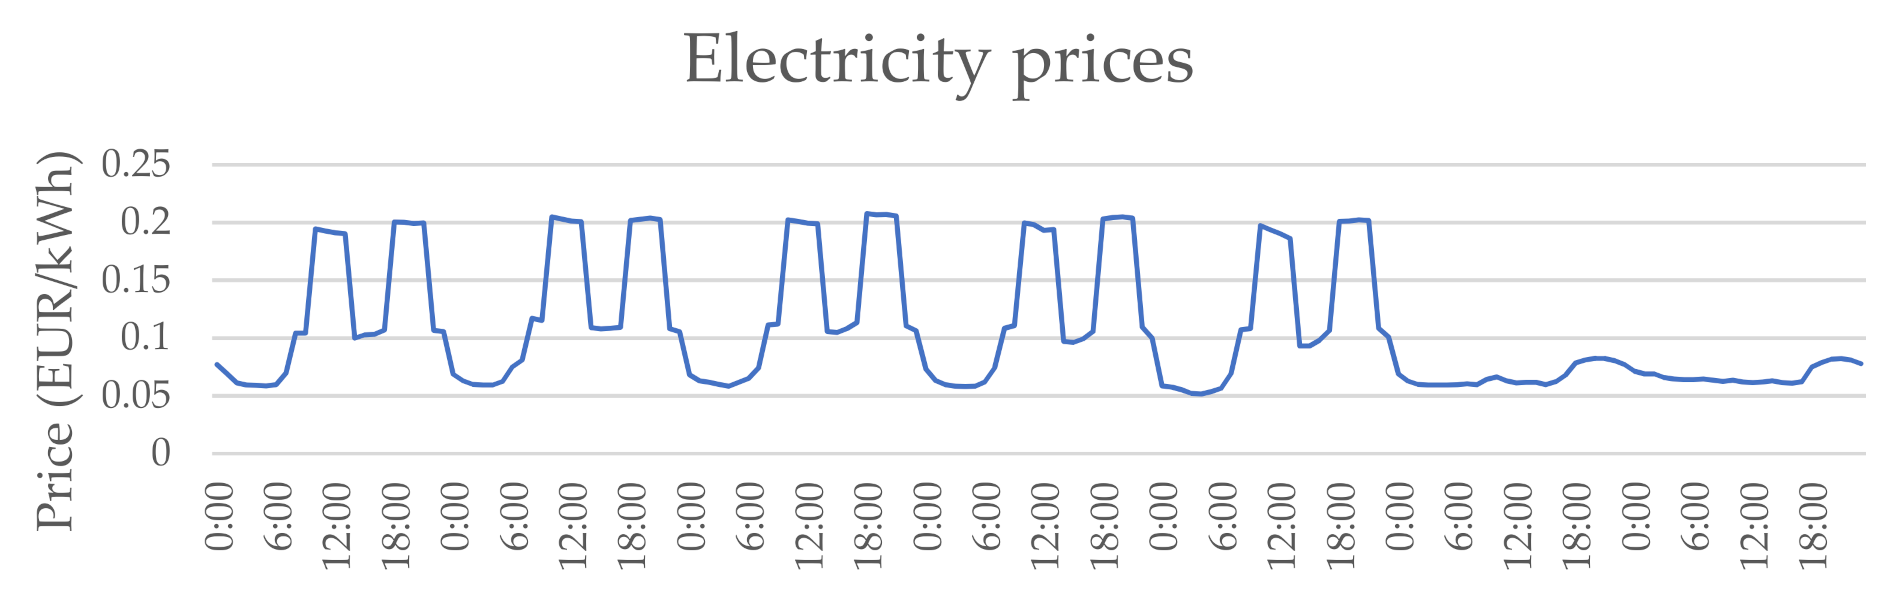
The tariff periods from Table 8 also define the energy cost related to access toll and charges for each time period according to [90,91]. Thus, the electricity prices considered in the study are dynamic prices based on Spanish regulation (see Appendix A). Prices for one week are presented in Figure 2.
The fixed term related to the contracted power was intentionally not considered, given that it is present in every scenario and not dependent on the water heater equipment. With the aim of representing the impact on the people’s economy, the rental of the meter (1.11 EUR/month), the electricity tax (5.1127%), and the value added tax (VAT) (21%) were included in the parametric analysis.
The natural gas prices for domestic consumers are also based on regulated prices, whose value in 2020 is presented in Table 9.
In this case, the fixed terms of the T.U.R. 1 tariff were included 4.26 EUR/month and 0.04798944 EUR/kWh. The rental of the meter (0.58 EUR/month), the special fuel tax (0.00234 EUR/month) and the VAT were also included. For the comparison considering that the natural gas supply is kept in the building, just the variable term (VAT included) was considered, whereas for the complete removal of natural gas, the complete bill (VAT included), was taken into account.
3.4. Parametric Simulation
The parametric simulation covered the combination of each DHW demand, with all possibilities of water heater configuration, with three heating strategies linked to the tariff periods: always available, only in P2 and P3, and only in P3. Each DHW demand defined a reference case, equipped with the natural gas boiler. The parametric simulation was prepared following Table 10.
The parametric simulation resulted in a total amount of 360 cases for the electric water heater, with 8 different reference cases.
4. Results and Discussion
The main results from the parametric simulation are the annual energy cost, the CO2 emissions, and the discomfort hours.
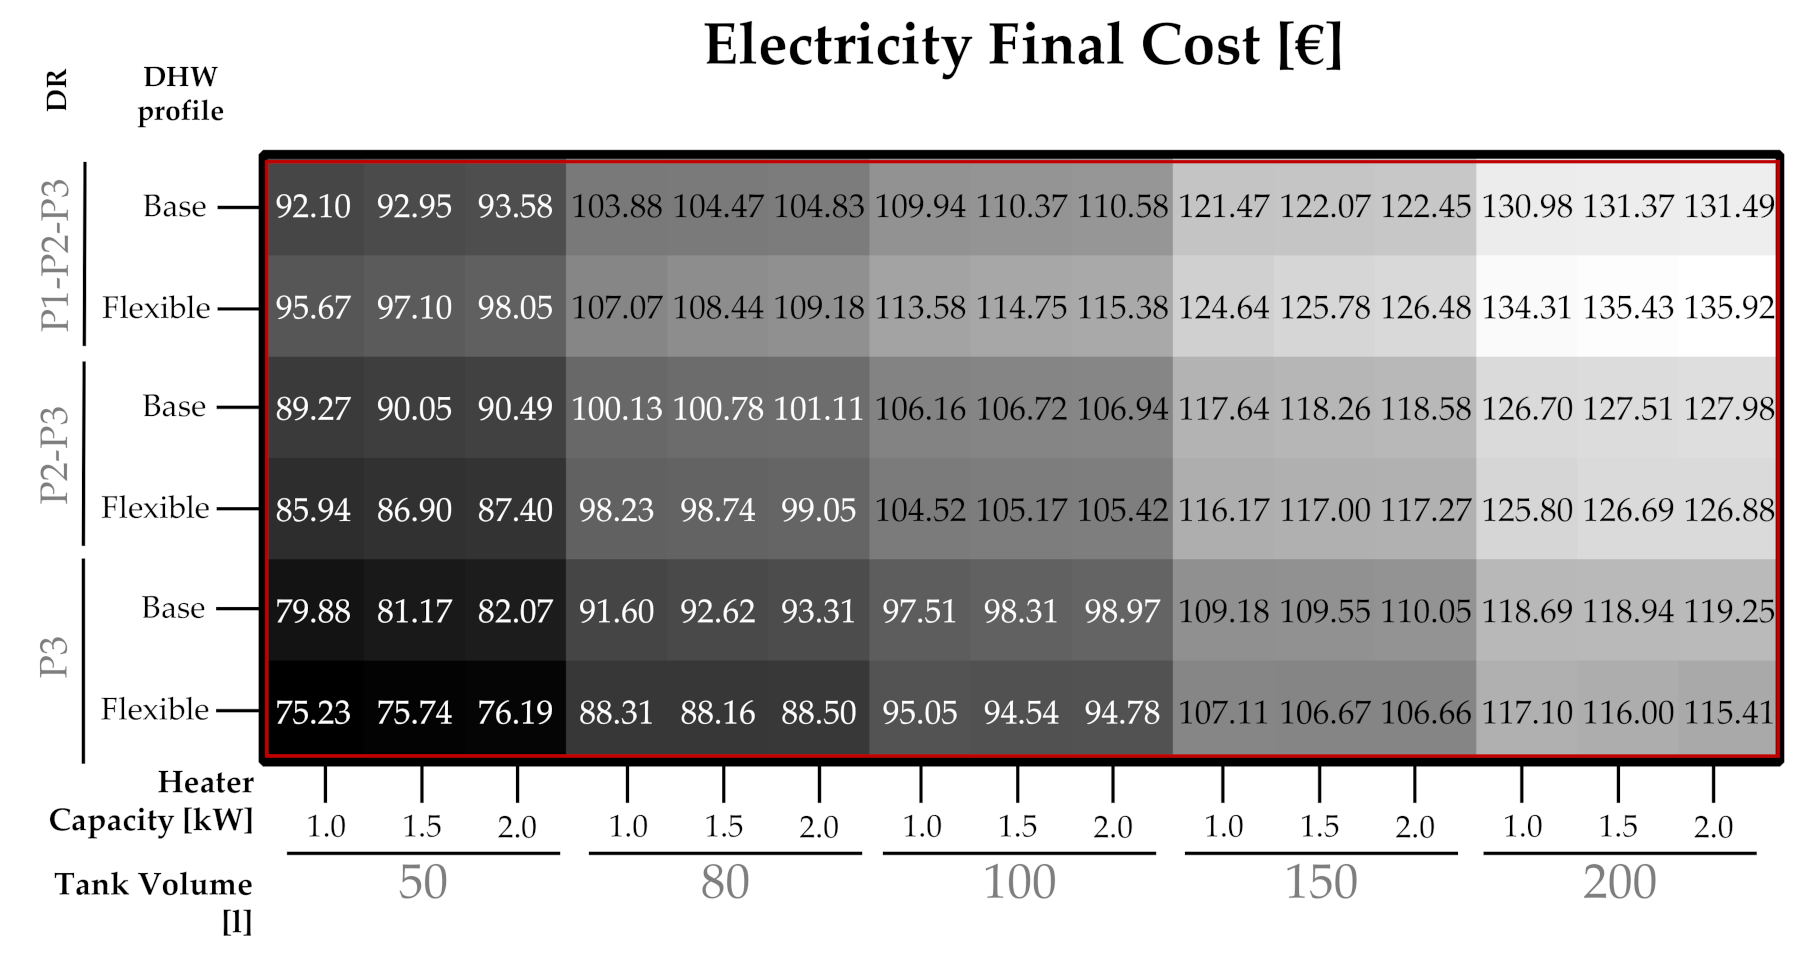
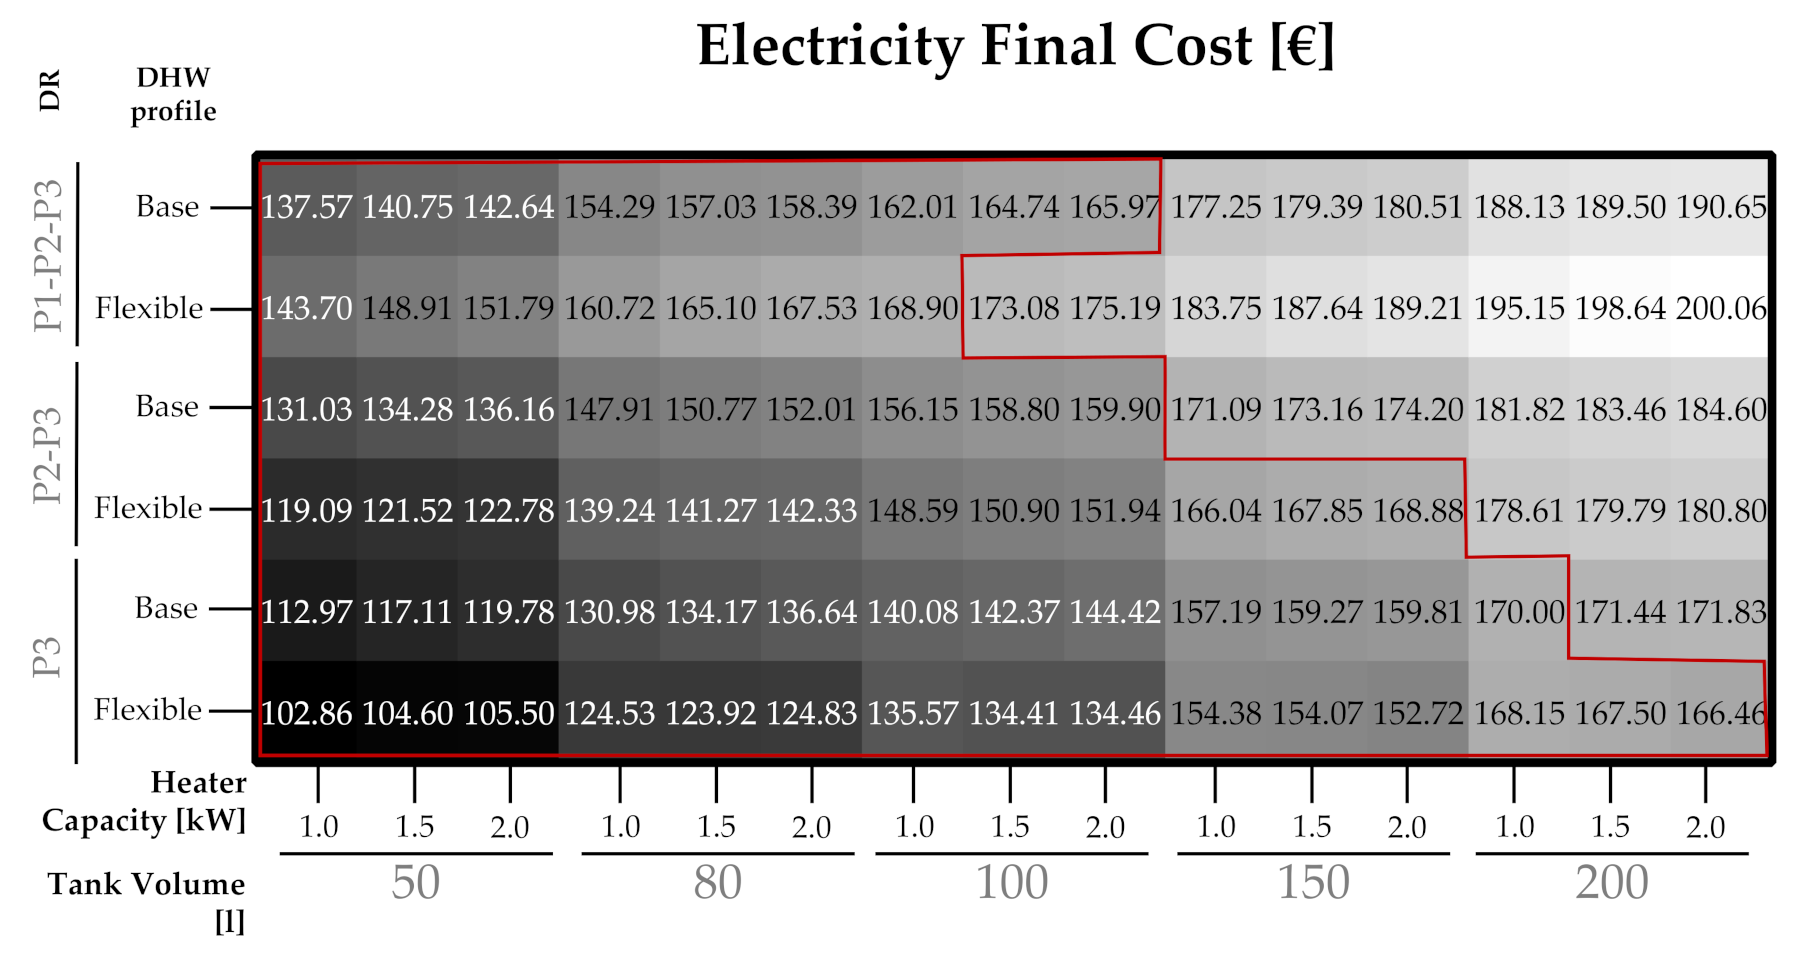
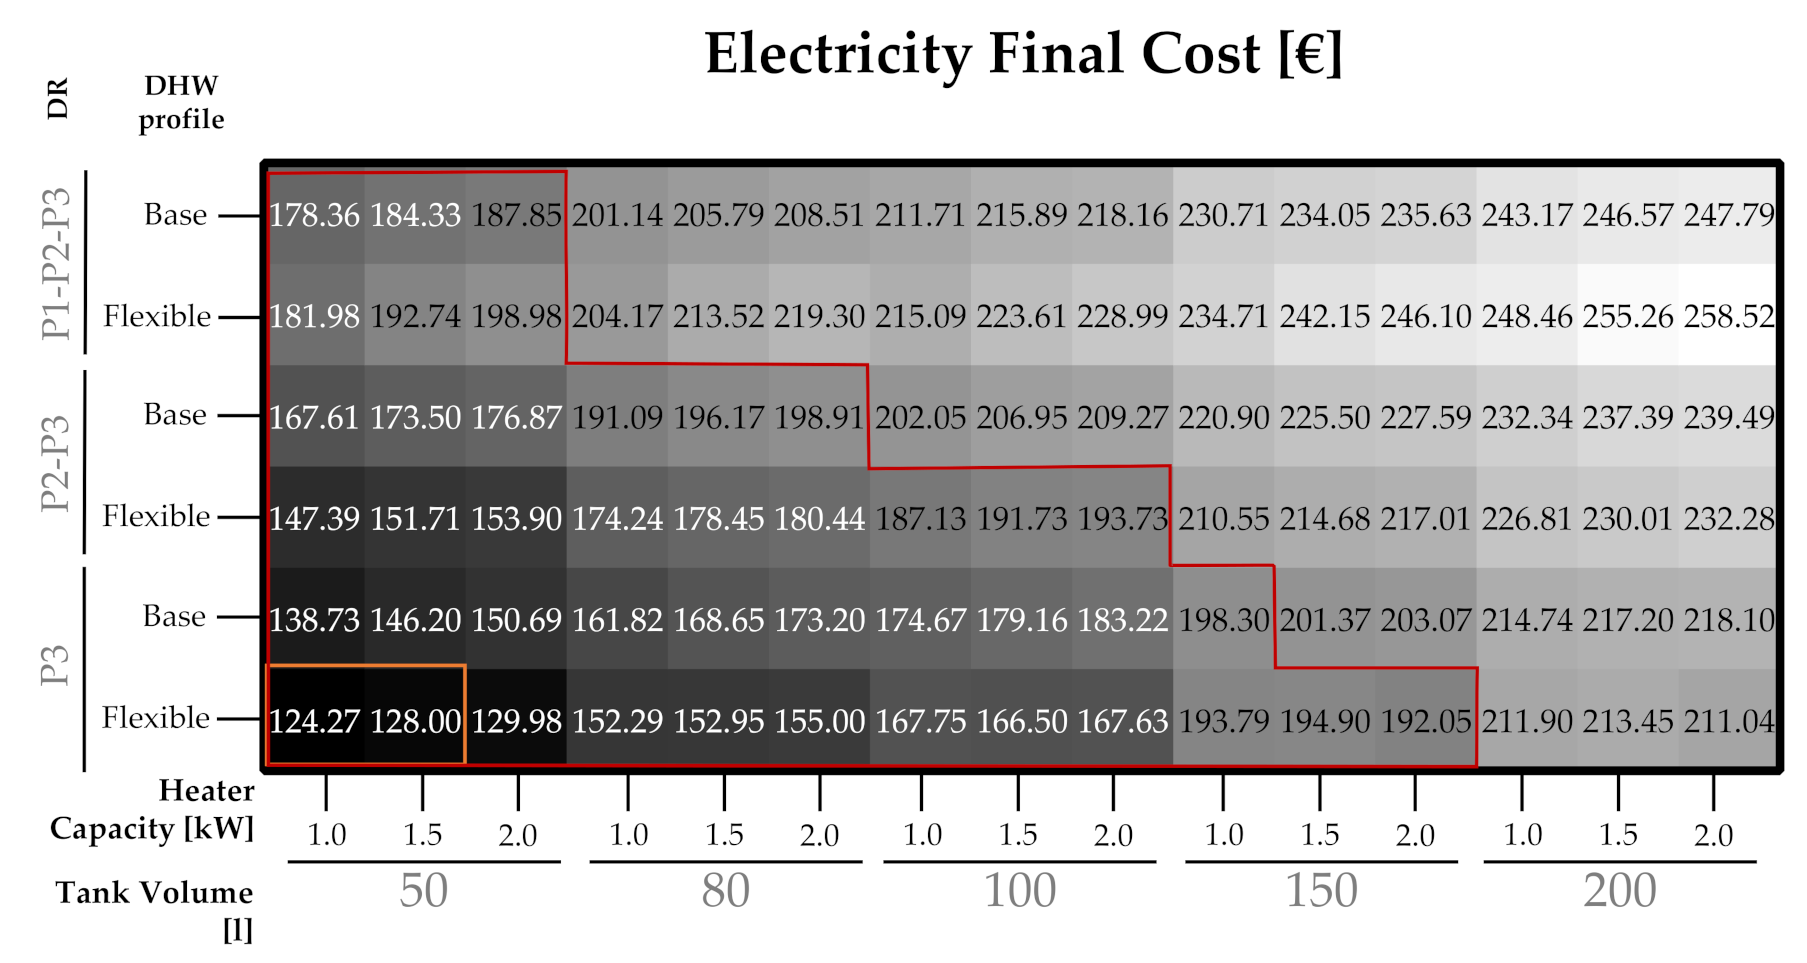
Each output parameter is presented in a heat map with the X-axis representing the different water heater configurations, and on the Y-axis the management strategies depending on the demand response used and the DHW profile. The region of the map inside the orange line represents all situations which lead to savings with regards to the reference case maintaining the natural gas supply, whereas the region inside the red line considers that the natural gas installation is removed to achieve savings.
The trend shows that the electricity final cost increases when considering greater tank volume, on account of the energy needed to bring and maintain the water to the desired temperature. For the case of one person the different heater capacities have neglectable impact on the final electricity cost compared with the storage volume. This tendency is maintained for the cases with more users. With regards to the management strategy, there are significant relative savings when comparing only using the heater in P3 regardless of the tariff periods. Furthermore, if flexible user behavior is considered, the economic savings slightly rise. Nevertheless, when compared with the reference of using a boiler maintaining the natural gas supply, there are no cases capable of resulting in economic savings. This is in line with [30,36,37,38]. However, if fossil fuel supply is assumed to be completely removed with the substitution, then all water heater configurations yield economic savings. Depending on the water heater configuration, the management strategy, and on whether flexible user behavior is considered, the annual savings range from EUR 10.63 to EUR 66.89.
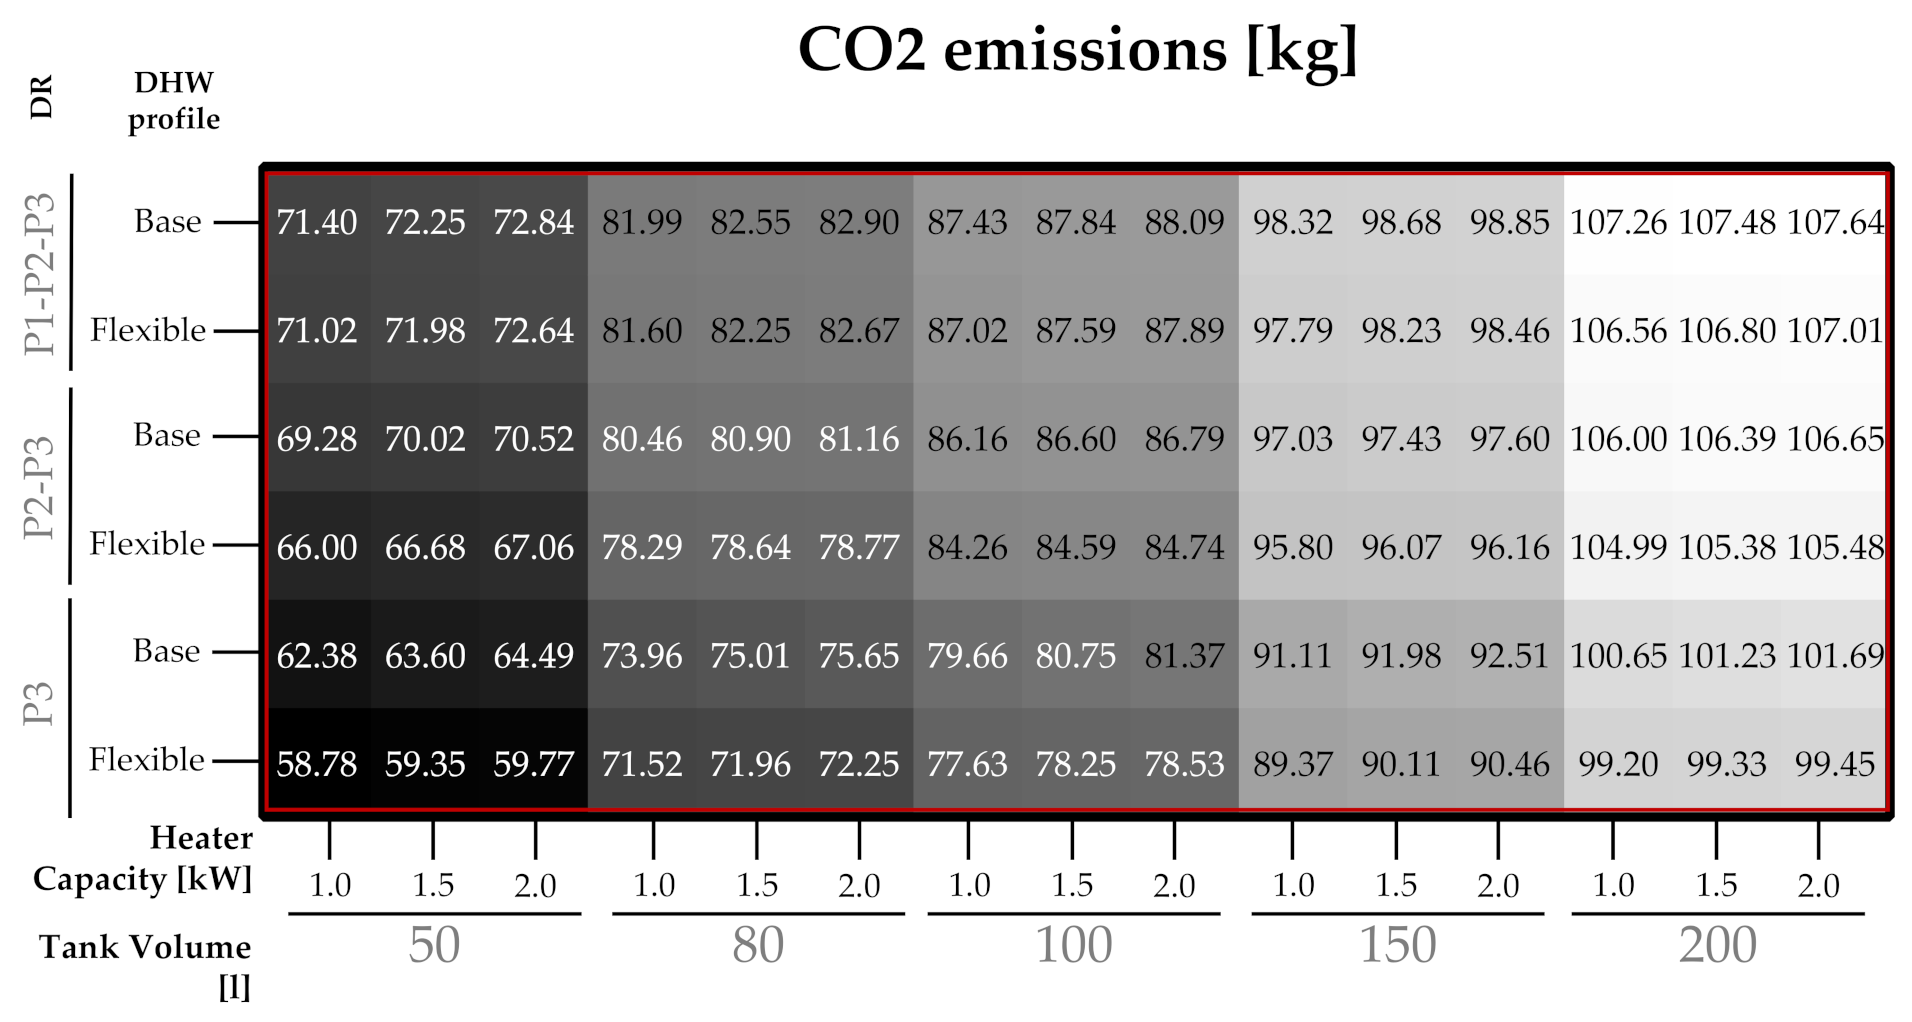
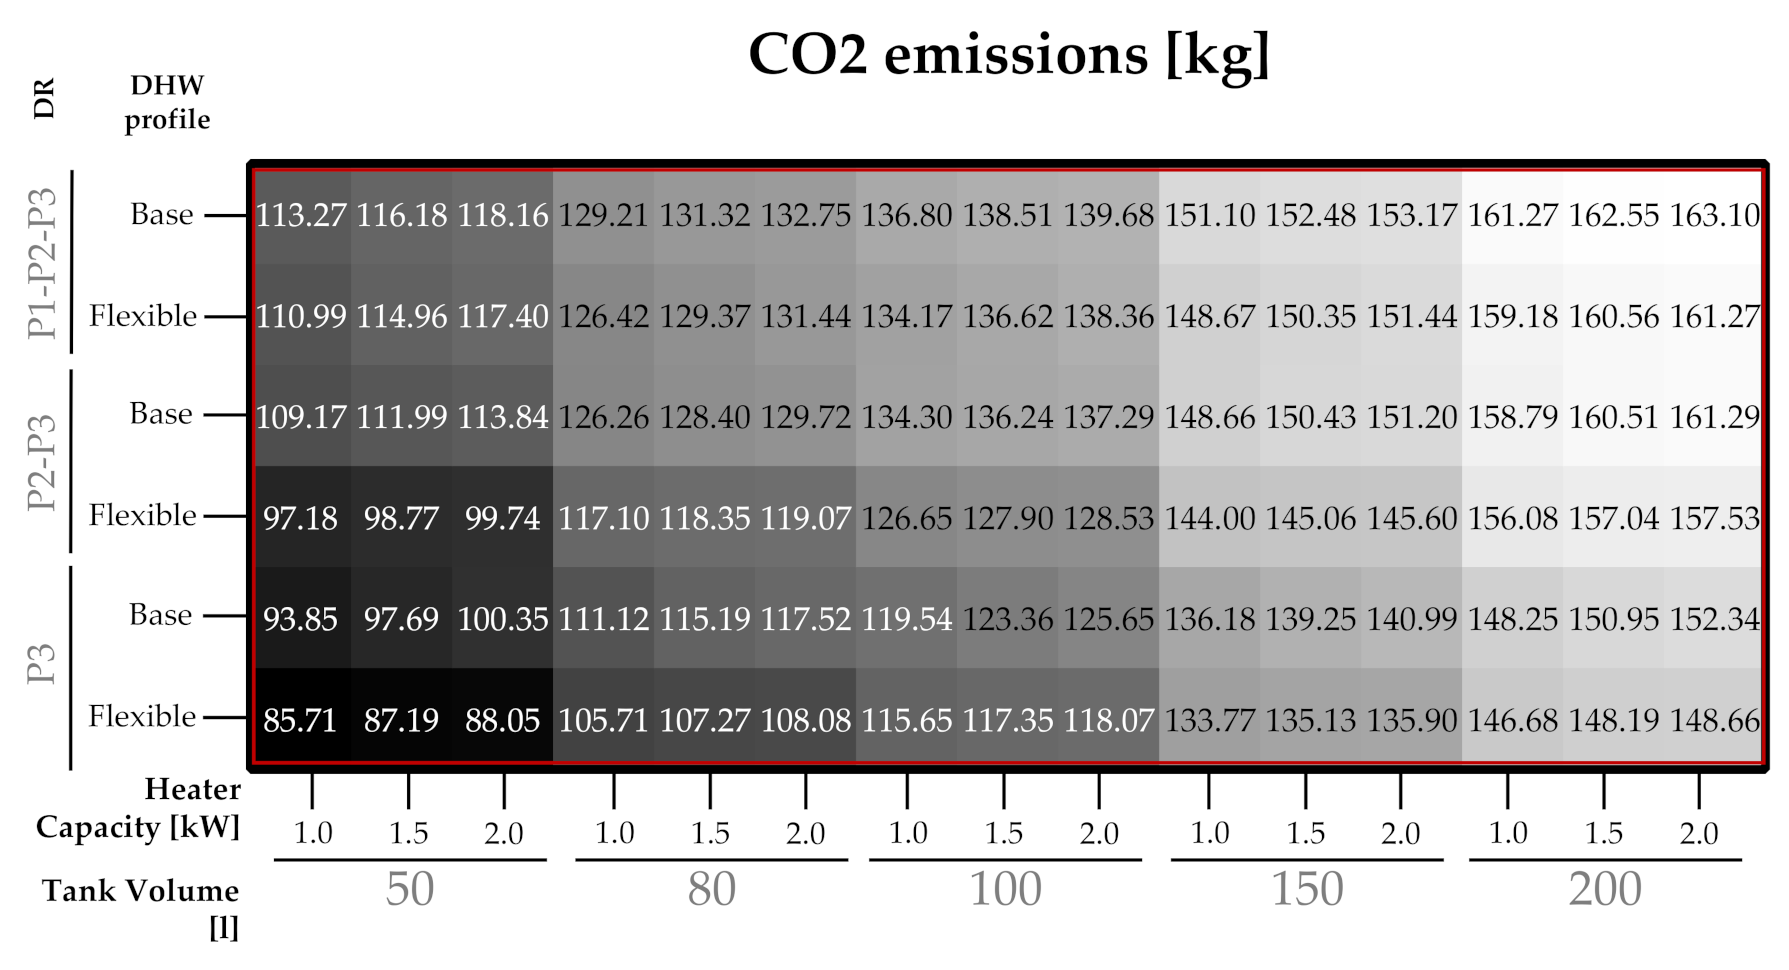
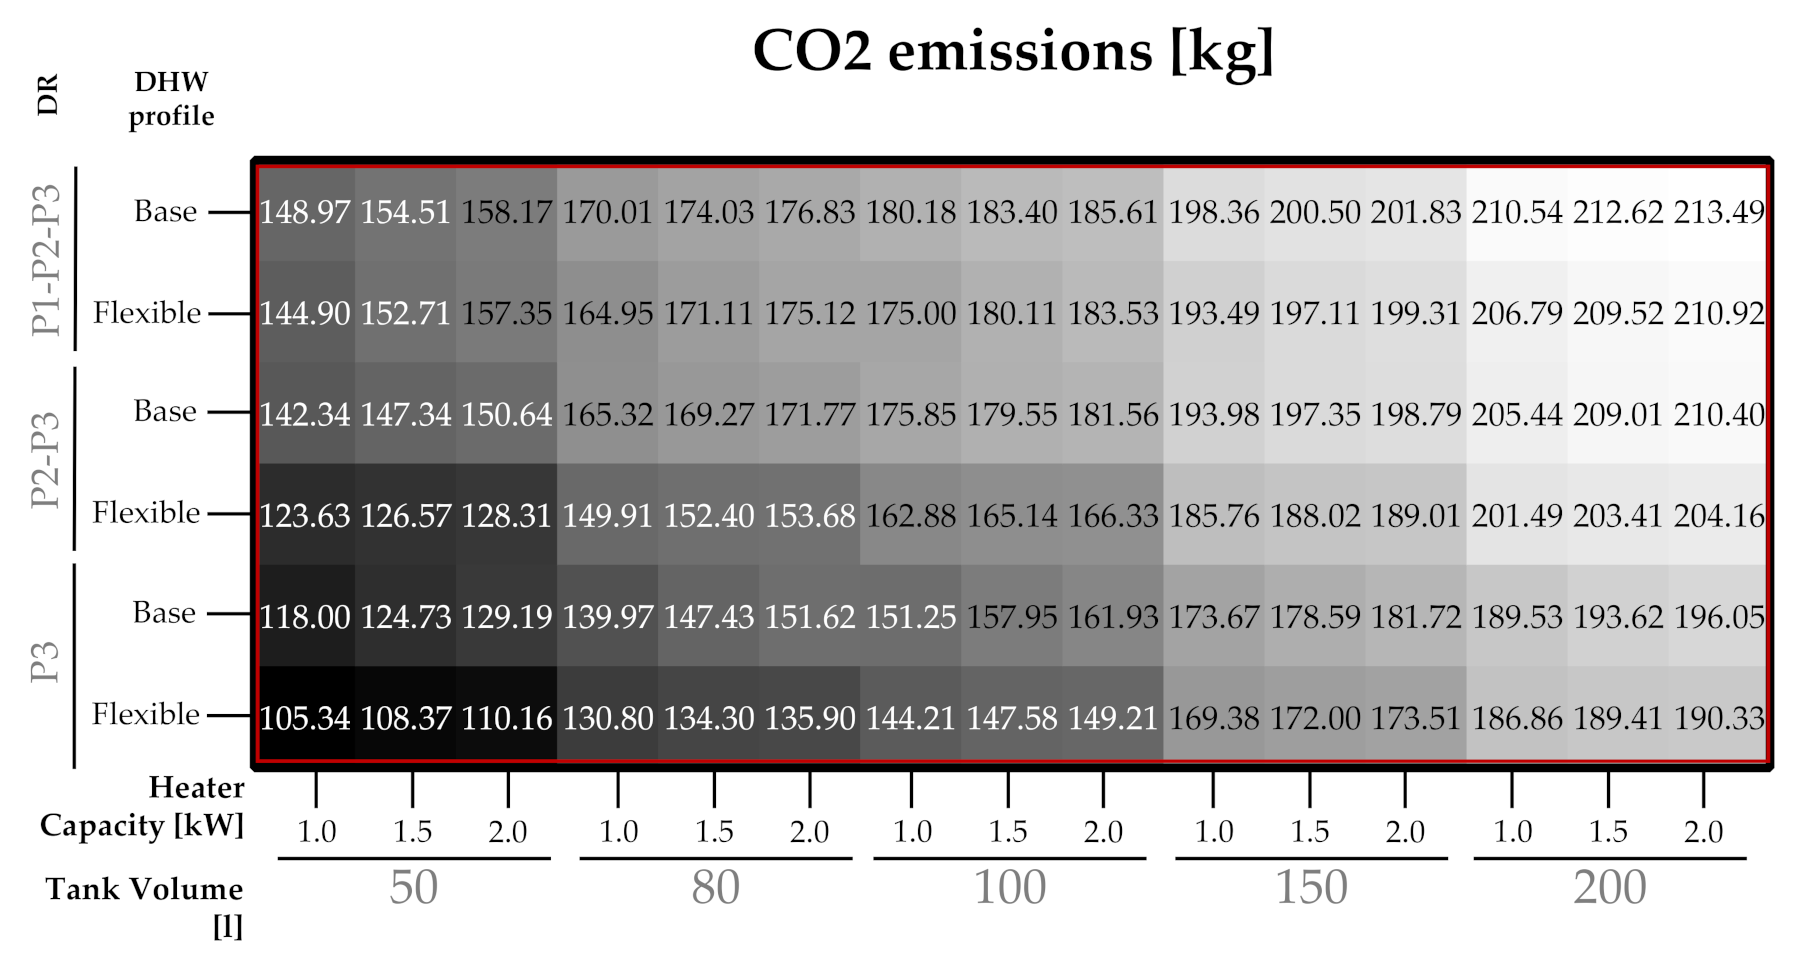
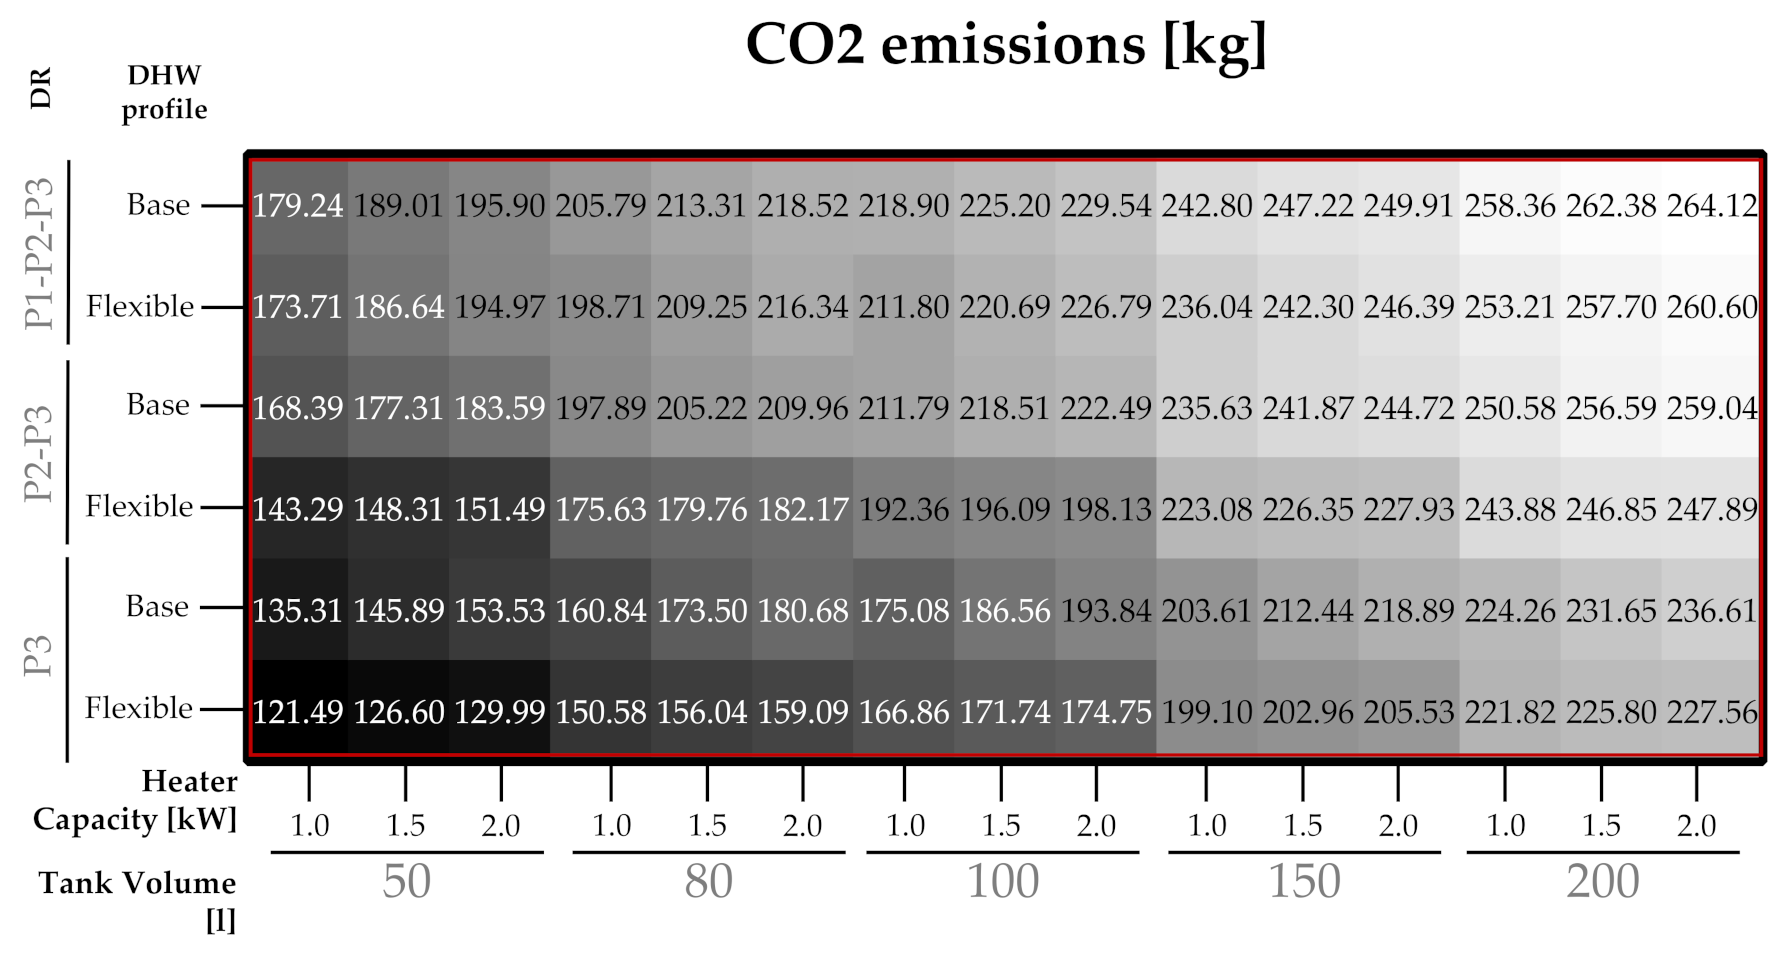
Because of the share of renewable energy in the electricity mix, there is a direct correlation between electricity prices and CO2 emissions. When comparing Figure 3 and Figure 4 it can be seen that aiming to minimize the cost or the emissions results in the same water heater configuration and management strategy. Furthermore, any case generates savings in terms of CO2 emissions, ranging from 34.24% up to 18.85% with respect to the reference natural gas case.
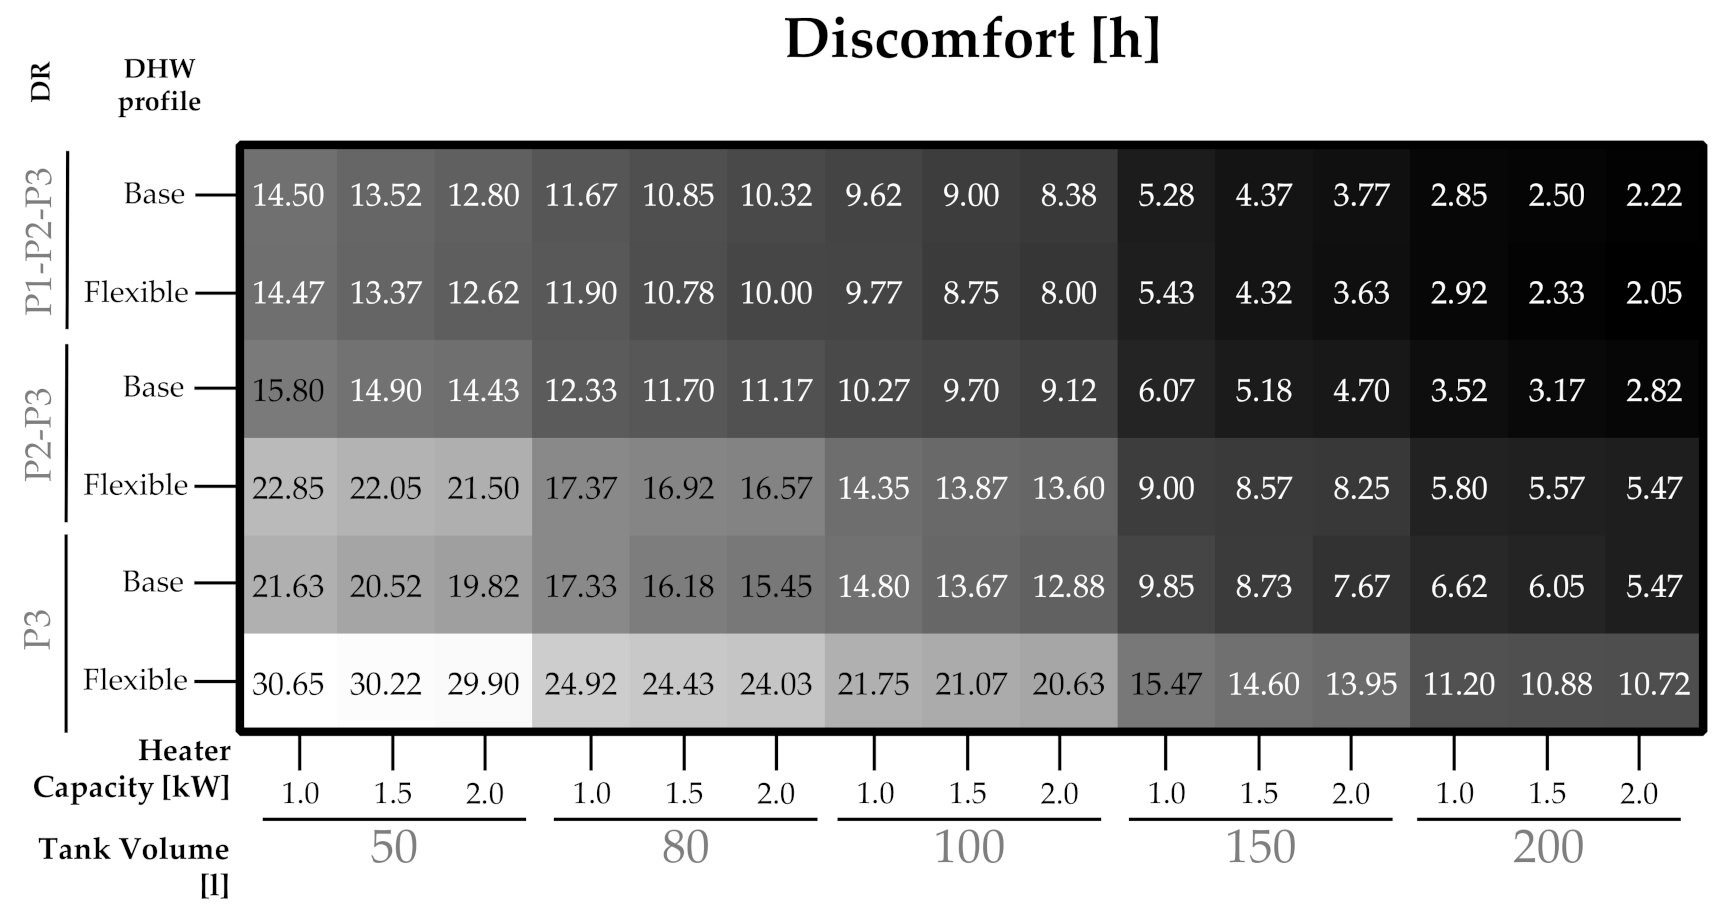
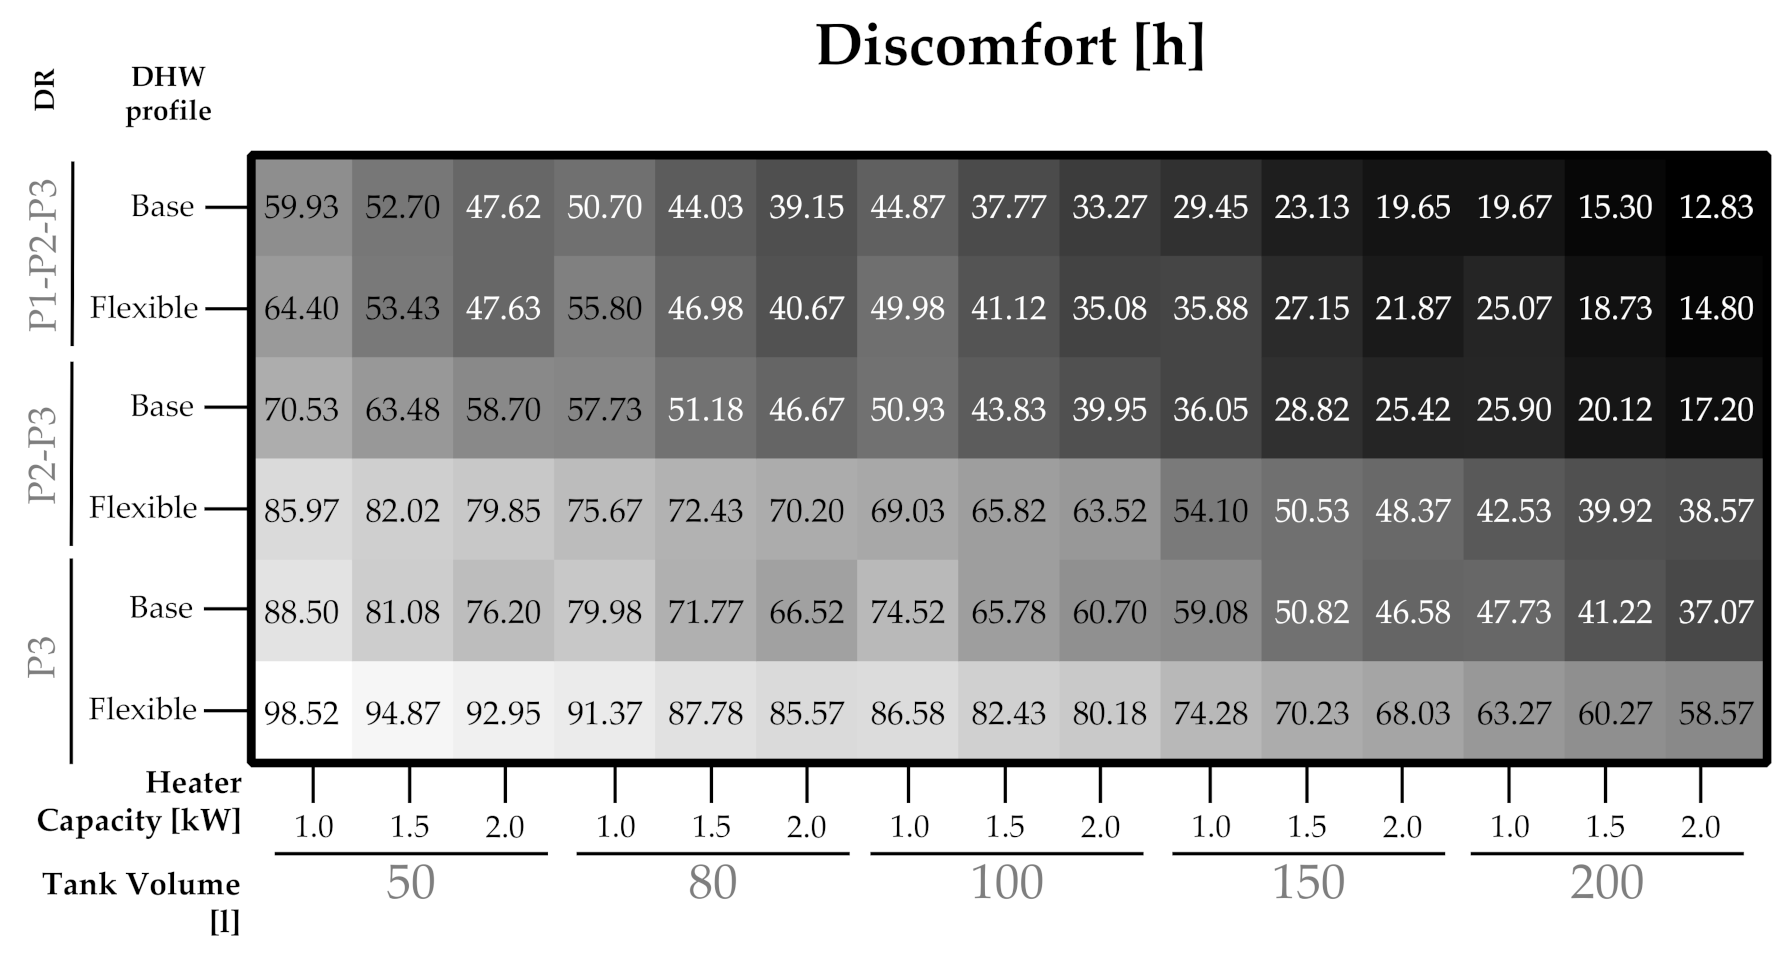
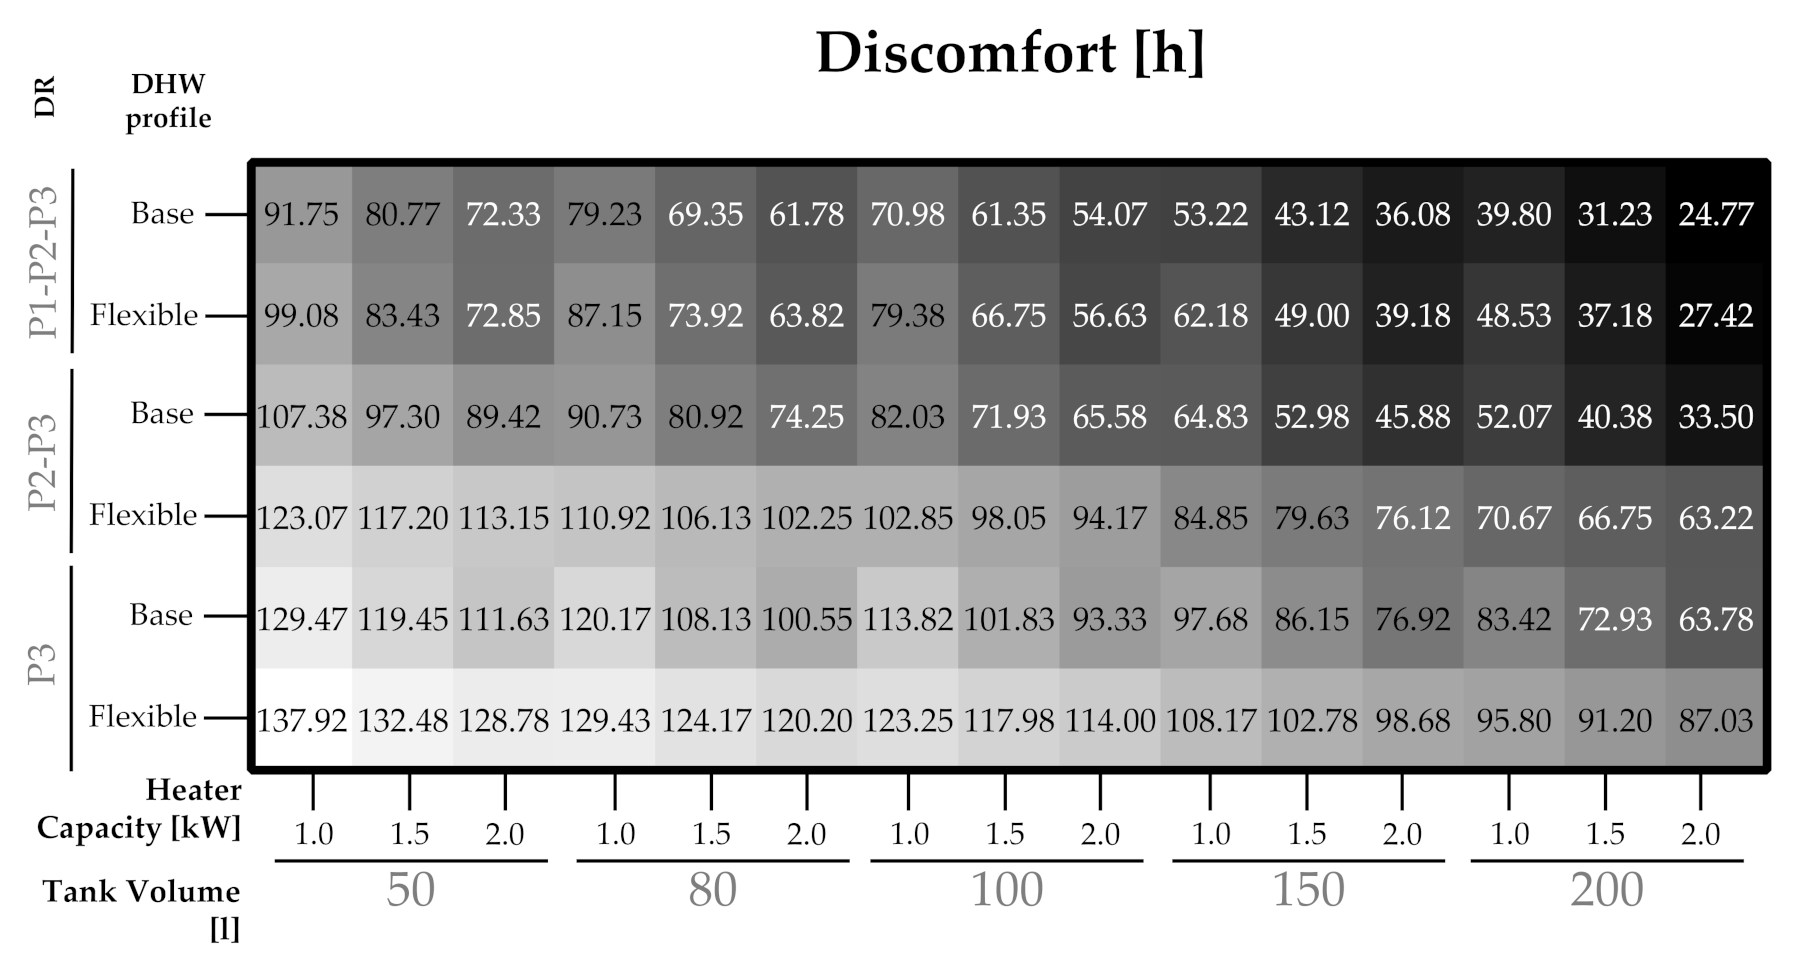
The previous tendency in electricity final cost and CO2 emissions has its counterpart when analyzing the discomfort hours (see Figure 5). The change in technology from an instantaneous water heater to an electric accumulator will always be subject to causing some degree of discomfort. To minimize it, the electric water heater ought to have great storage and heater capacity, which is the opposite for maximizing the economic savings.
The water heater configuration allowing to minimize the discomfort hours will be the largest available. In the scope of this paper, a tank of 200 L with a heating capacity of 2 kW was used. It can be seen in Figure 3 that such configuration would result in annual economic savings ranging from EUR 34.48 to EUR 42.67, depending on the user behavior and management strategy. In the same line, considerable CO2 emission savings would follow, from 204.17 kg to 212.36 kg, 65.47% and 68.11% with respect to the reference case.
The complete set of results figures can be found in Appendix B. In Table 11 the summary of the main results for all cases is shown.
The results in Table 11 show the water heater configurations that minimize discomfort, while being capable of providing economic savings annually. As the number of users increases, the resulting water heater size decreases. This is because the instantaneous natural gas boiler outperforms water heaters with great storage capacity in terms of total cost for more than one people. The fixed costs represent 49.45% of the total natural gas bill for one person, but only 30.88% for the case of four people, and the mean electricity price considered is of 0.0845 EUR/kWh for electricity and 0.0496 EUR/kWh for natural gas. For the selected water heaters, two extreme management strategies can be defined. The strategy considering the basic DHW profile with no DR results in discomfort hours of less than 20% of the total DHW use time for one person and two people but becomes too much for three and four people. Moreover, savings are only obtained if the natural gas supply is completely removed from the dwelling, which is a consideration that literature has overlooked [30,36,37,38]. Although low economic savings are obtained for all cases, considerable CO2 emission reductions take place with respect to the reference case, contravening results from [38]. When considering the strategy of benefiting the most from DR with a flexible DHW profile, the economic savings become more attractive and the CO2 emissions are significantly reduced, although the discomfort hours increase considerably.
This study was restricted to electric water heaters during the use phase and used adapted actual time-dependent electricity prices for the analysis. Future work may consider replicating this methodology including heat pumps in the comparison and electricity prices after the new electricity tariffs have been enforced for at least a year. Furthermore, with the aim of avoiding country-biased conclusions, the parametric analysis can be compared with tariffication and electricity generation schemes from other countries with a view of contextualizing these results. This paper’s methodology for the use phase can be integrated in the cradle-to-cradle at building level analysis from [38], and also cover a more extended geographical approach, assessing the impact this massive water heating electrification can have on the electricity grid as in [32].
5. Conclusions
This study unequivocally shows that, with current electricity mixes, direct substitution of natural gas boilers for electric water heaters with storage always represents savings in CO2 emissions, even considering an electricity production mix such as the Spanish one, with 44% of electricity generation produced with renewables [68,69]. Nevertheless, such great environmental performance is not properly represented by present primary energy weighting factors. The diverse water heating configurations resulted in minimum and maximum GHG emission savings between 65.48% and 80.96%. Thus, it is crucial that the primary energy weighting factors for grid electricity are revised and updated to reflect its actual environmental impact, levelling the playing field with fossil fuel energy end-use. This aligns with K.Dennis [29], and should be included as a line of work in the undergoing reinforcement of energy performance certificates quality, both at the EU [20] and national level.
The analysis also emphasized that, even with implicit demand response time-dependent electricity prices, standalone substitution of instantaneous natural gas boilers by electric water heaters with storage is not always cost-effective. Thus, main literature findings pointing to low profitability of electric water heaters compared with gas boilers hold true [30,36,37,38]. Due to current energy tariffs, for such change to be worthwhile, hot water demand must be low (1 occupant) and natural gas supply must be completely removed from the building. This is a significant contribution of this paper to the existing body of research; electric water heaters with storage become cost-effective alternatives if natural gas supply removal is considered. Even further if adaptative user behavior according to demand response is included in the analysis. Therefore, considering time-dependent electricity prices such as in [37] does not make a difference if occupant behavior is not adapted accordingly. In this line, the current implicit demand response mechanism adopted by the Spanish government goes in the right direction. Thus, a maximum of 2,711,918 [64] main dwellings in Spain can be electrified in the very short term. However, those using natural gas for services other than water heating (e.g., cooking) would need to electrify them as well in order to be able to obtain economic savings. So, there is the need to promote incentives aiming to holistic dwelling electrification in the short term. Examples can be to adapt some of the financial measures, such as real estate and transmission tax reduction, to prioritize all-electric dwellings, and carrying out dissemination campaigns in big home improvement retailers divulging the medium-term benefits of electrification. Creating a specific line of subsidies for complete fossil fuel removal in buildings too. This can be coordinated with most national energy efficiency support schemes [26] and those related to next generation EU funds, which are bound to energy performance certificates. Furthermore, the near adaptation of national building regulation, in light of the imminent publication of the revised version of the EPBD (commission adoption is expected by the fourth quarter of 2021) [92], entails a great opportunity to progressively and explicitly ban fossil fuel use in dwellings. Ultimately the “silo” approach from current policies ought to be substituted by a more comprehensive focus on complete electrification as a cross-cutting initiative for building decarbonization. Evidences from France [32] show the effect massive installation of electric water heaters can have in reshaping national electricity demand curves.
The investigation also showed that for medium-to-large hot water demands (more than one person), users need to face a considerable degree of discomfort. Thus, energy tariffication should be modified if voluntary water heating electrification is to be encouraged. Electricity has a mean cost 70.47% greater than that of natural gas, when its average CO2 emission factor is 60.06% lower. In this line there is a growing debate on the suitability of the current marginal pricing of electricity markets in the EU [93,94]. Furthermore, the electricity primary energy weighting factors used in energy performance in building calculations should evolve to reflect its actual environmental impact and time dependency. Policy and market initiatives in this line are to be promoted before existing natural gas boilers reach their end-of-life, otherwise building decarbonization will be highly compromised. End-users cannot be given mixed messages about optimal environmental end-use energy decision, nor be expected to bear discomfort in order for the energy transition to be cost-effective.
Water heaters may represent a valuable bridge solution until heat pump technology becomes more affordable. Nevertheless, people are in need of understanding that substituting domestic natural gas boilers by electric storage options will always cause a certain degree of discomfort. Thus, a pedagogic effort is needed on the proper use and benefits of thermal energy storage so as to avoid a possible rebound effect of rejection of building electrification, especially during the time that installing fossil fuels in buildings is still permitted and before explicit demand response is implemented into legislation.
It is crucial to promote immediate and massive building electrification. People should progressively gain understanding of the impact their behavior and their domestic infrastructure may have on the environment and on their economy. For that, it is paramount that the public administration and the market send positive signals before directly putting a ban on fossil fuels use in buildings. The next years are key to avoid renewing fossil fuel equipment in buildings so when the renewable energy community is widespread and flexibility services become mainstream in the energy markets people are ready to reap the benefits.
Author Contributions
P.C. (Pablo Carnero): Conceptualization, Methodology, Software, Formal Analysis, Investigation, Writing—original draft preparation. P.C. (Pilar Calatayud): Validation, Resources, Writing—review and editing. All authors have read and agreed to the published version of the manuscript.
Funding
This research was performed within the scope of the NRG2peers project, funded through the European Union’s H2020 framework program for research and innovation under grant agreement no 841850.
Institutional Review Board Statement
Not applicable.
Informed Consent Statement
Not applicable.
Conflicts of Interest
The authors declare no conflict of interest.
Abbreviations
| INDEXES AND SETS | ||
| Set of scenarios | ||
| r | Reference scenario | |
| Time periods | ||
| INPUTS AND PARAMETERS | ||
| Price of energy vector of scenario m at period t | ||
| CO2 emission factor of energy vector of scenario m at period t | ||
| DHW use temperature | 42 °C | |
| Water mains mean temperature | 12 °C | |
| VARIABLES | ||
| DHW demand in scenario m at period t | ||
| Tank temperature in scenario m at period t | ||
| Demanded energy in scenario m at period t | ||
| Boolean discomfort in scenario m at period t | ||
| Cost of scenario m at period t | ||
| CO2 emissions of scenario m at period t | ||
| Annual discomfort hours in scenario m | ||
| Annual bill to pay in scenario m | ||
| Annual CO2 emissions in scenario m | ||
| Annual economic savings in scenario m compared with r | ||
| Annual CO2 emission savings in scenario m compared with r | ||
Appendix A
This appendix presents the different terms included in the electricity energy price and how historical data are updated to consider the recently introduced 2.0 TD electricity tariff. It is considered that residential users in this paper have an electricity contract based on “voluntary prices for small consumer” (hereinafter, PVPC), as it is the current situation of 40% of Spanish households [95]. These prices, PVPC, are regulated and linked to spot market prices, whose calculation methodology is established in [90], considering the following terms:
- Dynamic price of day-ahead and intraday markets;
- Payment for ancillary services;
- Access tolls and charges;
- Other regulated costs: market and system operators’ fees, retailing cost, capacity payment and interruptibility service.
Access tolls and charges depend on the selected tariff, which until 31 May 2021, in the case of domestic consumers (maximum power contract of 10 kW), can be: 2.0 A (default tariff), 2.0 DHA (2 periods tariff), or 2.0 DHS (electric vehicle). As of 1 June 2021, the tariffs for domestic consumers turn into a single one, 2.0 TD, which is a three periods tariff (Table 9).
Due to this recent regulatory change, there is not enough price data to run a one-year simulation. Consequently, price data with 2.0 A tariff from 2020 were updated as follows to consider the access tolls and charges from 2.0 TD tariff:
where
is the electricity price with 2.0 TD tariff at period t.
is the electricity price with 2.0 A tariff at period t.
is the access tolls and charges from 2.0 A tariff (note that this value is constant over all periods).
is the access tolls and charges from 2.0 TD tariff at period t.
Appendix B
This appendix presents the results obtained for the cases with 2, 3 and 4 people.
Figure A1.
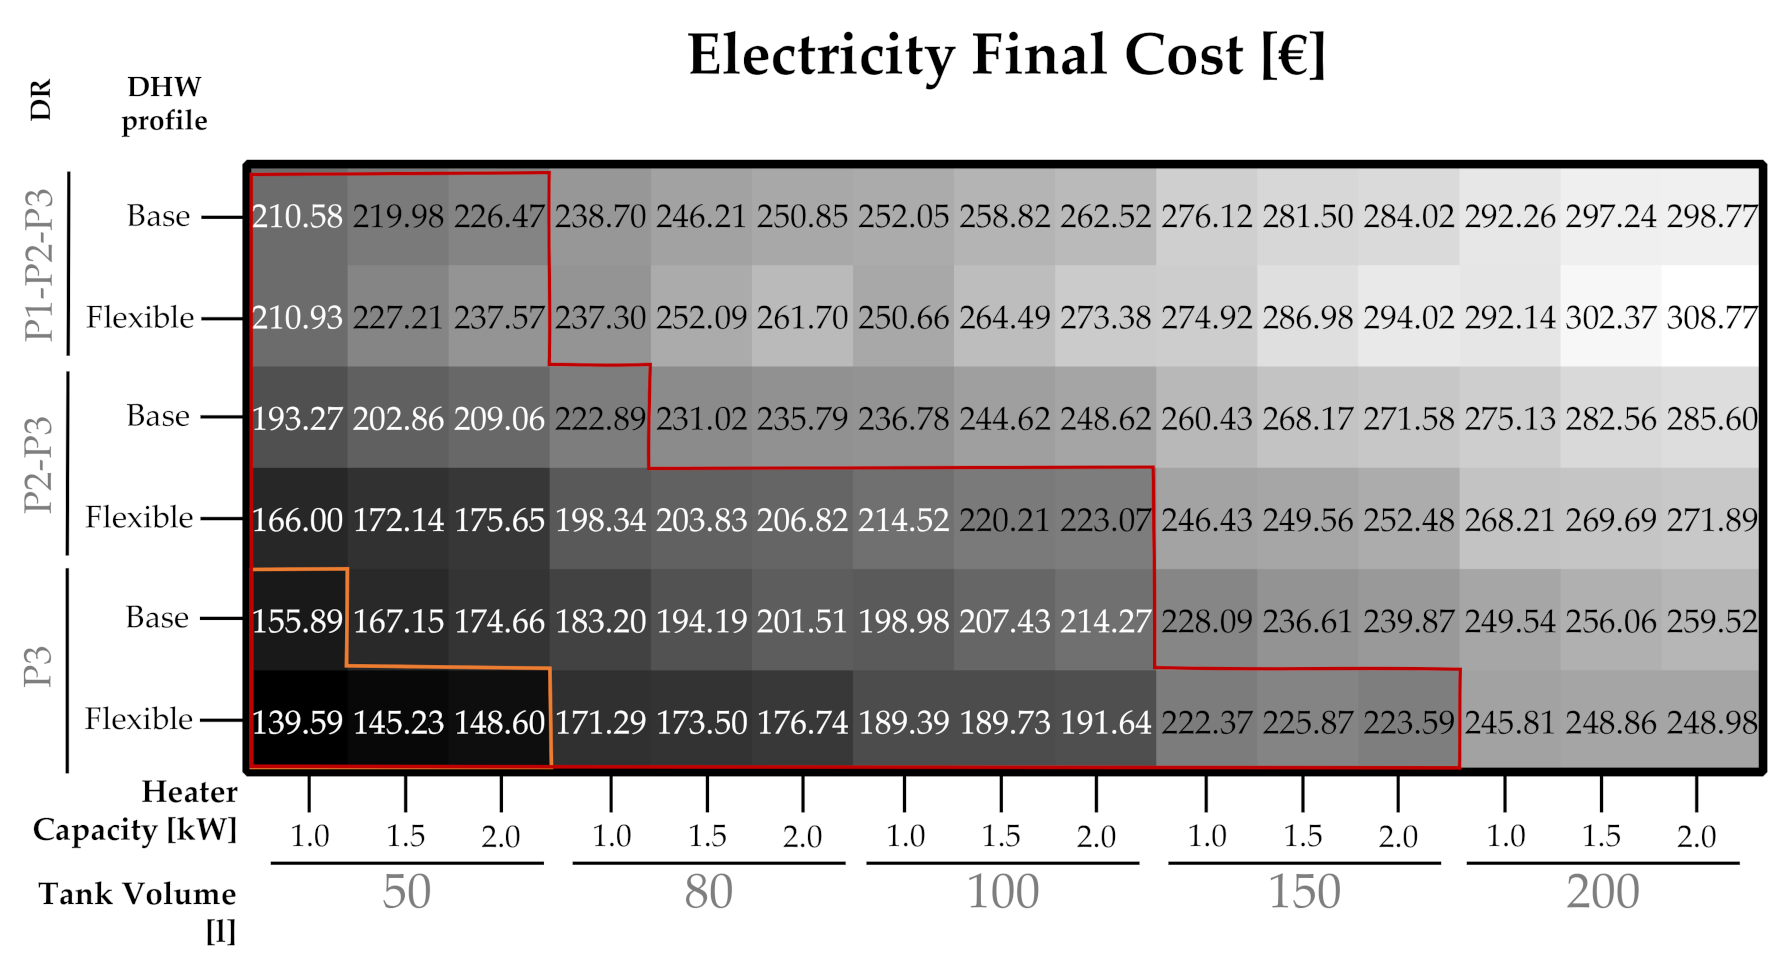
Electricity final annual cost (EUR) for 2 people, and all water heater configurations. The reference price with natural gas boiler is EUR 100.76 (just variable term, VAT included), and EUR 171.04 (final bill, VAT included).
Figure A1.
Electricity final annual cost (EUR) for 2 people, and all water heater configurations. The reference price with natural gas boiler is EUR 100.76 (just variable term, VAT included), and EUR 171.04 (final bill, VAT included).

Figure A2.
CO2 annual emissions (kg) for 2 people, and all water heater configurations. The reference emissions with natural gas boiler are 437.30 kg.
Figure A2.
CO2 annual emissions (kg) for 2 people, and all water heater configurations. The reference emissions with natural gas boiler are 437.30 kg.

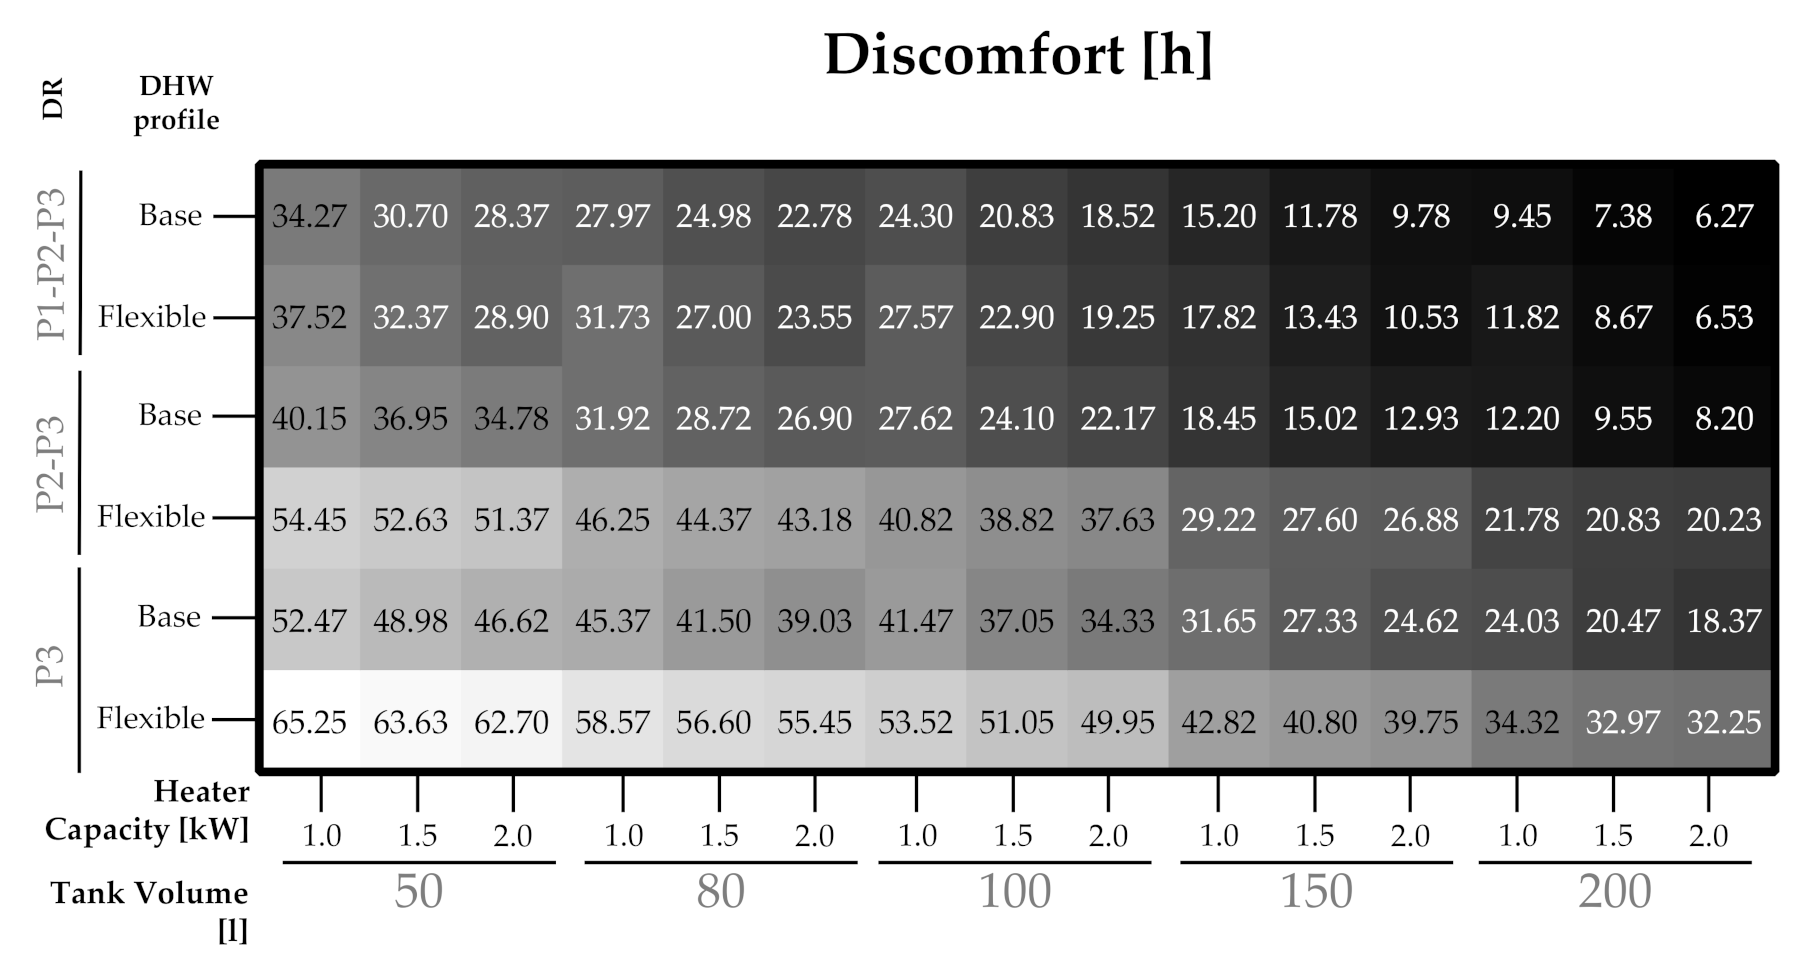
Figure A3.
Discomfort hours annually (h) for 2 people, and all water heater configurations. The reference discomfort hours with instantaneous natural gas boiler are 0 h.
Figure A3.
Discomfort hours annually (h) for 2 people, and all water heater configurations. The reference discomfort hours with instantaneous natural gas boiler are 0 h.

Figure A4.
Electricity final annual cost (EUR) for 3 people, and all water heater configurations. The reference price with natural gas boiler is EUR 128.86 (just variable term, VAT included), and EUR 199.13 (final bill, VAT included).
Figure A4.
Electricity final annual cost (EUR) for 3 people, and all water heater configurations. The reference price with natural gas boiler is EUR 128.86 (just variable term, VAT included), and EUR 199.13 (final bill, VAT included).

Figure A5.
CO2 annual emissions (kg) for 3 people, and all water heater configurations. The reference emissions with natural gas boiler are 559.21 kg.
Figure A5.
CO2 annual emissions (kg) for 3 people, and all water heater configurations. The reference emissions with natural gas boiler are 559.21 kg.

Figure A6.
Discomfort hours annually (h) for 3 people, and all water heater configurations. The reference discomfort hours with instantaneous natural gas boiler are 0 h.
Figure A6.
Discomfort hours annually (h) for 3 people, and all water heater configurations. The reference discomfort hours with instantaneous natural gas boiler are 0 h.

Figure A7.
Electricity final annual cost (EUR) for 4 people, and all water heater configurations. The reference price with natural gas boiler is EUR 157.32 (just variable term, VAT included), and EUR 227.59 (final bill, VAT included).
Figure A7.
Electricity final annual cost (EUR) for 4 people, and all water heater configurations. The reference price with natural gas boiler is EUR 157.32 (just variable term, VAT included), and EUR 227.59 (final bill, VAT included).

Figure A8.
CO2 annual emissions (kg) for 4 people, and all water heater configurations. The reference emissions with natural gas boiler are 682.72 kg.
Figure A8.
CO2 annual emissions (kg) for 4 people, and all water heater configurations. The reference emissions with natural gas boiler are 682.72 kg.

Figure A9.
Discomfort hours annually (h) for 4 people, and all water heater configurations. The reference discomfort hours with instantaneous natural gas boiler are 0 h.
Figure A9.
Discomfort hours annually (h) for 4 people, and all water heater configurations. The reference discomfort hours with instantaneous natural gas boiler are 0 h.

References
- The Council of the European Union. Council Decision (EU) 2016/1841 of 5 October 2016 on the Conclusion, on Behalf of the European Union, of the Paris Agreement Adopted under the United Nations Framework Convention on Climate Change; The Council of the European Union: Brussels, Belgium, 2016. [Google Scholar]
- Haahr, T. The European Parliament Declares Climate Emergency European Parliament. Online. 2019. Available online: https://www.europarl.europa.eu/news/en/press-room/20191121IPR67110/the-european-parliament-declares-climate-emergency (accessed on 14 January 2020).
- European Commission. The European Green Deal; No. 9; European Commission: Brussels, Belgium, 2019; Volume 53, p. 24, Online; Available online: https://eur-lex.europa.eu/legal-content/EN/TXT/?qid=1588580774040&uri=CELEX:52019DC0640 (accessed on 14 January 2020).
- European Commission. 2030 Climate Target Plan. 2020. Online. Available online: https://ec.europa.eu/clima/policies/eu-climate-action/2030_ctp_en (accessed on 2 May 2021).
- European Commission. Stepping up Europe’s 2030 Climate Ambition—Impact Assessment; European Commission: Brussels, Belgium, 2020; Online; Available online: https://eur-lex.europa.eu/legal-content/EN/TXT/?uri=CELEX%3A52020SC0176 (accessed on 2 November 2020).
- International Energy Agency. Sustainable Recovery: World Energy Outlook Special Report; World Energy Outlook: Paris, France, 2020; p. 185, Online; Available online: https://iea.blob.core.windows.net/assets/0716bb9a-6138-4918-8023-cb24caa47794/NetZeroby2050-ARoadmapfortheGlobalEnergySector.pdf (accessed on 2 July 2021).
- European Commission. Clean Energy for All Europeans Package. 2017. Available online: https://ec.europa.eu/energy/topics/energy-strategy/clean-energy-all-europeans_en (accessed on 9 July 2020).
- European Parliament and European Council. Regulation (EU) 2018/1999 of the European Parliament and of the Council of 11 December 2018; European Parliament and Council: Brussels, Belgium, 2018; pp. 1–77. [Google Scholar]
- European Environment Agency. Greenhouse Gas Emissions by Aggregated Sector. Data and Maps. 2019. Available online: https://www.eea.europa.eu/data-and-maps/daviz/ghg-emissions-by-aggregated-sector-5#tab-dashboard-02 (accessed on 1 May 2021).
- World Economic Forum. Fostering Effective Energy Transition. Online. 2021. Available online: www.weforum.org (accessed on 10 September 2021).
- Fabra, N. The energy transition: An industrial economics perspective. Int. J. Ind. Organ. 2021, 79, 102734. [Google Scholar] [CrossRef]
- International Energy Agency. Net Zero by 2050 A Roadmap for the Global Energy Sector. Online. 2021. Available online: https://iea.blob.core.windows.net/assets/0716bb9a-6138-4918-8023-cb24caa47794/NetZeroby2050-ARoadmapfortheGlobalEnergySector.pdf (accessed on 13 August 2021).
- European Parliament. Directive 2010/31/EU; European Parliament and the Council of the European Union: Brussels, Belgium, 2010. [Google Scholar]
- Eurostat. Disaggregated Final Energy Consumption in Households for EU28. 2021. Available online: https://ec.europa.eu/eurostat/databrowser/view/NRG_D_HHQ__custom_937958/default/table?lang=en (accessed on 1 May 2021).
- EU Energy Poverty Observatory. Member State Reports on Energy Poverty 2019; EU Energy Poverty Observatory: Brussels, Belgium, 2019. [Google Scholar]
- European Commission. A Renovation Wave for Europe—Greening our Buildings, Creating Jobs, Improving Lives; Online; European Commission: Brussels, Belgium, 2020; p. 27. Available online: https://ec.europa.eu/energy/sites/ener/files/eu_renovation_wave_strategy.pdf (accessed on 2 December 2020).
- Leibowicz, B.D.; Lanham, C.M.; Brozynski, M.T.; Vázquez-Canteli, J.R.; Castejón, N.C.; Nagy, Z. Optimal decarbonization pathways for urban residential building energy services. Appl. Energy 2018, 230, 1311–1325. [Google Scholar] [CrossRef]
- The European Commission. EU Building Stock Observatory. 2021. Available online: https://ec.europa.eu/energy/topics/energy-efficiency/energy-efficient-buildings/eu-bso_en (accessed on 17 June 2021).
- Penttinen, S.-L.; Kallioharju, K.; Sorri, J.; Heljo, J.; Harsia, P. Electrification and energy efficiency in buildings: Policy implications and interactions. In Electrification; Academic Press: Cambridge, MA, USA, 2021; pp. 175–196. [Google Scholar] [CrossRef]
- European Parliament. Directive (EU) 2018/844; European Parliament and the Council of the European Union: Brussels, Belgium, 2018; Volume 276 LNCS, pp. 98–107. [Google Scholar]
- European Parliament and The Council of the European Union. Directive (EU) 2018/2002; European Parliament and the Council: Brussels, Belgium, 2018; pp. 210–230. [Google Scholar]
- European Parliament and The Council of the European Union. Directive (EU) 2018/2001; European Parliament and the Council: Brussels, Belgium, 2018; pp. 82–209. [Google Scholar]
- European Parliament and The Council of the European Union. Directive (EU) 2019/944; European Parliament and the Council: Brussels, Belgium, 2019; pp. 125–199. [Google Scholar]
- European Parliament and The Council of the European Union. Regulation (EU) 2019/943; European Parliament and the Council: Brussels, Belgium, 2019; pp. 54–124. [Google Scholar]
- United Nations Environment Programme and Climate & Clean Air Coalition. Global Methane Assessment: Benefits and Costs of Mitigating Methane Emissions; United Nations Environment Programme: Nairobi, Kenya, 2021. [Google Scholar]
- Staniaszek, D.; Kockat, J.; Roscini, A.V. A Review of EU Member States’ Long-Term Renovation Strategies. Online. 2020. Available online: https://www.bpie.eu/wp-content/uploads/2020/09/LTRS-Assessment_Final.pdf (accessed on 3 February 2021).
- The European Commission. Recomendations on Building Renovation; Online; No. L127/34; The Official Journal of the European Union: Brussels, Belgium, 2019; Volume 6, pp. 34–79. Available online: https://eur-lex.europa.eu/legal-content/EN/TXT/?qid=1442476465850&uri=CELEX:32019H0786 (accessed on 3 January 2021).
- Castellazzi, L.; Zangheri, P.; Paci, D. Synthesis Report on the Assessment of Member States’ Building Renovation Strategies; Joint Research Centre: Ispra, Italy, 2016. [Google Scholar]
- Dennis, K. Environmentally Beneficial Electrification: Electricity as the End-Use Option. Electr. J. 2015, 28, 100–112. [Google Scholar] [CrossRef] [Green Version]
- Keinath, C.M.; Garimella, S. An energy and cost comparison of residential water heating technologies. Energy 2017, 128, 626–633. [Google Scholar] [CrossRef]
- Hardy, P.; Pinto-Bello, A. EU Market Monitor for Demand Side Flexibility; Delta Energy & Environment Ltd. and smartEn (Smart Energy Europe): Edinburgh, UK, 2019. [Google Scholar] [CrossRef] [Green Version]
- IRENA. Demand-Side Flexibility for Power Sector Transformation; IRENA: Abu Dhabi, United Arab Emirates, 2019. [Google Scholar]
- Mancini, F.; Nastasi, B. Energy retrofitting effects on the energy flexibility of dwellings. Energies 2019, 12, 2788. [Google Scholar] [CrossRef] [Green Version]
- Deason, J.; Borgeson, M. Electrification of Buildings: Potential, Challenges, and Outlook. Curr. Sustain. Energy Rep. 2019, 6, 131–139. [Google Scholar] [CrossRef]
- Thomaßen, G.; Kavvadias, K.; Navarro, J.P.J. The decarbonisation of the EU heating sector through electrification: A parametric analysis. Energy Policy 2021, 148, 111929. [Google Scholar] [CrossRef]
- Raghavan, S.V.; Wei, M.; Kammen, D.M. Scenarios to decarbonize residential water heating in California. Energy Policy 2017, 109, 441–451. [Google Scholar] [CrossRef] [Green Version]
- Del Mar Casanovas-Rubio, M.; Armengou, J. Decision-making tool for the optimal selection of a domestic water-heating system considering economic, environmental and social criteria: Application to Barcelona (Spain). Renew. Sustain. Energy Rev. 2018, 91, 741–753. [Google Scholar] [CrossRef]
- Liu, W.; Chen, C.; Wu, H.; Guo, C.; Chen, Y.; Liu, W.; Cui, Z. Environmental life cycle assessment and techno-economic analysis of domestic hot water systems in China. Energy Convers. Manag. 2019, 199, 111943. [Google Scholar] [CrossRef]
- Tarroja, B.; Chiang, F.; AghaKouchak, A.; Samuelsen, S.; Raghavan, S.V.; Wei, M.; Sun, K.; Hong, T. Translating climate change and heating system electrification impacts on building energy use to future greenhouse gas emissions and electric grid capacity requirements in California. Appl. Energy 2018, 225, 522–534. [Google Scholar] [CrossRef] [Green Version]
- Lott, M.C.; Pye, S.; Dodds, P.E. Quantifying the co-impacts of energy sector decarbonisation on outdoor air pollution in the United Kingdom. Energy Policy 2017, 101, 42–51. [Google Scholar] [CrossRef] [Green Version]
- Ministerio para la Transición Ecológica y el Reto Demográfico. Plan Nacional Integrado de Energía y Clima 2021–2030. Online. 2020. Available online: https://www.miteco.gob.es/images/es/pnieccompleto_tcm30-508410.pdf (accessed on 15 May 2021).
- Ministerio para la Transición Ecológica y el Reto Demográfico. Orden TED/1161/2020; Ministerio para la Transición Ecológica y el Reto Demográfico: Madrid, Spain, 2020; pp. 111349–111371. [Google Scholar]
- Jefatura del Estado. Real Decreto-ley 15/2018; Gobierno de España: Madrid, Spain, 2018; pp. 97430–97467. [Google Scholar]
- Ministerio para la Transición Ecológica. Real Decreto 244/2019; Boletín Oficial del Estado; Gobierno de España: Madrid, Spain, 2019; pp. 35674–35719. [Google Scholar]
- Jefatura del Estado. Real Decreto-Ley 23/2020; Gobierno de España: Madrid, Spain, 2020; pp. 43879–43927. [Google Scholar]
- Comisión Nacional de los Mercados y la Competencia. Resolución de 11 de Diciembre de 2019, de la Comisión Nacional de los Mercados y la Competencia; Comisión Nacional de los Mercados y la Competencia: Madrid, Spain, 2019; pp. 139647–139668. [Google Scholar]
- Sugden, L. The 2020s is the Decade to Decarbonise Heat. Online. 2020. Available online: https://www.delta-ee.com/electrification-of-heat (accessed on 18 September 2021).
- Buildings Performance Institute Europe (BPIE); Climact, S.A.; Creara Consultores, S.L.; Ecologic Institute. Lessons Learned to Inform Integrated Approaches for the Renovation and Modernisation of the Built Environment—Final Report; European Commission: Brussels, Belgium, 2020. [Google Scholar]
- Ministerio de Fomento. Real Decreto 732/2019; No. I.; Boletín Ofical del Estado; Gobierno de España: Madrid, Spain, 2019; Volume 311, pp. 140488–140674, Online; Available online: https://www.boe.es/boe/dias/2019/12/27/pdfs/BOE-A-2019-18528.pdf (accessed on 15 January 2020).
- Ministerio de la Presidencia. Real Decreto 47/2007; Ministerio de la Presidencia: Madrid, Spain, 2007; pp. 4499–4507. [Google Scholar]
- Ministerio de la Presidencia. Real Decreto 235/2013; Ministerio de la Presidencia: Madrid, Spain, 2013; Volume 89, pp. 27548–27562. [Google Scholar]
- Francés, V.M.S.; Lanzarote, A.B.S.; Escribano, V.V.; Escudero, M.N. Improving schools performance based on SHERPA project outcomes: Valencia case (Spain). Energy Build. 2020, 225, 110297. [Google Scholar] [CrossRef]
- Ministerio para la Transición Ecológica y el Reto Demográfico and Ministerio de Transportes Movilidad y Agenda Urbana. Annex I—Common General Framework for the Calculation of EPB. Online. 2020. Available online: https://energia.gob.es/desarrollo/EficienciaEnergetica/CertificacionEnergetica/Documentos/Documentosinformativos/anexo_1_d2018_844_spain_ (accessed on 29 April 2021).
- Pilar de Arriba Segurado (IDAE). Rehabilitación Energética de los Edificios en España y la UE. Experiencia Adquirida y Principales Recomendaciones. pp. 1–6. Online. 2020. Available online: https://www.odyssee-mure.eu/publications/policy-brief/rehabilitacion-edificios-espanoles-eficiencia-energetica-odyssee-mure.pdf (accessed on 15 May 2021).
- Secretaría General de Agenda Urbana y Vivienda. Actualización 2020 de la Estrategia a Largo Plazo para la Rehabilitación Energética en el Sector de la Edificación en España. Online. 2020. Available online: https://ec.europa.eu/energy/sites/ener/files/documents/es_ltrs_2020.pdf (accessed on 23 June 2021).
- Instituto para la Diversificación y el Ahorro de Energía. Informe de Precios Energéticos Regulados—Datos Enero de 2021; Instituto para la Diversificación y el Ahorro de Energía: Madrid, Spain, 2021. [Google Scholar]
- Jefatura del Estado. Ley 49/1960; Gobierno de España: Madrid, Spain, 2019. [Google Scholar]
- Institute for Energy Diversification and Saving—IDEA. Project Sech-Spahousec, Analysis of the Energetic Consumption of the Residential Sector in Spain (Proyecto Sech-Spahousec, Análisis del Consumo Energético del Sector Residencial en España); IDAE: Madrid, Spain, 2011; p. 76. [Google Scholar]
- Ministerio para la Transición Ecológica y el Reto Demografico. Real Decreto 178/2021; Ministerio de la Presidencia, Relaciones con las Cortes y Memoria Democrática: Madrid, Spain, 2021. [Google Scholar]
- Pinazo-Ojer, J.M.; José, R.G.S.; Quiles, P.V.; Lastra, A.G. Informe Sobre Prospectiva y Evolución Futura de los Sistemas de Climatización y ACS en la Edificación Residencial. Online. 2019. Available online: https://cdn.mitma.gob.es/portal-web-drupal/planes_estartegicos/4_2020_sistemas_climatizacion_y_acs_residencial.pdf (accessed on 17 February 2021).
- Ministerio de Vivienda. Real Decreto 314/2006; No. 74; Ministerio de Vivienda: Madrid, Spain, 2006; Volume 11816, p. 11. [Google Scholar]
- European Solar Thermal Industry Federation. Solar Ordinances. 2021. Available online: http://www.estif.org/policies/solar_ordinances/ (accessed on 1 May 2021).
- Ministerio de Fomento. Orden FOM/1635/2013; Ministerio de Fomento: Madrid, Spain, 2013; pp. 67137–67209. [Google Scholar]
- Instituto Nacional de Estadística. Viviendas Principales Según Número de Habitaciones Por Tamaño del Municipio. In Censo 2011; Instituto Nacional de Estadística: Madrid, Spain, 2011; Available online: https://www.ine.es/jaxi/Datos.htm?path=/t20/e244/viviendas/p01/l0/&file=02001.px (accessed on 1 May 2020).
- Unión Española Fotovoltaica (UNEF). El Sector Fotovoltaico Hacia Una Nueva Era—Informe Anual UNEF 2020; Unión Española Fotovoltaica (UNEF): Madrid, Spain, 2020. [Google Scholar]
- Ministerio de Industria Energía y Turismo and Ministerio de Fomento. Factores de emisión de CO2 y coeficientes de paso a energía primaria de diferentes fuentes de energía final consumidas en el sector de edificios en España. Doc. Reconocido Reglam. Instal. Térmicas los Edif. 2016, 1, 16–18. [Google Scholar] [CrossRef]
- Ministerio de Industria Energía y Turismo. Calificación de la Eficiencia Energética de los Edificios; Ministerio de Industria Energía y Turismo: Madrid, Spain, 2015; pp. 1–34. [Google Scholar]
- Red Eléctrica de España (REE). Evolution of Renewable and Non-Renewable Generation. Available online: https://www.ree.es/en/datos/generation/evolution-renewable-non-renewable (accessed on 13 July 2021).
- Red Eléctrica de España (REE). Installed Capacity Generation Total Renewable. Available online: https://www.esios.ree.es/en/analysis/10302?vis=1&start_date=01-01-2015T00%3A00&end_date=31-12-2021T23%3A59&compare_start_date=01-01-2014T00%3A00&groupby=year&compare_indicators=1484,1475,1488,1491,1486,1487,1485 (accessed on 13 July 2021).
- Red Eléctrica de España (REE). Real Time CO2 Associated Generation. Available online: https://www.esios.ree.es/en/analysis/10355?vis=1&start_date=01-01-2020T00%3A00&end_date=31-12-2021T23%3A59&compare_start_date=01-01-2019T00%3A00&groupby=year (accessed on 13 July 2021).
- International Energy Agency. Heat Pumps—Tracking Report; International Energy Agency: Paris, France, 2020. [Google Scholar]
- Eurostat. Final Energy Consumption in Households by Fuel—Spain. 2021. Available online: https://ec.europa.eu/eurostat/databrowser/view/t2020_rk210/default/table?lang=en (accessed on 14 May 2021).
- Directorate-General for Energy (European Commission), IPSOS, and Navigant. Comprehensive Study of Building Energy Renovation Activities and the Uptake of Nearly Zero-Energy Buildings in the EU; Publications Office of the European Union: Luxembourg, 2019. [Google Scholar] [CrossRef]
- Agbonaye, O.; Keatley, P.; Huang, Y.; Ademulegun, O.O.; Hewitt, N. Mapping demand flexibility: A spatio-temporal assessment of flexibility needs, opportunities and response potential. Appl. Energy 2021, 295, 117015. [Google Scholar] [CrossRef]
- European Heat Pump Association. Heat Pump Sales Overview—Spain. 2021. Available online: http://www.stats.ehpa.org/hp_sales/story_sales/ (accessed on 15 May 2021).
- Ruiz, A.G.; Lanzarote, B.S.; Madrigal, L.O. Catálogo de Tipología Edificatoria Residencial Ámbito: España; Instituto Valenciano de la Edificación: València, Spain, 2016; Volume 91. [Google Scholar]
- Departamento de Planificación y Estudios—IDAE. Estudio SPAHOUSEC II. Análisis Estadístico del Consumo de Gas Natural en las Viviendas Principales Con Calefacción Individual. Madrid. Online. 2019. Available online: https://www.idae.es/sites/default/files/documentos/publicaciones_idae/estudio_spahousec-ii_270619.pdf (accessed on 3 March 2021).
- Heiskanen, E.; Matschoss, K. Understanding the uneven diffusion of building-scale renewable energy systems: A review of household, local and country level factors in diverse European countries. Renew. Sustain. Energy Rev. 2017, 75, 580–591. [Google Scholar] [CrossRef] [Green Version]
- Lübkert, T.; Venzke, M.; Turau, V. Impacts of domestic electric water heater parameters on demand response: A Simulative Analysis of Physical and Control Parameter Impacts. Comput. Sci. Res. Dev. 2017, 32, 49–64. [Google Scholar] [CrossRef]
- Jordan, U.; Vajen, K. DHWcalc: Program to generate Domestic Hot Water profiles with statistical means for user defined conditions. In Proceedings of the Solar World Congress 2005: Bringing Water to the World, Including Proceedings of 34th ASES Annual Conference and Proceedings of 30th National Passive Solar Conference, Orlando, Florida, 8–12 August 2005; International Solar Energy Society: Washington, DC, USA, 2005; Volume 3. [Google Scholar]
- Crawley, D.B.; Lawrie, L.K.; Winkelmann, F.C.; Buhl, W.F.; Huang, Y.J.; Pedersen, C.O.; Strand, R.K.; Liesen, R.J.; Fisher, D.E.; Witte, M.J.; et al. EnergyPlus: Creating a new-generation building energy simulation program. Energy Build. 2001, 33, 319–331. [Google Scholar] [CrossRef]
- Marszal-Pomianowska, A.; Jensen, R.L.; Pomianowski, M.; Larsen, O.K.; Jørgensen, J.S.; Knudsen, S.S. Comfort of domestic water in residential buildings: Flow, temperature and energy in draw-off points: Field study in two danish detached houses. Energies 2021, 14, 3314. [Google Scholar] [CrossRef]
- Red Eléctrica de España (REE). Consumption Demand Generation-Losses Difference. Available online: https://www.esios.ree.es/en/analysis/10058?vis=1&start_date=01-01-2020T00%3A00&end_date=31-12-2020T23%3A00&compare_start_date=01-01-2019T00%3A00&groupby=hour&compare_indicators=1293 (accessed on 13 July 2021).
- Braas, H.; Jordan, U.; Best, I.; Orozaliev, J.; Vajen, K. District heating load profiles for domestic hot water preparation with realistic simultaneity using DHWcalc and TRNSYS. Energy 2020, 201, 117552. [Google Scholar] [CrossRef]
- Wong, L.T.; Mui, K.W.; Guan, Y. Shower water heat recovery in high-rise residential buildings of Hong Kong. Appl. Energy 2010, 87, 703–709. [Google Scholar] [CrossRef]
- Joint Research Centre (JRC). TMY Generator. 2021. Available online: https://ec.europa.eu/jrc/en/PVGIS/tools/tmy (accessed on 2 April 2021).
- Hendron, R.; Anderson, R.; Christensen, C.; Eastment, M.; Reeves, P. Development of an Energy Savings Benchmark for All Residential End-Uses; National Renewable Energy Laboratory: Golden, CO, USA, 2004. [Google Scholar]
- Burch, J.; Erickson, P. Using Ratings Data to Derive Simulation-Model Inputs for Storage—Tank Water Heaters. In Proceedings of the Solar 2004 Conference, Portland, OR, USA, 11–14 July 2004; pp. 393–398. [Google Scholar]
- Comisión Nacional de los Mercados y la Competencia. Resolución de 18 de Marzo de 2021, de la Comisión Nacional de los Mercados y la Competencia, por la que se Establecen los Valores de los Peajes de Acceso a las Redes de Transporte y Distribución de Electricidad de Aplicación a Partir del 1 de Junio de 202; Comisión Nacional de los Mercados y la Competencia: Madrid, Spain, 2021; pp. 33575–33593. [Google Scholar]
- Ministerio de Industria Energía y Turismo. Real Decreto 216/2014; Gobierno de España: Madrid, Spain, 2014; pp. 27397–27428. [Google Scholar]
- Ministerio para la Transición Ecológica y el Reto Demográfico. Real Decreto 148/2021; Gobierno de España: Madrid, Spain, 2021; pp. 31103–31123. [Google Scholar]
- The European Commission. Energy Efficiency—Revision of the Energy Performance of Buildings Directive; Published Initiatives: Brussels, Belgium, 2021; Available online: https://ec.europa.eu/info/law/better-regulation/have-your-say/initiatives/12910-Energy-efficiency-Revision-of-the-Energy-Performance-of-Buildings-Directive_en (accessed on 27 October 2021).
- Khan, M. The EU’s electricity market and why soaring gas prices are driving bills higher. Financial Times, 14 October 2021. [Google Scholar]
- Kate, A.; Marina, S. Nine EU countries oppose electricity market reforms as fix for energy price spike. Reuters Energy, 26 October 2021. [Google Scholar]
- Comisión Nacional de los Mercados y la Competencia Comisión Nacional de los Mercados y la Competencia. IS/DE/012/21: Boletín indicadores eléctricos. AÑO 2021. 2021. Available online: https://www.cnmc.es/expedientes/isde01221 (accessed on 17 June 2021).
Figure 1.
Final energy consumption in Spanish households. Source: Authors with Eurostat data [72].
Figure 1.
Final energy consumption in Spanish households. Source: Authors with Eurostat data [72].

Figure 2.
Electricity prices during a week. Taxes and levies not included.

Figure 3.
Electricity final annual cost (EUR) for 1 person, and all water heater configurations. The reference price with natural gas boiler is EUR 71.85 (just variable term, VAT included), and EUR 142.12 (final bill, VAT included).
Figure 3.
Electricity final annual cost (EUR) for 1 person, and all water heater configurations. The reference price with natural gas boiler is EUR 71.85 (just variable term, VAT included), and EUR 142.12 (final bill, VAT included).

Figure 4.
CO2 annual emissions (kg) for 1 person, and all water heater configurations. The reference emissions with natural gas boiler are 311.81 kg.
Figure 4.
CO2 annual emissions (kg) for 1 person, and all water heater configurations. The reference emissions with natural gas boiler are 311.81 kg.

Figure 5.
Discomfort hours annually (h) for 1 person, and all water heater configurations. The reference discomfort hours with instantaneous natural gas boiler are 0 h.
Figure 5.
Discomfort hours annually (h) for 1 person, and all water heater configurations. The reference discomfort hours with instantaneous natural gas boiler are 0 h.


Table 1.
Primary weighting factors from final energy consumption (kWh).
| Energy Vector. | PEtot (kWh) | PEnon-ren (kWh) | PEren (kWh) | CO2 (kgCO2) |
|---|---|---|---|---|
| National Electricity | 0.396 | 2.007 | 2.403 | 0.357 |
| Peninsular Electricity | 0.414 | 1.954 | 2.368 | 0.331 |
| Extrapeninsular Electricity | 0.075 | 2.937 | 3.011 | 0.833 |
| Electricity, Balearic Islands | 0.082 | 2.968 | 3.049 | 0.932 |
| Electricity, Canary Islands | 0.070 | 2.924 | 2.994 | 0.776 |
| Electricity, Ceuta and Melilla | 0.072 | 2.718 | 2.790 | 0.721 |
| Heating oil | 0.003 | 1.179 | 1.182 | 0.311 |
| LPG | 0.003 | 1.201 | 1.204 | 0.254 |
| Natural Gas | 0.005 | 1.190 | 1.195 | 0.252 |
| Coal | 0.002 | 1.082 | 1.084 | 0.472 |
| Biomass 1 | 1.028 | 0.085 | 1.113 | 0.018 |
1 Pelletized biomass is considered.
Table 2.
Reference conditions for DHWcalc draw-off profiles.
| Parameter | Value |
|---|---|
| Number of draw-off categories | 4 |
| Timestep | 1 min |
| Probability ratio weekends/weekdays- | 120% |
| Amplitude of sine function for seasonal variations | 10% |
| Day of sine maximum | 45 |
| Holiday periods | Spain’s national holidays 2021 |
| Ratio of mean daily draw-off for holidays | 5% |
Table 3.
Reference conditions for draw-off categories in DHWcalc.
| Draw-Off Category | 1: Small | 2: Medium | 3: Bath | 4: Shower |
|---|---|---|---|---|
| Mean draw-off flowrate (L/h) | 60 | 360 | 840 | 480 |
| Draw-off duration (min) | 1 | 1 | 10 | 5 |
| Portion of total volume (%) | 14 | 36 | 10 | 40 |
| Standard deviation of flowrate (L/h) | 120 | 120 | 12 | 24 |
Table 4.
Probability function settings for DHWcalc weekdays and weekends, base case.
| Time Period (h) | Ratio of Daily DHW-Volume (%) |
|---|---|
| Weekdays | |
| 22:00–06:30 | 6.5 |
| 06:30–07:30 | 14.2 |
| 07:30–12:00 | 3 |
| 12:00–13:00 | 0.8 |
| 13:00–18:00 | 8 |
| 18:00–22:00 | 67.6 |
| Weekend days | |
| 23:00–07:00 | 3.8 |
| 07:00–09:00 | 47.5 |
| 09:00–15:00 | 7.1 |
| 15:00–17:00 | 23.8 |
| 17:00–20:00 | 3.6 |
| 20:00–23:00 | 14.3 |
Table 5.
Probability function settings for DHWcalc weekdays and weekends, flexible case.
| Time Period (h) | Ratio of Daily DHW-Volume (%) |
|---|---|
| Weekdays | |
| 22:00–06:30 | 2 |
| 06:30–07:30 | 50 |
| 07:30–12:00 | 6 |
| 12:00–13:00 | 16 |
| 13:00–18:00 | 6 |
| 18:00–22:00 | 20 |
| Weekend days | |
| 23:00–07:00 | 3.8 |
| 07:00–09:00 | 47.5 |
| 09:00–15:00 | 7.1 |
| 15:00–17:00 | 23.8 |
| 17:00–20:00 | 3.6 |
| 20:00–23:00 | 14.3 |
Table 6.
Definitory parameters of WaterHeater:Stratified object in EnergyPlus.
| Parameter | Value 1 |
|---|---|
| Tank volume (m3) | TankVolume |
| Tank shape | Vertical |
| H:D ratio | 2.3 |
| Maximum temperature | 80 °C |
| Heater capacity | HeaterCapacity |
| Heater setpoint temperature | 50 °C |
| Heater dead band temperature difference | 3 °C |
| Nodes equally distributed | 6 |
| Ambient temperature | 22 °C |
| On Cycle parasitic consumption rate | 10 W |
| Off Cycle parasitic consumption rate | 10 W |
1 Values in Italics were subject to variation according to the parametric simulation.
Table 7.
Parametric simulation of WaterHeater:Stratified object in EnergyPlus.
| Parameter | Value |
|---|---|
| Tank Volume | 50 L, 80 L, 100 L, 150 L and 200 L |
| Heater Capacity | 1 kW, 1.5 kW and 2 kW |
Table 8.
Periods from 2.0 TD electricity tariff.
| Time Period (h) | Tariff Period |
|---|---|
| Weekdays | |
| 0:00–07:59 | P3 |
| 08:00–09:59 | P2 |
| 10:00–13:59 | P1 |
| 14:00–17:59 | P2 |
| 18:00–21:59 | P1 |
| 22:00–23:59 | P3 |
| Weekend days and holidays | |
| 0:00–23:59 | P3 |
Table 9.
Natural gas prices in 2020 for domestic consumers (demand ≤ 5000 kWh/year). Source: Authors with data from [56].
Table 9.
Natural gas prices in 2020 for domestic consumers (demand ≤ 5000 kWh/year). Source: Authors with data from [56].
| Months | Energy Price (EUR/kWh) | Fixed Price (EUR/Month) |
|---|---|---|
| January–March | 0.0496 | 4.26 |
| April–June | 0.0496 | 4.26 |
| July–September | 0.0466 | 4.26 |
| October–December | 0.0450 | 4.26 |
Table 10.
Variables from the parametric simulation.
| Parameter | Value |
|---|---|
| People | 1, 2, 3 and 4 |
| DHW profile | Flexible and base |
| Electric water heater | |
| Tank volume | 50 L, 80 L, 100 L, 150 L and 200 L |
| Heater Capacity | 1 kW, 1.5 kW and 2 kW |
| Demand Response (DR) | P1-P2-P3, P2-P3 and only P3 |
Table 11.
Summary of main results for all cases.
| Users | Water Heater 1 | Management Strategy | |||||||
|---|---|---|---|---|---|---|---|---|---|
| DHW Profile | DR | DHW Profile | DR | ||||||
| Base | P1-P2-P3 | Flexible | P3 | ||||||
| without | with | without | with | ||||||
| 1 person | 200 L and 2 kW | 4.29 | N/A | 10.63 | 204.17 | 20.71 | N/A | 26.71 | 212.36 |
| 2 people | 100 L and 2 kW | 18.27 | N/A | 5.07 | 297.62 | 49.27 | N/A | 36.58 | 319.23 |
| 3 people | 80 L and 2 kW | 31.23 | N/A | 0.22 | 387.44 | 57.27 | N/A | 44.13 | 546.82 |
| 4 people | 50 L and 2 kW | 36.99 | N/A | 1.12 | 468.82 | 65.86 | 8.72 | 78.99 | 552.73 |
1 Water heater configuration providing economic savings with the minimum discomfort. 2 Referred to total DHW use time. 3 As a function of natural gas supply removal.
Publisher’s Note: MDPI stays neutral with regard to jurisdictional claims in published maps and institutional affiliations. |
© 2021 by the authors. Licensee MDPI, Basel, Switzerland. This article is an open access article distributed under the terms and conditions of the Creative Commons Attribution (CC BY) license (https://creativecommons.org/licenses/by/4.0/).
Share and Cite
MDPI and ACS Style
Carnero, P.; Calatayud, P. A Parametric Analysis for Short-Term Residential Electrification with Electric Water Tanks. The Case of Spain. Sustainability 2021, 13, 12070. https://0-doi-org.brum.beds.ac.uk/10.3390/su132112070
AMA Style
Carnero P, Calatayud P. A Parametric Analysis for Short-Term Residential Electrification with Electric Water Tanks. The Case of Spain. Sustainability. 2021; 13(21):12070. https://0-doi-org.brum.beds.ac.uk/10.3390/su132112070
Chicago/Turabian StyleCarnero, Pablo, and Pilar Calatayud. 2021. "A Parametric Analysis for Short-Term Residential Electrification with Electric Water Tanks. The Case of Spain" Sustainability 13, no. 21: 12070. https://0-doi-org.brum.beds.ac.uk/10.3390/su132112070
Note that from the first issue of 2016, this journal uses article numbers instead of page numbers. See further details here.