
Solar E-Cooking with Low-Power Solar Home Systems for Sub-Saharan Africa
by
 and
and
Fernando Antonanzas-Torres
1,*, 
Ruben Urraca
2,
Camilo Andres Cortes Guerrero
3 and
Julio Blanco-Fernandez
1 1
Department of Mechanical Engineering, University of La Rioja, 26004 Logroño, Spain
2
European Commission, Joint Research Centre, Via Fermi 2749, I-21027 Ispra, Italy
3
Department of Electrical Engineering, Universidad Nacional de Colombia, Bogota 111321, Colombia
*
Author to whom correspondence should be addressed.
Sustainability 2021, 13(21), 12241; https://0-doi-org.brum.beds.ac.uk/10.3390/su132112241
Submission received: 30 September 2021
/
Revised: 29 October 2021
/
Accepted: 3 November 2021
/
Published: 5 November 2021
(This article belongs to the Special Issue Feature Papers in Energy Sustainability)
Abstract
:The e-cooking feasibility was evaluated for two of the main staple foods across rural Sub-Saharan Africa (rice and maize porridge) considering basic solar home systems (SHS) of 100–150 W and using inexpensive market available low-power DC cooking devices (rice cooker and slow cooker). The coverage of e-cooking necessities was spatially evaluated for the African continent considering households of two, five, and eight people. While households of two people were able to be covered >95% of the days, the increase in e-cooking necessities implied that only larger PV generators (150 W) located in high irradiation sites (>2400 kWh/m/year) were able to fulfill e-cooking, even in scenarios of households of five and eight people. Furthermore, the economic cost and the greenhouse gases emission factor (GHG) of e-cooking via small SHS were evaluated and benchmarked against traditional technologies with wood and charcoal considering three-stone and improved stoves and liquefied petroleum gas (LPG) cookers. The GHG for e-cooking was 0.027–0.052 kgCOeq./kg·meal, which was strikingly lower than the other technologies (0.502–2.42 kgCOeq./kg·meal). The e-cooking cost was in the range of EUR 0.022–0.078 person/day, which was clearly lower than LPG and within the range of the cost of cooking with wood and charcoal (EUR 0.02–0.48 person/day). The results provided a novel insight regarding market available technologies with a potential of changing cooking conditions in this region.
1. Introduction
Meeting Sustainable Development Goal (SDG) 7 regarding “access to affordable, reliable, sustainable and modern energy for all” is far from being accomplished in Sub-Saharan Africa (SSA) with 942 million people lacking clean cooking in 2020, which is denoted as cooking with electricity, liquefied petroleum gas (LPG), improved cook stoves, gas, and biogas and ethanol, and with 578 million lacking electricity [1]. While electrification is moving faster than population growth in large areas of SSA [2], today, the rate of population with clean cooking (15% in 2020) is decreasing [3]. Technologies for cooking, and consequently, fuels used, efficiencies, and cooking costs vary not only among countries in SSA but also between rural and urban areas and by socio-economic status [4,5]. Biomass cooking in SSA is mostly performed in rural areas with firewood (73%), charcoal (24%), dung (2%), and crop waste (1%) [6]. This has serious implications for health, with 490,000 premature deaths per year in SSA, which are mainly children and women [3]; for the environment, with the striking loss of forests and biodiversity due to the unsustainable biomass source [7]; and for productivity, due to the time expenditure for wood collection that increases with deforestation. Indeed, forest depletion has consequences over nutrition, fostering faster recipes with a lower use of wood or charcoal that are also frequently less healthy [8]. In the last decades, the efforts of governments and international agencies have been focused on the promotion of improved cook stoves [9], with a higher thermal efficiency compared to traditional open fire or “three stone” cookers and allowing the same biomass fuels. However, the benefits of improved cookers are questioned regarding environmental impacts, health objectives, and economic cost compared to other clean cooking technologies [10,11].
Clean cooking with sustainable energy has been extensively studied in the literature using a wide variety of solar-thermal-based technologies, generally comprising the use of direct solar irradiance, reflectors, and concentrators [12,13,14,15]. Despite the long research trajectory of these solar thermal cookers, their use in SSA remains low [16] and are mostly limited to experimental cases delivered for research and NGOs due to different factors such as high initial capital cost and low market availability, lack of social acceptance, cooking speed, and dependence on direct solar irradiance [17,18,19,20]. Alternatively, instead of specific solar thermal cooking devices designed ad hoc for rural SSA, electrification in SSA is opening the path for clean cooking with electricity and considering the same cooking technologies deployed in other regions, also denoted as “e-cooking” [21]. In this line, not only are renewables receiving more importance in the technology mix of SSA national grids due to the striking reduction in the levelized cost of electricity (LCOE) of PV and wind [22] but also in off-grid electricity due to the recent plans for electrification with PV-based mini grids (both 100% PV and hybrid PV-diesel) and SHS [23]. As a result, e-cooking with electricity from renewable sources represents the most promising choice for SDG7 fulfillment in terms of sustainable and modern energy access [11]. Regarding e-cooking with the national electricity grid, Aemro et al. (2020) [24] benchmarked electric cooking considering a single hot plate, an induction, and an electric pressure cooker to cook traditional meals in Ethiopia. The electric pressure cooker was found to achieve a higher thermal efficiency and a lower economic expenditure. Additionally, e-cooking was found to significantly reduce emissions, human toxicity, and forest degradation compared to traditional biomass [6]. Regarding off-grid e-cooking, this concept was pioneered in 2002 as a technically feasible solution (not economically at that time) for refugee situations using mini grids [25]. Since then, with the striking cost reduction experienced in PV modules and storage systems [11] and the improvements in operation and maintenance, PV mini grids have significantly reduced its levelized cost of electricity (LCOE), which is currently in the range of USD 0.55/kWh for hybrid PV-diesel mini grids and is expected to lower to USD 0.22/kWh by 2030 [26]. A recent study about e-cooking with a PV mini-grid in Tanzania showed that the cooking cost was comparable to firewood and lower than LPG [10].
While mini-grids are mostly focused on densely populated off-grid regions without plans for grid extension, large off-grid areas remain out of national electrification plans: mainly remote and scattered households, “under-the-grid” unelectrified areas, and semi-nomadic populations [27]. In these cases, SHS offer a rapid and independent solution in SSA for sustainable electrification, with an environmental impact equivalent to PV-based mini-grid electricity [28]. Leach and Oduro (2015) [29] evaluated the cost of SHS cooking with PV generators of 350–1300 Wp and battery storage of 2.2–9.8 kWh, concluding with the economic cost parity between cooking with SHS and with charcoal and LPG. Furthermore, Zubi et al. (2017) [30] analyzed the economic feasibility of electric cooking with PV considering a 420 Wp PV module, a 2.1 kWh Li-ion battery, and a 700 W pressure multi-cooker. It was found that the initial cost of the installation of EUR 2080 was compensated along the life cycle of the system, indeed at a lower cost than cooking with fossil fuel. Batchelor et al. (2018) [31] developed and proved an e-cooking prototype (300 W), which was directly powered with a 500 Wp PV module. Couture & Jacobs (2019) [11] analyzed e-cooking with SHS considering different cooking technologies: hot plate (2000 W), induction (1500 W), pressure cooker (700 W), and slow cookers (190 W). Pressure cookers and slow cookers achieved the lowest cost of e-cooking, indeed, potentially equivalent to cooking with charcoal and firewood. Regarding low-power cooking, the concept of a highly insulated e-cooking prototype of 100 W, directly powered with a 120 Wp PV module and without a battery, was proved in Uganda [20], limiting its use to periods with high solar irradiance. E-cooking using SHS with PV generation in the range of 100–200 Wp was also discussed as a possibility for poor households [4].
Most of the literature for e-cooking analyzed power-intensive cooking technologies (>500 W) with national grids, mini grids, or SHS, the latter considering PV modules of >350–500 Wp and a battery storage of >2.1 kWh, which are strikingly larger systems compared to SHS being deployed in rural SSA for lighting and basic electric devices—typically at 50–150 Wp for PV and 0.54–1.2 kWh for storage [28]. To date, there is no literature regarding the feasibility of cooking with small SHS integrating a PV module, battery storage, and market-available low power cookers.
1.1. SSA Staple Food
Energy requirements for cooking are extremely dependent on the recipe, the power intensity of the cooking method, and the cooking time. While some cooking preparations, such as fried and roasted meals require high cooking temperatures above 150 C, a wide range of recipes use boiling water, which can be achieved with high power at low cooking time using hot plates, induction, and pressure cookers [24] but also at a low power intensity, increasing the cooking time [4]. Many of the staple foods in SSA use boiling for cooking, which opens the path for e-cooking with low power intensity. In this line, consumption rates of white maize, generally cooked as a form of boiled porridge under different national names (“ugali” in Kenya, “posho” in Uganda, “nshima” in Malawi and Zambia, “sadza” in Zimbabwe, “phaleche” in Botswana, and “pap” in South Africa, among others), are in the range of 0.050–0.328 kg/person/day, representing the largest contribution of calorie intake in South-east Africa [32,33,34]. Porridge-based meals are cooked not only with white maize but also with cassava, millet, and sorghum in other regions of SSA considering a similar boiling preparation [35]. Regarding rice (also cooked with boiling water), it is the staple food and largest calorie contributor in large areas of West Africa and Madagascar with a consumption rate that keeps growing, which is estimated at 0.165–0.274 kg/person/day [36,37]. Other staple foods in SSA include couscous, beans, broad beans, potatoes, fish, pasta, and vegetables, which are all usually cooked in boiling water. Besides, not only is boiling water used for cooking meals but also for making tea and sterilizing water, being boiling the most frequently deployed sterilizing method at the house level [38].
While high-power intensity methods are restricted to grid-connected (national grid or mini-grid) or large SHS, potentially allowing not only boiling but also frying and roasting, two market-available technologies are able to cook through boiling water or with temperatures near to water boiling with low power intensity (<100 W) and are also market available at DC: rice cookers and slow cookers. Slow cookers are specially designed to cook recipes at a low temperature, at a very long cooking time, and with relatively high thermal losses through the container, especially through the lid, which is designed not to close hermetically. On the other side, rice cookers can be seen as a midpoint between slow cookers and pressure cookers: they have a thermal efficient design to minimize thermal losses, while keeping extremely cost-effective, and they can be used for cooking rice and other recipes requiring water boiling.
1.2. Contributions
The lack of literature covering e-cooking with low power intensity technologies that could be plugged into small DC SHS (preventing the expense of a DC/AC inverter) and the high potential of staple foods in SSA to be cooked with these technologies motivated this study.
The contributions of this study are threefold:
- To prove the technical feasibility of e-cooking with small SHS of PV (100–150 Wp) and a lead-acid battery storage of 100 Ah.
- To assess the potential of e-cooking with a small SHS in SSA.
- To benchmark the environmental impact and economic cost of e-cooking with SHS against wood, charcoal, and LPG.
The article is structured as follows. Section 2 describes the methodology used for calculating the cooking potential, the economic cost, and the environmental impact. Section 3 and Section 4 cover the spatial analysis of the e-cooking potential coverage and the economic cost across the region, while in Section 5, the environmental impact of e-cooking versus other cooking technologies is benchmarked. Finally, Section 6 and Section 7 correspond to the discussion and conclusion sections, respectively.
2. Methods
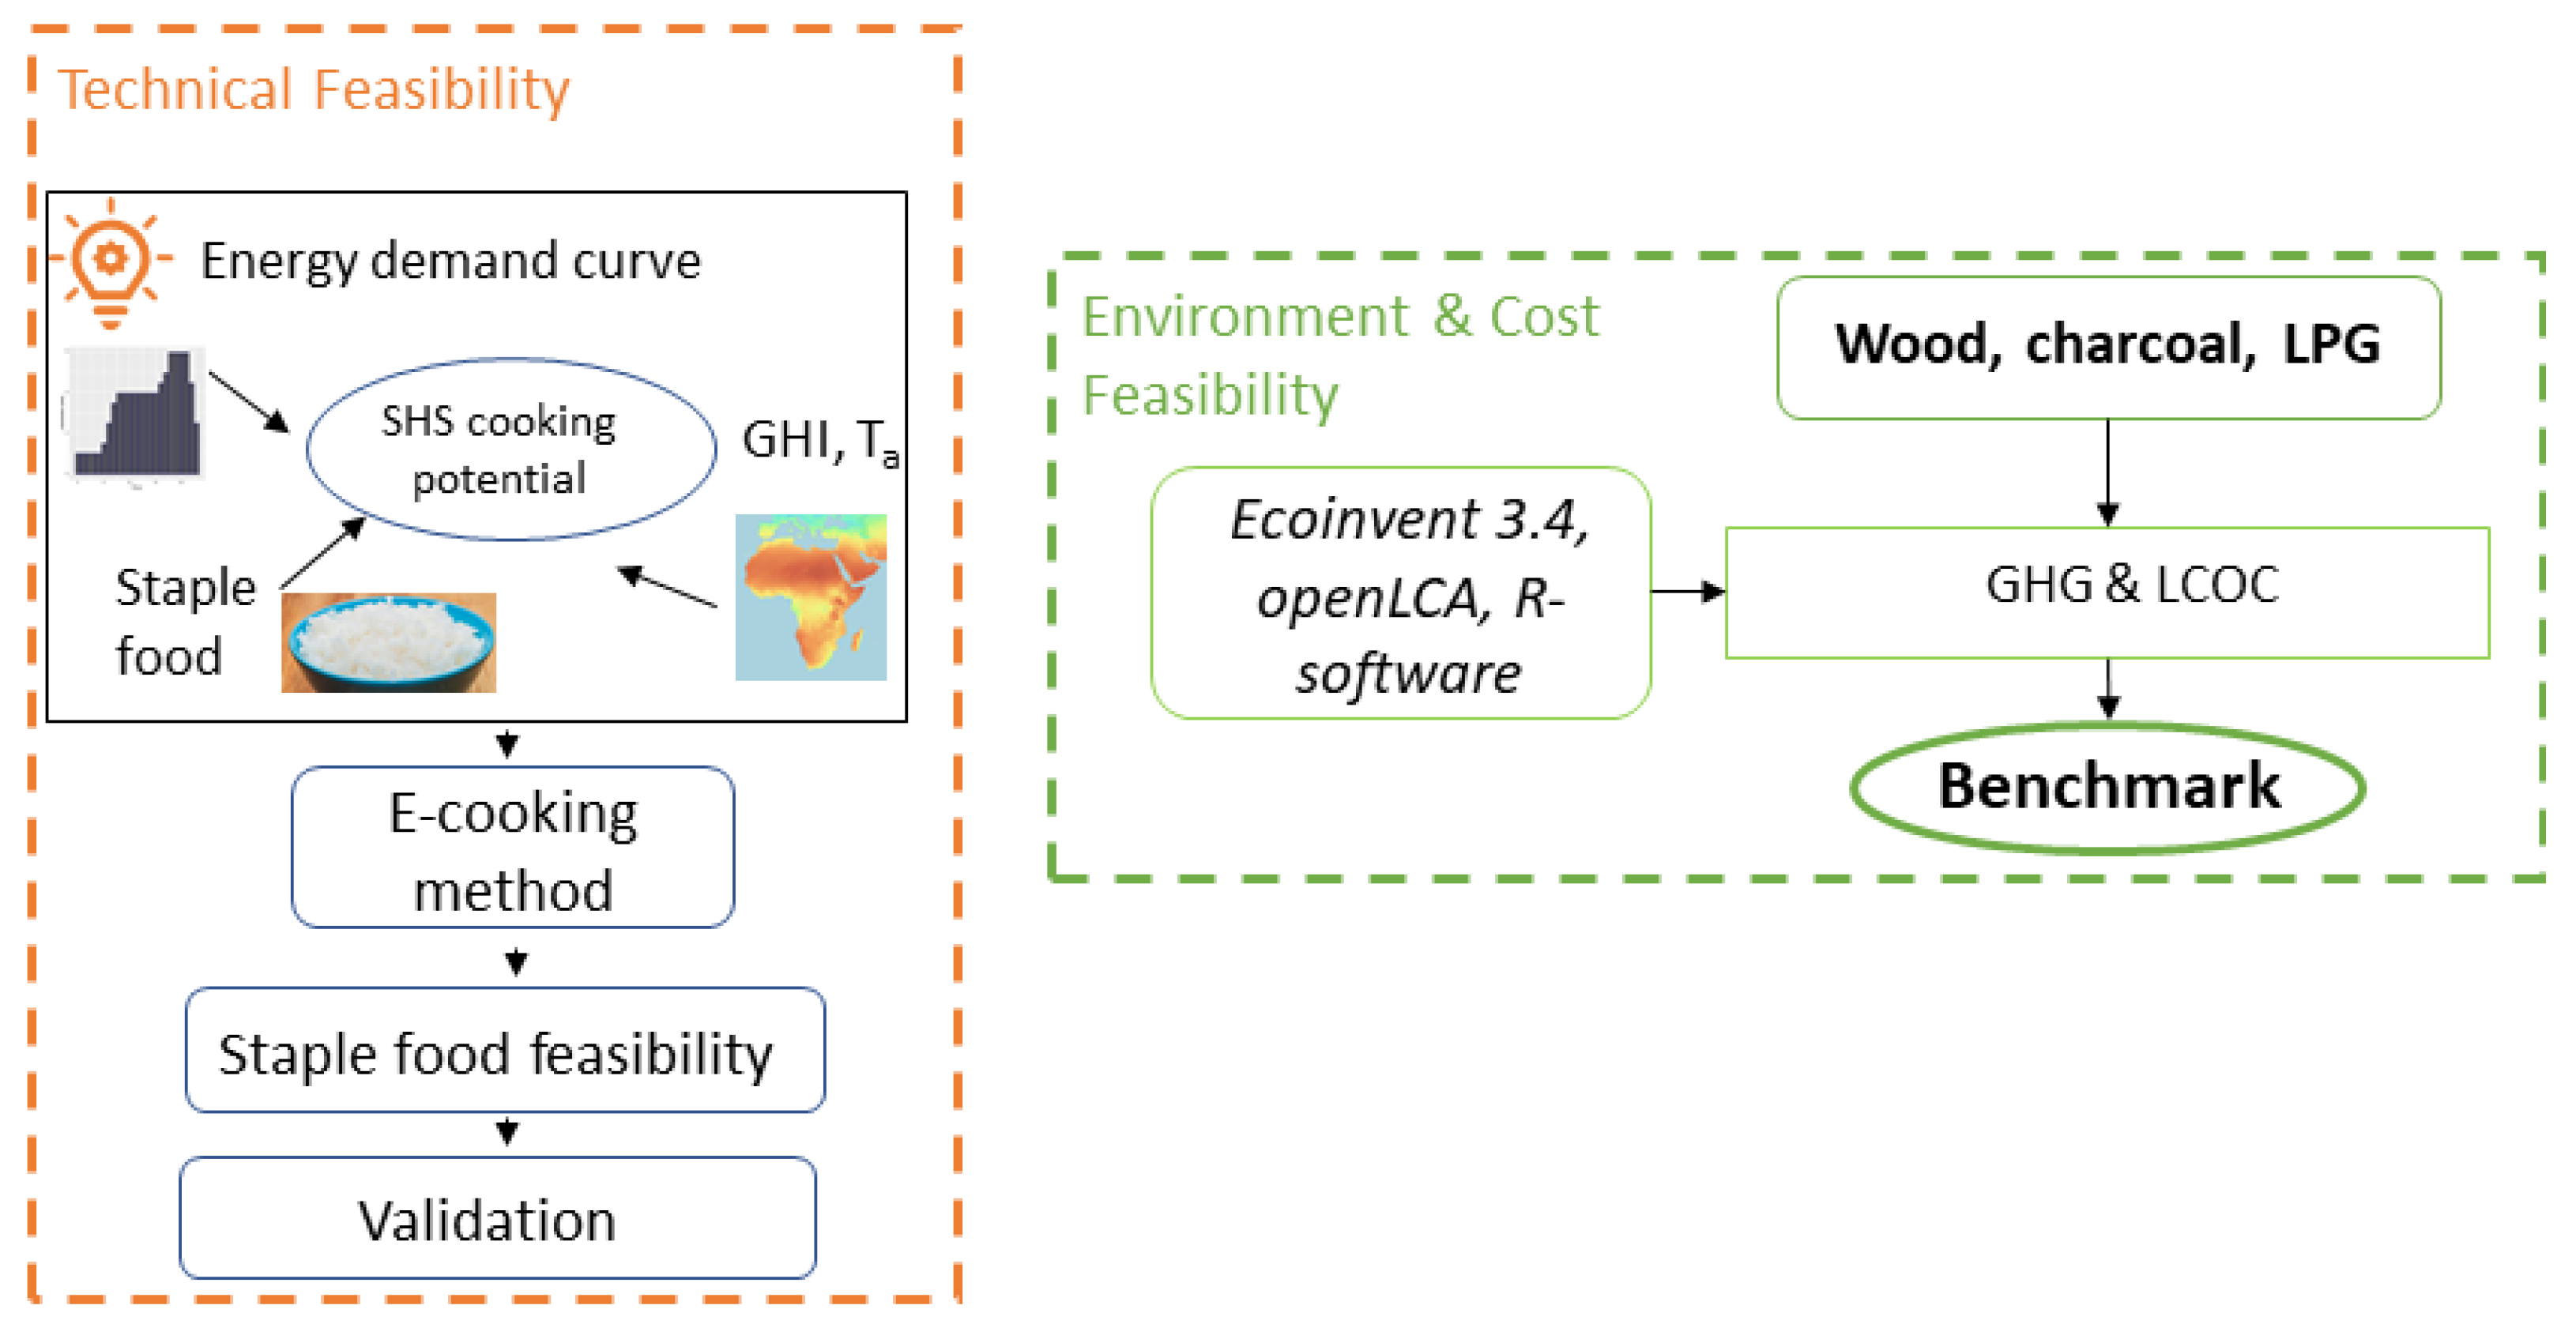
The study was composed of two methodological blocks analyzing the technical feasibility and the environmental and cost feasibility of e-cooking with small SHS. Figure 1 depicts the method followed.
2.1. Technical Feasibility
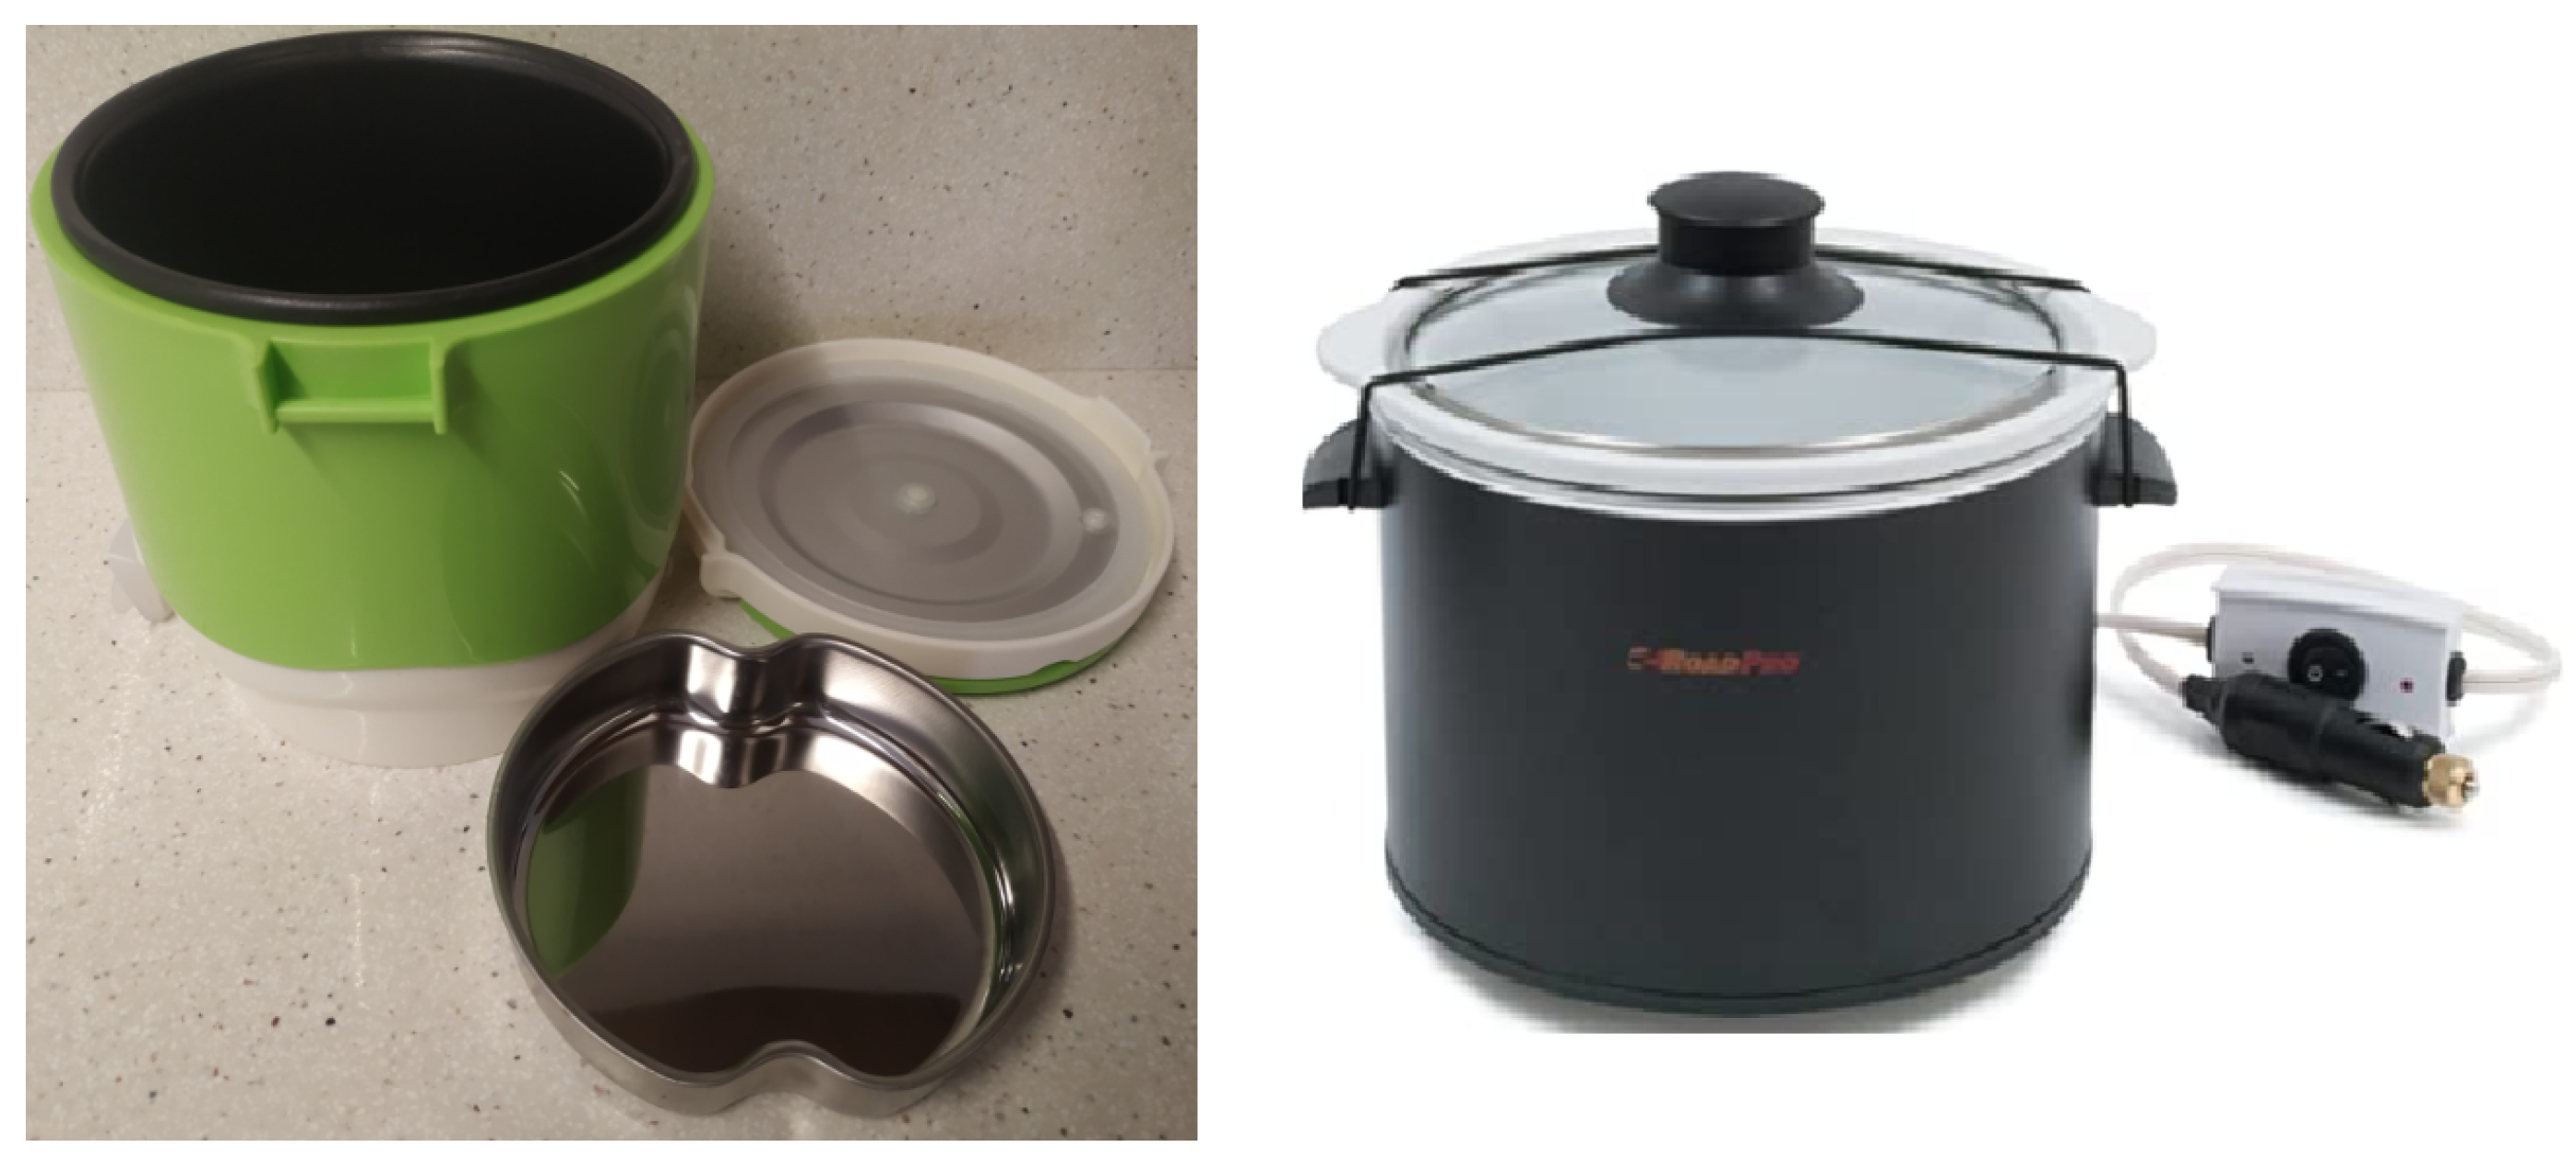
The technical feasibility of an off-grid system depends on how generation and storage is coupled with consumption. The cooking potential was calculated based on the excess of energy of the SHS after discounting the non-cooking electric requirements. Two SHSs were considered based on markets trends of SHS in SSA [39]: SHS100 and SHS150, which integrate a 100 and 150 Wp poly-crystalline PV modules, respectively, with a deep-discharge lead-acid battery of 100 Ah (C10) and a pulse-width-module (PWM) charge regulator and which operate at 12 V DC without an inverter. Two different e-cooking devices were analyzed: a rice cooker (100 W, 12 V DC) and a slow cooker (96 W, 12 V DC) (Figure 2). Table 1 summarizes the specifications and cost of the main system components considered in the study.
2.1.1. SHS Energy Calculation
The performance of the SHS was simulated with the online PV simulator PVGIS [40]. Figure 3 depicts the process of SHS energy calculation. The solar resource available in each pixel was estimated with the satellite-based product SARAH-1 [41], which was produced from Meteosat geostationary satellites by the Climate Monitoring Satellite Application Facility (CM SAF). First, SARAH-1 calculates the effective cloud albedo from MVIRI and SEVIRI visible channels on-board Meteosat first- and second-generation satellites, respectively, and then combines it with estimations from the MAGIC clear-sky model to obtain the surface shortwave incoming irradiance. The variables used by PVGIS are global and direct horizontal irradiance at 0.05 × 0.05 degrees and 1 h. Compared to the other solar radiation products available at PVGIS (ERA5, COSMO, and CMSAF operational), SARAH produces the best estimations over the METEOSAT disk with a mean bias deviation (MBD) and root mean squared deviation (RMSD) of around 0.68 and 14.64 W/m, respectively [42,43].
The irradiance in the plane-of-the-module () was then estimated with the Muneer model [44], which is a transposition model that accounts for the anisotropic diffuse irradiance coming from both the horizon band and the circumsolar region. The effect of the surrounding terrain shadows were also accounted for using the PVGIS built-in horizon profile calculated from the SRTM 3 DEM (90 m) from NASA.
The hourly PV power () of the off-grid system was calculated by PVGIS with a simplified model that assumes the nominal power () and a fixed annual performance ratio ():
By default, PVGIS off-grid uses a conservative annual of 0.68. This value can be indirectly tuned by varying the PV nominal power. The fixed annual accounts for angle of incidence losses, spectral losses, module temperature and irradiance losses, soiling, artificial shadows, battery temperature, battery state of charge, speed of discharge, non-maximum-power-point-tracking (MPPT) conditions due to the use of a PWM charge controller, and wiring resistance [45], among others. Unlike utility-scale PV power plants, whose PR are optimized to maximize yield, SHS are frequently designed, installed, and operated without specific training, leading to higher inefficiencies and a wider dispersion of PR. In this line, 30 SHS were analyzed within the International Energy Agency (IEA) PVPS Task 2 finding PR in the range of 0.65–0.8 [46]. Thus, in order to consider how the SHS’s PR affects e-cooking, a sensitivity study with PR values of 0.65 and 0.75 was conducted.
The SHS performance was evaluated along a period of 8 years (2007–2014). For each hour, the model calculated the energy produced and updated the state of the battery () given its initial state () and the hourly consumption (). If , the energy excess was accumulated in the battery. Otherwise, the battery was discharged until reaching the battery maximum discharge point (), which is the limit that prevents a dramatic battery lifespan reduction. A of 40% was assumed for a lead-acid battery [40].
The electricity demand is covered if , otherwise the SHS cannot supply the electricity required, and the corresponding day is flagged as “battery empty.” If , there is an energy excess that cannot be stored, and the corresponding day is flagged as “battery full.”
All SHS energy calculations were performed using the PVGIS open tool developed by the European Commission [40]. Particularly, the non-interactive off-grid tool () was used to generate the maps of the current study. A spatial resolution of the SARAH solar irradiance database of 0.5 × 0.5 was used. All simulations were performed with PV modules at a fixed position, north-facing below the Equator (and vice-versa above), and with the optimum tilt angle for each pixel, which was calculated with the PVGIS grid-connected tool ().
2.1.2. E-Cooking Potential Calculation
Regarding food preparations, two staple foods were evaluated based on the importance in the intake calorie consumption in SSA (Section 1.1): white maize porridge and plain rice. The cooking energy consumption, the amount of food cooked, and the cooking time of both preparations, depicted in Table 2, were obtained from real test empirical measurements by the authors. Both staple foods were cooked at an efficiency of 220 g (the capacity of the rice cooker) with 45 Wh and 38–43 Wh, for rice and porridge, respectively, a value of equivalent magnitude to [47]. Cooking times for rice and white maize porridge were 42 and 35–40 min (depending on the consistency desired for porridge), respectively. Note that despite the fact that the rice cooker had a nameplate power of 100 W, most of the cooking process was performed at a power ranging from 45 to 64 W. Besides, it must be noted that in the rice cooker it is possible to simultaneously cook 220 g of dry food, plus an estimated of 45 g of vegetables (i.e., spinach) using the steam generated in the superior plate without further energy consumption or cooking time. Due to the extremely high cooking time of the slow cooker device, with cooking times higher than 90 min, the study was performed considering as the rice cooker as a cooking device.
Three different consumption scenarios were analyzed considering a house of two, five, and eight people (H2, H5, and H8, respectively) based on SSA statistics of per-capita rice and maize consumption [32,33,34,36,37]. A daily intake per capita of 300 g of dry food and 0.375 L of tea for breakfast was assumed, which could be complemented within the cooking device with other sources of calorie intake, e.g., oil, vegetables, fish, meat, or eggs. Thus, based on the results of Table 2 and the daily consumption of H2, H5, and H8, the SHS performance in terms of the amount of days per year that these staple food requirements were fulfilled was evaluated.
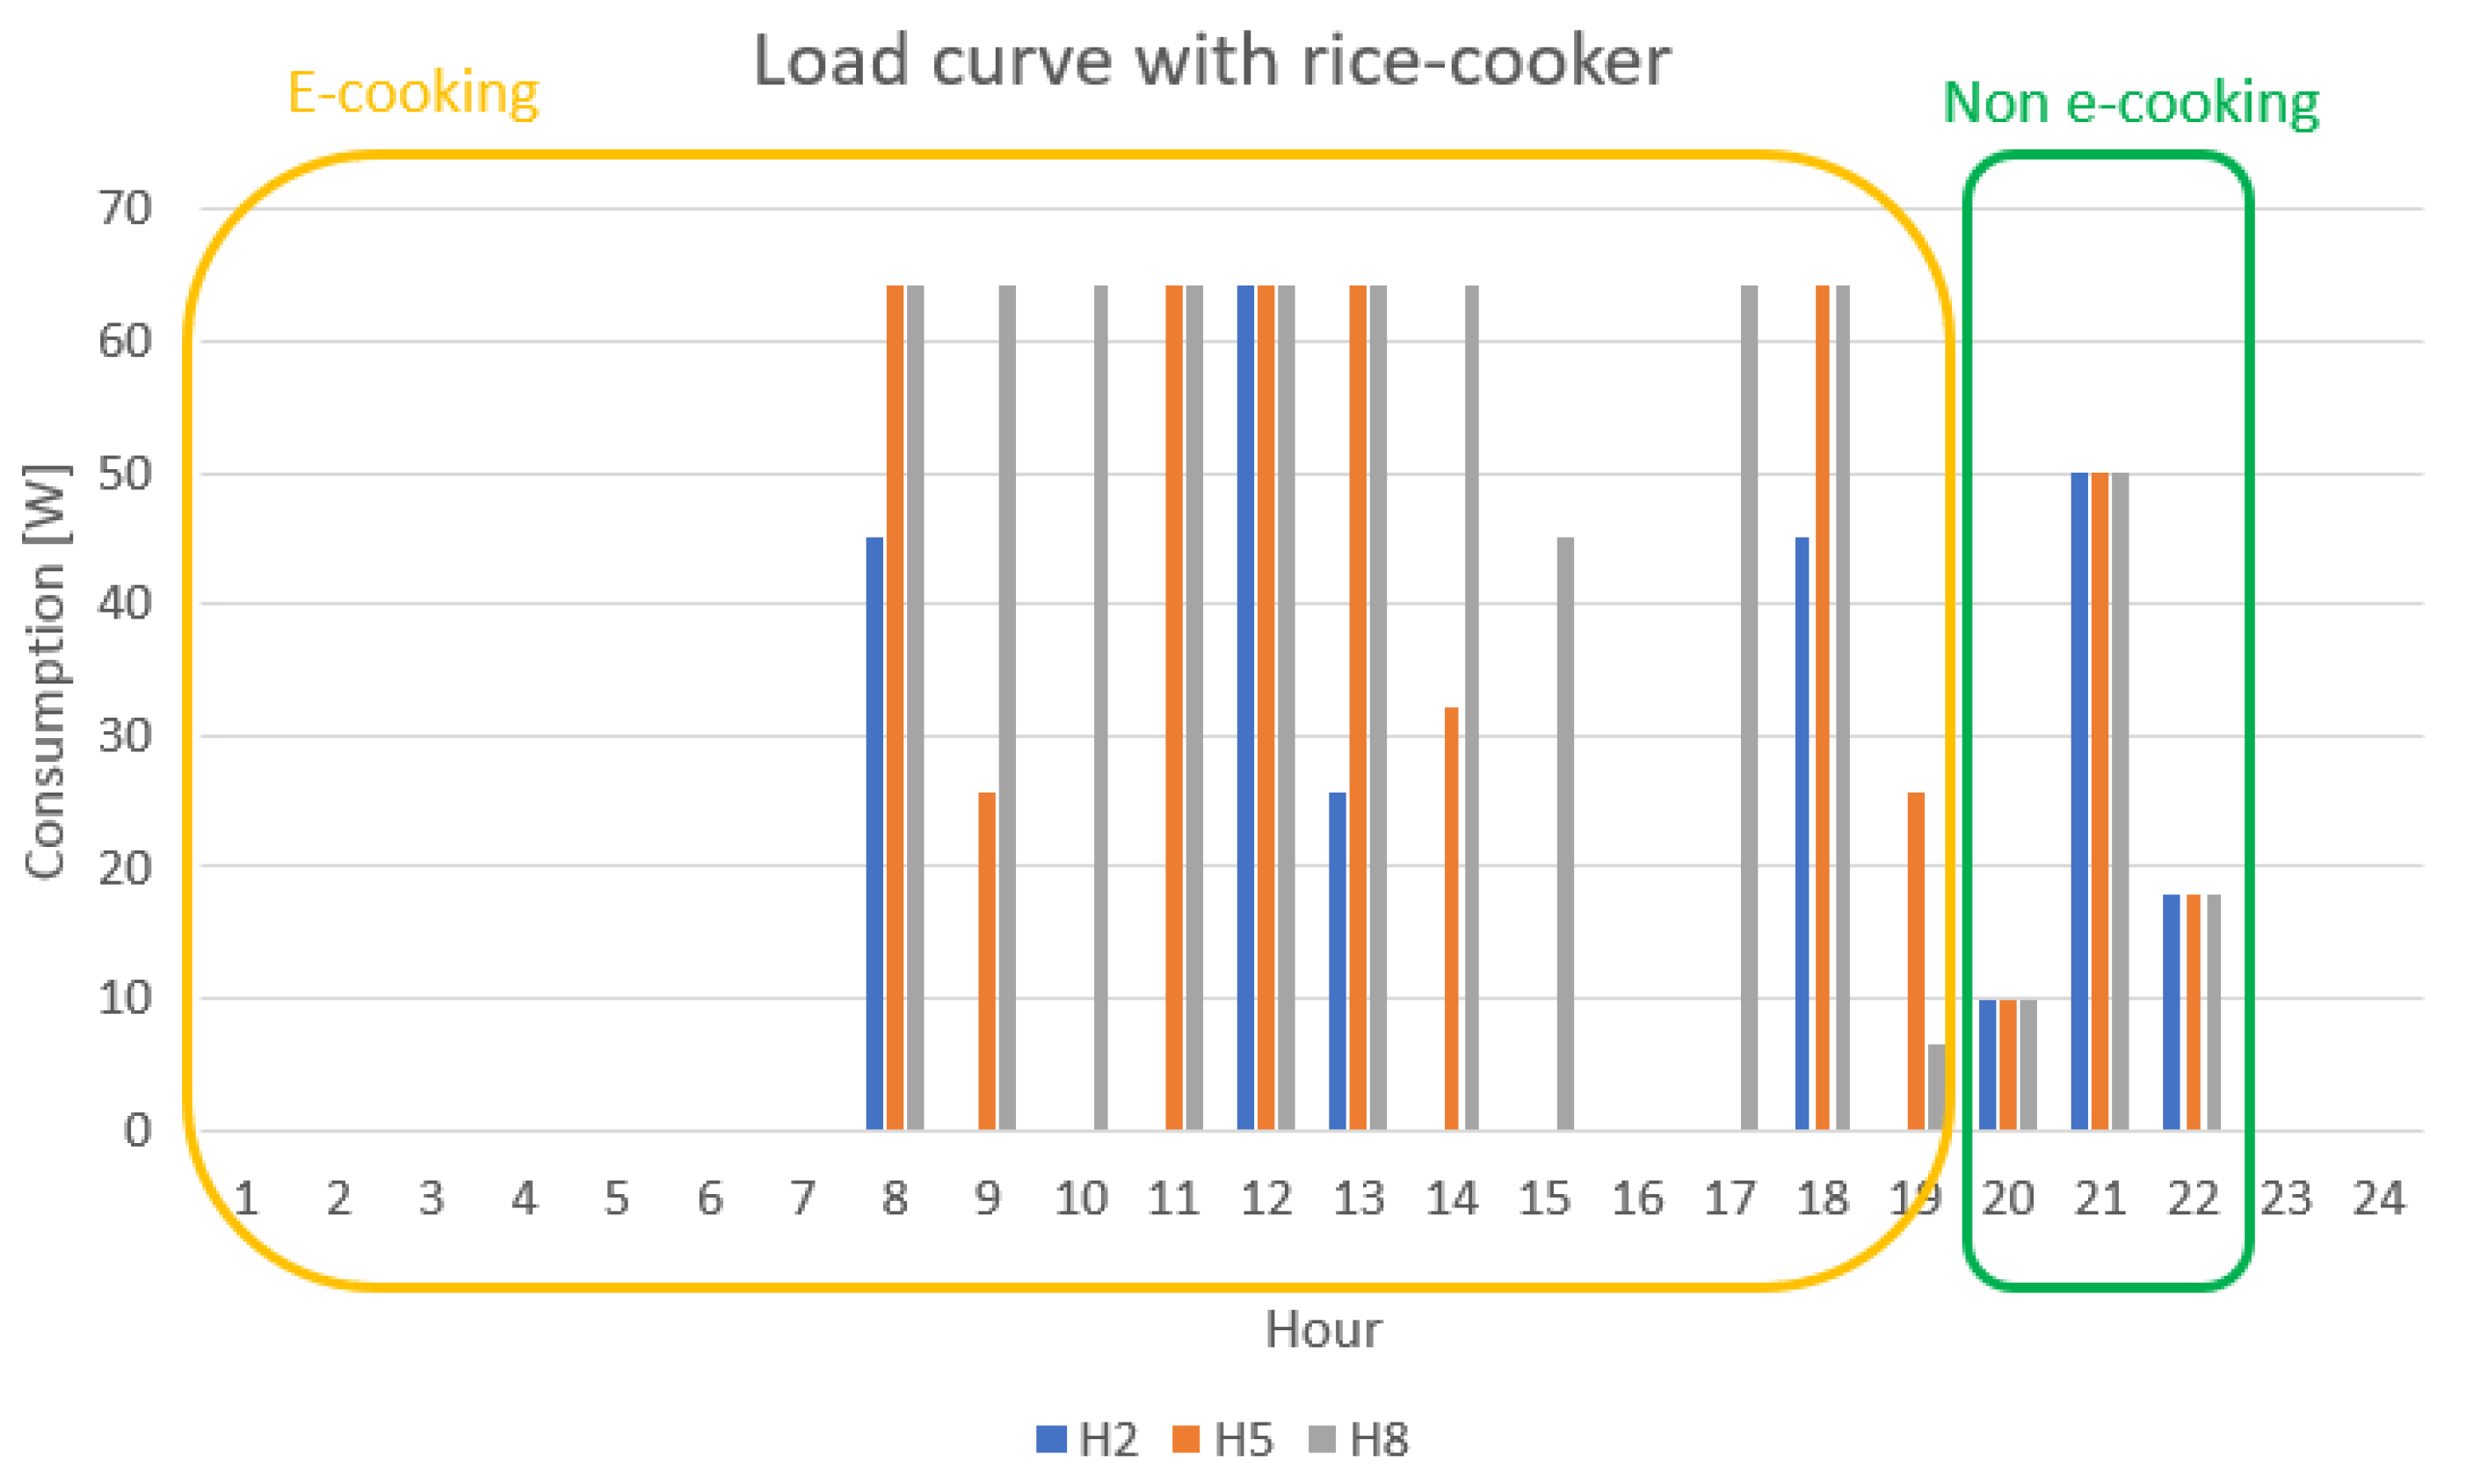
The cooking potential was calculated giving priority to non-cooking electricity use until was reached. The electricity demand curve for non-cooking purposes was estimated considering the widely referred SHS evening peak demand curve [39,48], assuming two LED light bulbs (at 5 W each during 3 h), two phone chargings per day (at 4 W each during 1 h), and an undefined electric device (at 40 W during 1 h). Then, a cooking operational window was considered assuming three potential cooking periods related to three food daily intakes (one for the tea breakfast and the other two for the meal intake): 7:00–9:00, 10:00–14:00, and 16:00–18:00 (local standard time) assuming a cooking energy expenditure of 45 Wh per 220 g. Eventually, the daily energy consumption for H2, H5, and H8 were 258, 483, and 708 Wh/day, respectively.
Figure 4 depicts the non-cooking consumption curve and e-cooking operational windows. Since the cooking capacity was limited by the cooking device size, it was assumed using it consecutively, while loading and unloading the cooking device as many times as required to cover the household necessities. Thus, this figure depicts in which manner the different scenarios (H2, H5, and H8) impacted the SHS load curve.
2.2. Economic Cost Analysis
While the cost of cooking with combustion techniques depends on the expense of fuels (wood, charcoal, and LPG), e-cooking costs depend on the cost of electricity generated and the meals cooked during the SHS life cycle. Thus, a levelized cost of e-cooking () for the off-grid system was defined in Equation (2) to benchmark different cooking technologies based on their economic cost.
where is the investment in year t, r the discount rate, is the e-cooking share from total SHS used electricity, i is the inflation, and M is the number of meals. The costs of the SHS components and cooking devices described in Table 1 were used, assuming that the installation was performed by the user at no cost. We assumed that the value of the SHS system at the end of its lifespan was 10% of its initial value. Lifespans of 20 years for the panels, 5 years for the cooker and PMW charge controller, and 4 years for the battery were considered. The analysis was performed for 20 years using a discount rate of 5 % [11,49], an inflation rate of 3% [50], and considering two staple meals per person and day. Two estimations of the LCOC were made: first, a point estimation assuming a demand coverage of 100%, and, second, a spatial estimation taking into account the real demand coverage in each region and the PV module degradation, with an initial degradation of 2.5% plus an annual degradation rate of 0.6%/year.
2.3. Environmental Impact Analysis
The environmental impact of e-cooking was approached considering attributional modeling and cut-off life cycle inventories—assuming impacts related to primary production to primary users—from ecoinvent 3.4 [51] and the international life cycle assessment guidelines [52] described in ISO 14040 (2006) [53] and ISO 14044 (2006) [54]. The functional unit considered was cooking 1 kg of dry meal. Boundaries of the study were comprised from raw material mining to SHS component manufacturing, transportation from factory to site, and end-of-life management. The greenhouse gases (GHG) emission factor was considered for scoring and benchmarking e-cooking with other cooking technologies. The GHG factor has been the indicator used the most for comparing cooking technologies regarding the environmental impact [55,56,57,58].
3. Potential of E-Cooking with SHS in SSA
The e-cooking potential for staple foods considering SHS100 and SHS150 was calculated for SSA. Note that reducing staple foods in SSA to two preparations is a simplification, as it is the consideration of consuming these meals every day. Besides, the results are presented as continuous maps across Africa to evaluate spatial patterns, despite the fact that the existence of grids or mini-grids would not justify the installation of SHS in many African regions.
Figure 5 depicts the optimum fixed angle and the annual global irradiation on the plane of the module (), for a PV module installed at the optimum fixed tilt angle for a north-facing panel below the equator, and vice-versa above. The range of fluctuated between 1600 kWh/m in the Equatorial region and the South-African coast due to the prevalence of cloud cover and 2800 kWh/m in the eastern Sahara and in south-western Africa. Overall, most of SSA has a kWh/m.
The whole range of inefficiencies of the SHS were integrated into a fixed annual PR, a variable subjected to a potential high variability in SHS due to the lack of expertise in the procurement, installation, and operation of systems that are user-dependent. Thus, two different PR (0.75 and 0.65) were simulated to evaluate the sensitivity of e-cooking necessities with PR. These values were in the low and high range of off-grid PR values reported in the literature [46]. The variables analyzed spatially were (i) the percentage of days when the battery is not empty (battery state above BMDP), i.e., days when the electricity demand is fully covered, and (ii) the percentage of electricity demanded covered, including the coverage during partially covered days. Figure 6 depicts the percentage of days with the battery not empty for an annual PR of 0.75, which corresponds to a correctly installed and well-operated SHS and PR of 0.65, which corresponds to a realistic scenario corresponding to SHS being installed by an untrained user. On the other side, the annual demand coverage is depicted in Figure A1 showing the portion of coverage supplied until BMDP.
H2 necessities were covered 98–100% of the days in most of the SSA region with both SHS100 and SHS150. Due to the heterogeneous solar resources across the continent (Figure 5), the high coverage found with SHS100 and SHS150 is explained by an over-sized SHS. In both cases, the battery does not reach the BMDP, introducing a safety factor since systems surpassing or operating closer to have a higher risk of deep discharges and lifespan reduction.
Regarding H5 necessities, it must be noted that the PV generator size remarkably accounted for coverage. Thus, while SHS150 covers 98–100% of the days in most of the SSA region, SHS100 only achieved this range in areas with kWh/m. Indeed the percentage of days with the battery not reaching BMDP with SHS100 was as low as 5–20% in the Gulf of Nigeria and the Equatorial region. Only the desert areas of the Sahara, Namibia, Kalahari, northern Somalia, and south-western Madagascar avoided battery discharges 90% of the days. Nevertheless, days reaching were limited only to areas with in the range of 1600 kWh/m and representing 20–30% of the days. As a result, it was found that the SHS size, either SHS100 or SHS150, accounted as a critical factor to achieve high coverage and avoid .
The high energy requirements of a house of eight people (H8) were never covered with the SHS100 without reaching the . Indeed, the battery was empty every day at any African location. Despite this, the SHS100 was able to supply around 40–80% of the daily electricity requirements (Figure A1). When considering the larger SHS150, the days with the battery not empty increased to 40–80% in regions with 2600 kWh/m, and the electricity demand coverage increased as well up to a 60–100%, making the SHS150 a viable solution for the H8 scenario in African regions with high solar resources.
The consequences of reducing the annual PR to 0.65, which corresponds to poorly installed and maintained SHS, were also evaluated in Figure 6. The results obtained with PR 0.75 and 0.65 were equivalent for H2 with SHS100 and SHS150. Only certain areas with SHS100 and with lower than 1600 kWh/m achieved in 20–30% of the days. With H5 and H8, the influence of a PR 0.65 led to a significant reduction in coverage and battery performance compared to PR 0.75. Days with the battery not empty were as low as 0–30% in most of the region with SHS100 for H5 and 0% for H8. Regarding the average coverage, it ranged from 70to 95% for H5 while for H8 was 50–70% (Figure A1). Regarding SHS150 with PR 0.65, H5 was highly covered in areas with greater than 1800 kWh/m, while for H8 the battery performance was very poor, with most of the days reaching despite achieving an average coverage greater than 60–90%. Overall, the spatial analysis showed that the H2 scenario was covered with SHS100 and SHS150 in most of the regions without reaching the BMDP, which helps extend the battery lifespan. Moreover, this scenario was covered even assuming a poorly designed and operated system (PR = 0.65). H2 represents a highly reliable opportunity for e-cooking that could be considered for policy making. On the other side, the H5 scenario proved to be technically feasible, especially with SHS150 and in sites with a solar resource higher than 1800 kWh/m/year. The choice of a smaller system with H5, SHS100, contributed to a critical reduction in the battery performance and average coverage, which could be clearly improved by increasing the PV capacity from 100 W to 150 W. Finally, the H8 scenario showed that the was reached in most of the days no matter the SHS size, though the annual coverage of the electricity demand was still above a 50% in most of the regions.
4. Economic Cost of E-Cooking
The economic cost of e-cooking was described and compared with other traditional cooking methods. Table 3 depicts the for H2, H5, and H8 considering SHS100 and SHS150, compared with cooking with wood, charcoal, and LPG. Regarding the e-cooking , the amount of meals served by the SHS influenced the cost to range from EUR 0.023 to 0.080/person/day for H8 and H2 scenarios, respectively, considering a 100% e-cooking coverage.
E-cooking LCOC was substantially lower than that of LPG cooking (€0.12–0.36/person/day) [11]. On the other side, cooking with wood and charcoal presented a wide dispersion of values for wood (€0.02–0.48/person/day) and charcoal (€0.02–0.39/person/day). Thus, the for H5 and H8 €0.023–0.036/person/day were equivalent to the low range interval for wood and charcoal and were definitely lower than the high range of cost of biomass fuels (€0.39–0.48/person/day).
The Table 3 results were calculated assuming a 100% e-cooking coverage, which, as shown in Figure 6 and Figure A1, is not always true, especially with the H5 and H8 consumption scenarios. Thus, LCOC was recalculated spatially taking into account the real coverage in each pixel as well as the PV module degradation (Figure 7). A PV degradation of 2.5% was assumed in the first year and 0.6%/year along the 20 year period [59,60] considering an initial PR of 0.75.
Figure 7 shows that PV size does not influence LCOC for H2, valued at EUR 0.08/person/day. Despite the fact that H5 and H8 coverage was lower than that for H2—indeed not all the household necessities were covered and was frequently reached as seen in Section 3—the energy exploitation was higher, leading to a remarkable LCOC reduction, with values ranging from EUR 0.04/person/day for SHS100 to EUR 0.02/person/day for H8 with SHS150. The LCOC values of H5 and H8 were equivalent to the low range of cooking with wood and charcoal of EUR 0.02/person/day. However, while the coverage with wood and charcoal depends on the availability of the fuel, achieving such LCOC values with high coverage and high battery performance is limited to regions with 2600 kWh/m for H5 with SHS150, and regions with 2700 kWh/m for H8 with SHS150. In other regions, e-cooking should be coupled with other cooking technologies to fully supply all household necessities.
5. Environmental Impact of E-Cooking
The environmental impact of e-cooking with small SHS was evaluated and benchmarked against traditional cooking technologies based on wood and charcoal (with open-fire three stone and improved cook stoves) and an LPG burner considering the associated emissions along a 20 year period.
Previous results obtained in Antonanzas-Torres et al. (2021) [28] regarding the environmental life cycle assessment (LCA) of SHS in SSA were used considering the PV module and lead-acid battery manufactured in China; transportation from factory to two sites in SSA considering train, ship, and truck; and SHS component lifespans of the PV module (20 years), cabling (20 years), PMW charge controller (5 years), and lead-acid battery (4 years). The GHG impact of components considered was 1090 kgCOeq./kW for the PV module, 1.7 kgCOeq./kg for the battery, 9.6 kgCOeq./item for the PMW charger, and 0.08 kgCOeq./m for the wire. Eventually, the GHG in [28] ranged between 0.155 to 0.255 kgCO/kWh depending on the solar irradiation conditions at the site, evaluated from 2400 to 1850 kWh/m·year (corresponding to maximum and minimum solar global horizontal irradiation conditions in SSA). Based on the similarity in SHS size and consumption curves between [28] and the H2 scenario, the GHG associated with the rice cooker was estimated through the GHG associated to the e-cooking energy expense. Eventually, the e-cooking GHG was estimated at 0.032–0.052 kgCOeq./kg for the maximum and minimum solar irradiation conditions in SSA, respectively.
5.1. Three-Stone and Improved Stoves and LPG Cookers
The environmental impact of cooking with three-stone and improved stoves is subjected to a wide range of uncertainties coming from the source of the wood and its sustainability, the efficiency of the stove, and cooking conditions [55]. It was assumed that wood was from unsustainable forest collection and was without transportation impact. The GHG results by Hafner et al. (2020) [56] were considered regarding cooking rice with three-stone and improved stoves operated with wood, finding a GHG of 2.42–1.89 kgCOeq./kg, respectively.
Regarding charcoal’s GHG, the combination of charcoal production with GHG of 0.77–1.63 kgCOeq./kg·charcoal [57] and combustion with GHG of 2.16–2.57 kgCOeq./kg·char-coal [55] led to GHG of 2.93–4.2 kgCOeq./kg·charcoal. Considering wood and charcoal heat values of 15–20 MJ/kg and 27–30 MJ/kg, respectively, and based on [56], the GHG of three-stone and improved stoves using charcoal was estimated at 2.52–3.6 kgCOeq./kg and 1.95–2.8 kgCOeq./kg, respectively.
Regarding LPG, GHG values of 2.90 kgCOeq./kg.LGP [26] and 0.173 kg.LPG/kg [61] were described in literature. Thus, a GHG value of 0.502 kgCOeq./kg was assumed.
The impact of cooking porridge was estimated at 0.496 kg·charcoal/kg·meal with an improved stove and charcoal [58], which is equivalent to 1.45–2.08 kgCO/kg·meal. Thus, considering the energy rate of 0.74 (energy to cook porridge to rice), the GHG emissions for porridge were estimated for the other traditional cooking techniques.
5.2. Environmental Benchmark Remarks
Table 4 summarizes the GHG emissions by cooking technology and staple food. E-cooking with SHS achieved strikingly lower GHG values (0.052–0.066 ) than combustion-based cooking methods: three-stone and improved stoves operated with wood and charcoal and also LPG.
6. Discussion
The technical feasibility of e-cooking with small SHS was spatially evaluated in SSA for different choices of staple foods (rice and porridge) and cooking devices (rice cooker and slow cooker). E-cooking needs for H2 were fulfilled in most regions with a coverage greater than 95% of the days with PV generators of 100–150 W and a lead-acid battery of 100 Ah (C10). Regarding the H5 and H8 scenarios, the size of the PV generator, the solar resources available, and the annual PR were identified as critical factors for e-cooking coverage, showing a wide variability (from 0 to 90%) across SSA. Especially for H5 and H8, the user training for SHS design and operation seemed critical for selecting a PV module size appropriate to the solar resource at the site and achieving a PR as high as possible to maximize coverage and battery performance.
Attending to the environmental impact, the GHG emissions were strikingly lower for e-cooking than for any of the traditional cooking technologies in SSA: 0.032–0.052 kgCOeq./kg·meal compared to 1.89–3.6 kgCOeq./kg·meal of using wood or charcoal. Besides, notorious benefits are also expected regarding health problems associated to smoke from cooking, which are especially severe using wood and charcoal indoors, and regarding the transportation of these fuels, which are frequently collected and transported using human force only. Furthermore, the remarkable forest loss observed in Africa during the last two decades [64] is partially explained by the increase in wood necessities for cooking; so, e-cooking could contribute to the subsequent mitigation.
Regarding the cost, the LCOC of e-cooking was analyzed and benchmarked with traditional cooking methods, which have a great variability depending on the source of fuel used. Considering a conservative battery lifespan of four years, the LCOC of e-cooking for H2 was equivalent to EUR 0.078–0.080/person/day, which is lower than LPG LCOC and within the range for wood and charcoal LCOCs. The LCOC for H5 and H8 were as low as EUR 0.02–0.04/person/day. However, since the coverage and battery performance for H5 and H8 were strikingly dependent on the solar resource, the SHS size, and the PR, large regions presented low e-cooking coverage in these scenarios. Therefore, e-cooking should be combined with traditional cooking to fulfill the household necessities. The influence of combining e-cooking and traditional cooking into the environmental impact and LCOC should be a matter of future investigations.
This study was performed considering market-available low-power DC cooking devices (with a maximum nameplate capacity of 100 W for the rice cooker) and a limited cooking capacity at 220 g of dry weight. Thus, since the cooking capacity is smaller than the household food requirements, it was considered using the same cooking device multiple times to cover the necessities, instead of using simultaneously multiple cooking devices that would increase the required power. This is particularly notorious for H5 and H8, in which somebody should be in charge of loading and unloading the cooking device every 42 and 35–40 min, respectively, for cooking rice or white maize porridge; although no attention is needed during the cooking process itself. This might represent a social factor for implementation. If further engineering development is performed to increase the pot size of these cooking devices, while keeping the same nameplate power, a larger amount of food could be cooked at a larger cooking time. This could improve acceptability for houses of more than two people avoiding user interaction for loading and unloading. Other social factors, such as the perception regarding the taste of the food cooked with e-cooking, time duration of cooking, and changes in the role of women, among others [18,21], should be a matter of future studies. Additionally, further research should analyze the micro-behavior of e-cooking devices into the SHS micro-grid performance and evaluate how a battery’s lifespan is affected by discharge scenarios different from the evening peak curve.
The potential use of e-cooking for semi-nomadic communities, whose electrification has been approached via SHS in some SSA countries such as Somalia [65], requires further study regarding the social and cultural factors influencing e-cooking adoption. Indeed, fuel stacking, a trend detected in most of the improved cooking programs, should be especially addressed for e-cooking with SHS.
Furthermore, this study analyzed two cooking devices and staple foods that can be prepared by boiling. Thus, it must be noted that in order to supply the wide diversity of cooking preparations of a household, e-cooking can be complemented with traditional cooking methods, for instance, for frying and roasting. Additionally, traditional cooking could serve as a back-up during periods with low solar resources or with a low , preventing deep battery discharges that would reduce the battery lifespan. In this line, basic training regarding how PV works and how to interpret would lead to a more “smart” use of e-cooking. It is noticeable that some PMW charge regulators in the market do not block the battery unloading under BMDP values, which makes interpretation of critical to prevent striking battery lifespan reductions. This is especially crucial with H5 and H8 scenarios, in which coverage is not as high as with H2. Basic day-ahead weather forecasts regarding the state of the sky, free, and online availability could serve as user decision tools for cooking manageability, anticipating the use of traditional cooking or e-cooking.
7. Conclusions
SSA faces a big challenge for achieving SDG7 especially related to clean cooking. Small SHS have experienced a wide expansion in off-grid areas of this region not only due to public policies but also due to individual unsubsidized installations. These systems are usually operated under the evening peak demand curve, displacing the energy consumption and PV generation profiles via battery storage. This implies that much of the potential PV yield is discarded when the battery is fully loaded, opening the path for e-cooking during the daytime. This study analyzed e-cooking with small SHS of 100–150 W and deep discharge lead-acid battery storage of 100 Ah (C10) and low-power market available DC cooking devices: rice cooker and slow cooker for satisfying the energy necessities (cooking and non-cooking) of H2, H5 and H8—houses of two, five, and eight people.
The results showed that the staple food necessities of H2 were covered 95–100% of the days across the region, even considering a PV module of 100 W. For the H5 and H8 scenarios, the PV generator size was critical for avoiding reaching the , especially in areas with < 2400 kWh/m. In sites with lower solar resources despite not covering the whole household necessities, the coverage remained above 50–70% in most of the region, showing that e-cooking could be combined with other cooking technologies. Furthermore, the e-cooking potential was analyzed considering a sensitivity study with two different PRs: 0.75 and 0.65, corresponding to a correctly installed and well-operated (PR = 0.75), and vice-versa. While the scenario of two people achieved a strikingly high coverage with PR 0.65, in scenarios of five and eight people, the coverage was significantly reduced, showing the importance of user training for maximizing the e-cooking potential.
Besides the technical potential of e-cooking, the economic cost and the environmental impact of e-cooking with other traditional cooking methods based on wood, charcoal, and LPG were benchmarked. The results showed that not only was e-cooking less expensive than LPG but it was also within the cost range of wood and charcoal, especially in sites with high solar resources and for the H5 and H8 scenarios. The of e-cooking ranged from EUR 0.023 to 0.080/person·day across the region. Regarding the environmental impact, the GHG of e-cooking (0.032–0.052 kgCOeq./kg·meal) was strikingly lower than traditional three-stone and improved cookstoves operated with wood and charcoal and also LPG cookers.
Overall, results provided technical, economic, and environmental insights regarding the potential of low-power e-cooking technologies, which can be easily integrated in small SHS. Future works should study onsite the impact of social factors for evaluating acceptability.
Author Contributions
Conceptualization, F.A.-T.; methodology, F.A.-T., software, F.A.-T. and R.U.; formal analysis, F.A.-T. and R.U.; data curation, F.A.-T.; writing—original draft preparation, F.A.-T. and R.U.; writing—review and editing, F.A.-T.; visualization, R.U.; supervision, J.B.-F. and C.A.C.G.; project administration, F.A.-T. All authors have read and agreed to the published version of the manuscript.
Funding
This research was funded by Grant IJC2018-037635-I funded by MCIN/AEI/ 10.13039/501100011033 and grant “Becas Iberoamérica Santander Investigación 2020/2021” awarded to Fernando Antonanzas-Torres, which enabled part of this research.
Institutional Review Board Statement
Not applicable.
Informed Consent Statement
Not applicable.
Conflicts of Interest
The authors declare no conflict of interest.
Nomenclature
The following abbreviations are used in this manuscript:
| Sustainable Development Goal | |
| Sub Saharan Africa | |
| Liquefied petroleum gas | |
| Levelized cost of electricity | |
| Solar home system | |
| Greenhouse gases emission factor | |
| Liquefied petroleum gas | |
| Pulse-width module | |
| Potential usable energy | |
| Hourly mean global irradiance on the plane of the module | |
| Performance ratio | |
| Nominal power | |
| Maximum power point tracking | |
| International Energy Agency | |
| State of the battery at time i | |
| Energy requirement | |
| Battery maximum discharge point | |
| Battery fully charged | |
| Annual global irradiation on the plane of the module | |
| House of 2 people | |
| House of 5 people | |
| House of 8 people | |
| Levelized cost of cooking |
Appendix A. Annual Demand Coverage
Figure A1.
Annual demand coverage: (a) with PR = 0.65 and (b) with PR = 0.75.

References
- IEA. International Energy Agency: Africa Energy Outlook 2019. 2019. Available online: https://www.iea.org/reports/africa-energy-outlook-2019 (accessed on 8 March 2021).
- Falchetta, G.; Pachauri, S.; Byers, E.; Dany, O.; Parkinson, S.C. Satellite observations reveal inequalities in the progress and effectiveness of recent electrification in Sub-Saharan Africa. One Earth 2020, 2, 364–379. [Google Scholar] [CrossRef]
- IEA. International Energy Agency: SDG7 Data and Projections Access to Clean Cooking. 2020. Available online: https://www.iea.org/reports/sdg7-data-and-projections/access-to-clean-cooking (accessed on 8 March 2021).
- Batchelor, S.; Brown, E.; Leary, J.; Scott, N.; Alsop, A.; Leach, M. Solar electric cooking in Africa: Where will the transition happen first? Energy Res. Soc. Sci. 2018, 40, 257–272. [Google Scholar] [CrossRef]
- Wassie, Y.T.; Rannestad, M.M.; Adaramola, M.S. Determinants of household energy choices in rural sub-Saharan Africa: An example from southern Ethiopia. Energy 2021, 221, 119785. [Google Scholar] [CrossRef]
- Dagnachew, A.G.; Hof, A.F.; Lucas, P.L.; Vuuren, D.P. Scenario analysis for promoting clean cooking in Sub-Saharan Africa: Costs and benefits. Energy 2020, 192, 116641. [Google Scholar] [CrossRef]
- Duguma, L.; Kamwilu, E.; Minang, P.A.; Nzyoka, J.; Muthee, K. Ecosystem-based approaches to bioenergy and the need for regenerative supply options for Africa. Sustainability 2020, 12, 8588. [Google Scholar] [CrossRef]
- Waswa, F.; MMcharo, M.; Mworia, M. Declining wood fuel and implications for household cooking and diets in Tigania Sub-county Kenya. Sci. Afr. 2020, 8, e00417. [Google Scholar] [CrossRef]
- Del Rio, D.F.; Lambe, F.; Roe, J.; Matin, N.; Makuch, K.E.; Osborne, M. Do we need better behaved cooks? Reviewing behavioural change strategies for improving the sustainability and effectiveness of cookstove programs. Energy Res. Soc. Sci. 2020, 70, 101788. [Google Scholar] [CrossRef]
- Lombardi, F.; Riva, F.; Sacchi, M.; Colombo, E. Enabling combined access to electricity and clean cooking with PV-microgrids: New evidences from a high-resolution model of cooking loads. Energy Sustain. Dev. 2019, 49, 78–88. [Google Scholar] [CrossRef]
- Couture, T.D.; Jacobs, D. Beyond Fire: How to Achieve Sustainable Cooking. 2019. Available online: https://www.worldfuturecouncil.org/beyond-fire/ (accessed on 23 March 2021).
- Aramesh, M.; Ghalebani, M.; Kasaeian, A.; Zamani, H.; Lorenzini, G.; Mahian, O.; Wongwises, S. A review of recent advances in solar cooking technology. Renew. Energy 2019, 140, 419–435. [Google Scholar] [CrossRef]
- Mekonnen, B.A.; Liyew, K.W.; Tigabu, M.T. Solar cooking in Ethiopia: Experimental testing and performance evaluation of SK14 solar cooker. Case Stud. Therm. Eng. 2020, 22, 100766. [Google Scholar] [CrossRef]
- Singh, O.K. Development of a solar cooking system suitable for indoor cooking and its exergy and enviroeconomic analyses. Sol. Energy 2021, 217, 223–234. [Google Scholar] [CrossRef]
- Vegadesan, E.; Senthil, R. Experimental investigation of the thermal performance of a box type solar cooker using a finned cooking vessel. Renew. Energy 2021, 171, 431–446. [Google Scholar] [CrossRef]
- Kebede, K.Y.; Mitsufuji, T.; Yemiru, B.S. Diffusion of solar cookers in Africa: Status and prospects. Int. J. Technol. Policy 2014, 10, 200–220. [Google Scholar] [CrossRef]
- Edmonds, I. Low cost realisation of a high temperature solar cooker. Renew. Energy 2018, 121, 94–101. [Google Scholar] [CrossRef]
- Iessa, L.; De Vries, Y.; Swinkels, C.; Smits, M.; Butijn, C. What’s cooking? Unverified assumptions, overlooking of local needs and pro-solution biases in the solar cooking literature. Energy Res. Soc. Sci. 2017, 28, 98–108. [Google Scholar] [CrossRef]
- Nkhonjera, L.; Bello-Ochende, T.; John, G.; King’ound, C.K. A review of thermal energy storage designs, heat storage materials and cooking performance of solar cookers with heat storage. Renew. Sustain. Energy Rev. 2017, 75, 157–167. [Google Scholar] [CrossRef]
- Watkins, T.; Arroyo, P.; Perry, R.; Wang, R.; Arriaga, O.; Fleming, M.; Sonte, D.I.; Sekerak, J.; Mast, D.; Hayes, N.; et al. Insulated solar electric cooking—Tomorrow’s healthy affordable stoves? Dev. Eng. 2017, 2, 47–52. [Google Scholar] [CrossRef]
- Brown, E.; Leary, J.; Davies, G.; Batchelor, S.; Scott, N. eCook: What behavioural challenges await this potentially transformative concept? Sustain. Energy Technol. Assess. 2017, 22, 106–115. [Google Scholar] [CrossRef] [Green Version]
- The World Bank Statistics—Electricity Production from Renewable Sources, Excluding Hydroelectric (kWh)—Sub-Saharan Africa. 2015. Available online: https://data.worldbank.org/indicator/EG.ELC.RNWX.KH?locations=ZG (accessed on 8 March 2021).
- Antonanzas-Torres, F.; Antonanzas, J.; Blanco-Fernandez, J. State of the art of mini grids for rural electrification in West Africa. Energies 2021, 14, 990. [Google Scholar] [CrossRef]
- Aemro, Y.B.; Moura, P.; de Almeida, A.T. Experimental evaluation of electric clean cooking options for rural areas of developing countries. Sustain. Energy Technol. Assess. 2020, 43, 100954. [Google Scholar]
- UNHCR. United Nations High Commissioner for Refugees—Cooking Options in Refugee Situations a Handbook of Experiences in Energy Conservation and Alternative Fuels. 2002. Available online: https://www.unhcr.org/protection/environment/406c368f2/handbook-experiences-energy-conservation-alternative-fuels-cooking-options.html (accessed on 18 March 2021).
- Energy Sector Management Assistance Program (ESMAP). Cooking with Electricity: A Cost Perspective; World Bank: Washington, DC, USA, 2020. [Google Scholar]
- Boamah, F.; Rothfub, E. ‘Practical recognition’ as a suitable pathway for researching just energy futures: Seeing like a ‘modern’ electricity user in Ghana. Energy Res. Soc. Sci. 2020, 60, 101324. [Google Scholar] [CrossRef]
- Antonanzas-Torres, F.; Antonanzas, J.; Blanco-Fernandez, J. Environmental life cycle impact of off-grid rural electrification with mini grids in West Africa. Sustain. Energy Technol. Assess. 2021, 47, 101471. [Google Scholar]
- Leach, M.; Oduro, R. Preliminary Design and Analysis of a Proposed Solar and Battery Electric Cooking Concept: Costs and Pricing; Institute of Development Studies: Falmer, UK, 2015. [Google Scholar] [CrossRef]
- Zubi, G.; Spertino, F.; Carvalho, M.; Adhikari, R.S.; Khati, T. Development and assessment of a solar home system to cover cooking and lighting needs in developing regions as a better alternative for existing practices. Sol. Energy 2017, 155, 7–17. [Google Scholar] [CrossRef]
- Batchelor, S.; Talukder, A.R.; Uddin, R.; Mondal, S.K.; Islam, S.; Redoy, R.K.; Hanlin, R.; Khan, M.R. Solar e-cooking: A proposition for solar home system integrated clean cooking. Energies 2018, 11, 2933. [Google Scholar] [CrossRef] [Green Version]
- Ekpa, O.; Palacios-Rojas, N.; Kruseman, G.; Fogliano, V.; Linnemann, A.R. Sub-Saharan African maize-based foods: Technological perspectives to increase the food and nutrition security impacts of maize breeding programmes. Glob. Food Secur. 2018, 17, 48–56. [Google Scholar] [CrossRef]
- Ranum, P.; Pena-Rosas, J.P.; Garcia-Casal, M.N. Global maize production, utilization, and consumption. Ann. N. Y. Acad. Sci. 2014, 1312, 105–112. [Google Scholar] [CrossRef] [PubMed]
- Kornher, L. Maize Markets in Eastern and Southern Africa (ESA) in the Context of Climate Change; The State of Agricultural Commodity Markets—FAO: Rome, Italy, 2018. [Google Scholar]
- FAO. Sorghum and Millets in Human Nutrition. 2021. Available online: http://www.fao.org/3/t0818e/T0818E0g.htm (accessed on 18 December 2020).
- U.S. Department of Agriculture. Sub-Saharan Africa Is Projected to Be the Leader in Global Rice Imports. 2017. Available online: hhttps://www.ers.usda.gov/amber-waves/2017/october/sub-saharan-africa-is-projected-to-be-the-leader-in-global-rice-imports/ (accessed on 18 December 2020).
- Coalition for African Rice Development. Madagascar’s Rice Statistics. 2021. Available online: https://riceforafrica.net/47-rice-statistics/325-madagascars-rice-statistics (accessed on 18 December 2020).
- Clasen, T.F. Scaling up Household Water Treatment among Low-Income Populations; World Health Organization: Geneve, Switerland, 2009. [Google Scholar]
- Antonanzas-Torres, F.; Antonanzas, J.; Blanco-Fernandez, J. Environmental impact of Solar Home Systems in Sub-Saharan Africa. Sustainability 2021, 13, 9708. [Google Scholar] [CrossRef]
- Photovoltaic Geographical Information System (PVGIS). 2021. Available online: https://re.jrc.ec.europa.eu/pvg_tools/es/#PVP (accessed on 1 August 2020).
- Muller, R.; Pfeifroth, U.; Trager-Chatterjee, C.; Roswitha, C.; Trentmann, J.; Hollmann, R. Surface Solar Radiation Data Set—Heliosat (SARAH), 1st ed.; Satellite Application Facility on Climate Monitoring: Darmstadt, Germany, 2015. [Google Scholar]
- Urraca, R.; Gracia Amillo, A.M.; Koubli, E.; Huld, T.; Trentmann, J.; Riihelä, A.; Lindfors, A.V.; Palmer, D.; Gottschalg, R.; Antonanzas-Torres, F. Extensive validation of CM SAF surface radiation products over Europe. Remote Sens. Environ. 2017, 199, 171–186. [Google Scholar] [CrossRef] [Green Version]
- Urraca, R.; Huld, T.; Gracia-Amillo, A.; Martinez-de-Pison, F.J.; Kaspar, F.; Sanz- Garcia, A. Evaluation of global horizontal irradiance estimates from ERA5 and COSMO-REA6 reanalyses using ground and satellite-based data. Sol. Energy 2018, 2018, 339–354. [Google Scholar] [CrossRef]
- Muneer, T. Solar radiation model for Europe. Build. Serv. Eng. Res. Technol. 1990, 1990, 153–163. [Google Scholar] [CrossRef]
- IEC. IEC61724-1:2017 Photovoltaic System Performance—Part 1: Monitoring; IEC: Geneva, Switzerland, 2017. [Google Scholar]
- Mayer, D.; Heidenreich, M. Performance analysis of stand alone PV systems from a rational use of energy point of view. In Proceedings of the 3rd World Conference on Photovoltaic Energv Conversion, Osaka, Japan, 11–18 May 2003. [Google Scholar]
- Cowan, B. Identification and Demonstration of Selected Energy Best Practices for Low Income Urban Communities in South Africa. Project Deliverable No. 17 of Alleviation of Poverty through the Provision of Local Energy Services APPLES; Project no. EIE 04-168; Intelligent Energy Europe: Geneva, Switzerland, 2008. [Google Scholar]
- Prinsloo, G.; Dobson, R.; Brent, A. Scoping exercise to determine load profile archetype reference shapes for solar co-generation models in isolated off-grid rural African villages. J. Energy S. Afr. 2016, 27, 11–27. [Google Scholar] [CrossRef] [Green Version]
- Guaita-Pradas, I.; Blasco-Ruiz, A. Analyzing profitability and discount rates for solar PV plants. A Spanish Case. Sustainability 2020, 12, 3157. [Google Scholar] [CrossRef] [Green Version]
- The World Bank. Inflation, Consumer Prices (Annual %)—Sub-Saharan Africa. 2020. Available online: https://data.worldbank.org/indicator/FP.CPI.TOTL.ZG?locations=ZG (accessed on 6 May 2020).
- Wernet, G.; Bauer, C.; Steubing, B.; Reinhard, J.; Moreno-Ruiz, E.; Weidema, B. The ecoinvent database version 3 (part I): Overview and methodology. Int. J. Life Cycle Assess. 2016, 21, 1218–1230. [Google Scholar] [CrossRef]
- Frischknecht, R.; Heath, G.; Raugei, M.; Sinha, P.; de Wild-Scholten, M.; Fthenakis, V.; Kim, H.C.; Alsema, E.; Held, M. Methodology Guidelines on Life Cycle Assessment of Photovoltaic Electricity, 3rd ed.; IEA PVPS Task 12, International Energy Agency Photovoltaic Power Systems Programme; Report IEA-PVPS T12-06:2016; National Renewable Energy Lab.: Golden, CO, USA, 2016; ISBN 978-3-906042-38-1. [Google Scholar]
- ISO 14040. Environmental Management—Life Cycle Assessment—Principles and Framework; International Organization for Standardization: Geneva, Switzerland, 2006. [Google Scholar]
- ISO 14044. Environmental Management—Life Cycle Assessment—Requirements and Guidelines; International Organization for Standardization: Geneva, Switzerland, 2006. [Google Scholar]
- Bhattachary, S.C.; Albina, D.O.; Salam, P.A. Emission factors of wood and charcoal-fired cookstoves. Biomass Bioenergy 2002, 23, 453–469. [Google Scholar] [CrossRef]
- Hafner, J.M.; Uckert, G.; Hoffmann, H.K.; Sosenstock, T.S.; Sieber, S.; Kimaro, A.A. Efficiency of three-stone fire and improved cooking stoves using on-farm and off-farm fuels in semi-arid Tanzania. Energy Sustain. Dev. 2020, 59, 199–207. [Google Scholar] [CrossRef]
- Pennise, D.M.; Smith, K.R.; Kithinji, J.P.; Rezende, M.E.; Raad, T.J.; Zhang, J.; Fan, C. Emissions of greenhouse gases and other airbone pollutants from charcoal making in Kenya and Brazil. J. Geophys. Res. 2001, 106, 24143–24155. [Google Scholar] [CrossRef] [Green Version]
- Njenja, M.; Mahmoud, Y.; Mendum, R.; Iiyama, M.; Jamnadass, R.; Roing de Nowina, K.; Sundberg, C. Quality of charcoal produced using micro gasification and how the new cook stove works in rural Kenya. Environ. Res. Lett. 2017, 12, 095001. [Google Scholar] [CrossRef]
- Trina. Trina Solar. 2020. Available online: https://www.trinasolar.com (accessed on 18 December 2020).
- Jinko. Jinko Solar. 2020. Available online: https://www.jinkosolar.com/ (accessed on 18 December 2020).
- Anoopa, P.S.; Dayana, S.; Nithya, N.S.; Prajitha, M.; Madhusoodanan, K. Energy Consumption Benchmark Studies on Parboiled Rice Cooking in Kerala; Energy Management Centre-Kerala: Thiruvananthapuram, India, 2005. [Google Scholar]
- Aberilla, J.M.; Gallego-Schmid, A.; Stamford, L.; Azapagic, A. Environmental sustainability of cooking fuels in remote communities: Life cycle and local impacts. Sci. Total Environ. 2020, 713, 136445. [Google Scholar] [CrossRef]
- Wilson, D.L.; Talanco, D.R.; Winsow, R.L.; Linares, X.; Gadgil, A.J. Avoided emissions of a fuel-efficient biomass cookstove dwarf embodied emissions. Dev. Eng. 2016, 1, 45–52. [Google Scholar] [CrossRef] [Green Version]
- EU Science Hub. Forest Loss Dataset. 2021. Available online: https://africa.gis-ninja.eu/dataset/forestlossid (accessed on 8 June 2021).
- UK AID. Somalia Off-Grid Solar (OGS) Strategy; UK Department for International Development: London, UK, 2019. [Google Scholar]
Figure 1.
Method considered.

Figure 2.
Low-intensity cooking technologies considered. (Left) rice cooker consisting of a main container for rice; a superior plate for vegetables, fish, or meat; and a sealed lid. (Right) slow cooker consisting of a main container and a lid.
Figure 2.
Low-intensity cooking technologies considered. (Left) rice cooker consisting of a main container for rice; a superior plate for vegetables, fish, or meat; and a sealed lid. (Right) slow cooker consisting of a main container and a lid.

Figure 3.
Flow diagram of SHS energy calculation algorithm.

Figure 4.
Non-cooking consumption curve (marked in green) based on Section 2.1 and potential e-cooking operational window (marked in orange) for H2, H5, and H8.
Figure 4.
Non-cooking consumption curve (marked in green) based on Section 2.1 and potential e-cooking operational window (marked in orange) for H2, H5, and H8.

Figure 5.
(a) Optimum fixed tilt angle. (b) Annual global irradiation on the optimum fixed tilt angle. Source: own elaboration with the PVGIS API [40].
Figure 5.
(a) Optimum fixed tilt angle. (b) Annual global irradiation on the optimum fixed tilt angle. Source: own elaboration with the PVGIS API [40].

Figure 6.
Percentage of days with the battery not empty: (a) with PR = 0.65 and (b) with PR = 0.75.

Figure 7.
LCOC for the selected scenarios calculated from the annual demand coverage over 20 years.


Table 1.
Specifications and cost of system components as per September 2021 (Spain).
| Device | Denomination | Characteristics | Cost |
|---|---|---|---|
| Rice cooker | Caredy rice cooker | DC 12 V, 100 W, 1.0 L | EUR 16–25 |
| Slow cooker | RoadPro RPSL-350V slow cooker | DC 12 V, 96 W, 1.42 L | EUR 30–32 |
| PV module 100 | Eco Worthy 100 | 100 Wp, 0.65 m | EUR 70 |
| PV module 150 | Ecosolar 150 | 150 Wp, 1.02 m | EUR 100 |
| Battery | Ultracell UCG 100-12 | 12 V 100 Ah (C10) | EUR 190 |
| PMW charge controller | JZK 20A 12V | 20 A, 12 V | EUR 11.5 |
Table 2.
Cooking specifications measured. The amount is expressed in dry weight of rice and white maize considering the maximum capacity of cooking devices.
Table 2.
Cooking specifications measured. The amount is expressed in dry weight of rice and white maize considering the maximum capacity of cooking devices.
| Device | Recipe | Amount | Cooking Time | Consumption |
|---|---|---|---|---|
| Rice cooker | Rice | 220 g | 42 min | 45 Wh |
| Rice cooker | Maize porridge | 220 g | 35–40 min | 38–43 Wh |
Table 3.
LCOC EUR/person/day) for selected scenarios considering 100% e-cooking coverage benchmarked against traditional cooking with three-stone and improved cookstoves with wood and charcoal and LPG.
Table 3.
LCOC EUR/person/day) for selected scenarios considering 100% e-cooking coverage benchmarked against traditional cooking with three-stone and improved cookstoves with wood and charcoal and LPG.
| Scenario | SHS100 (Rice Cooker) | SHS150 (Rice Cooker) | Wood | Charcoal | LPG |
|---|---|---|---|---|---|
| H2 | 0.077 | 0.080 | |||
| H5 | 0.035 | 0.036 | 0.02–0.48 [11] | 0.02–0.39 [11] | 0.12–0.36 [11] |
| H8 | 0.023 | 0.023 |
Table 4.
Benchmark of GHG emissions of different cooking methods. Note that staple foods were determined as a dry weight.
Table 4.
Benchmark of GHG emissions of different cooking methods. Note that staple foods were determined as a dry weight.
| Cooking Technology | Staple Food (kg) | GHG (kgCOeq./kg·meal) |
|---|---|---|
| Three-stone wood | Rice | 2.42 |
| Three-stone wood | Porridge | 1.79 |
| Three-stone charcoal | Rice | 2.52–3.6 |
| Three-stone charcoal | Porridge | 1.86–2.66 |
| Improved stove wood | Rice | 1.89 |
| Improved stove wood | Porridge | 1.39 |
| Improved stove charcoal | Rice | 1.95–2.8 |
| Improved stove charcoal | Porridge | 1.45–2.08 |
| LPG stove | Rice | 0.502 |
| LPG stove | Porridge | 0.353 |
| SHS e-cooking | Rice | 0.032–0.052 |
| SHS e-cooking | Porridge | 0.027–0.050 |
Publisher’s Note: MDPI stays neutral with regard to jurisdictional claims in published maps and institutional affiliations. |
© 2021 by the authors. Licensee MDPI, Basel, Switzerland. This article is an open access article distributed under the terms and conditions of the Creative Commons Attribution (CC BY) license (https://creativecommons.org/licenses/by/4.0/).
Share and Cite
MDPI and ACS Style
Antonanzas-Torres, F.; Urraca, R.; Guerrero, C.A.C.; Blanco-Fernandez, J. Solar E-Cooking with Low-Power Solar Home Systems for Sub-Saharan Africa. Sustainability 2021, 13, 12241. https://0-doi-org.brum.beds.ac.uk/10.3390/su132112241
AMA Style
Antonanzas-Torres F, Urraca R, Guerrero CAC, Blanco-Fernandez J. Solar E-Cooking with Low-Power Solar Home Systems for Sub-Saharan Africa. Sustainability. 2021; 13(21):12241. https://0-doi-org.brum.beds.ac.uk/10.3390/su132112241
Chicago/Turabian StyleAntonanzas-Torres, Fernando, Ruben Urraca, Camilo Andres Cortes Guerrero, and Julio Blanco-Fernandez. 2021. "Solar E-Cooking with Low-Power Solar Home Systems for Sub-Saharan Africa" Sustainability 13, no. 21: 12241. https://0-doi-org.brum.beds.ac.uk/10.3390/su132112241
Note that from the first issue of 2016, this journal uses article numbers instead of page numbers. See further details here.