Article

The Occurrence of Heavy Air Pollution during the COVID-19 Outbreak in Beijing, China: Roles of Emission Reduction, Meteorological Conditions, and Regional Transport

1
National Engineering Research Center of Urban Environmental Pollution Control, Beijing Municipal Research Institute of Environmental Protection, Beijing 100037, China
2
Beijing Vehicle Emission Management Center, Beijing 100176, China
3
College of Environmental Sciences and Engineering, North China Electric Power University, Beijing 102206, China
4
Institute of Transport Energy and Environment, Beijing Jiaotong University, Beijing 100044, China
5
State Environmental Protection Key Laboratory of Sources and Control of Air Pollution Complex, Beijing 100084, China
6
State Key Joint Laboratory of Environmental Simulation and Pollution Control, School of Environment, Tsinghua University, Beijing 100084, China
7
State Grid Integrated Energy Planning, Design and Research Institute, Beijing 100052, China
8
Meteorological Observation Center, China Meteorological Administration, Beijing 100081, China
9
CEPEC Talroad Technology CO., Ltd, Beijing 100085, China
10
Department of Chemical and Biochemical Engineering, Iowa Technology Institute, Center for Global and Regional Environmental Research, University of Iowa, Iowa City, IA 52242, USA
*
Author to whom correspondence should be addressed.
Sustainability 2021, 13(21), 12312; https://0-doi-org.brum.beds.ac.uk/10.3390/su132112312
Submission received: 12 October 2021 / Revised: 20 October 2021 / Accepted: 21 October 2021 / Published: 8 November 2021

Abstract

:
To prevent the spread of coronavirus disease (COVID-19) and mitigate the epidemic risk, strict lockdown measures were implemented in Beijing during the quarantine period, significantly reducing human activities. However, severe air pollution episodes occurred frequently in Beijing. To explore the occurrence of severe air pollution during the quarantine period, the impacts of emission reductions, meteorological conditions, and regional transport on heavy air pollution were individually evaluated using the Community Multiscale Air Quality (CMAQ) model. Observations showed that the more unfavorable meteorological conditions which occurred during the pandemic as compared to the corresponding 2019 levels, including higher temperature, relative humidity, and frequency of strong southerly winds, and lower HPBL, led to an increase in PM2.5 concentrations. The model results also showed that the meteorological conditions in February 2020 favored PM2.5 formation. The PM2.5 concentrations were mainly dominated by regional transport, which became more significant in the quarantine period than in 2019, suggesting the importance of joint control on regional sources for reducing heavy air pollution. This study highlights that, although the emissions in Beijing and surrounding regions were largely reduced during the quarantine period, severe air pollution in Beijing did not reduce due to the unfavorable meteorological conditions.

1. Introduction

In recent years, air pollution in Beijing has become a matter of public concern, due to high PM2.5 concentration, and frequent and severe heavy haze episodes [1,2]. The Beijing Municipal Government has implemented numerous air pollution control measures since 2013 [1,2,3], such as the “coal to gas” project, and the replacement of older vehicles. With the implementation of these measures, the air quality in Beijing has continuously improved, and the concentration of air pollutants has significantly reduced. For example, ambient PM2.5 concentrations have decreased by 58% from 2013 to 2020 [4].
However, even though the air pollutant emissions have largely been reduced, heavy air pollution events often occurred during this time period, for example, during the coronavirus disease (COVID-19) epidemic which broke out at the end of 2019 and continues to spread globally [5,6]. Beijing took decisive actions to stop the spread of COVID-19, including prohibiting social activities [5,7]. As a result, almost all outdoor human activities stopped, and industrial, transportation, and building activities were substantially reduced. However, the observed concentrations of fine particulate matter (PM2.5) in Beijing unexpectedly increased from 53 μg m−3 in February 2019 to 63 μg m−3 in February 2020. More importantly, severe air pollution episodes occurred during the COVID-19 period in Beijing, with the highest concentration of PM2.5 reaching 206 μg m−3. In contrast, the PM2.5 concentrations have reduced in China and Italy, with no significant change in Greece and most cities in the USA [8,9,10]. This raises interesting questions as to why pollution is increasing in Beijing but not others, and what the major cause of this heavy air pollution in Beijing where the air pollutant emissions experienced a large reduction is. The conclusions from this study are important, as they provide useful information for cities to implement air pollution control strategies when air pollutant emissions are rather low in the future.
Many studies have confirmed that air quality is generally affected by air pollutant emissions and meteorological conditions, such as wind direction (WD), temperature, and relative humidity (RH) [7,11,12,13]. However, in Beijing, the PM2.5 concentrations were significantly affected by the regional transport of air pollutants from the surrounding Hebei Province and Tianjin [11,14]. The official source apportionment of PM2.5 indicated that the regional transport of air pollutants in the surrounding regions contributed 28–36% to the total PM2.5 concentration in Beijing in 2014, and this value increased to 60% in the study by Dong et al. [7]. Currently, the individual impacts of emission reductions, meteorological conditions, and regional transport on air quality during the epidemic in Beijing remain unclear.
In the present study, the links between COVID-19 cases with variations in air pollution was investigated. Subsequently, in order to explore the causes of heavy air pollution during the COVID-19 lockdown, the impacts of emission reductions, meteorological conditions, and regional transport on heavy air pollution were separately evaluated. Firstly, the emission reduction during the epidemic was assessed, based on the emission inventory of February 2019 and 2020. Secondly, the impact of meteorological condition on PM2.5 air pollutants was conducted, based on the observations and the sensitivity simulations using the Community Multiscale Air Quality (CMAQ) model. Finally, sensitivity simulations were conducted to assess the impact of regional transport during the COVID-19 epidemic in Beijing.

2. Methods and Data

2.1. Emission Inventory

The air pollutant emission inventories in Beijing and surrounding regions (Tianjin and Hebei) were established individually for 2019 and 2020. The chemical species included SO2, NOx, VOCs, PM10, PM2.5, and NH3, and the sectors included power and heating, industrial, residential, fugitive dust, transportation, cooking, waste disposal, fireworks, biogenic, and agriculture. Emissions for each sector were estimated using Equation (1).
E i , j = A i × m ( X i , m × E F i , j , m × n ( C i , m , n × ( 1 η j , n ) ) )
where i represents the emission source, j represents air pollutants, m represents manufacturing technologies, n represents air pollution control technologies, A represents activity levels, X is the fraction of a specific manufacturing technology, EF is the unabated emission factor, C is the percentage of a specific pollution control technology, and η is the removal efficiency.
The emissions inventory was separately established for 2019 and 2020 in order to evaluate the emission reductions due to the COVID-19 lockdown. The detailed source of sectoral emissions and their activity data were shown in Supplementary Materials (Tables S1 and S2). According to the National Bureau of Statistics of China (NBS) and the Beijing Municipal Bureau Statistics (BMBS), gross domestic product (GDP) decreased by 6.6% annually, based on comparable prices in Q1-2020. The value added by primary industry was 1.27 billion Yuan, down by 22.9% year on year. According to the data published by AutoNavi Holdings Limited (available at report.amap.com (accessed on 20 March 2020) and BMBS, the passenger and freight traffic on highways was reduced by 52% and 32% in February 2020 as compared to that in 2019, respectively.

2.2. Air Quality and Meteorological Condition

In order to study the air quality in Beijing, hourly mass concentrations of air pollutants including SO2, NO2, PM10, and PM2.5 in February 2019 and 2020 were obtained from a publicly available website (http://beijingair.sinaapp.com/ (accessed on 20 March 2020). This website contains real-time air quality information, collected from 12 national observation stations at the Beijing Municipal Environmental Monitoring Center (BMEMC, http://www.bjmemc.com.cn/ (accessed on 20 March 2020).
The ground meteorological data, including temperature, RH, and WD, observed at the Beijing Capital International Airport (40.08° N, 116.58° E), were obtained from the China Meteorological Administration (http://www.cma.gov.cn/ (accessed on 20 March 2020). Historical height of planetary boundary layer (HPBL) data were obtained from the National Centers for Environmental Prediction (NCEP), the Final (FNL) Reanalysis Project implemented by the Earth System Research Laboratory Physical Sciences Division of the National Oceanic and Atmospheric Administration (NOAA), and the University of Colorado Cooperative Institute for Research in Environmental Sciences. The bilinear interpolation method was used to interpolate the HPBL values from the four closest grids. As the horizontal resolution of the HPBL data is 1 × 1°, the mean HPBL for Beijing was calculated using the data from the four closest grid points.

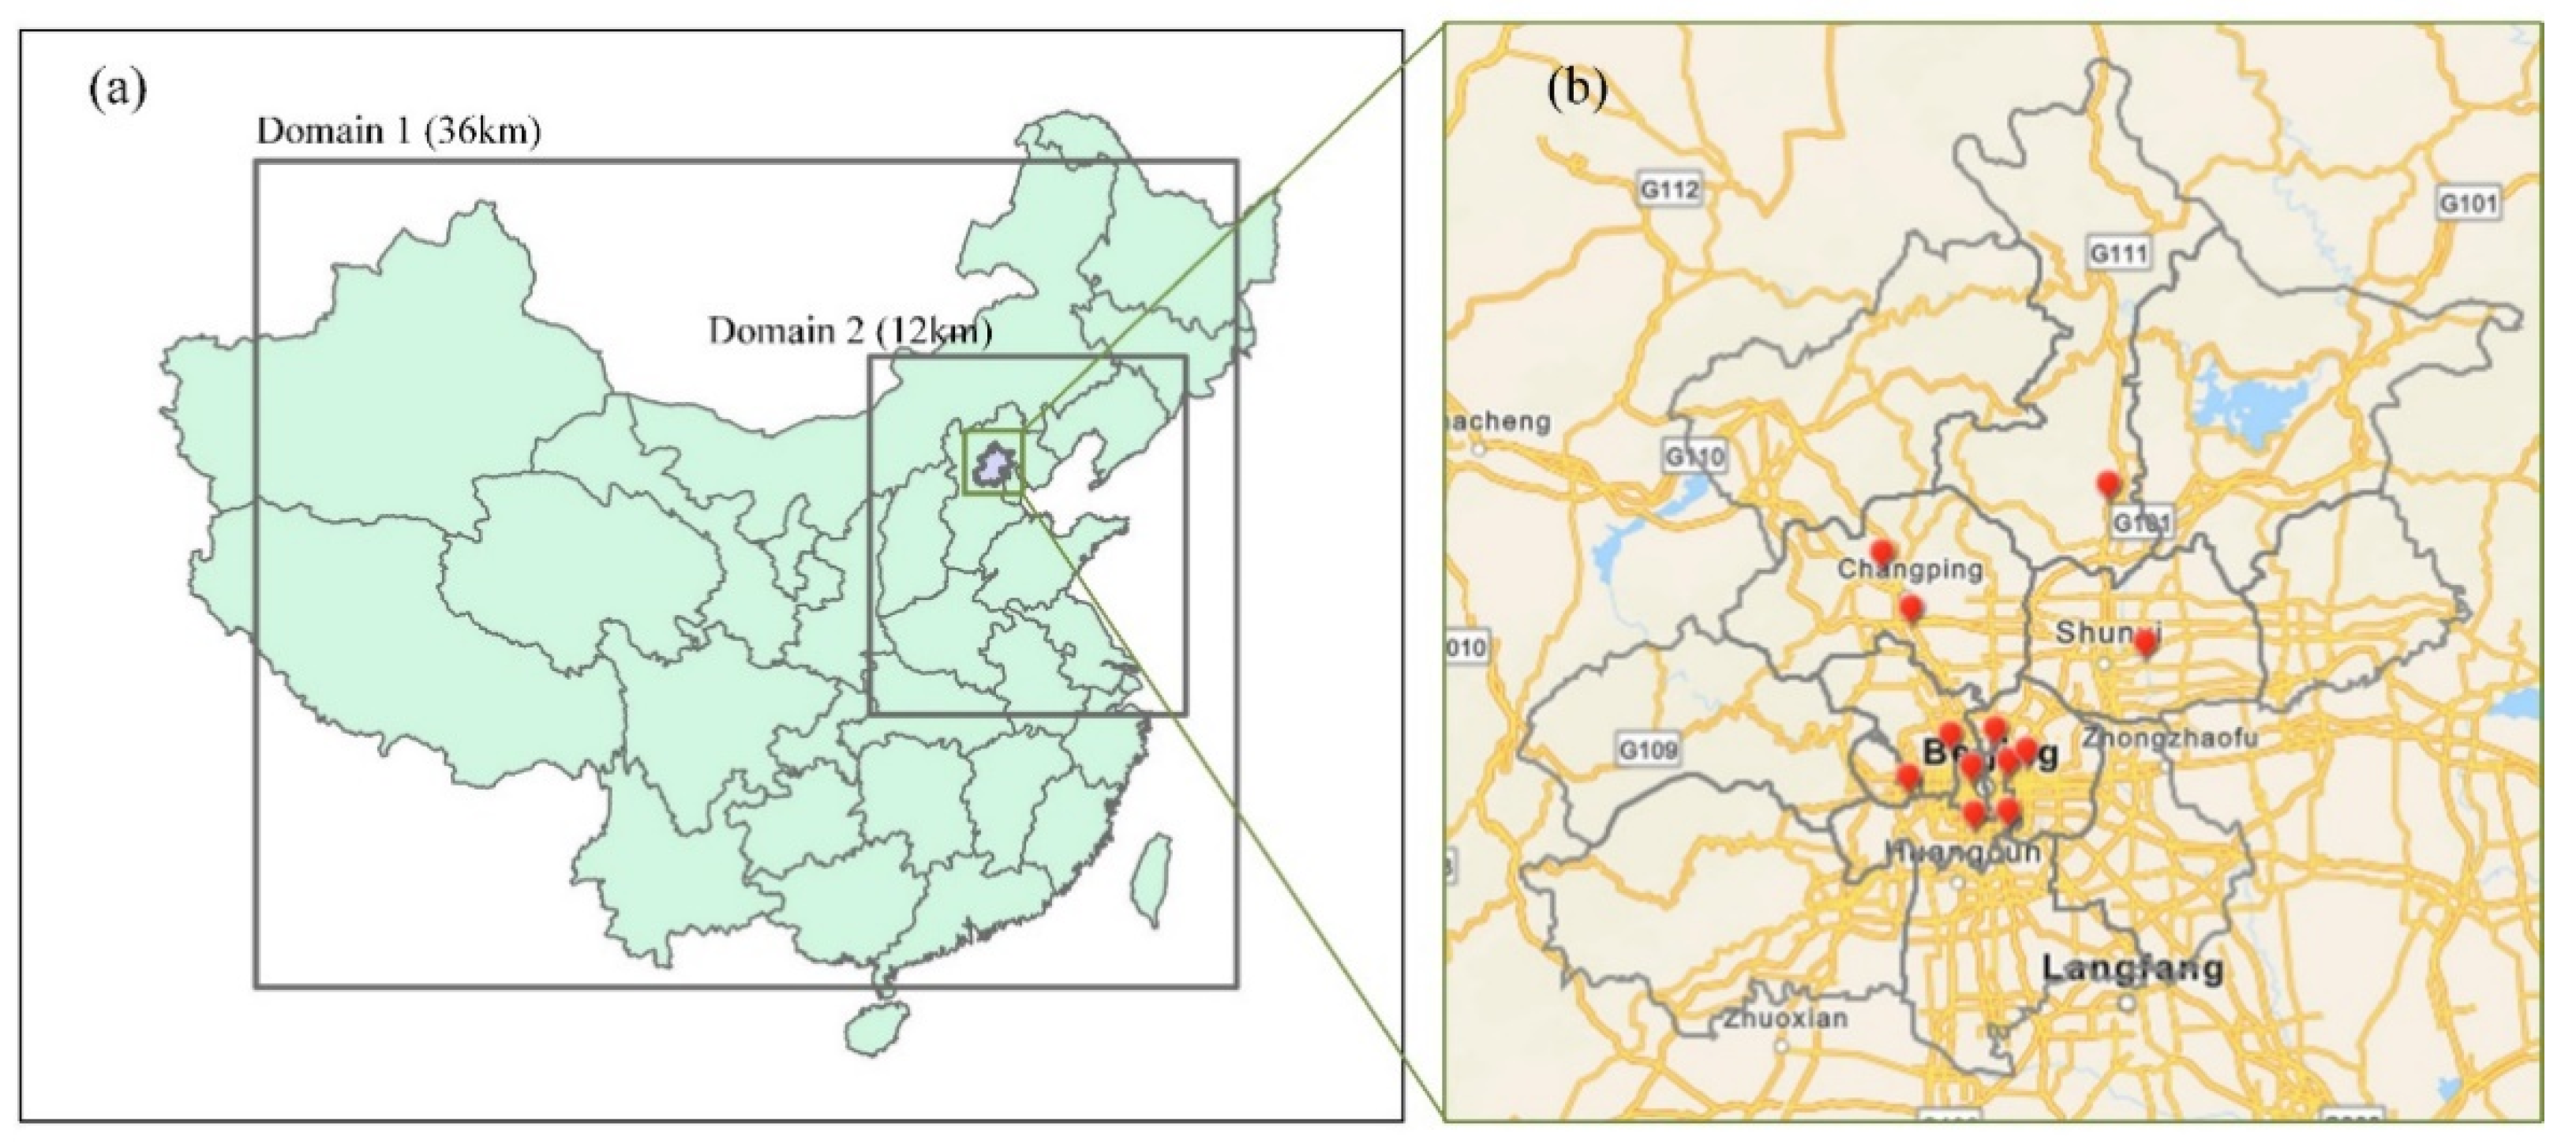
2.3. Model Configuration and Experiment Design

2.3.1. WRF-CMAQ

The WRF-CMAQ (Weather Research and Forecasting and the Community Multiscale Air Quality) model system was used to simulate different air pollutant concentrations, and to evaluate the impact of emission reductions and meteorological conditions on PM2.5 and its major components. The model configurations in this study are the same as in our previous studies [14,15]. The two-nested model domain was established with a spatial resolution of 36 × 36 km for the first domain (90 rows × 90 columns), and 12 × 12 km for the second domain (111 rows × 126 columns), as shown in Figure 1a. A total of 24 vertical layers from the surface pressure to 5000 Pa were used for this study. The initial and boundary meteorological conditions were derived from the NCEP FNL Operational Global Analysis data (available at http://rda.ucar.edu/datasets/ds083.2 (accessed on 20 March 2020)), with a horizontal resolution of 1 × 1° at intervals of 6 h. The main physical schemes of WRF included the Kain–Fritsch cumulus cloud parameterization, the RRTMG radiation mechanism, the asymmetric convective model for the planetary boundary layer, and the Pleim–Xiu land-surface model. The Meteorology Chemistry Interface Processor (MCIP) was used to process the meteorological data in a format required by the CMAQ model. Carbon Bond 6 and AERO7 were selected as the gas-phase and aerosol chemical mechanisms, respectively, in the CMAQ model.
The integrated source apportionment model (ISAM) module, coupled with the CMAQ model, was applied to distinguish the influences of local sources and regional transport. CMAQ-ISAM is an attached part of the CMAQ model, and uses the trace method to tag the emissions of different regions or sectors, as selected by the user. With the formation of PM2.5, the tag would flow into the final products, and was regarded as the contribution of different sources. The validation results (as shown in Supplementary Materials Table S3) suggest that the PM2.5 concentration is well reproduced and can be used for further analysis.
A scenario analysis was conducted to distinguish the impacts of meteorological conditions, emission reductions, and regional transport. The change in PM2.5 concentrations was attributed to four factors: local contributions due to emission variations (ΔLocalemis), regional transport due to emission variations (ΔRegionalemis), local contribution due to variations in meteorology (ΔLocalmet), and regional transport due to variations in meteorology (ΔRegionalmet). The E19M19 (both emissions and meteorology based on 2019 data) and E20M20 (both emissions and meteorology based on 2020 data) represent the baseline scenarios of 2019 and 2020, respectively. The differences in the contribution from local sources and regional transport between E20M20 and E19M20 (emissions based on 2019 data, but meteorology based on 2020 data) were considered as the change due to emission reductions, namely ΔLocalemis and ΔRegionalemis, respectively. Similarly, changes due to meteorological conditions were compared with those of E19M20 and E19M19.

2.3.2. HYSPLIT

The air-mass backward trajectories were calculated and clustered to track the transport pathways of the airflow arriving in Beijing (39.914° N, 116.405° E) using the HYSPLIT model. The 5-day backward trajectories started every hour each day, and were calculated at 50 m above ground level (AGL) using meteorological data (Global Data Assimilation System, ftp://arlftp.arlhq.noaa.gov/pub/archives/gdas1/ (accessed on 20 March 2020)) during the air pollution episodes. Therefore, a total of 24 trajectories were obtained per day, and trajectory cluster analysis was used to divide the trajectories into distinct clusters, using the TrajStat model.

2.4. Statistical Analysis

For exploratory analysis, we fitted generalized linear models to our data using COVID-19 cases as the outcomes, and the air pollutant concentrations and emissions as the parameters of interest, adding the corresponding population density values and mean annual earnings as confounding variables. The cumulative number of COVID-19 cases was retrieved from the Beijing Municipal Health Commission (BMHC). The number of deaths in Beijing (9) was too small to be statistically significant. The regional air pollutant concentrations were obtained from the Beijing Municipal Ecology and Environment Bureau. Population density (persons/km2) and mean annual earnings were obtained from the BMBS. We modeled the number of cases using Poisson distribution.
Methods for assessing the fit of the model included residual analyses, diagnostic tests, and information criterion statistics. The models were built using the MASS package (www.stats.ox.ac.uk/pub/MASS4/, (accessed on 20 March 2020)) in the R software. The comparison tables were generated using the Stargazer package (Hlavac, 2018). Statistical significance was defined as p ≤ 0.05.

3. Results and Discussion

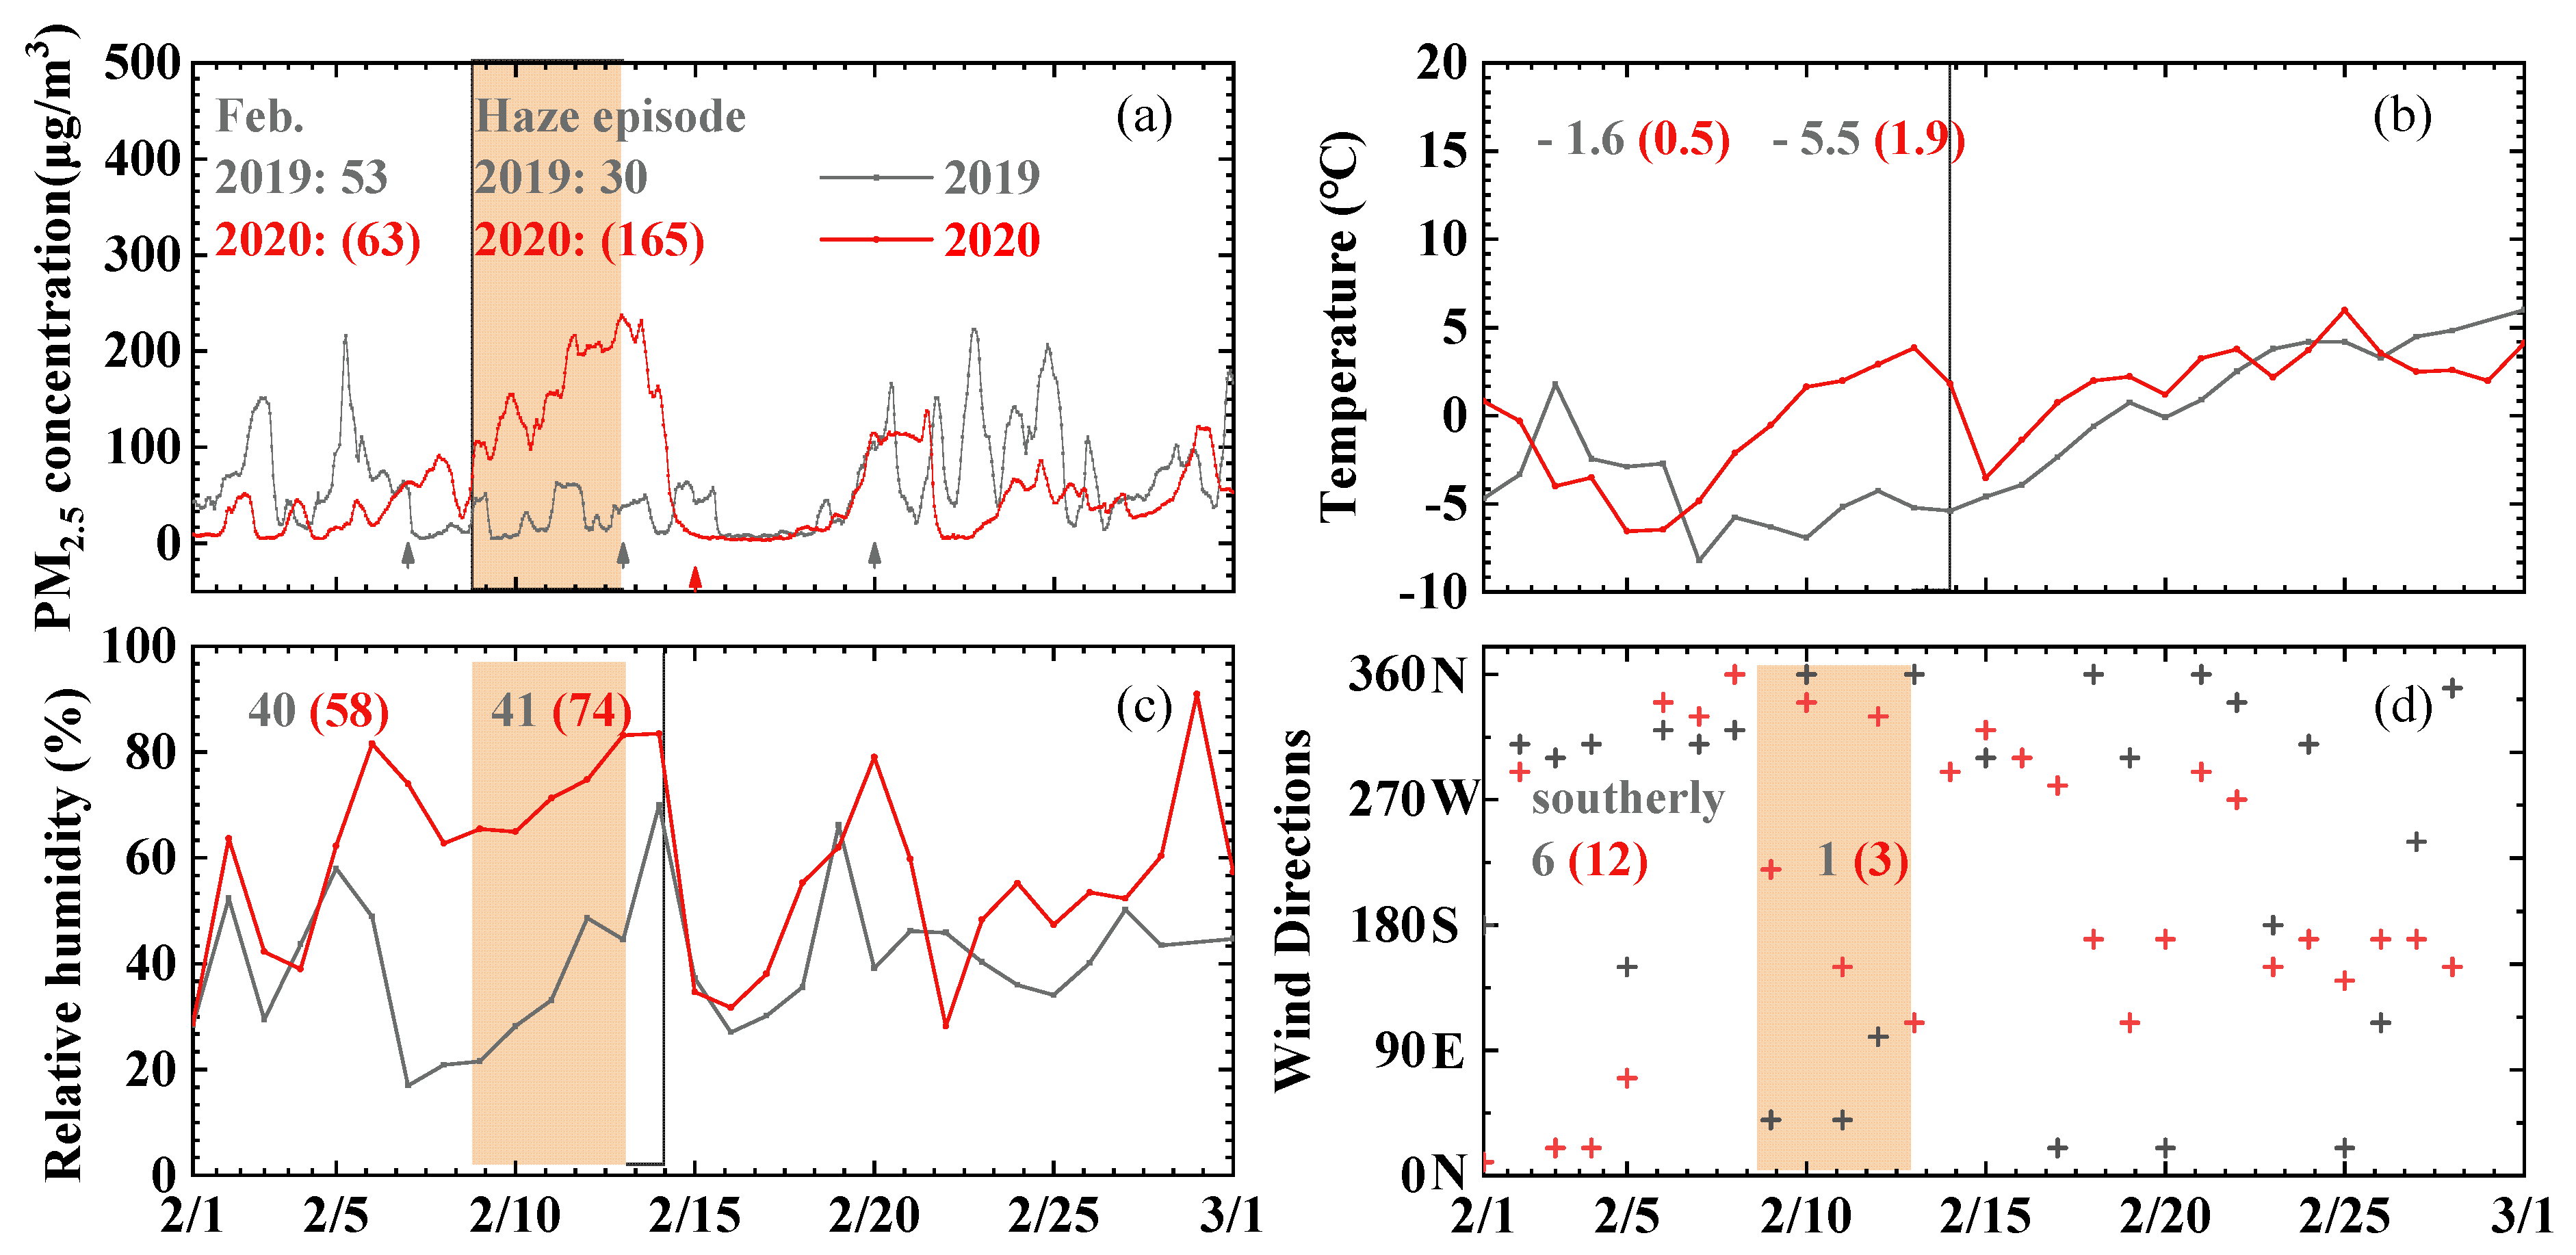
3.1. Links between COVID-19 with Air Pollutants

The associations between the cumulative number of COVID-19 cases and the concentrations of the four major air pollutants recorded in 2019, when no COVID-19 cases were reported, were analyzed. The total levels of SO2, NO2, and PM2.5 concentration were significant predictors of COVID-19 cases (p < 0.05), together with population density and annual earnings. This study provides the first evidence that COVID-19 cases were associated with regional variations in air pollution across Beijing.
We calculated the estimated regression coefficients of each variable and their respective infectivity rate ratios relative to the different air pollutants. Higher NO2 levels corresponded to an increase in COVID-19 cases. The NO2 levels had an infectivity rate ratio of 0.086, indicating that a 1 µg/m3 increase in NO2 concentration in 2019 was associated with 8.86% more cases in Beijing. Similar to NO2, the levels of PM2.5 showed an infectivity rate ratio of approximately 0.166. The incidence rate ratios of cases for total emissions and SO2 levels were less than 0, indicating that higher total emissions and SO2 levels led to lower number of COVID-19 cases. The number of cases was negatively associated with PM10 levels, which was not a significant predictor of the number of COVID-19 cases based on the 2019 air pollution data.

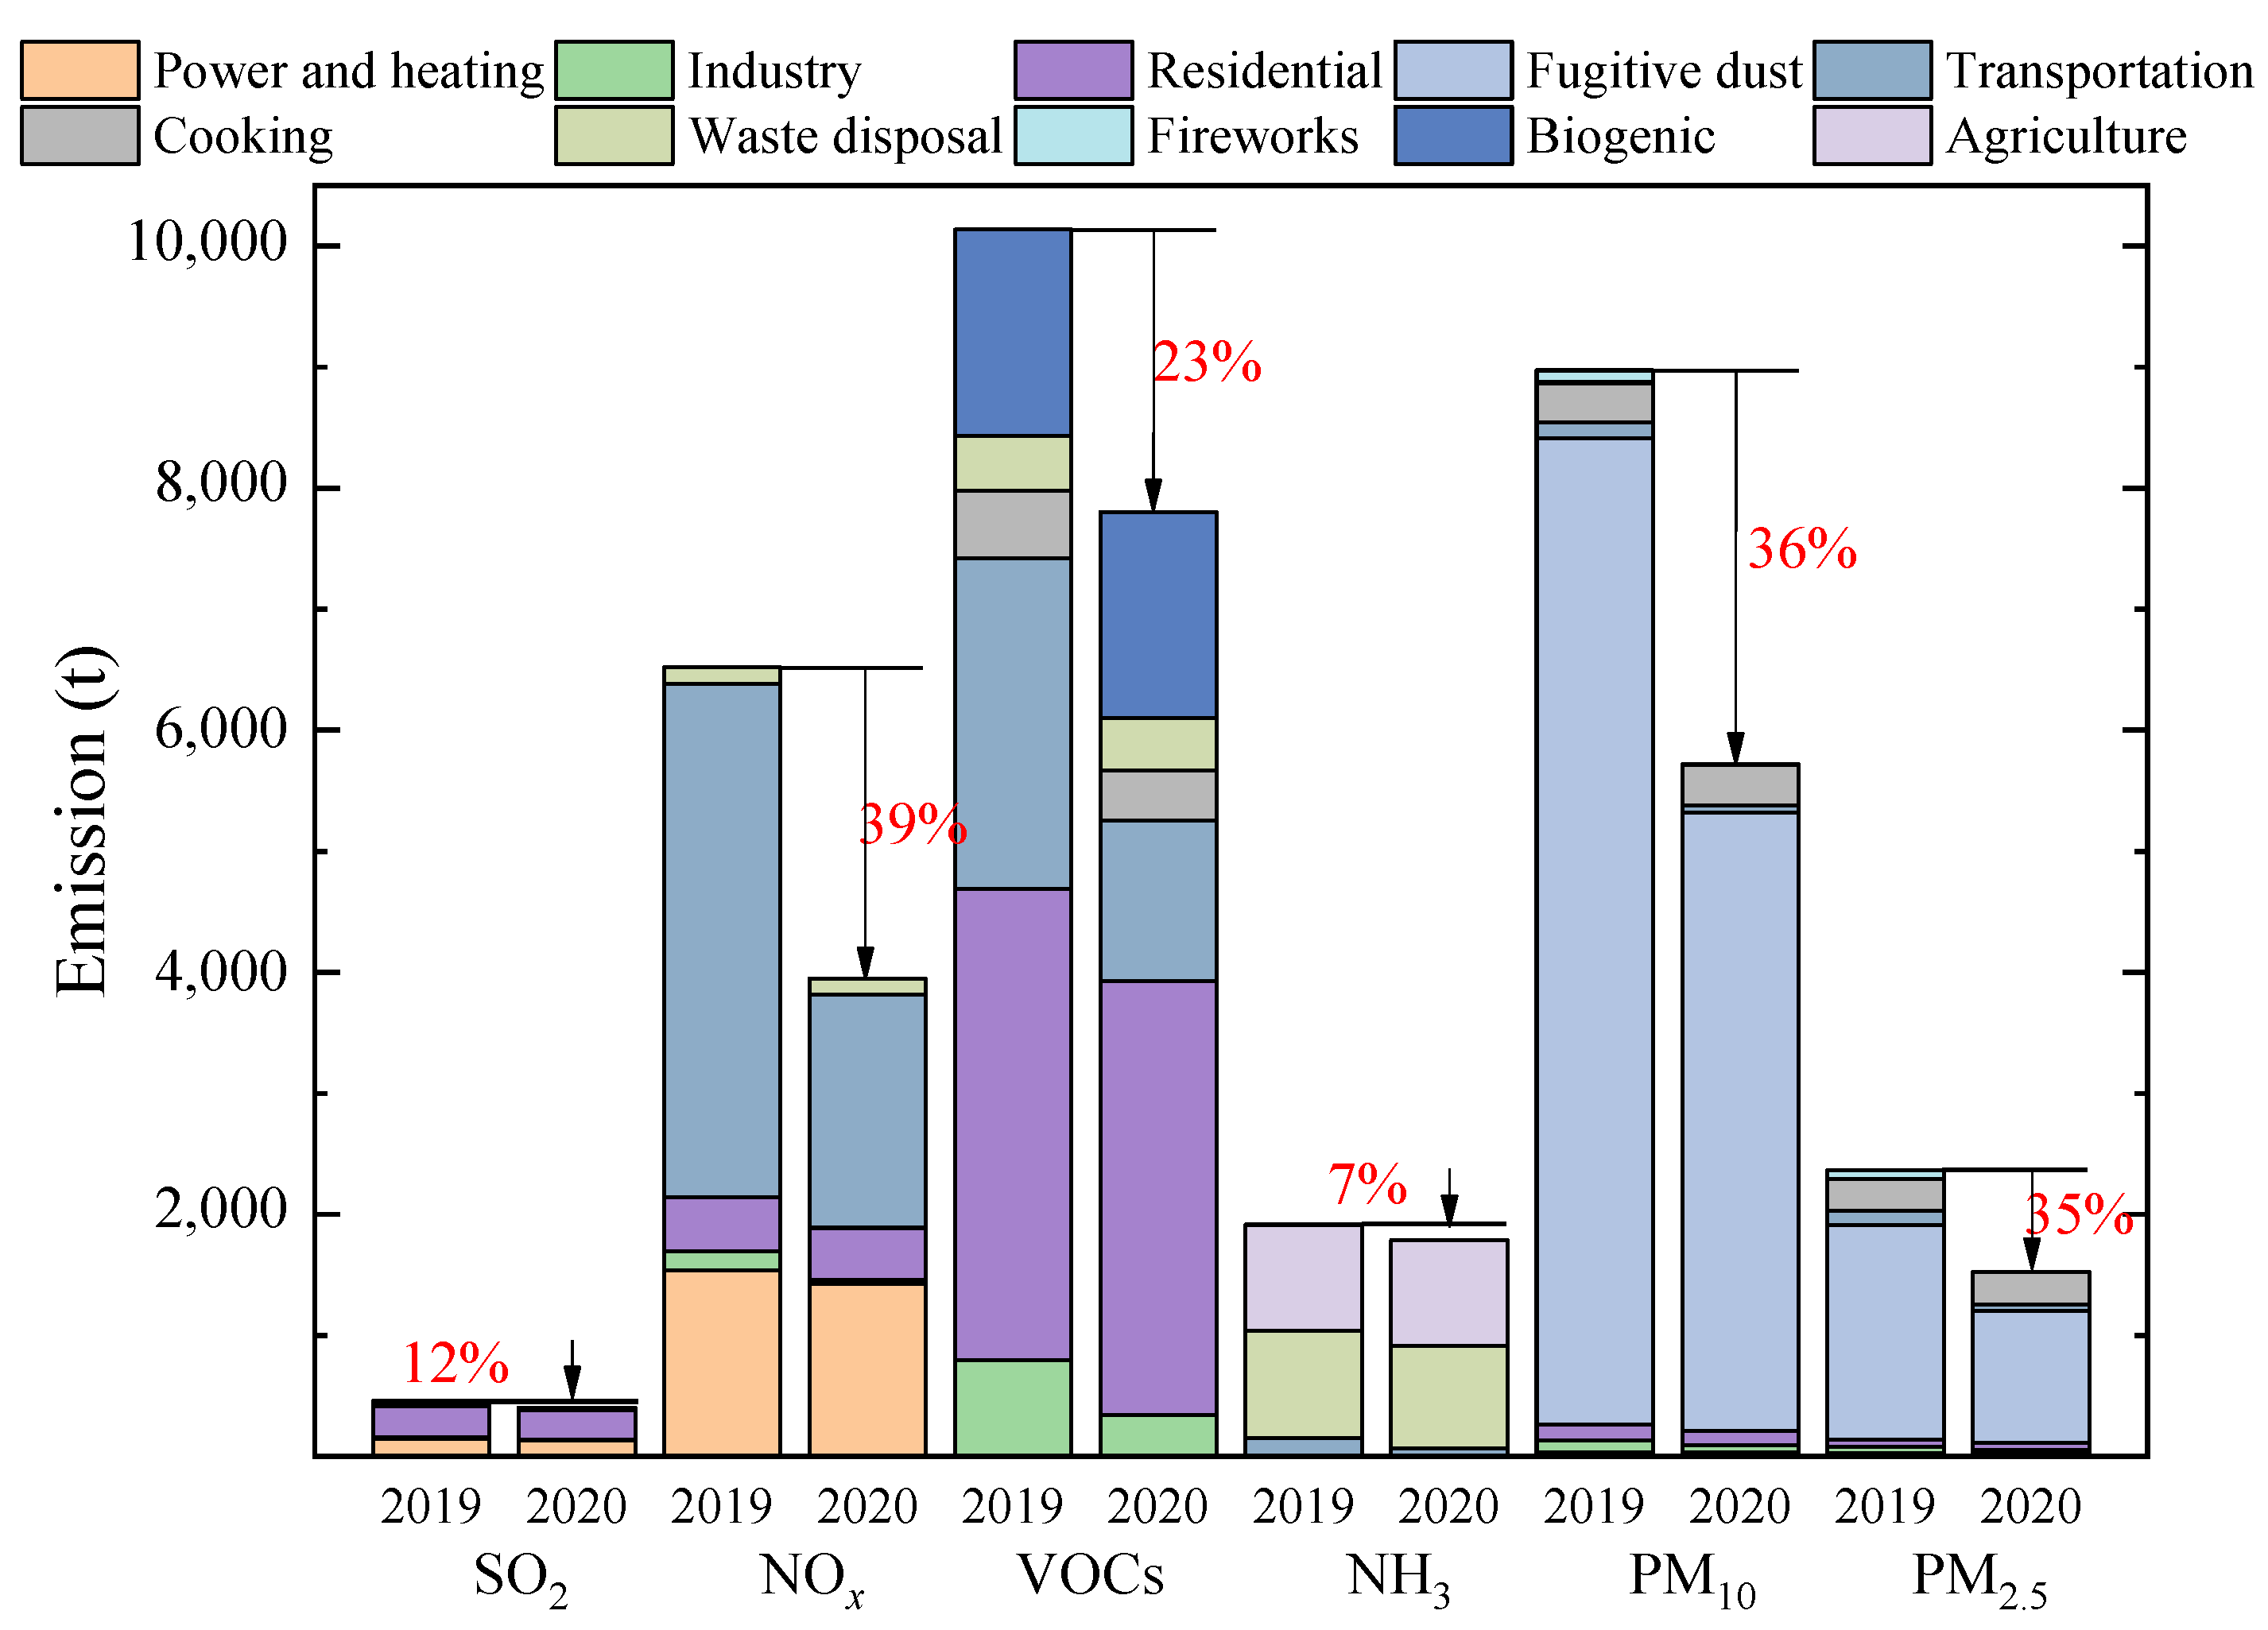
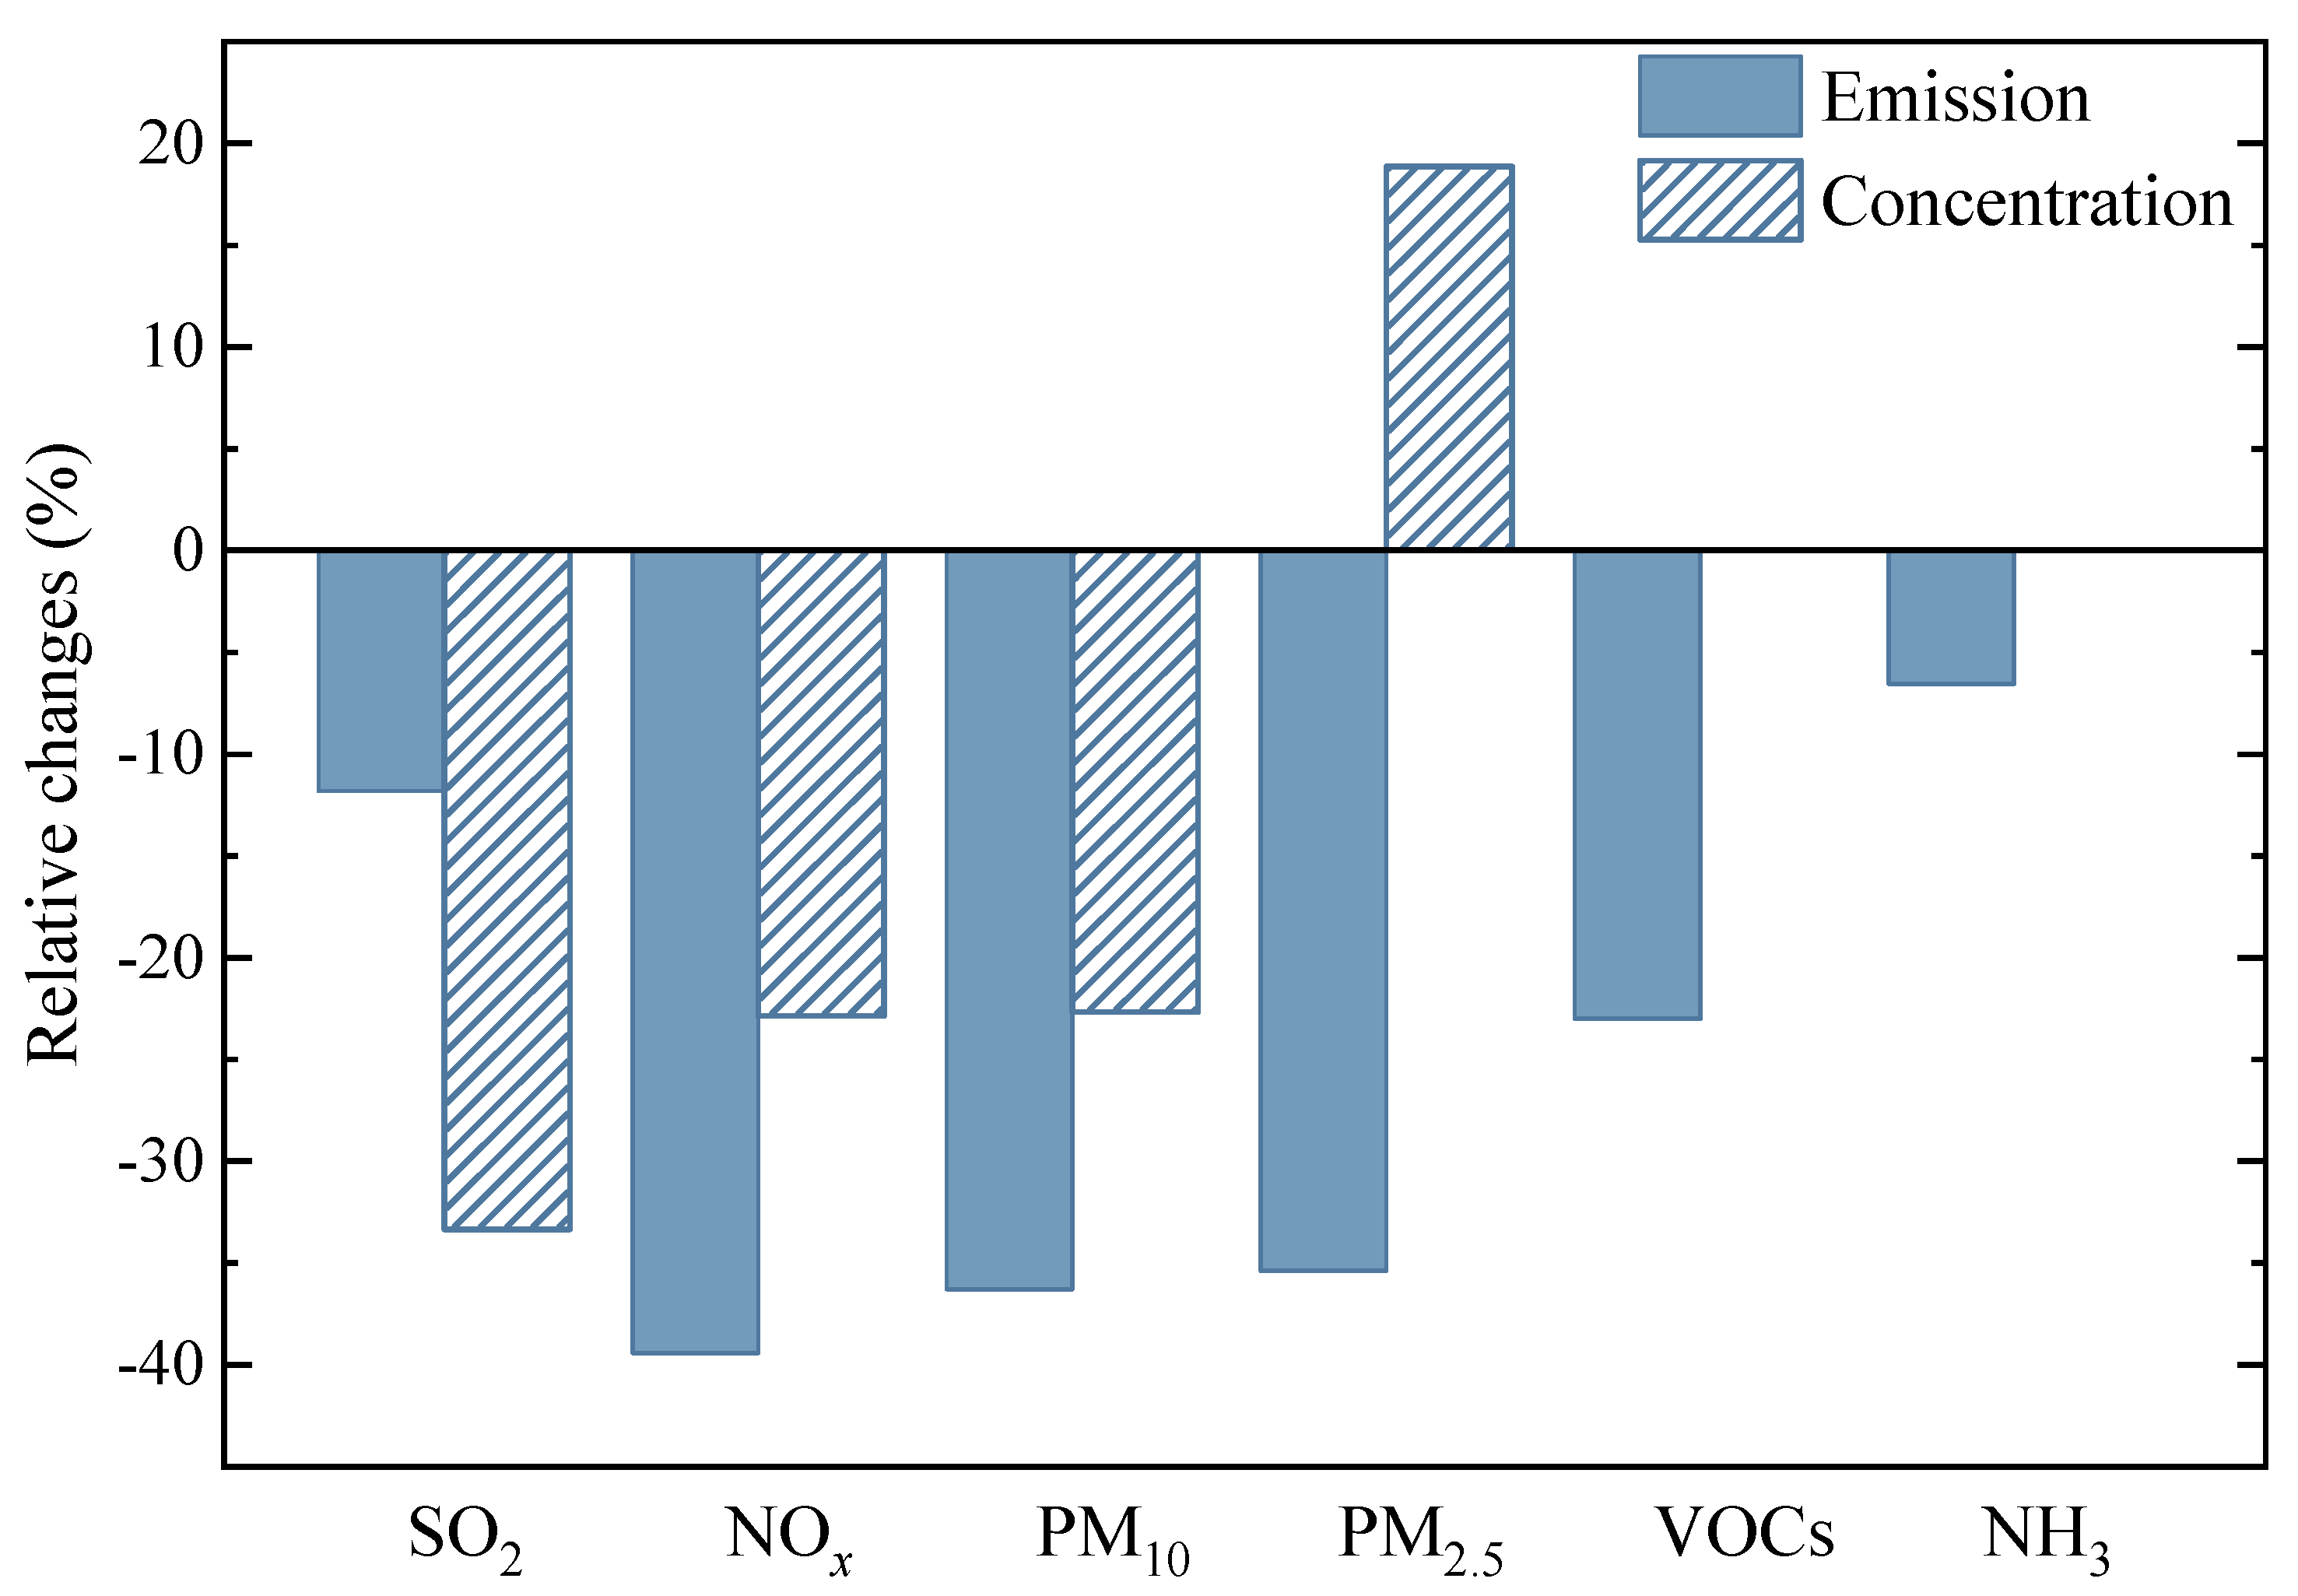
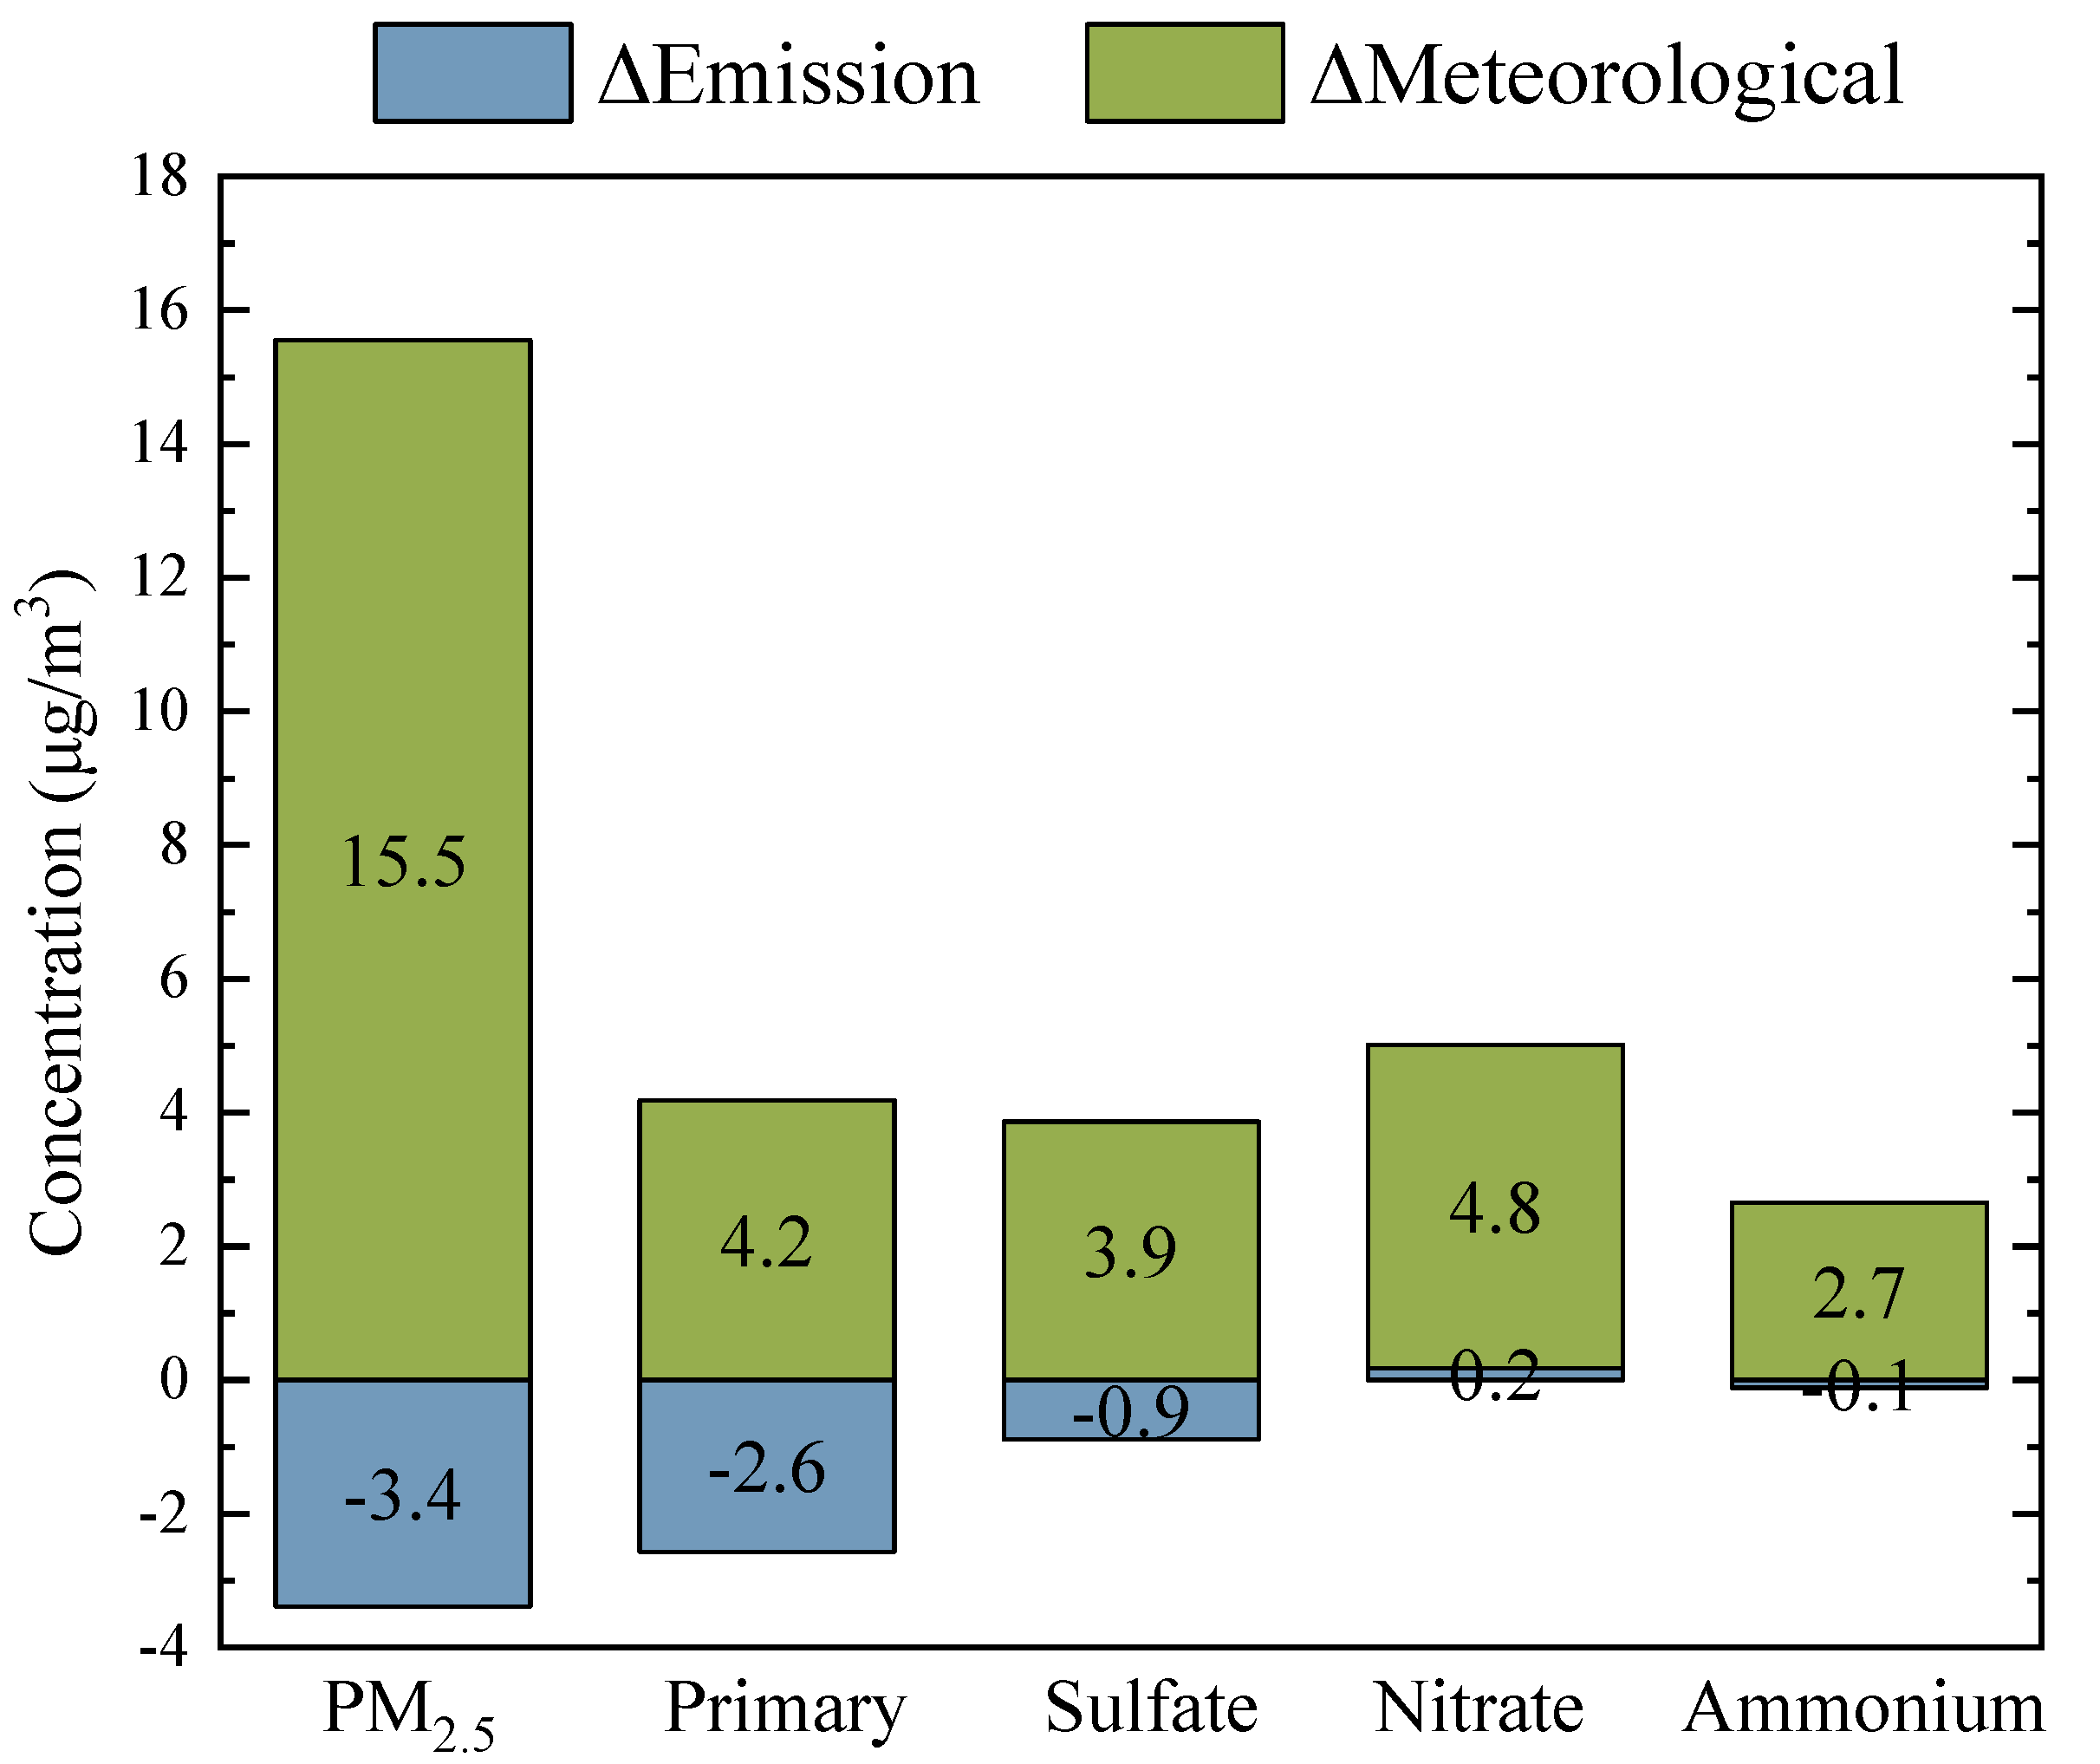
3.2. Emission Reductions of Air Pollutants during Quarantine Period

As shown in Figure 2, the emissions of air pollutants in February 2020 were estimated to be 405 t for SO2, 3951 t for NOx, 5718 t for PM10, 1530 t for PM2.5, 7805 t for volatile organic compounds (VOCs), and 1789 t for NH3. SO2 emissions from the residential, and power and heating sectors contributed an average of 60% and 33% of the total emissions, respectively. The transportation, power and heating, and residential sectors were the major sources of NOx emissions, accounting for an average of 49%, 36%, and 11%, respectively. The residential, biogenic, and transportation sectors had notable contributions to VOC emissions, accounting for an average of 46%, 22%, and 17%, respectively. NH3, which is mainly emitted from the agriculture and waste disposal sectors, accounted for an average of 49% and 47%, respectively. Fugitive dust was the major emitter of PM10 and PM2.5, with average proportions of 89% and 73%, respectively.
Air pollutant emissions in Beijing have significantly decreased during the COVID-19 lockdown. The emissions of SO2, NOx, VOCs, NH3, PM10, and PM2.5 during the quarantine period decreased by 12%, 39%, 23%, 7%, 36%, and 35%, as compared to the emissions in 2019, respectively. Over 94% of the PM10 and 81% of the PM2.5 reductions came from reductions in fugitive sources, including construction dust and road dust. According to a published news report (BMCHUD, 2021; DEBB, 2020), the emissions from construction dust decreased by 30% due to the suspension of construction during the epidemic. The PM10 and PM2.5 emissions from road dust decreased by 52% in the quarantine period, which was attributed to lower numbers of vehicles on roads.
The industrial, residential, and power and heating sectors showed the most notable effects on SO2 emission reductions, accounting for 24%, 24%, and 21% of the emission reductions, respectively. During the epidemic, as people no longer needed to go to work or to school, heating in office and school buildings was entirely shut, which reduced SO2 and NOx emissions by 5%. The reduction of NOx emissions from transportation played an important role during the quarantine period, and contributed 95% to the total reduction. According to the data published by AutoNavi Holdings Limited and BMBS, passenger and freight traffic on highways decreased by 52% and 32%, respectively, during the epidemic. As a result, the NOx emissions from vehicles were reduced by 60% of the transportation reduction. Approximately 24% of the NOx emission reductions were attributed to lower air and train traffic during the quarantine period. Transportation, industrial, and residential sectors were the greatest contributors to VOC emission reductions, accounting for 61%, 20%, and 13% of the total reduction, respectively. The VOC emission reductions in the residential sector were mainly attributed to the fall in demand for paint, due to the decrease in new constructions. The VOC emission reductions in the industrial sector were attributed to the decrease in the use of solvents for paints, coatings, and the chemical industry during the quarantine period. The details on the industrial emission reductions are shown in the Supporting Information. The reduction in transportation activities contributed to 63% of the total reduction in NH3 emissions (see Supplementary Materials Figure S1).

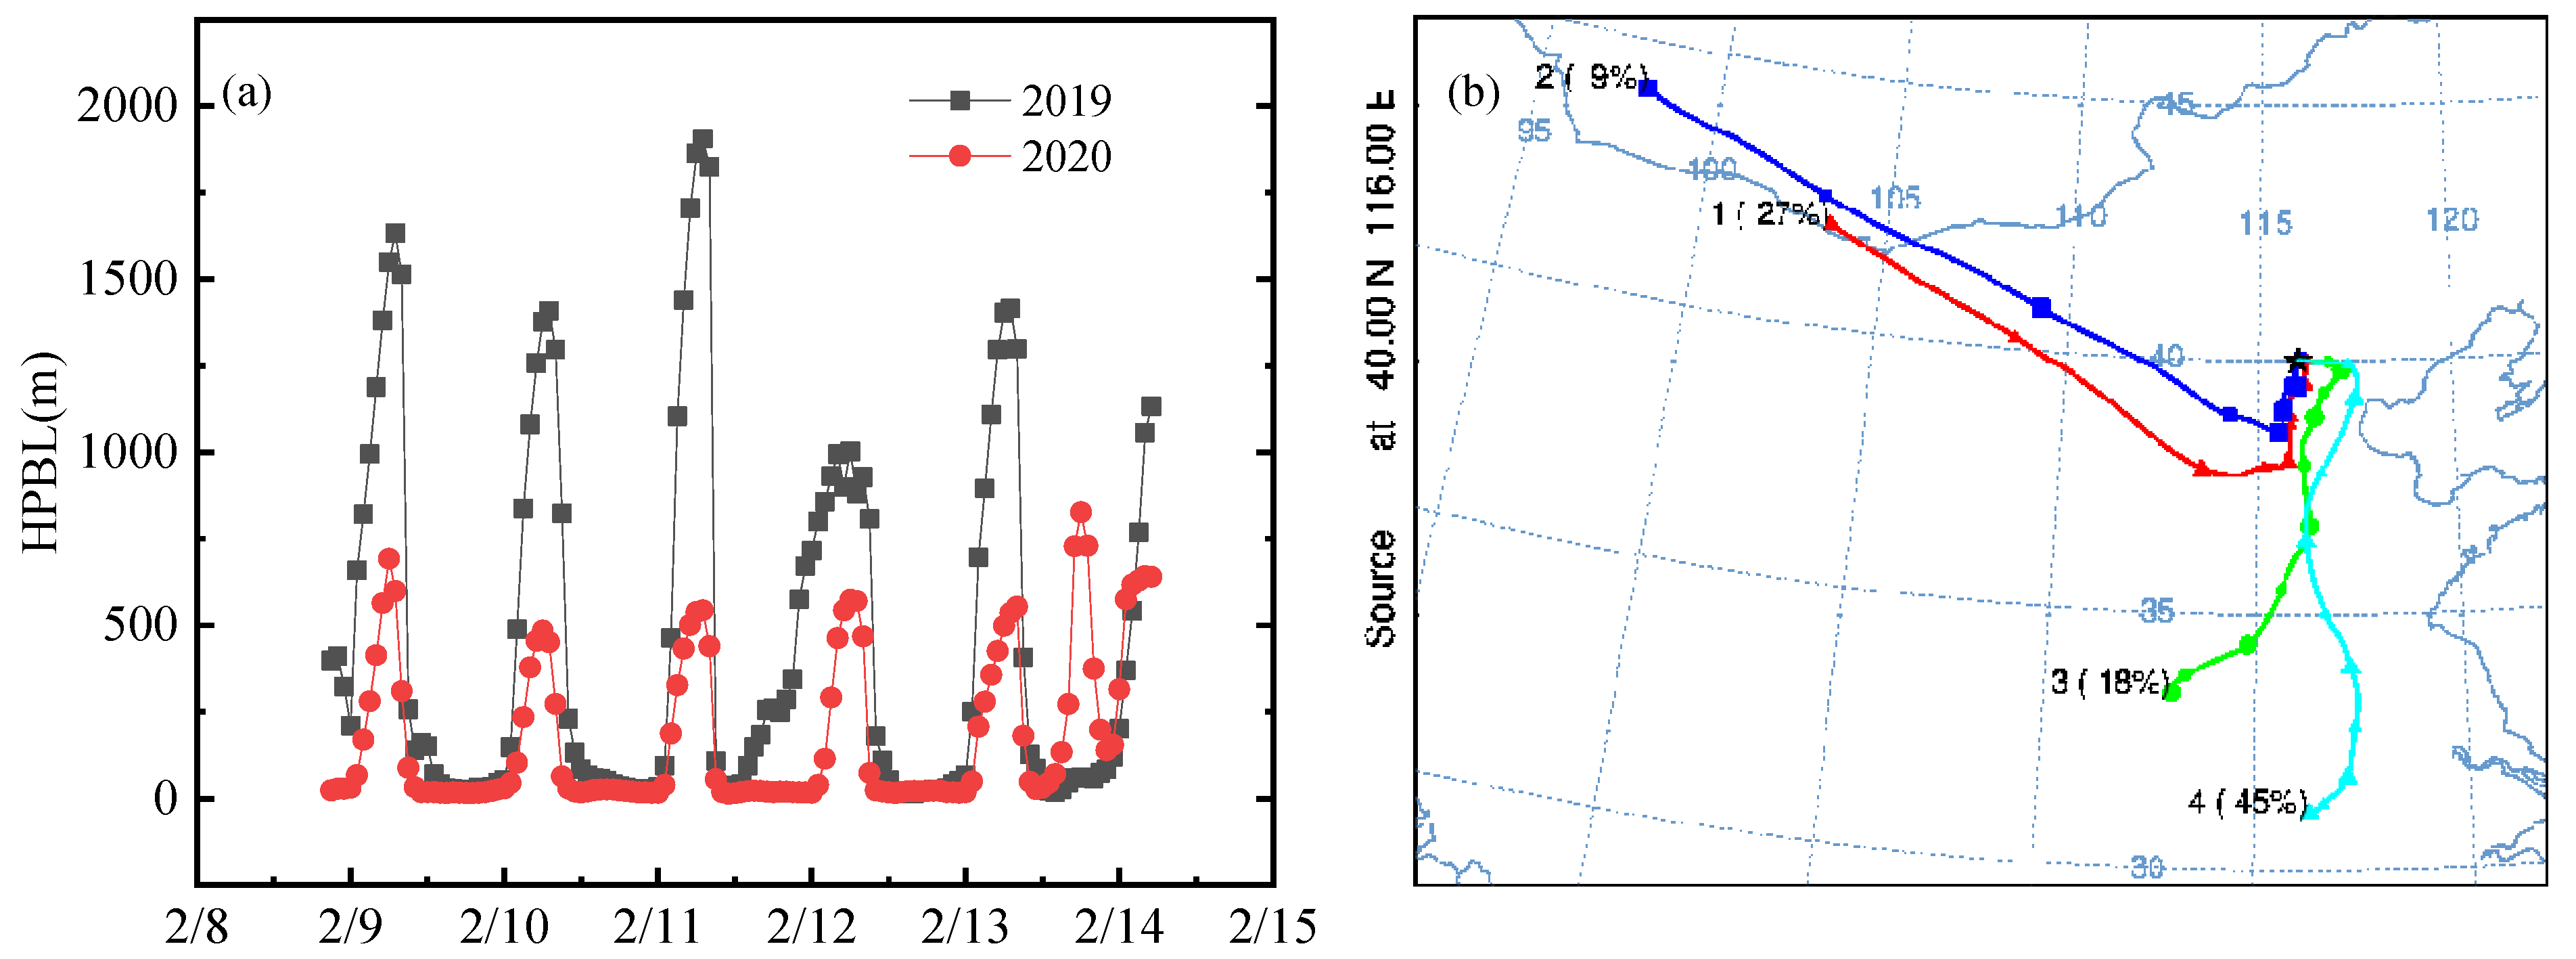
3.3. Impact of Meteorological Condition on PM2.5 Air Pollution

The rate of change in concentrations of SO2, NO2, PM10, and PM2.5, and in emissions of SO2, NOx, PM10, PM2.5, VOCs, and NH3 between the quarantine period and the 2019 levels are shown in Figure 3. The concentrations of PM2.5 increased during the quarantine period, compared to the 2019 levels, although both the primary PM2.5 and its precursor emissions decreased. This is because air pollutant concentrations are affected not only by emissions, but also by meteorological factors, regional transport, and chemical reactions [16].
Assessing the impact of emission reductions on PM2.5 concentrations can be complicated by the variability of meteorological conditions. The daily PM2.5 concentrations, temperature, RH, and WD are shown in Figure 4. It was observed that the PM2.5 concentrations slowly accumulated during the epidemic, followed by a rapid decrease, as determined by the episodic incursion of cold mid-latitude air (cold surges). Following Liu et al. [17], the occurrence of a cold surge was defined as a rapid decrease in surface RH and temperature, with an increase in surface pressure. One cold surge was identified in February 2020, whereas three were observed in 2019. This led to notable differences in the meteorological variables. Higher RH and temperature in February 2020 (58% and 0.5 °C for 2020 vs. 40% and −1.6 °C for 2019, respectively) facilitated the formation of secondary aerosols, thereby also contributing to the formation of PM2.5 [18,19]. Additionally, strong northerly winds are always associated with the arrival of cold surges [20]. Meteorological conditions in February 2020 were generally more favorable for PM2.5 formation than those in 2019, when there was a high frequency of strong southerly winds (12 days for 2020 vs. 6 days for 2019), which led to the regional transport of pollutants. This can be explained by the HYSPLIT 5-day back trajectory analysis of mass air movements in the haze episode shown in Figure 5. On heavy haze days, more than half of the air trajectories (63%) arriving at the site came from the south, a region with many high-emission cities. Approximately 36% of the trajectories were from the northwest. During this period, air movements caused transboundary transportation of pollutants such as NH3, SO2, NO2 precursors, and primary PM from southern regions to Beijing, elevating pollutant concentrations.
Finally, PM2.5 concentrations were negatively correlated with HPBL. The HPBL has a diurnal cycle, with high values in the morning and low values in the afternoon. The HPBL of haze episodes that appeared from February 8 to 14, 2020, was lower than the 2019 levels, as shown in Figure 5, which prevented particles from crossing the PBL to the troposphere [13,21,22].
The model performance also indicated that the meteorological conditions in February 2020 benefitted the formation of PM2.5, resulting from a positive change in meteorology by approximately 15.6 μg/m3 on average, as shown in Figure 6. On excluding the meteorological effect, the non-meteorological effects (namely reduced activities) decreased the PM2.5 concentration by 3.4 μg/m3. These results indicated that the strict restrictions on human activities significantly decreased PM2.5 concentrations. However, the unfavorable meteorological conditions substantially increased PM2.5, which offset the effect of emission reductions, and caused PM2.5 pollution. The unfavorable meteorological conditions dominated the changes in PM2.5, accounting for 82% of the model variation, and the emission reductions due to lockdown had limited effects (18%). Moreover, the impact of variations in meteorological conditions on SNA (sulfate, nitrate, and ammonium) was higher than that of primary particles, which indicates that the meteorological conditions during the epidemic favored the formation of secondary PM2.5. These results are consistent with the data on meteorological variation, and unfavorable meteorological conditions during the epidemic relative to the corresponding 2019 levels were favorable for the formation of secondary PM2.5. The increase in nitrate mass concentrations was more rapid than that of the other components, indicating that nitrate is more sensitive to meteorological variation. As shown in Figure S2 (in Supplementary Materials), nitrate increased by 4.8 µg/m3, which is higher than the increases in primary PM2.5 (4.2 µg/m3), SO42− (3.9 µg/m3), and NH4+ (2.6 µg/m3).

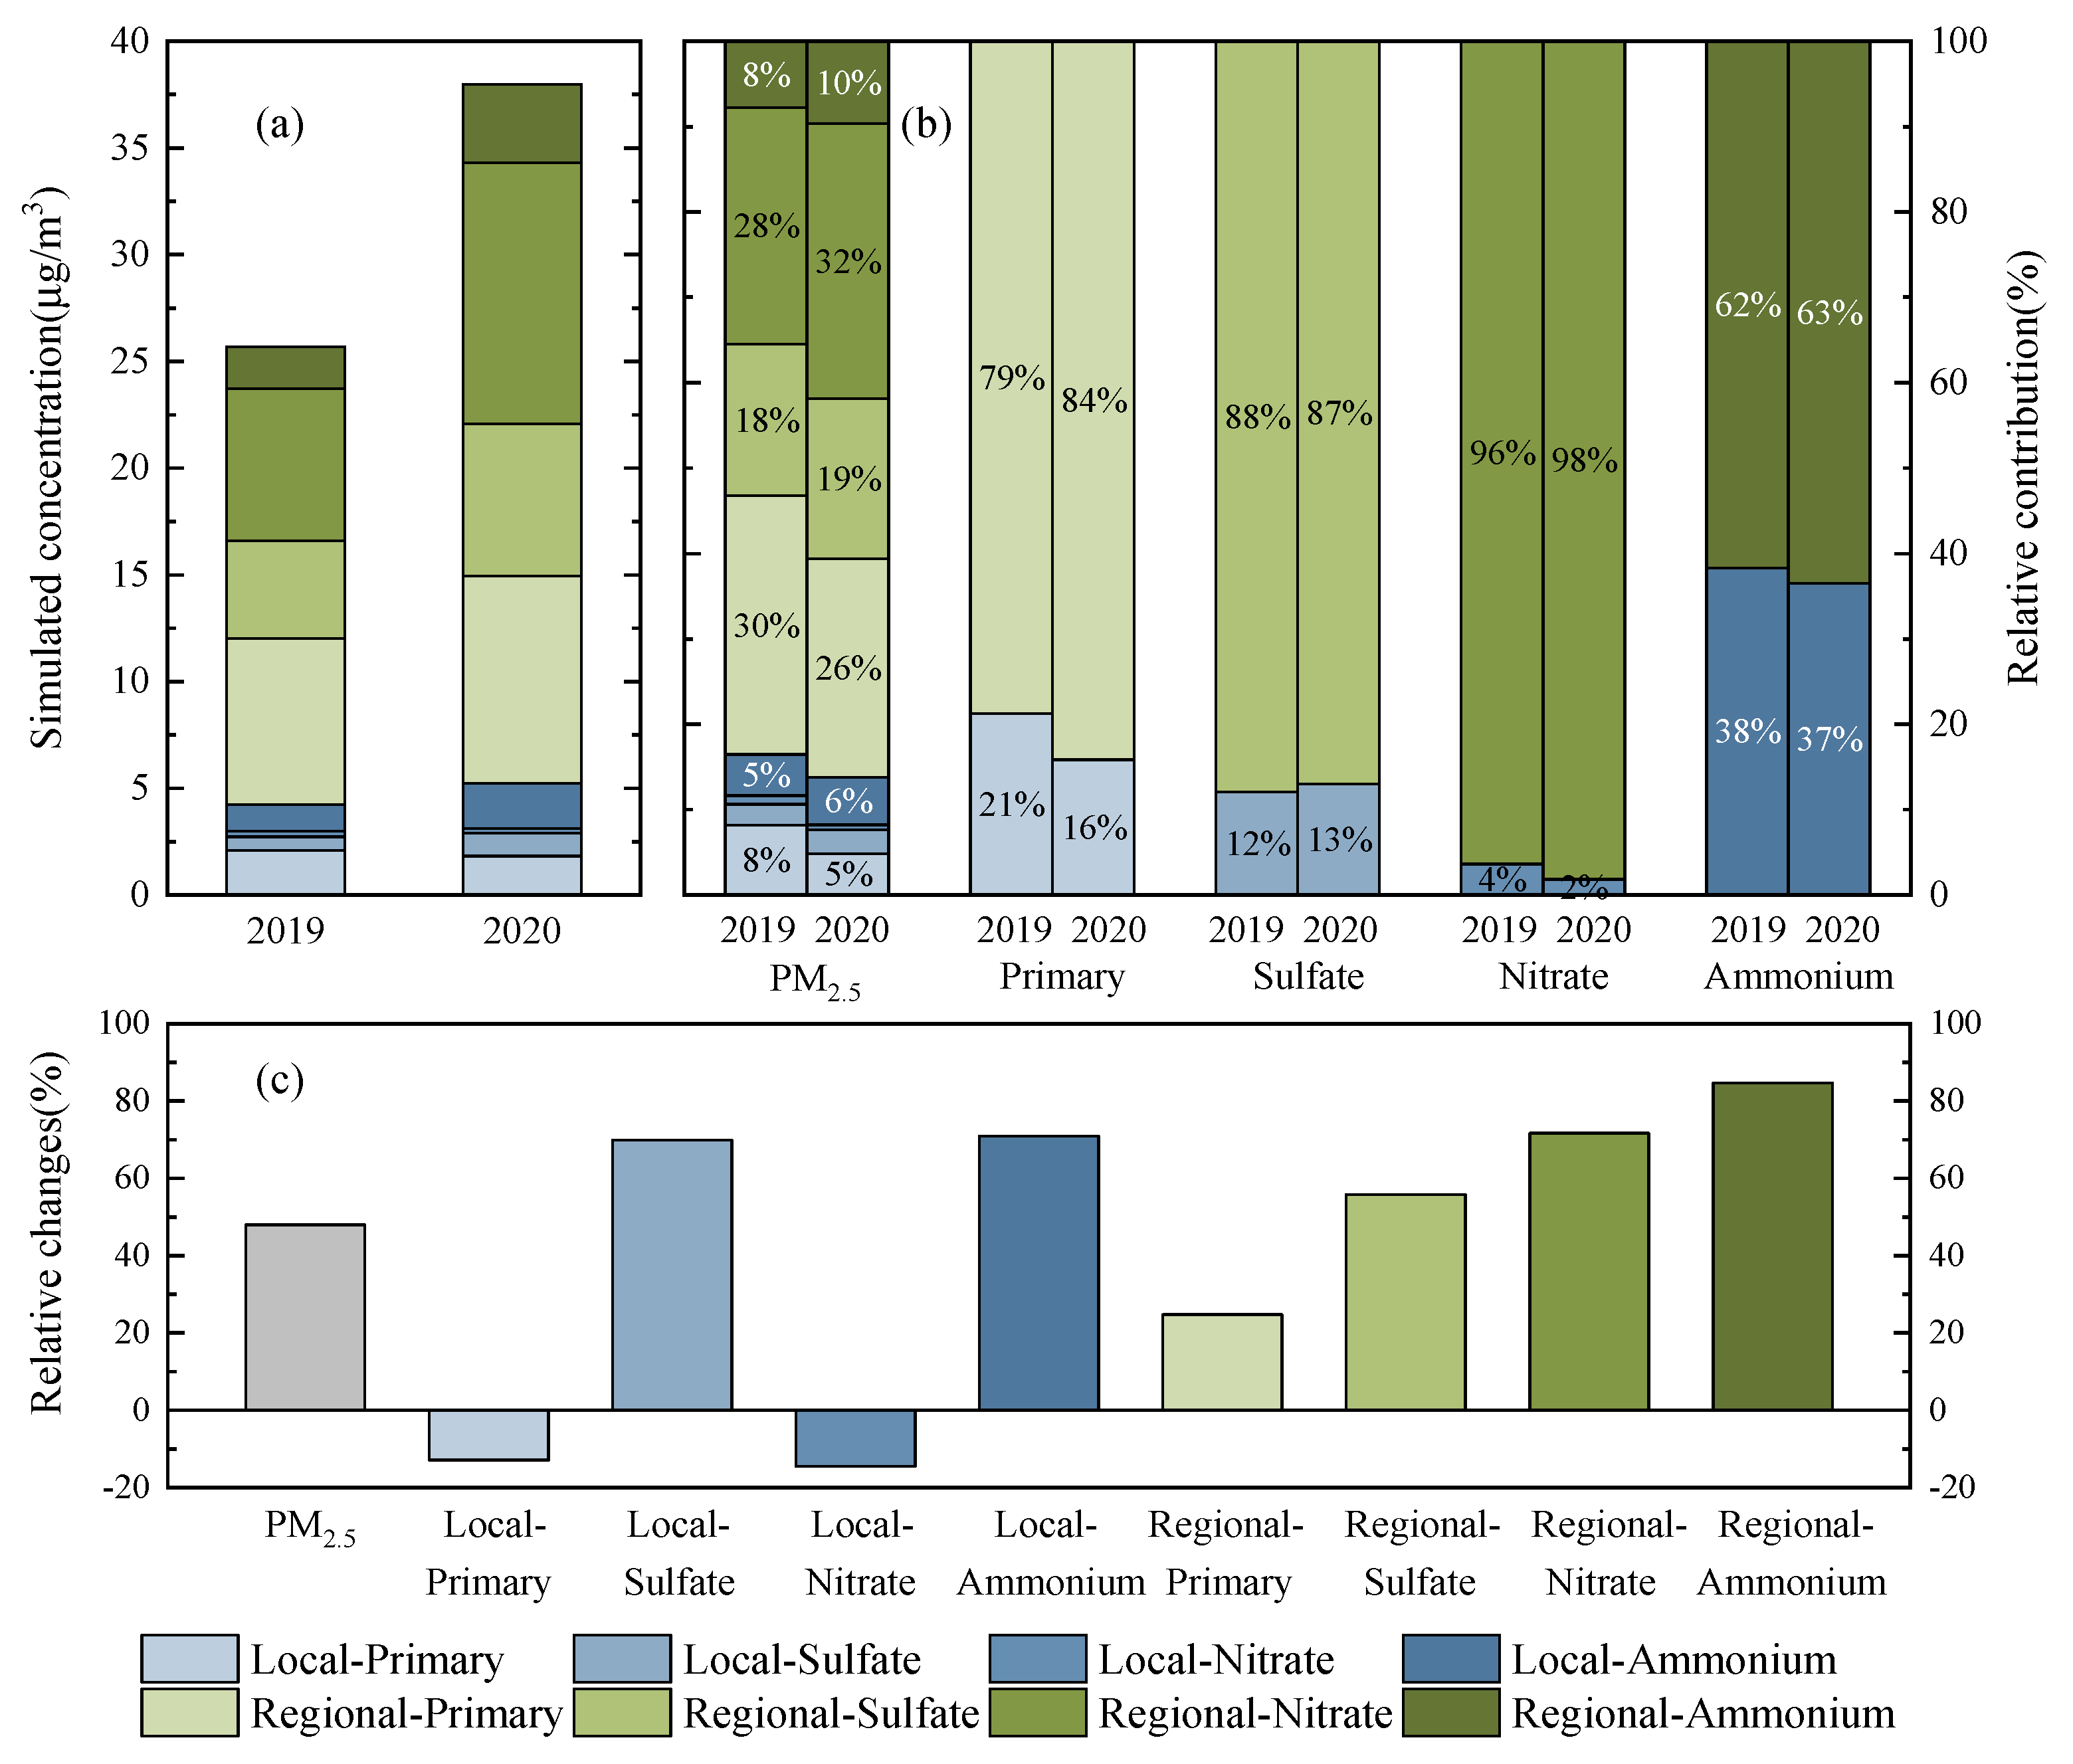
3.4. Impact of Regional Transport on PM2.5 Air Pollution

In order to evaluate the regional contributions of specific emission sources, regional transport for different PM2.5 components, including primary PM2.5 and SNA, were calculated (Figure 6). PM2.5 and its components were mainly dominated by regional transport, with less local emissions. The regional transport of PM2.5 and its components became more significant in the quarantine period than in 2019, suggesting the importance of joint control on regional sources for reducing heavy air pollution. The contribution of local sources during the epidemic increased relative to the 2019 levels, which was attributed to the increase of 70% and 71% in sulfate and ammonium concentrations, respectively. This offset the reduction of primary PM2.5 and nitrate concentrations by 13% and 15%, respectively.
Changes in local sources and regional transport were associated with both emission reductions, and meteorological variations, as shown in Figure 7. The emission reductions not only mitigated the impacts from local sources, but also from regional transport, which reduced PM2.5 by 1.4 μg/m3 and 1.9 μg/m3, respectively. The ΔLocalemis of the PM2.5 components was negative, suggesting that the local emission reduction benefit for PM2.5 concentrations had decreased. The ΔRegionalemis of primary PM2.5 and sulfate was negative, but positive for nitrate and ammonium. The decrease in regional transport in primary PM2.5 and sulfate concentrations was attributed to emission reductions in the surrounding areas. The main reason for the reduced response of nitrate to NOx emission reductions was the increase in photochemical oxidants, resulting in increased conversion efficiency of NOx to HNO3. As Beijing is in the VOC-limited ozone formation zone, the higher NOx emission reductions than VOCs during the epidemic increased O3 and OH concentrations, and subsequently increased the levels of photochemical oxidants. NH3 is the dominant alkaline gas that neutralizes atmospheric HNO3, leading to the formation of NH4NO3. Thus, the increase in nitrate concentration from regional transport may favor the formation of ammonium, offsetting the decreasing concentration due to NH3 emission reduction.
The ΔLocalmet of PM2.5 and its components was positive, implying that meteorological variation might inhibit the transport of pollutants out of Beijing, thus enhancing local concentrations. In addition, the regional meteorological conditions favored secondary particle formation and the transport of pollutants from surrounding areas into Beijing, thus enhancing their concentrations. In addition, compared to local sources, regional transport is more sensitive to meteorological variation, as demonstrated by the ΔRegionalmet being greater than the ΔLocalmet (Figure 6). Furthermore, the contribution of regional transport due to meteorological variation (ΔRegionalmet) accounted for 84% of the increase in PM2.5 concentrations resulting from meteorological variation, with a similar ratio to that of the primary PM2.5 and sulfate. However, the ΔRegionalmet/ΔLocalmet for nitrate was 99%, which was much higher than the total PM2.5, and that for ammonium (61%) was much lower than the total PM2.5. This phenomenon was associated with the contribution of regional transport, in which primary PM2.5 and sulfate concentrations were similar to those of total PM2.5. The contribution of regional transport to nitrate was the highest among the PM2.5 components, while that of ammonium was the lowest.

4. Conclusions

To prevent the spread of COVID-19 and to mitigate the pandemic risk, strict lockdown measures were implemented in Beijing during the quarantine period, and thus human activities were significantly reduced. However, severe air pollution episodes occurred frequently in Beijing. To explore the occurrence of severe air pollution during the quarantine period, the impacts of emission reductions, meteorological conditions, and regional transport on heavy air pollution were separately evaluated.
This study provides the first evidence that COVID-19 cases were associated with regional variations in air pollution across Beijing. The results indicated that the emissions of SO2, NOx, VOCs, NH3, PM10, and PM2.5 during the quarantine period were reduced by 12%, 39%, 23%, 7%, 36%, and 35%, respectively, as compared to those during the same period in 2019. The PM2.5 concentrations increased during the quarantine period, as compared to the 2019 levels, although both the primary PM2.5 and precursor emissions decreased, due to unfavorable meteorological conditions and more significant regional transport. Higher temperature, RH, frequency of strong southerly winds, and lower HPBL occurred during the epidemic period, as compared to those in 2019, due to of the less active cold surge, which was conducive to the accumulation of PM2.5. The model results also showed that the meteorological conditions in February 2020 favored PM2.5 formation. The PM2.5 was mainly dominated by regional transport, which was more significant in the quarantine period than in 2019, suggesting the importance of joint control on regional sources for reducing heavy air pollution.
This study highlights that, although the emissions in Beijing and surrounding regions were reduced largely during the quarantine period, they did not help to avoid severe air pollution in Beijing, due to the unfavorable meteorological conditions and increased regional transport. More efforts should be made to avoid severe air pollution in Beijing.

Supplementary Materials

The following are available online at https://0-www-mdpi-com.brum.beds.ac.uk/article/10.3390/su132112312/s1, Figure S1: changes in emissions of SO2, NOx, PM10, PM2.5, VOCs and NH3 in Tianjing and Beijing during quarantine period and the same time in 2019, Figure S2: Contributions of different factors to the PM2.5 concentrations, Table S1: The source of emissions inventory data in Beijing, Table S2: The source of emission inventory data in Tianjin and Hebei, Table S3: Comparisons of simulated 1-h PM2.5 concentrations with observations (Obs: observation, Sim: simulation).

Author Contributions

Conceptualization, X.Y.; methodology, X.Y., X.Q. and J.C.; software, J.W.; investigation, X.Y.; writing—original draft preparation, X.Y.; writing—Review & Editing, X.Q., X.S. and R.Z. and X.Y.; supervision, X.Q., A.S.; data curation, T.L., J.C.; M.L. (Miao Liang) and M.L. (Miao Lv); Language Editing, Y.L.; Project administration, C.L.; funding acquisition, X.Q., X.Y. and M.L. (Miao Liang). All authors have read and agreed to the published version of the manuscript.

Funding

This research was funded by Beijing Municipal Committee of the Communist Party of China, the National Natural Science Foundation of China (22106043), the National Key Research and Development Program of China (2017YFC0209700), and the State Key Joint Laboratory of Environment Simulation and Pollution Control (20K04ESPCT), Fundamental Research Funds for the Central Universities (2020MS035), State Environmental Protection Key Laboratory of Sources and Control of Air Pollution Complex (SCAPC202004). The contents of this paper are solely the responsibility of the authors, and do not necessarily represent the official views of the sponsors.

Institutional Review Board Statement

Not applicable.

Informed Consent Statement

Not applicable.

Data Availability Statement

Not applicable.

Conflicts of Interest

The authors declare no conflict of interest.

References

  1. Cheng, J.; Su, J.; Cui, T.; Li, X.; Dong, X.; Sun, F.; Yang, Y.; Tong, D.; Zheng, Y.; Li, Y.; et al. Dominant role of emission reduction in PM2.5 air quality improvement in Beijing during 2013–2017: A model-based decomposition analysis. Atmos. Chem. Phys. 2019, 19, 6125–6146. [Google Scholar] [CrossRef] [Green Version]
  2. Xu, Q.; Wang, S.; Jiang, J.; Bhattarai, N.; Li, X.; Chang, X.; Qiu, X.; Zheng, M.; Hua, Y.; Hao, J. Nitrate dominates the chemical composition of PM2.5 during haze event in Beijing, China. Sci. Total Environ. 2019, 689, 1293–1303. [Google Scholar] [CrossRef] [PubMed]
  3. Hua, Y.; Wang, S.; Jiang, J.; Zhou, W.; Xu, Q.; Li, X.; Liu, B.; Zhang, D.; Zheng, M. Characteristics and sources of aerosol pollution at a polluted rural site southwest in Beijing, China. Sci. Total Environ. 2018, 626, 519–527. [Google Scholar] [CrossRef] [PubMed]
  4. Beijing Municipal Ecology and Environment Bureau (BMEEB). Available online: http://www.beijing.gov.cn/ywdt/gzdt/202101/t20210104_2195891.html (accessed on 20 March 2021).
  5. Le Quéré, C.; Jackson, R.B.; Jones, M.W.; Smith, A.J.P.; Abernethy, S.; Andrew, R.M.; De-Gol, A.J.; Willis, D.R.; Shan, Y.; Canadell, J.G.; et al. Temporary reduction in daily global CO2 emissions during the COVID-19 forced confinement. Nat. Clim. Chang. 2020, 10, 647–653. [Google Scholar] [CrossRef]
  6. WHO. Report of the WHO-China Joint Mission on Coronavirus Disease 2019 (COVID-19); WHO: Geneva, Switzerland, 2020. [Google Scholar]
  7. Dong, Z.; Wang, S.; Xing, J.; Chang, X.; Ding, D.; Zheng, H. Regional transport in Beijing-Tianjin-Hebei region and its changes during 2014–2017: The impacts of meteorology and emission reduction. Sci. Total Environ. 2020, 737, 139792. [Google Scholar] [CrossRef] [PubMed]
  8. Chu, B.; Zhang, S.; Liu, J.; Ma, Q.; He, H. Significant concurrent decrease in PM2.5 and NO2 concentrations in China during COVID-19 epidemic. J. Environ. Sci. 2021, 99, 346–353. [Google Scholar] [CrossRef] [PubMed]
  9. Schiermeier, Q. Why pollution is plummeting in some cities—But not others. Nature 2020, 580, 313. [Google Scholar] [CrossRef] [PubMed] [Green Version]
  10. Varotsos, C.; Christodoulakis, J.; Kouremadas, G.A.; Fotaki, E.-F. The Signature of the Coronavirus Lockdown in Air Pollution in Greece. Water Air Soil Pollut. 2021, 232, 119. [Google Scholar] [CrossRef] [PubMed]
  11. Wang, Y.; Bao, S.; Wang, S.; Hu, Y.; Shi, X.; Wang, J.; Zhao, B.; Jiang, J.; Zheng, M.; Wu, M.; et al. Local and regional contributions to fine particulate matter in Beijing during heavy haze episodes. Sci. Total Environ. 2017, 580, 283–296. [Google Scholar] [CrossRef] [PubMed]
  12. Xing, J.; Wang, S.; Zhao, B.; Wu, W.; Ding, D.; Jang, C.; Zhu, Y.; Chang, X.; Wang, J.; Zhang, F.; et al. Quantifying Nonlinear Multiregional Contributions to Ozone and Fine Particles Using an Updated Response Surface Modeling Technique. Environ. Sci. Technol. 2017, 51, 11788–11798. [Google Scholar] [CrossRef] [PubMed]
  13. Zhang, Q.; Quan, J.; Tie, X.; Li, X.; Liu, Q.; Gao, Y.; Zhao, D. Effects of meteorology and secondary particle formation on visibility during heavy haze events in Beijing, China. Sci. Total Environ. 2015, 502, 578–584. [Google Scholar] [CrossRef] [PubMed]
  14. Xionghui, Q.; Ying, Q.; Wang, S.; Duan, L.; Zhao, J.; Xing, J.; Ding, D.; Sun, Y.; Liu, B.; Shi, A.; et al. Modeling the impact of heterogeneous reactions of chlorine on summertime nitrate formation in Beijing, China. Atmos. Chem. Phys. 2019, 19, 6737–6747. [Google Scholar] [CrossRef] [Green Version]
  15. Qiu, X.; Wang, S.; Ying, Q.; Duan, L.; Xing, J.; Cao, J.; Wu, D.; Li, X.; Chengzhi, X.; Yan, X.; et al. Importance of Wintertime Anthropogenic Glyoxal and Methylglyoxal Emissions in Beijing and Implications for Secondary Organic Aerosol Formation in Megacities. Environ. Sci. Technol. 2020, 54, 11809–11817. [Google Scholar] [CrossRef] [PubMed]
  16. Zheng, B.; Tong, D.; Li, M.; Liu, F.; Hong, C.; Geng, G.; Li, H.; Li, X.; Peng, L.; Qi, J.; et al. Trends in China’s anthropogenic emissions since 2010 as the consequence of clean air actions. Atmos. Chem. Phys. 2018, 18, 14095–14111. [Google Scholar] [CrossRef] [Green Version]
  17. Liu, H.; Jacob, D.J.; Isabelle, B.; Yantosca, R.M.; Duncan, B.N.; Sachse, G.W. Transport pathways for Asian pollution outflow over the Pacific: Interannual and seasonal variations. J. Geophys. Res. 2003, 108, 8786. [Google Scholar] [CrossRef] [Green Version]
  18. Rahman, A.; Luo, C.; Khan, M.H.R.; Ke, J.; Thilakanayaka, V.; Kumar, S. Influence of atmospheric PM2.5, PM10, O3, CO, NO2, SO2, and meteorological factors on the concentration of airborne pollen in Guangzhou, China. Atmos. Environ. 2019, 212, 290–304. [Google Scholar] [CrossRef]
  19. Wang, P.; Chen, K.; Zhu, S.; Wang, P.; Zhang, H. Severe air pollution events not avoided by reduced anthropogenic activities during COVID-19 outbreak. Resour. Conserv. Recycl. 2020, 158, 104814. [Google Scholar] [CrossRef] [PubMed]
  20. Zhang, Y.; Sperber, K.R.; Boyle, J.S. Climatology and Interannual Variation of the East Asian Winter Monsoon: Results from the 1979–95 NCEP/NCAR Reanalysis. Mon. Weather Rev. 1997, 125, 2605. [Google Scholar] [CrossRef]
  21. Sun, Y.; Zhuang, G.; Tang, A.; Wang, Y.; An, Z. Chemical Characteristics of PM2.5 and PM10 in Haze−Fog Episodes in Beijing. Environ. Sci. Technol. 2006, 40, 3148–3155. [Google Scholar] [CrossRef] [PubMed]
  22. Yao, L.; Lu, N.; Jiang, S. Artificial Neural Network (ANN) for Multi-Source PM2.5 Estimation Using Surface, MODIS, and Meteorological Data. In Proceedings of the 2012 International Conference on Biomedical Engineering and Biotechnology, Macao, China, 28–30 May 2012; pp. 1228–1231. [Google Scholar] [CrossRef]
Figure 1. (a) The two-nested CMAQ domain, (b) the observation sites in Beijing.
Sustainability 13 12312 g001
Figure 2. Changes in emissions of SO2, NOx, PM10, PM2.5, VOCs, and NH3 in Beijing during the quarantine period, and the same time period in 2019.
Sustainability 13 12312 g002
Figure 3. Relative changes in concentrations of pollutants and in emissions of primary pollutants during the quarantine period compared with the 2019 levels.
Sustainability 13 12312 g003
Figure 4. (a) The PM2.5 concentration, (b) temperature, (c) relatively humidity, and (d) wind directions during the quarantine period and 2019 levels. Arrows in the first panel indicate the cold surges identified by an increase in sea-level pressure with rapid decreases in temperature and RH. Mean values for the 2019 and for 2020 (in parentheses) are shown inset.
Sustainability 13 12312 g004
Figure 5. (a) The HPBL and (b) back trajectory analysis during a haze episode.
Sustainability 13 12312 g005
Figure 6. Contributions of different factors to the PM2.5 concentrations and its components during 2019–2020.
Sustainability 13 12312 g006
Figure 7. The contribution of local and regional transport to PM2.5 components (a,b) concentrations, and their relative change (c).
Sustainability 13 12312 g007
Publisher’s Note: MDPI stays neutral with regard to jurisdictional claims in published maps and institutional affiliations.

