Article

A Quantitative Approach of Subway Station Passengers’ Heterogeneity of Decision Preference Considering Personality Traits during Emergency Evacuation

1
The Key Laboratory of Road and Traffic Engineering, Ministry of Education, Tongji University, Shanghai 200092, China
2
Department of Construction Management, School of Civil and Hydraulic Engineering, Huazhong University of Science and Technology, Wuhan 430074, China
3
College of Design, Construction and Planning, University of Florida, Gainesville, FL 32611, USA
4
Urban Transport Institute, China Academy of Urban Planning and Design, Beijing 100044, China
*
Authors to whom correspondence should be addressed.
Sustainability 2021, 13(22), 12540; https://0-doi-org.brum.beds.ac.uk/10.3390/su132212540
Submission received: 29 September 2021 / Revised: 7 November 2021 / Accepted: 9 November 2021 / Published: 12 November 2021
(This article belongs to the Special Issue Sustainable Public Transportation and Accident Prevention)

Abstract

:
Subway station emergencies are gradually increasing in China. The aim of this research is to study the effects of “Dist”, “Pedestrian flow” and “Crowd density” on the heterogeneity of passengers’ decision-making preference and explore the relationship between heterogeneity and personality. Firstly, a questionnaire of 20 emergency evacuation scenarios, that includes the Eysenck Personality Questionnaire, is designed. Secondly, the heterogeneity of passengers’ decision preference is quantified by the random parameter logit model. Finally, personality traits and influencing factors are used as abscissa and ordinate respectively, to study the relationship between personality traits and preference heterogeneity. The results show that the coefficients of “Dist”, “Pedestrian flow” and “Crowd density” are −0.101, 0.236 and −0.442 respectively, which are statistically significant. The proportion of extroverted passengers of the exit is 9% higher than that of introverted passengers when “Pedestrian flow” of the exit is greater than the average value, while the proportion of introverted passengers is 7% higher than that of extroverted passengers when “Crowd density” is smaller than the average value. The conclusion is that the three influence factors are random variables, and “Dist” shows the lowest level of heterogeneity. Extroverted passengers are more likely to follow a large crowd for evacuation, but introverted passengers are more likely to avoid crowded exits.

1. Introduction

Subway has become one of the most popular modes of transportation due to its convenience. However, it is very easy to cause casualties of passengers in case of an emergency due to the high sealing and independence of subway stations. Some emergencies lead to crowd evacuation, such as fire, terrorist attacks and so on. Especially in recent years, the emergence of COVID-19 has also caused the problem of crowd evacuation in the high sealing and independence places. Some scholars have studied the problem of crowds’ safe evacuation under the influence of COVID-19 [1,2]. Actually, there are many factors that affect passengers’ evacuation decision-making, which are covered in many literature studies [3,4,5]. However, these studies do not involve quantitative analysis [6,7,8,9]. Meanwhile, the classic literature [10,11] expounds the basic principles of pedestrian evacuation from the perspective of behavior. However, there is little research on the relationship between evacuation behavior and personality traits of passengers.
Therefore, one purpose of this paper is to quantitatively study the impact of these factors on passengers’ decision-making (i.e., the heterogeneity of passengers’ decision-making preferences). Meanwhile, another purpose of this paper focuses on the relationship between the passengers’ personality traits and the passengers’ decision preference heterogeneity. This study will provide basic research for improving evacuation models and developing a more refined evacuation plan by quantifying the influence of different factors on passengers’ evacuation decision-making. Firstly, the data are collected based on a questionnaire of personality traits. Secondly, the utility coefficients of factors that affect evacuation are calibrated by the random parameter logit model, and the heterogeneity of passengers’ decision preference is analyzed based on the marginal probability distribution of the utility coefficients. Finally, the relationships between the personality traits and the evacuation influencing factors are quantified.
In the rest of this paper, Section 2 provides a summary of literature findings on the personality traits and the evacuation model, and highlights literature limitations. The method of the study is presented in Section 3, including the experimental design, the random parameter logit model and the calculation method for the personality traits. The results of the analysis and the findings are shown in Section 4. Section 5 concludes the paper with a discussion of our findings and suggestions for further research in the future.

2. Literature Review

There are many studies about the influencing factors of emergency evacuation in subway stations or other buildings. The literature about the influencing factors of emergency evacuation can be divided into the qualitative and quantitative research on the whole.
Li Xun [12] summarized and analyzed the psychological and behavioral influencing factors of emergency evacuation passengers in four aspects: environmental information, guidance information, acceptance information and passengers’ basic information. The action mechanism of influencing factors was discussed and the suggestions for guiding emergency evacuation were put forward according to the corresponding factors. Wu Junzi [13] analyzed the influence factors of building fires on evacuation from four dimensions: management factors, building structure environmental factors, personnel factors and fire factors, and expounded the influence mechanism of four influencing factors on evacuation, respectively. LAN Shanmin [14] conducted a detailed study on the individual behavior process, the behavior characteristics and the group behavior characteristics, and suggested that people’s evacuation behavior was usually induced by the interaction of their own factors and the environment. Kobes [15] analyzed the influencing factors of evacuation behavior in general buildings (such as towers, large pavilion facilities, etc.) from the aspects of personnel characteristics, building characteristics and emergency characteristics. The studies of influencing factors above are more in line with qualitative analysis than quantitative analysis.
In the quantitative research, Hoogendoorn [16] divided the emergency evacuation behavior into three levels: “strategic”, “tactical” and “operational” levels of decisions, respectively. The “strategic” level of decisions was the choice of the moment for initiating the evacuation (defining the pre-evacuation time). The “tactical” level of decisions was the choice of exit and global route to reach the intended destination. The “operational” level of decisions was the choice of the next step to avoid collision with other pedestrians and also obstacles while moving toward the chosen exit. Among the aforementioned types of decisions, the ”operational” level of decision of pedestrians has certainly received the most attention in the literature, such as the social force model [10] and the cellular automata model [11], which were the most widely used models of passengers’ evacuation. The social force model was a continuous model proposed by Helbing, which considered the social interaction forces from other pedestrians and the forces from obstacles, and the desired force of pedestrians. The cellular automata model was a representative discrete model proposed by Blue, which established rules for evacuees’ movements and making them more homogeneous. Most commercial simulation evacuation software are developed based on the two above models. Zhang Hui [17] estimated evacuation capacity by constructing the evacuation network based on different queueing models, and the relation between throughput and arrival rate was determined. The models mainly established rules for the movement of crowds, which caused strong homogeneity of crowds. Many scholars have carried out extensive research on different aspects of passengers’ evacuation behaviors based on the social force model and the cellular automata model. Zhong Maohua [18] simulated the behavior of passengers getting on and off the subway. Gräßle and Kretz [19] conducted simulated evacuation experiments under different numbers of exits to investigate evacuation behavior of passengers and train conductors. Jiang et al. [20] studied the parameters of maximum speed upstairs and the average minimum width of stairs to reflect the particularity of passengers’ flow in subway stations in China. Meanwhile, the agent-based modeling [21] was used to find differences between individuals. The above research did not consider the different effects of influencing factors on different passengers during emergency evacuation. At present, four main methods are widely used to study the special problem of choosing the exit direction (the “tactical” level) during emergency evacuation, which include the game theory method, the discrete selection methods, the method based on the network model and the cellular automata method. The discrete selection methods include the binary logit model, the conditional logit model, the nested logit model, the mixed logit model, etc. Antonini [22] used the nested logit model to describe the pedestrians’ choice of the next step. Lovreglio [23] used the mixed multinomial logit model to describe the exit selection behavior during crowds’ evacuation. Duves and Mahmassani [24] introduced the decision model based on the explicit logit model into the walking behavior model of cellular automata.
In previous studies, some important aspects of evacuation behavior decision-making were often taken for granted, such as the influence of other pedestrian flows (called “herding” behavior). However, there is no in-depth quantitative research on the root reasons of some important factors that affect passengers’ emergency evacuation decision-making; that is, whether the influence of these factors on passengers varies from person to person when passengers make evacuation direction decisions. This paper studies the heterogeneity of passenger decision-making preference during emergency evacuation in subway stations considering the passengers’ personality traits.

3. Methods

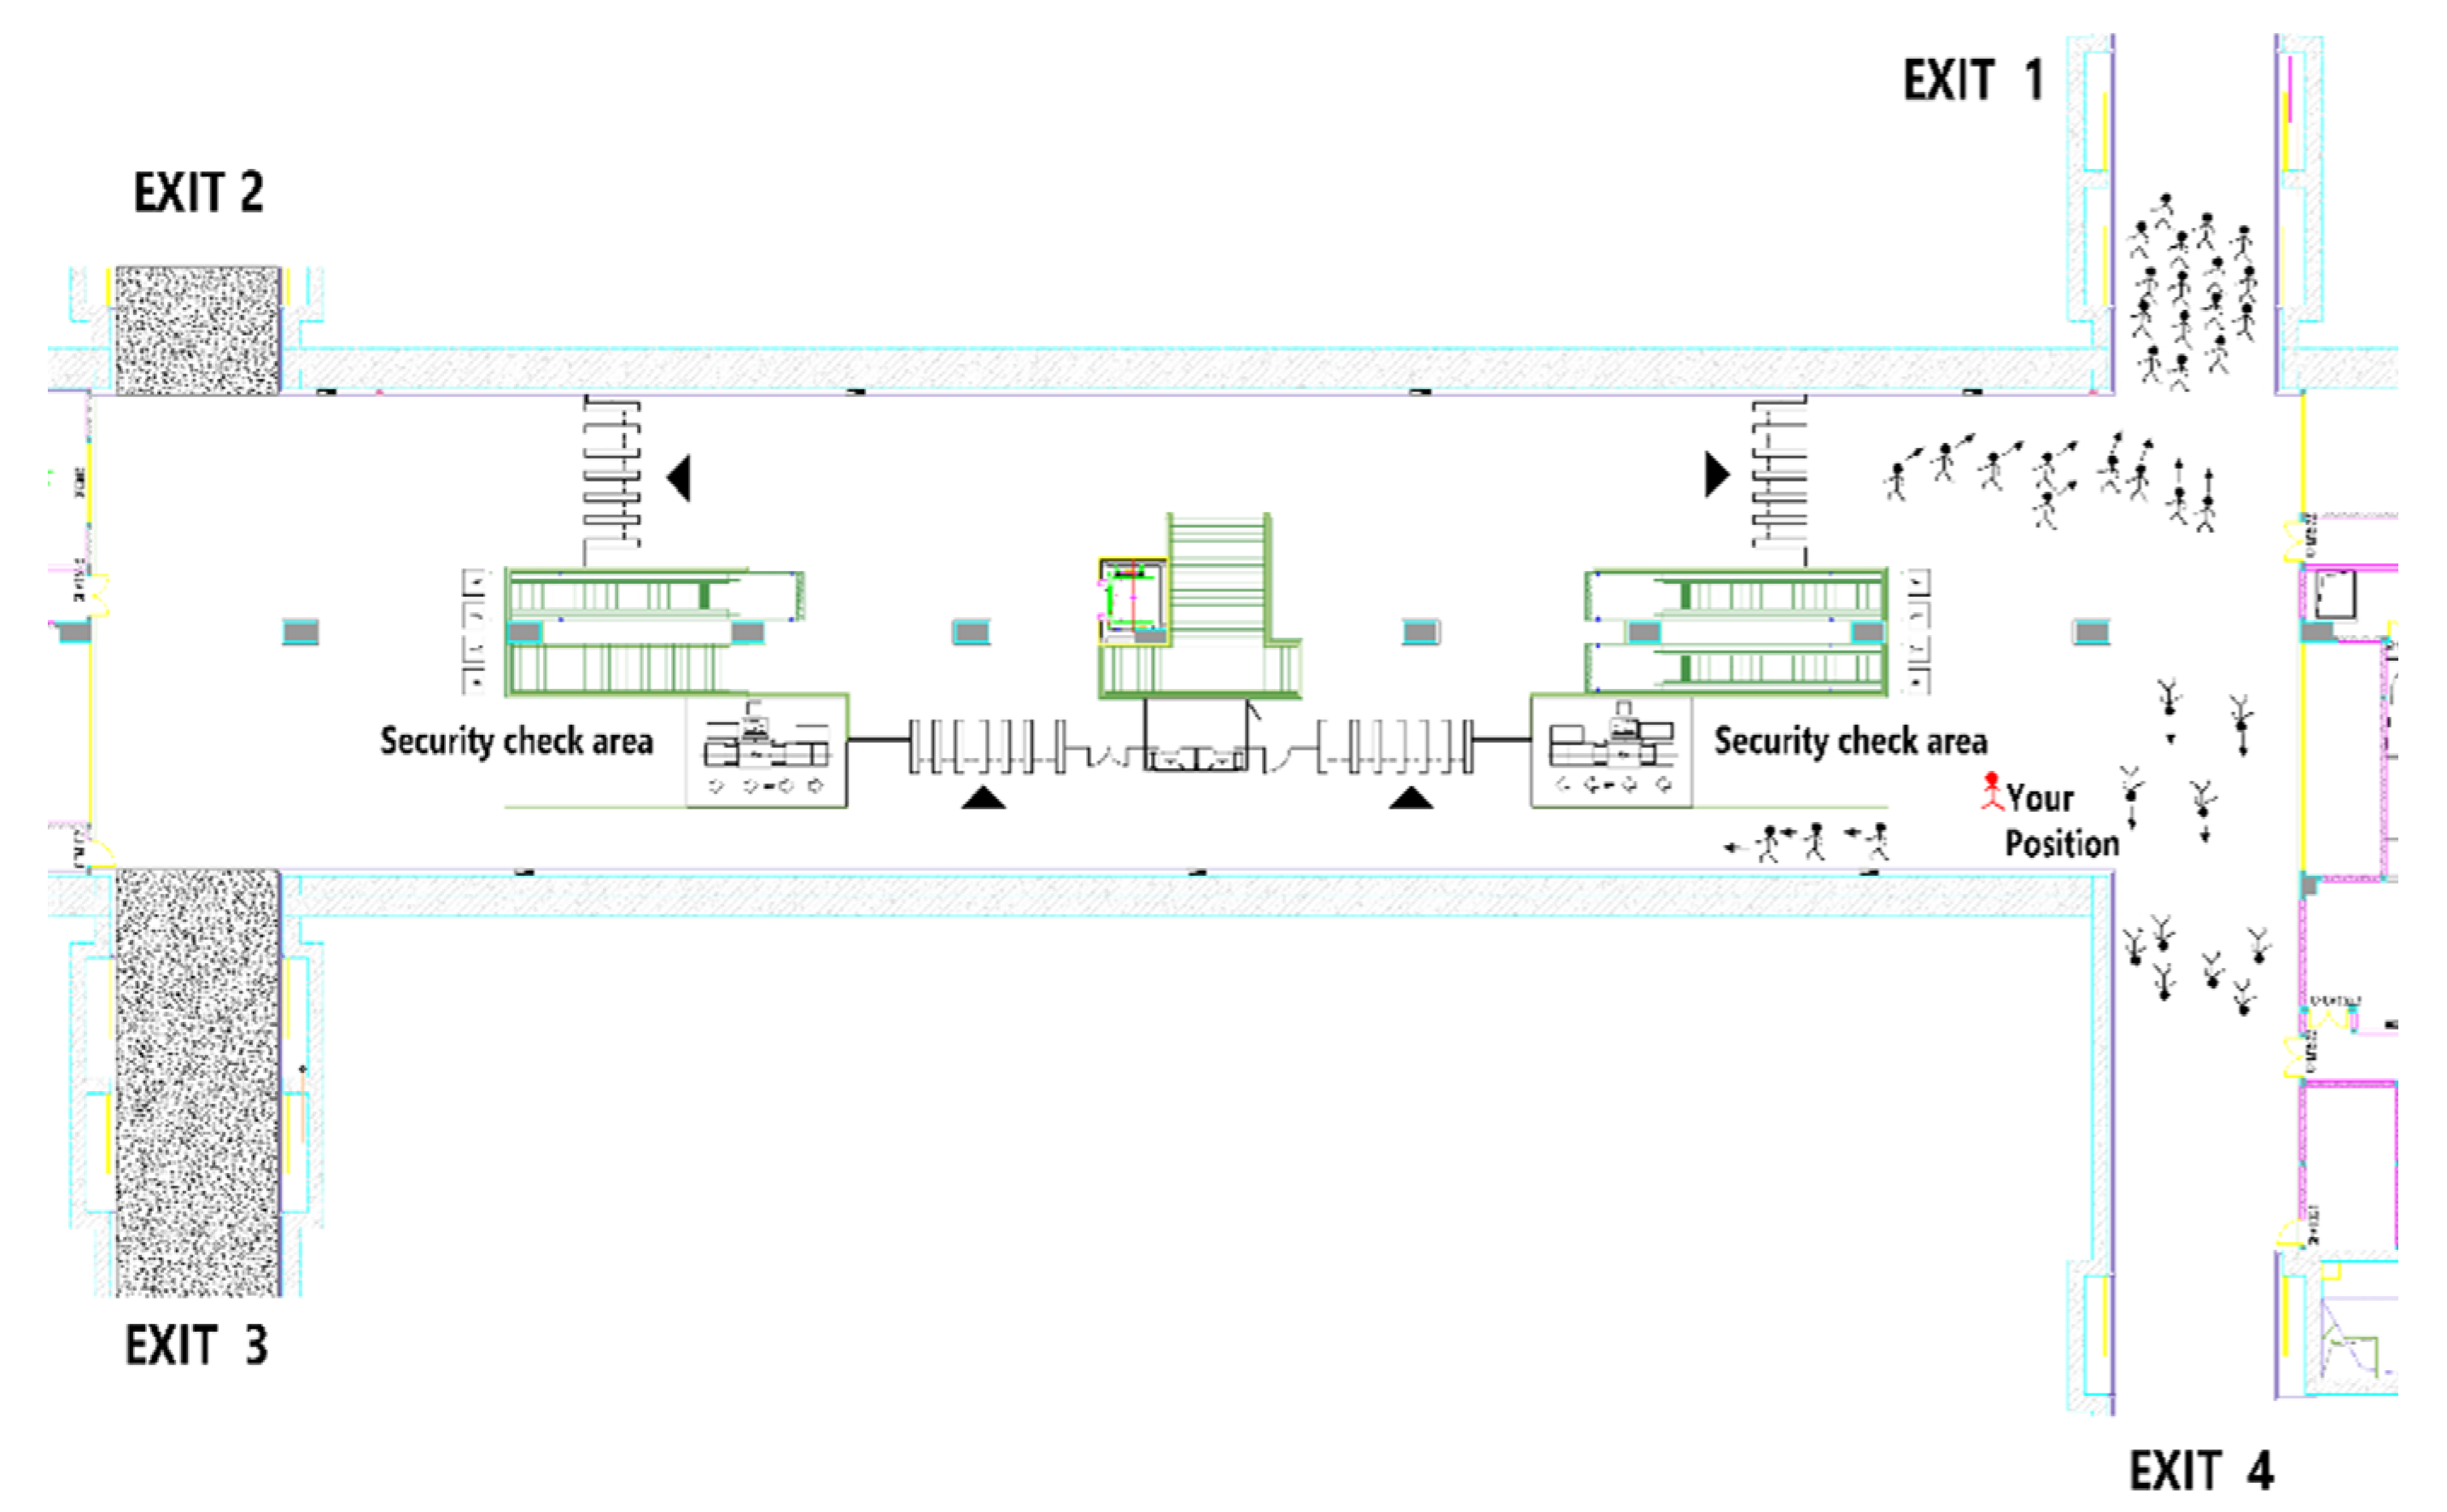
3.1. Experimental Design

In order to elicit pedestrians’ preference in their decision-making in emergency egress situations and to explore factors that affect evacuees’ choices and their trade-off between those contributing factors, individual-level choice data were collected in this research. A method that introduced decision makers to hypothetically designed choice experiments, known as Stated Preference Choices (SP) [25], was used. The SP survey method, that is, preference survey, was used to obtain people’s subjective preference for multiple options under hypothetical conditions. It was used to understand the selection results of respondents in a certain selection state. This method can collect the modeling data needed to reveal passengers’ preferences about the level of emergency evacuation decision-making in this paper.
The survey method in this study was basically similar to some previous research methods in the field of pedestrian evacuation. The differentiation is that the participants that we selected were those who often take the subway and have a clear impression about the internal structure of the subway station. This survey method is a new trend in the econometric literature, which can enhance the authenticity of hypothesis selection experiments by connecting with the real experience [26,27]. At the same time, the research in [28] also showed that this method is more likely to collect reliable data and effective model estimation results.
Firstly, the experimental design was to determine the dependent variables and the independent variables. This study mainly focused on the influencing factors of emergency evacuation from the subway hall. Therefore, the dependent variable of this study was the choice of exit during the passengers’ evacuation. In [29], people ranked the important factors affecting evacuation. This paper selected three influencing factors (“Dist”, “Pedestrian flow” and “Crowd density”) which are most important in [29], as shown in Table 1.
Secondly, the hall of a subway station was selected as the experimental scene in Nantong, China. A total of 20 evacuation scenarios were designed in the questionnaire, which also included the content of the Eysenck Personality Questionnaire. The questionnaire also investigated the gender, age, evacuation experience and safety evacuation education of passengers. The location of passengers, the crowds around each exit and the number of pedestrians moving towards the exit were changed in each scenario. The changes in these scenarios basically investigate the possibility that passengers may change their nearest exit choice to another exit choice. In the experimental design, participants in each scene can only observe the situation around the set position in the figure. Similar to reality, some exits are invisible to passengers. In the questionnaire design, we blur the area around the invisible exit, indicating that passengers cannot know the situation around the invisible exit. Through this scenario design, we can observe the decision-making of passenger exit during evacuation under the control of incomplete information. For example, the hypothetical location of the participants in Figure 1 can only observe the “Crowd density” of exits 1 and 4, the “Pedestrian flow” that moves to exits 1 and 4 and part of the “Pedestrian flow” that moves to exits 2 and 3 within the field of view. It is impossible to obtain the surrounding conditions of exits 2 and 3 outside the field of view. In a sense, the data obtained from this survey were similar to the data information that passengers can access during real emergency evacuations.
Finally, the 20 scenes of emergency evacuation were divided into 2 groups, with 10 scenes in each group. The 132 participants were randomly assigned to the 2 groups for the experiment. Participants assumed that each picture scene was an emergency and imagined which exit they would choose to evacuate if they encountered this situation in reality. A total of 1320 selection results of the 132 participants were collected. The minimum sample size of the logit model has not been uniformly specified. The sample size in logit regression analysis should be 5~10 times as much as the number of independent variables, which was mentioned in [30]. The number of independent variables in this paper is 3 and the sample size is 132, so it meets the requirements.

3.2. Modeling

3.2.1. The General Mathematical Model of Utility Function of Logit

This paper adopts the discrete choice model, which is a statistical model used to describe individual behavior, including the binary logit model, the conditional logit model, the nested logit model, the mixed logit model, etc. The general principle of the discrete choice model is stochastic utility theory; that is, when decision maker n faces the choice, there are i choice schemes, and the preference for a certain choice scheme i can be described by the utility value U n i t of the selected object. V n i t is the observable part of the utility function, also called the fixed utility function, and ε n i t is the random error part of the utility function. The distribution form of the random error function ε n i t determines different discrete selection models. Therefore, the utility function of exit i selected by passenger n in subway emergency evacuation scenario t can be characterized as Formula (1):
U n i t = V n i t + ε n i t

3.2.2. The Observable Part of the Utility Function of Logit

The independent variables of the utility function are “Dist”, “Pedestrian flow” and “Crowd density“
The observable part of the passenger utility function can be expressed by Formula (2):
V n i t = β 1 n ( D i s t ) n i t + β 2 n ( C r o w d   d e n s i t y ) n i t + β 3 n ( P e d e s t r a i n   f l o w ) n i t
where ( D i s t ) n i t is the distance from the passenger n to exit i in experimental scenario t, ( C r o w d   d e n s i t y ) n i t is the number of passengers at exit i in experimental scenario t, ( P e d e s t r a i n   f l o w ) n i t is the number of passengers flowing to exit i seen by the passenger n in experimental scenario t and β 1 n ,   β 2 n   and   β 3 n are the parameter coefficients.

3.2.3. The Random Parameter Logit Model

The main purpose of this paper is to study the heterogeneity of passenger evacuation preference. However, some logit models cannot identify the heterogeneity of preferences, such as the conditional logit model, the nested logit model, etc., because these logit models usually use the maximum likelihood method for parameter estimation, but the maximum likelihood estimation method assumes that the probability of event occurrence is only determined by the factors in the model, which ignore the influence of factors outside the model and uncertain factors on the probability of event occurrence. These logit models above did not consider the limitations of individual differences and the IIA hypothesis (the IIA hypothesis states that for any individual, the ratio of the probability of choosing two alternatives is independent of the presence of attributes of any other alternative) [28], so the random parameter logit model is proposed to solve this problem. The random parameter logit model sets the coefficient as random, which can better capture the heterogeneity among decision makers. The experimental data come from the selection results of participants for different evacuation scenarios. The differences of these factors may lead to heterogeneity. The random parameter logit model has been proven to be a good indicator of this heterogeneity [31].
The random error term ε n i t of the random parameter logit model follows Gumble distribution, as shown in Formula (3):
f ( ε n i t ) = e ε n i t e ε n i t
The utility coefficient β n follows normal distribution, and β n can be expressed by Formula (4):
β n = β + Γ ω n
The random parameter logit model can be expressed by Formula (5):
P n i t = ω n t = 1 T e V n i t j = 1 I n e V n j t ψ ( ω n ) d ω n
where β is the average of the coefficients, ω n is the vector of independent normal variables, Γ is the Cholesky factor of the covariance matrix and ψ ( ω n ) is the probability density function.

3.3. Calculation Method of Personality Traits

Costa [32] proposed a five personality traits model, including five traits called Open-ness, Conscientiousness, Extraversion, Agreeableness and Neuroticism, which was referred to as the OCEAN model for short. Eysenck et al. [33] compiled the revised Eysenck Personality Questionnaire for adults (EPQ-RS), which includes 48 items. Chen Zhonggeng [34] formed an adult questionnaire (a total of 85 items) and compiled a Chinese average based on the survey data in China. Qian Mingyi [35] revised and formed the Chinese version of the Eysenck Personality Questionnaire based on the sample data of 8637 people from 56 regions of 30 provinces and cities in China on the basis of EPQ-RS.
The Eysenck Personality Questionnaire is an effective personality measurement tool compiled by British psychologist Eysenck. It plays an important role in analyzing the traits of personality. The Eysenck Personality Questionnaire is a self-reported personality questionnaire, which contains four subscales: Psychoticism scale, Extroversion scale, Neuroticism scale and Lie scale. The “Extroversion scale” indicates the internal and external tendencies of personality. This paper mainly studies the influence of introversion and extroversion on emergency evacuation decision-making.
There are 48 questions in the EPQ-RS questionnaire, and each question corresponds to two answers of “yes” or “no”. It is worth noting that when some subjects answer “yes”, 1 point will be calculated, and when some subjects answer “no”, 1 point will be calculated. Firstly, we obtained the preliminary total score according to the “Extroversion scale” filled out by the participants. Secondly, we calculated the standard score “T” according to Formula (6) and Table 2 [35]:
T = 50 + 10 ( X M ) / S D
where T is the standard score, X is the original score, M is the average score of each age group and S D is the standard deviation of each age group.
It should be noted that if the score of T is greater than 50, it indicates that the participant’s personality is extroverted, but if the score of T is less than 50, it indicates that the participant’s personality is introverted.

4. Results

4.1. The Regression Results of Random Parameter Logit Model

According to the research about the random parameter logit model in [36], the data were analyzed according to the proposed process. It was assumed that the variables “Dist”, “Pedestrian flow” and “Crowd density” are random coefficients. According to the settings above, the random coefficient logit model regression is carried out based on the survey data. The coefficient solution of the random coefficient logit model has no closed solution and needs a simulation solution, which involves the random sampling. In the random sampling, the Halton sequence sampling is better [37], so the Halton sequence sampling was used in this paper. The sampling time was 1000, the log likelihood of the model was −1350 and the Pseudo R2 was 0.192. The results of model estimation are shown in Table 3. Figure 2 is a graphical representation of the coefficient values of each influencing factor in Table 3; that is, the coefficient of “Dist” is −0.101, the coefficient of “Pedestrian flow” is 0.236 and the coefficient of “Crowd density” is −0.442.
The p-values of the three influencing factors were less than 0.05, indicating that the mean coefficient is significant, as shown in Table 3. The values of “Dist” and “Crowd density” coefficients were −0.101 and −0.442, which are negative, indicating that the larger their values are, the smaller the probability that the exit will be selected. The value of the “Pedestrian flow” coefficient was 0.236, which is positive, indicating that the larger the value is, the greater the probability that the exit will be selected.

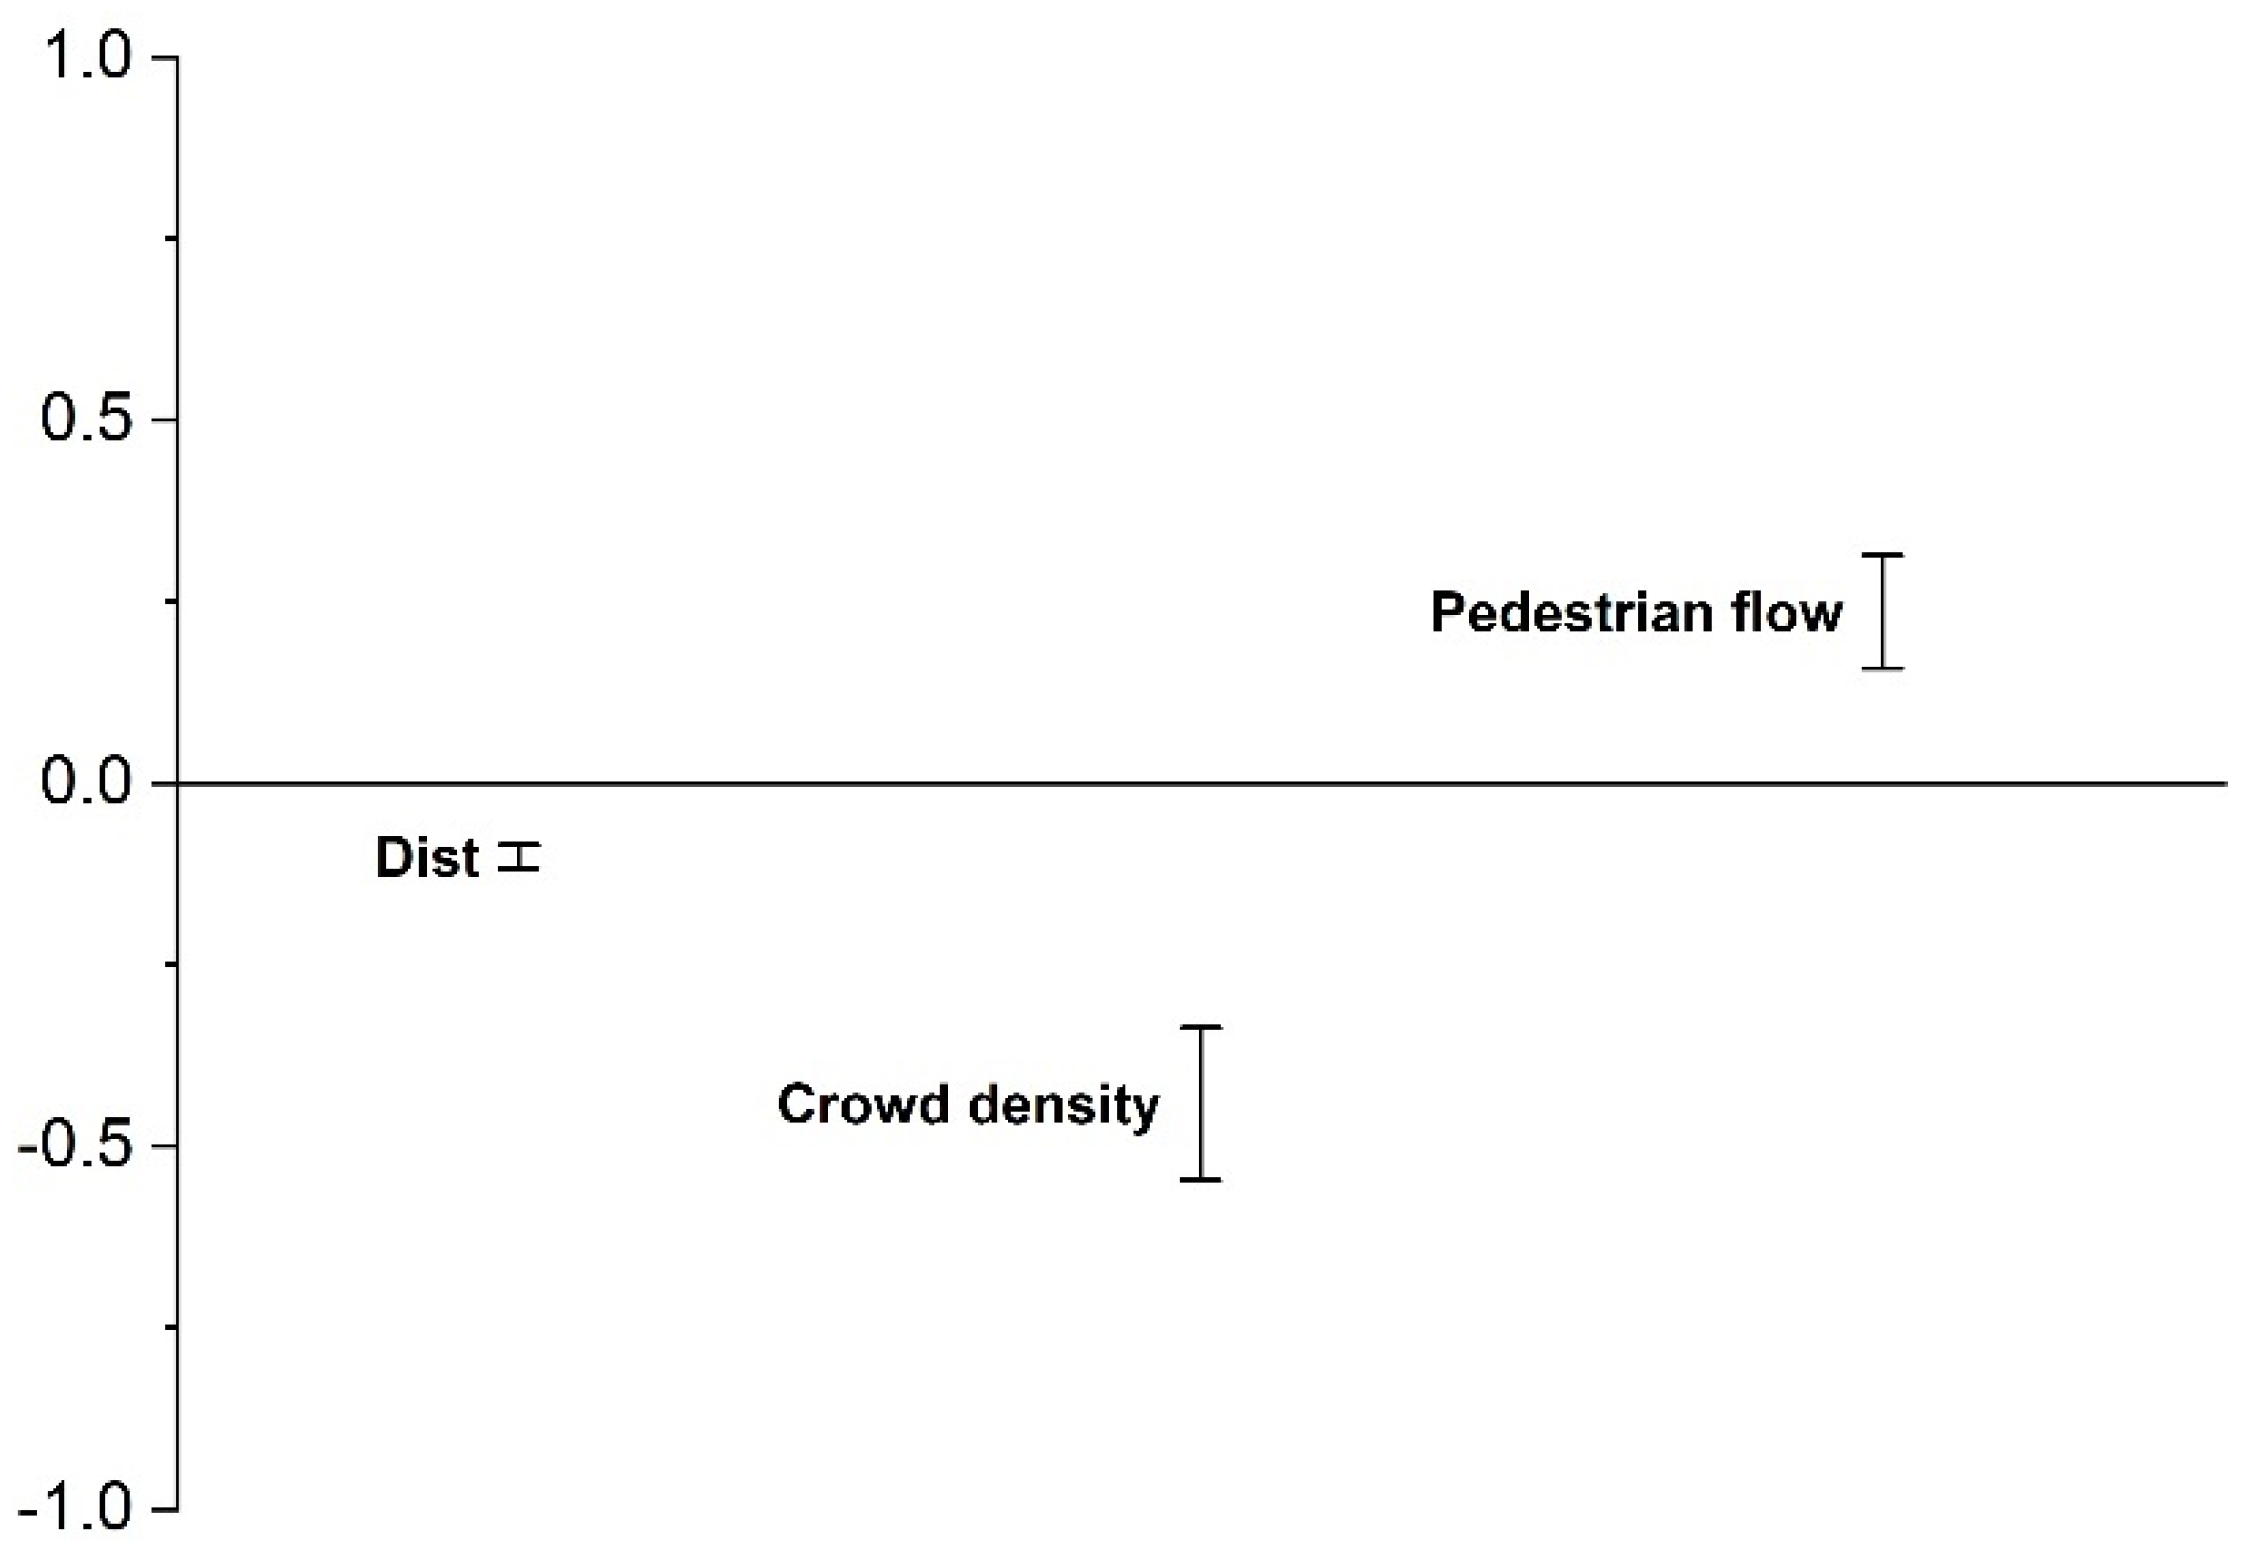
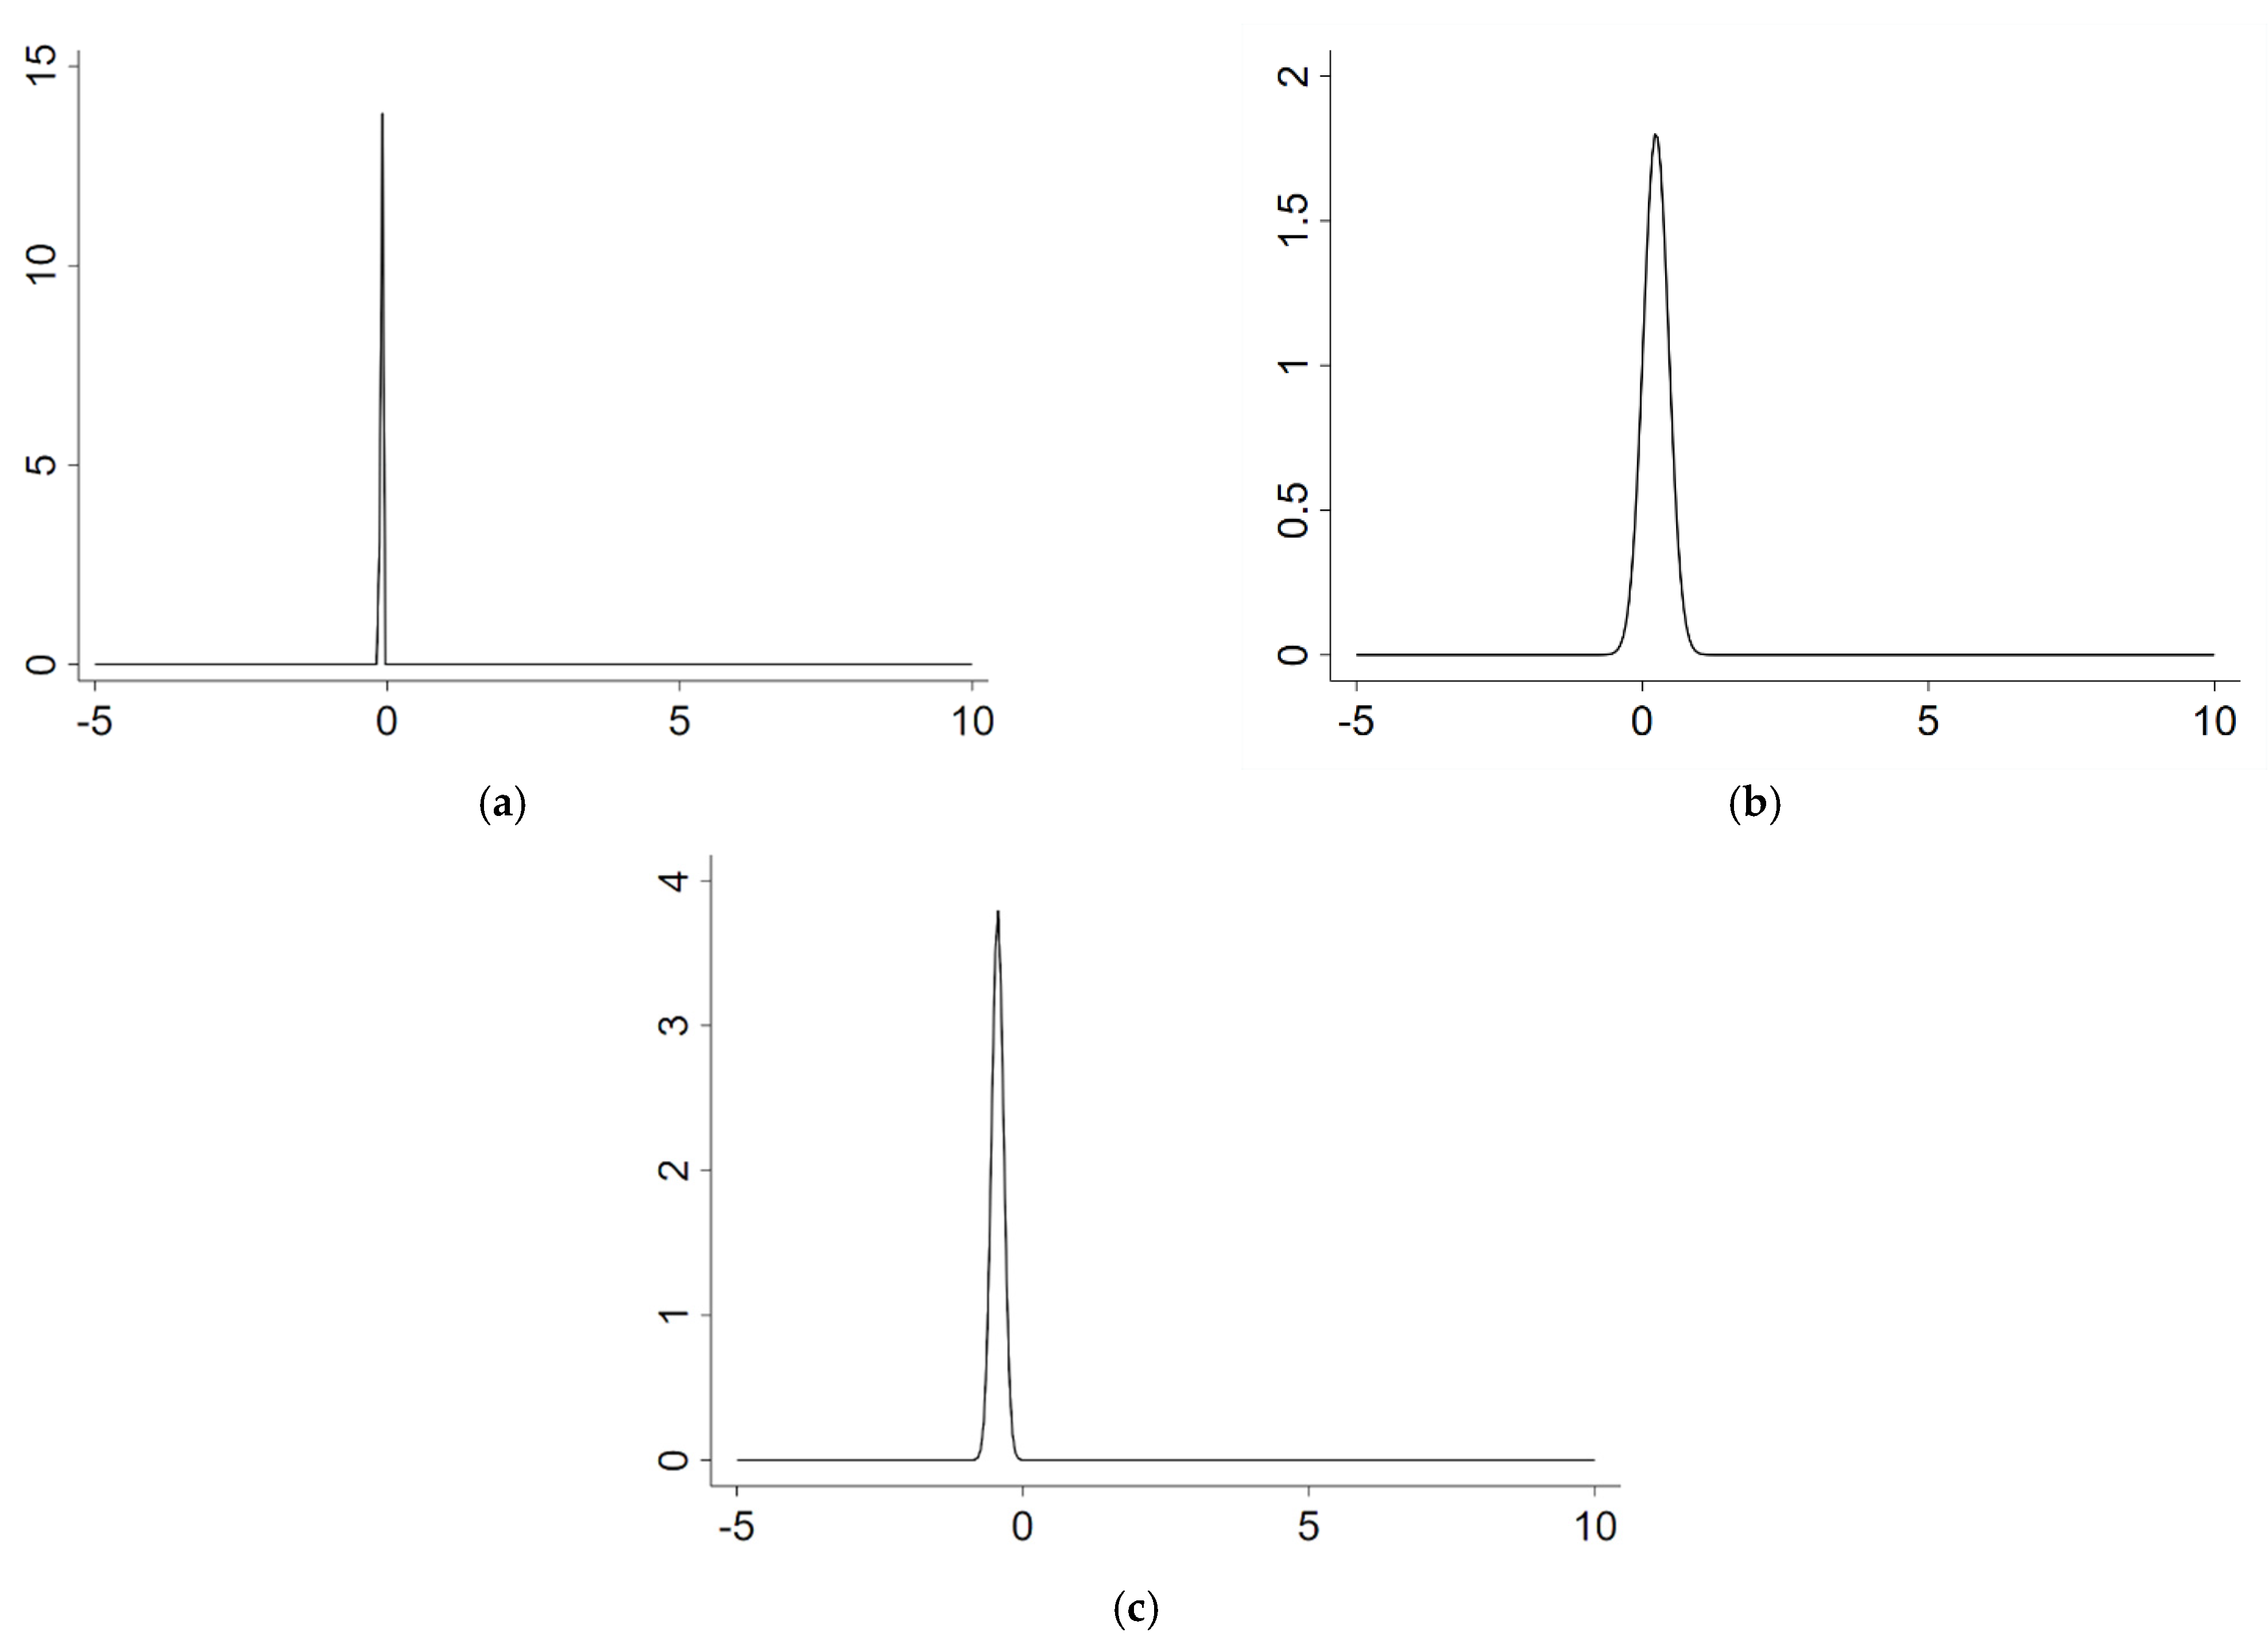
4.2. The Quantitative Analysis of Decision Preference Heterogeneity

The results in Table 3 cannot reflect whether the influencing factor coefficient is random; that is, whether there is heterogeneity in preference. Table 4 is further derived from Table 3, which is the statistical result of the standard deviation of the influencing factor coefficient, and its results can reflect whether preference heterogeneity exists. In the results, the p-values were less than 0.05, which were significant, indicating that the coefficients of “Dist”, “Crowd density“ and “Pedestrian flow” are the random coefficients in the utility function. The impact of evacuation factors on utility is different for different passengers; that is, there is heterogeneity.
According to the estimated random coefficient logit model described above, the marginal probability distribution function of the coefficients of influencing factors was described to explain the heterogeneity of the three factors on passenger decision-making utility, as shown in Figure 3a–c.
Figure 3a shows that the marginal probability distribution of the “Dist” coefficient was the most concentrated, indicating that the estimated coefficient of the “Dist” factor showed the lowest heterogeneity level; that is, most people will choose the nearest exit for evacuation. Figure 3b,c showed that the marginal probability distribution of the coefficients of “Pedestrian flow” and “Crowd density” were relatively dispersed, and their heterogeneity levels were higher than that of “Dist”, indicating that passengers’ perception of these two influencing factors is relatively dispersed.

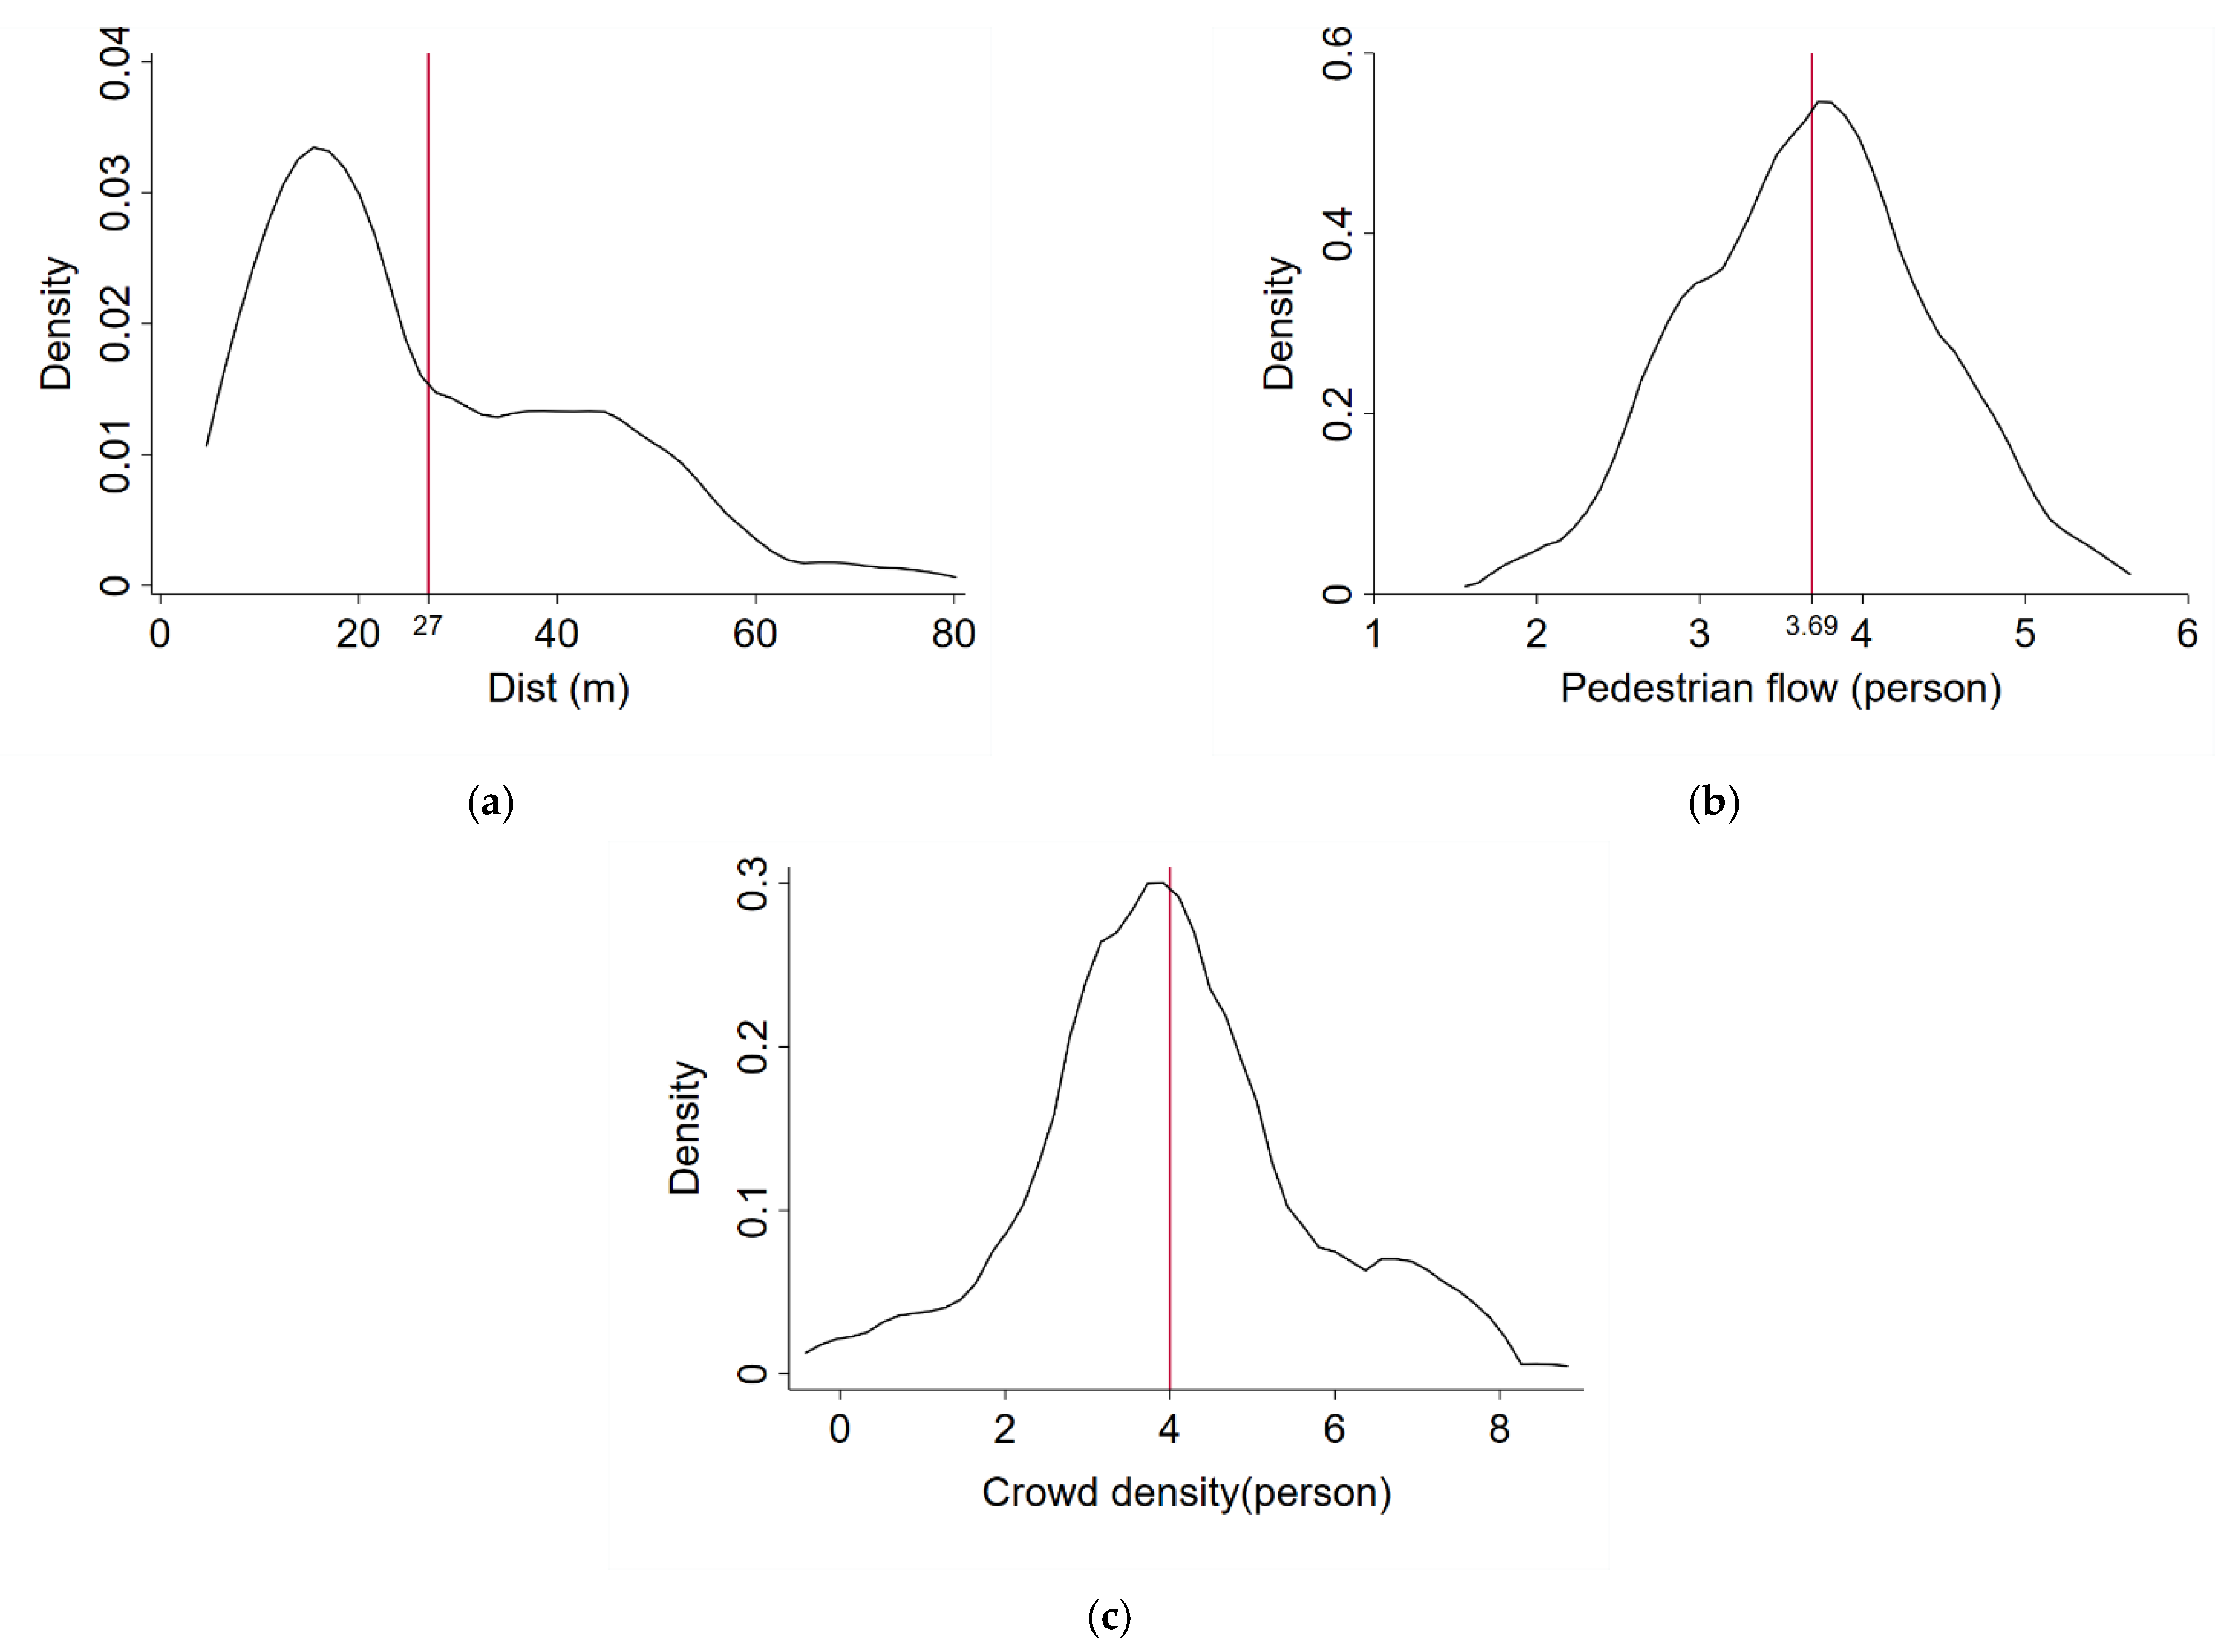
4.3. The Verification of Preference Heterogeneity

In this section, we use the methods of skewness coefficient and kernel density estimation to verify the passengers’ preference heterogeneity.
The skewness coefficient [38] is the characteristic value that represents the asymmetry degree of the probability distribution density curve relative to the average value. The calculation formula of skewness is as follows:
S K ( X ) = u M 0 σ
μ = E X
σ 2 = E X 2 μ 2
where S k e w ( X ) is the skewness coefficient of influencing factors, X is the value of influencing factors, μ is the mean value of influencing factors and σ 2 is the variance of influencing factors.
When S k e w ( X ) > 0 , it means that the value of influencing factors is concentrated in a small range, and when S k e w ( X ) < 0 , it means that the value of influencing factors is concentrated in a large range. The greater the absolute value of skewness, the greater the skewness of its data distribution. In Table 5, we calculate not only the mean and the median, but also the skewness coefficient.
The kernel density estimation [39] is a method used to study the characteristics of data distribution from the data sample itself, which is a nonparametric method for estimating the probability density function. Therefore, it has been highly valued in the field of statistical theory and application. The calculation formula of the kernel density is as follows:
f h ( x ) = 1 n h ( i = 1 n K ( x x i h )
where K ( . ) is the kernel function, h is a smoothing parameter, and h > 0, and n is the total amount of data.
The kernel density maps of the three influencing factors were obtained by the kernel density estimation method based on Formula (10), as shown in Figure 4a–c. The red line represents the position of the average value in Figure 4a–c.
It can be seen from Table 5 that the absolute value of the skewness coefficient of “Dist” is 0.93, which is much greater than the absolute value of the skewness coefficients of “Pedestrian flow” and “Crowd density”. This showed that the distribution of “Dist” is relatively concentrated, which is proven in Figure 4a. The value of “Dist” distribution is mainly concentrated on the left side of the mean value; that is, most people will choose the nearest exit for evacuation. This finding further verifies that “Dist” has the lowest heterogeneity. The distribution of “Pedestrian flow” and “Crowd density” are relatively scattered, as seen from Figure 4b,c, and the selected results are basically symmetrically distributed with the average value as the center. This finding further verifies that the heterogeneity of “Pedestrian flow” and “Crowd density” levels are higher than that of “Dist”.

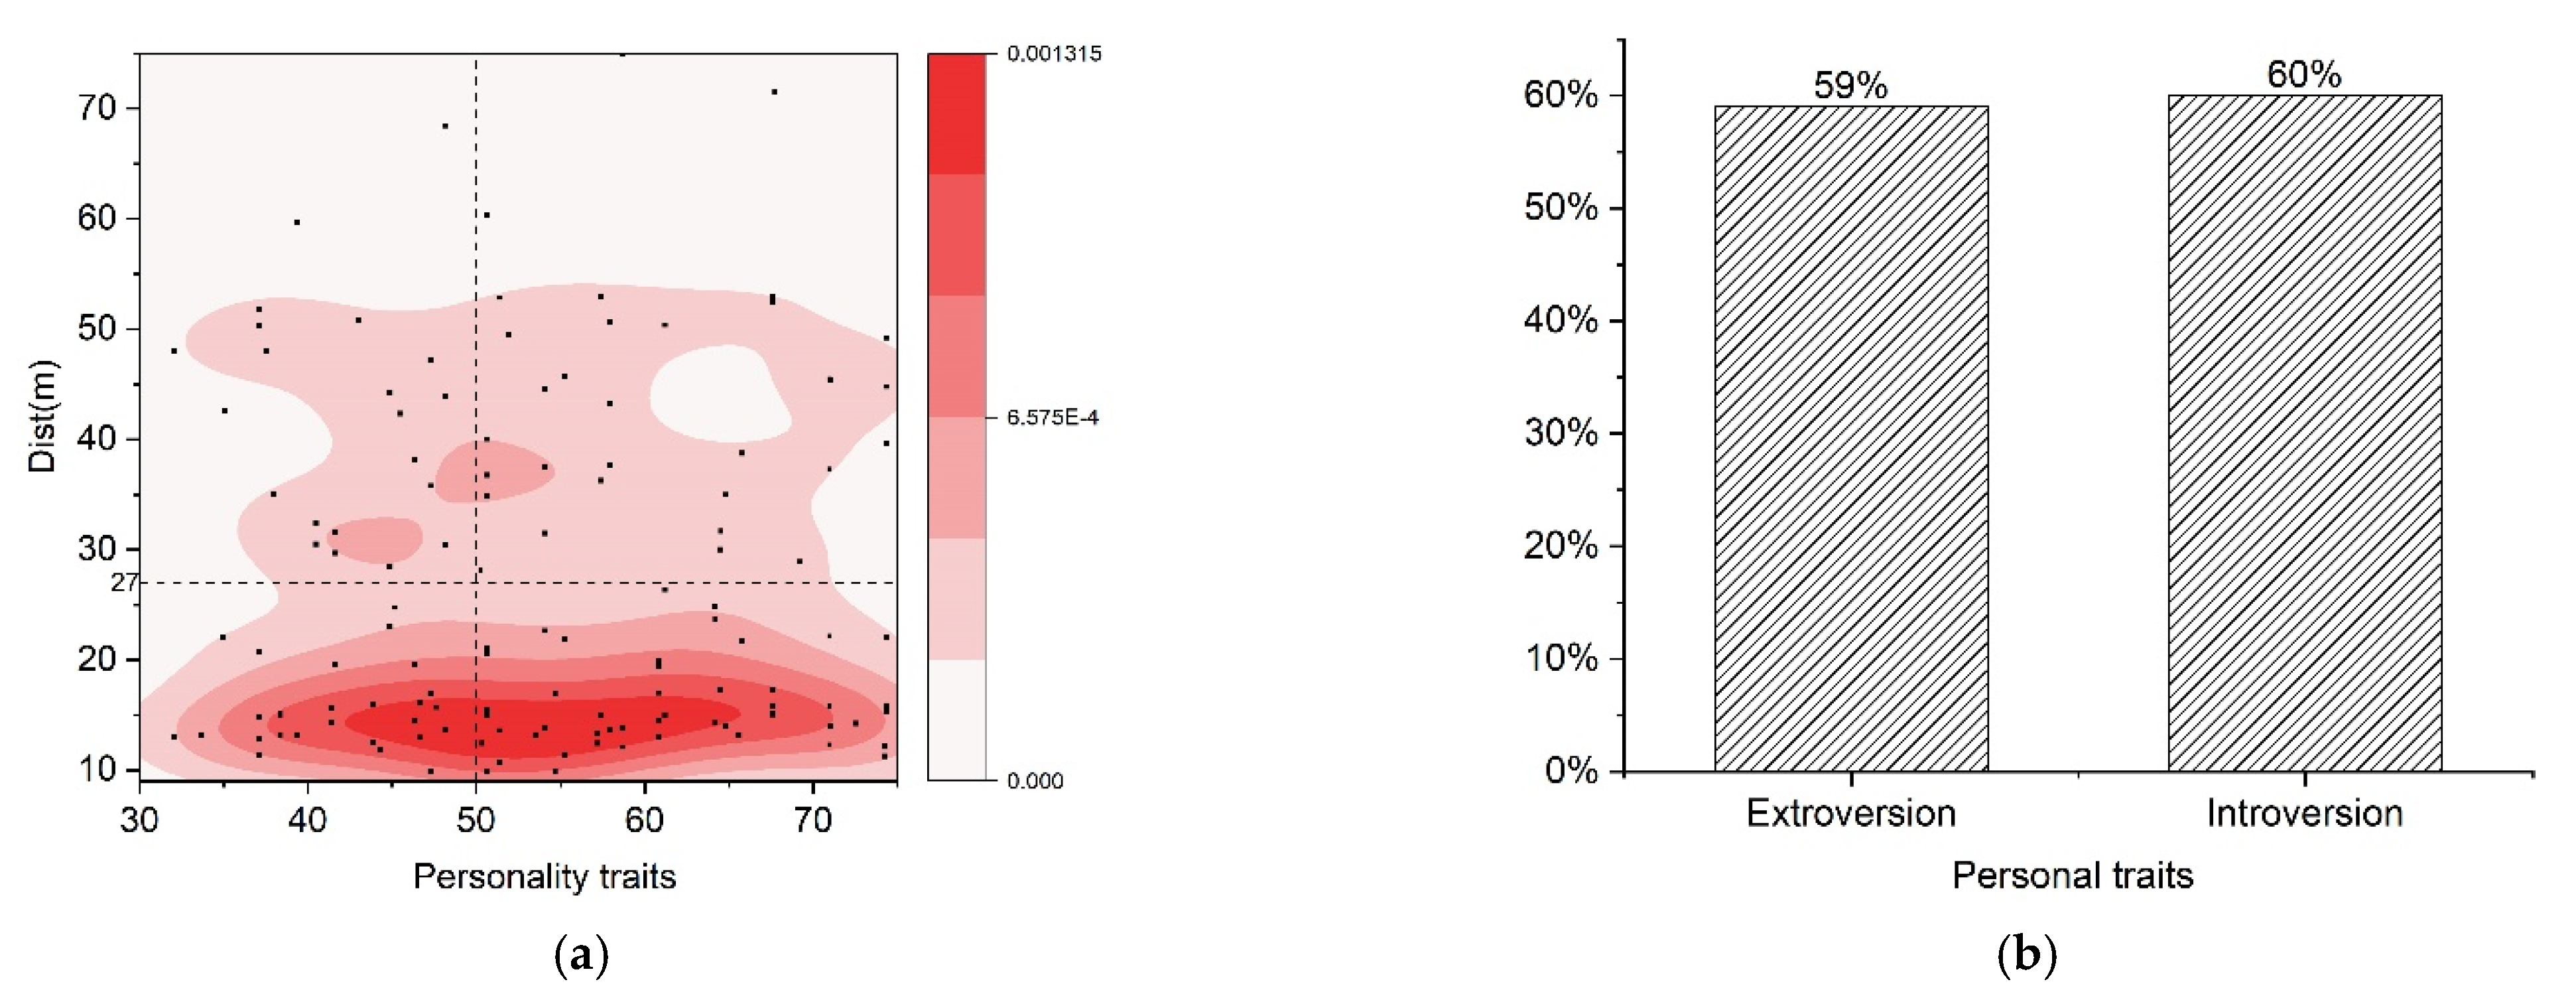
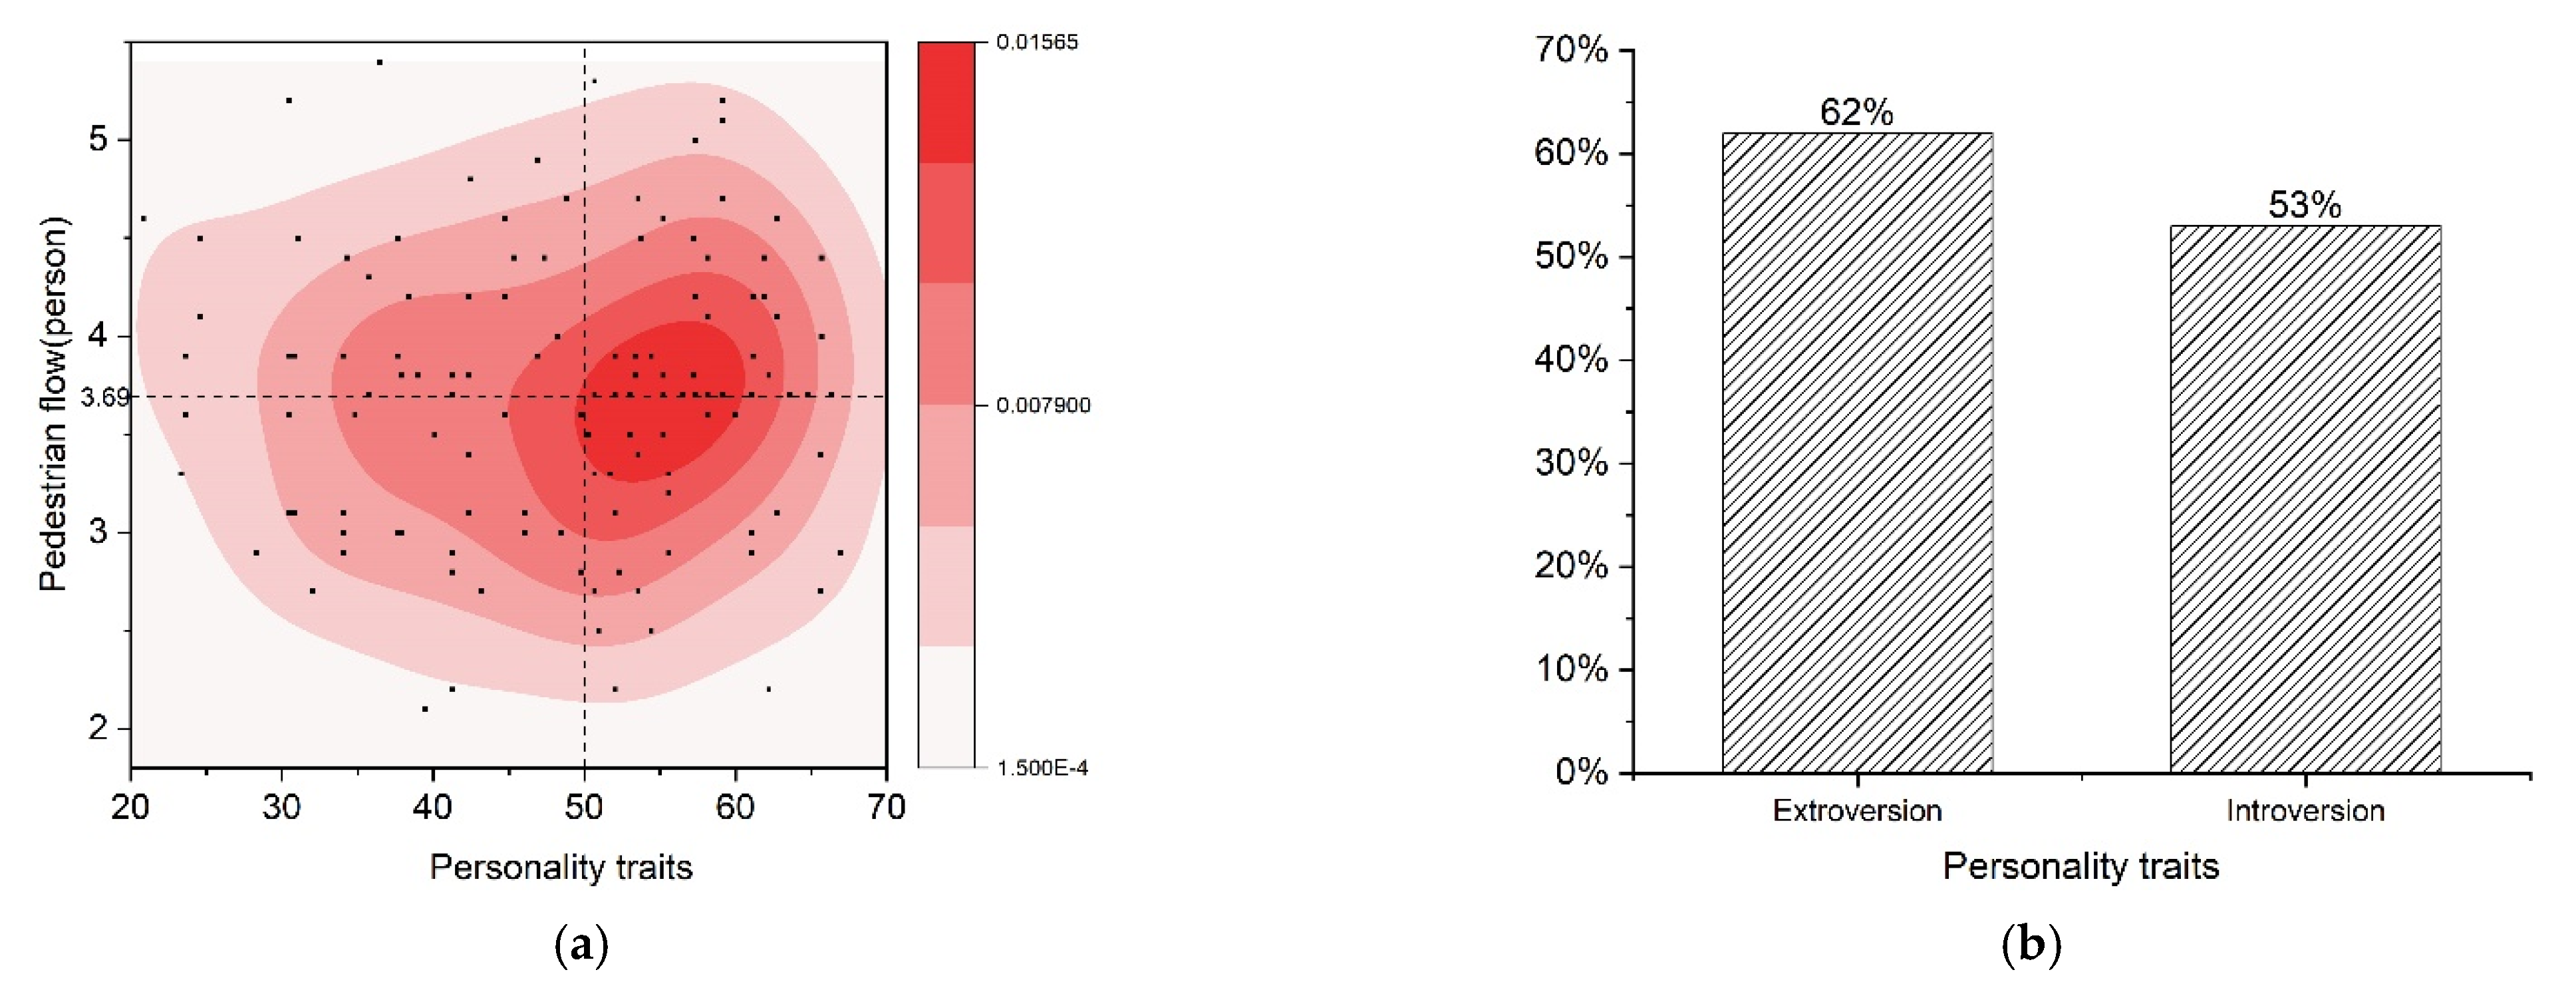
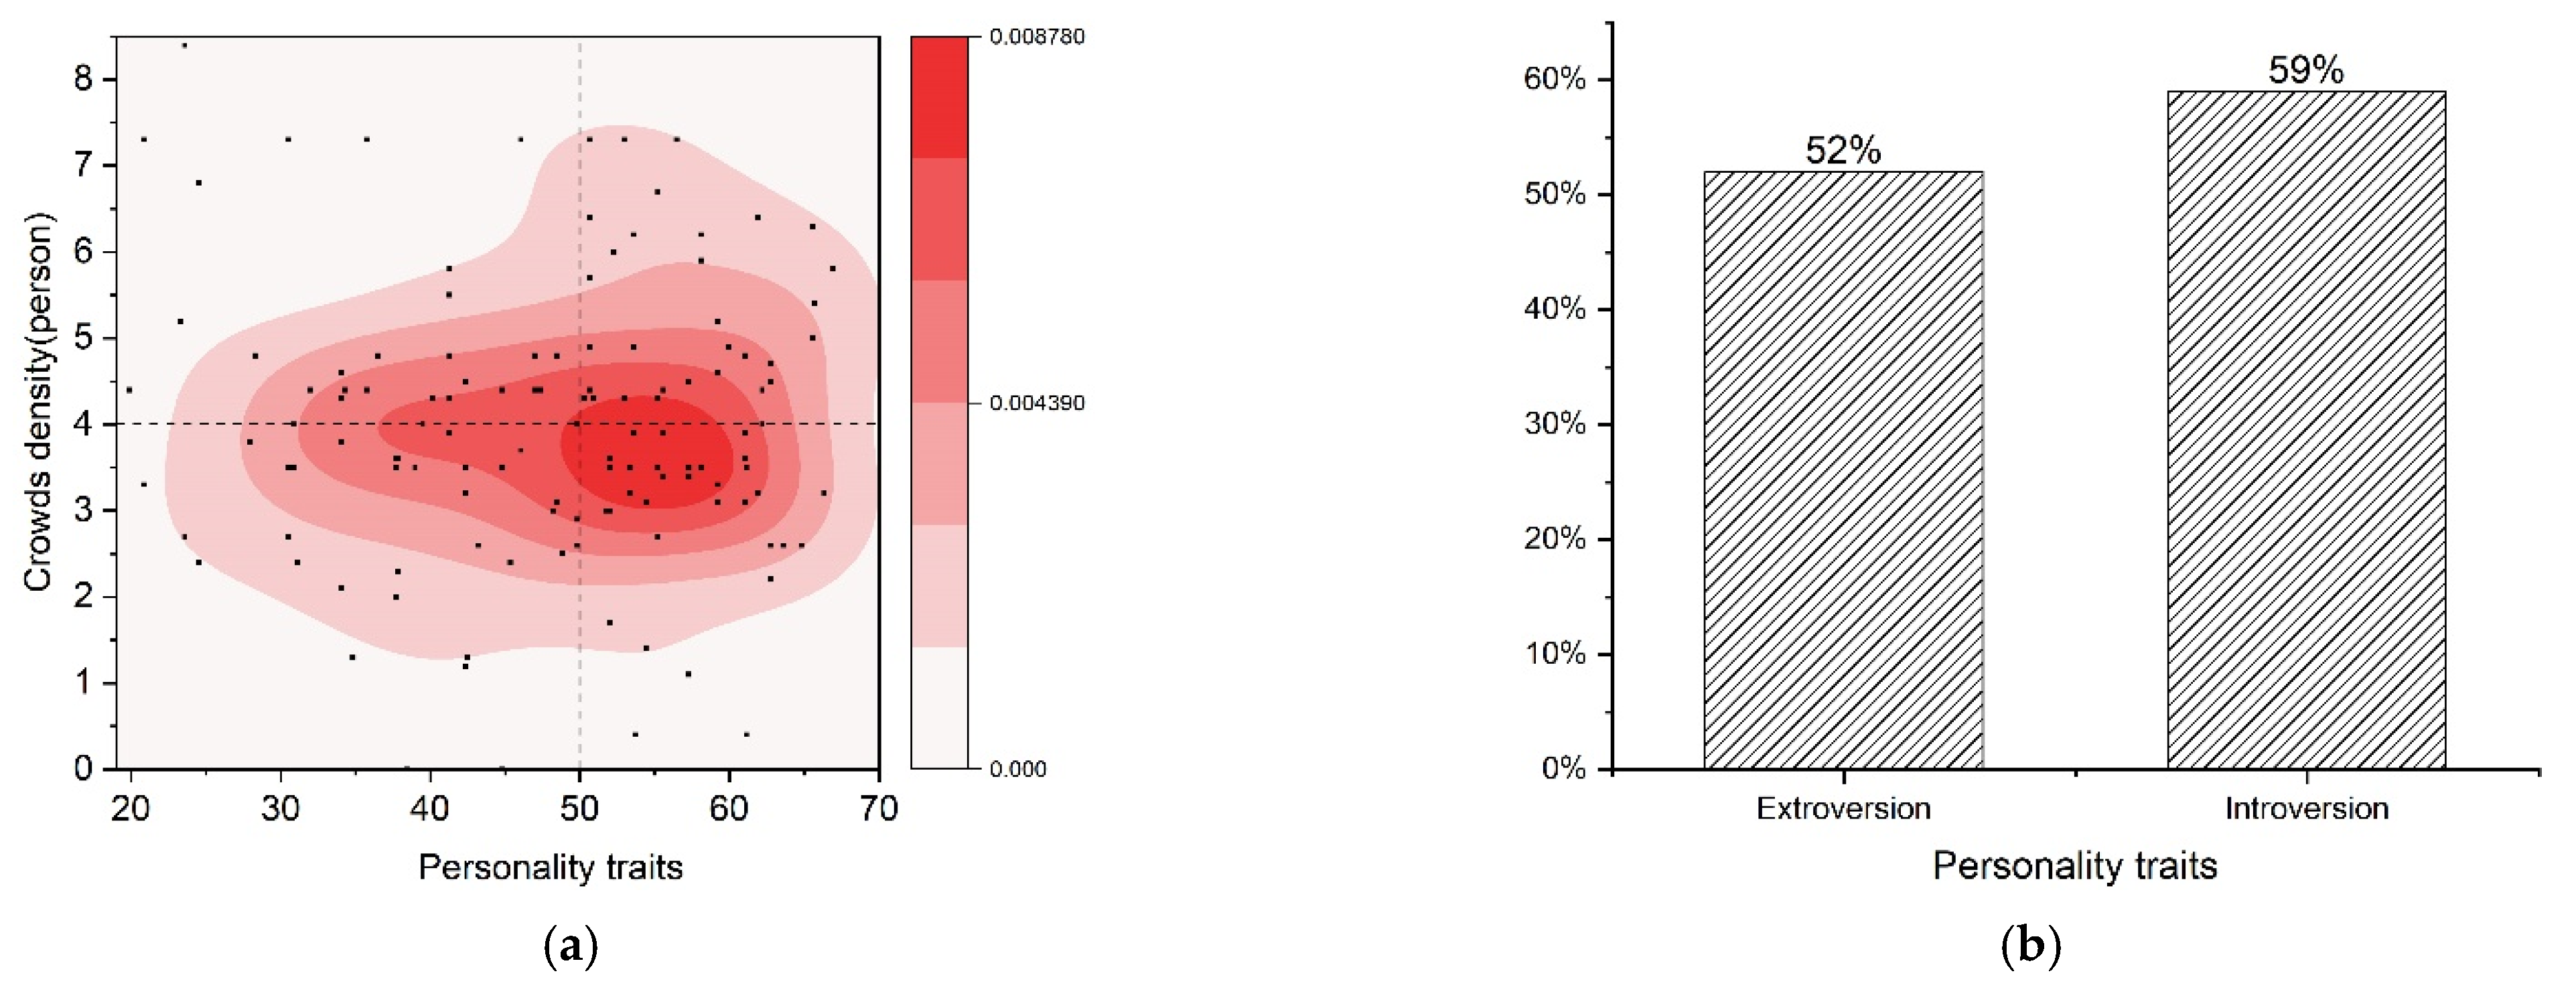
4.4. The Relationship between Passengers’ Personality Traits and Preference Heterogeneity

Firstly, the value of the influencing factors corresponding to the scheme selected by each passenger was obtained according to the method in Section 3.1. Secondly, the personality trait value of each passenger was calculated according to the method in Section 3.3. Finally, we took the personality traits of passengers as the abscissa and the influencing factors as the ordinate to obtain the thermal map, which is shown in Figure 5, Figure 6 and Figure 7. Figure 5 shows the relationship between the passengers’ personality (introverted or extroverted) and the distance of the selected exit. Figure 6 shows the relationship between the passengers’ personality (introverted or extroverted) and the size of the flow of passengers who evacuate to the selected exit. Figure 7 shows the relationship between the passengers’ personality (introverted or extroverted) and the passenger density at the selected exit.
Table 1 showed that the average value of “Dist” is 27 m. In addition, Table 3 showed that the selection results are negatively correlated with the influencing factor “Dist”. Therefore, we mainly count the data that are less than the average value. Figure 5a clearly showed that the value of “Dist” selected by introverted and extroverted passengers is mostly concentrated below 27 m. Figure 5b showed that the proportion of introverted passengers and extroverted passengers with “Dist” < 27 m is basically the same. This also showed indirectly that “Dist” has the least heterogeneity, and both introverted and extroverted passengers will give priority to the nearest exit.
Table 1 showed that the average value of “Pedestrian flow” is 3.69 people. Meanwhile, Table 3 showed that the selection results are positively correlated with the influencing factor “Pedestrian flow”. Therefore, we mainly count the data that are more than the average value. The distribution of data is relatively scattered on the whole, but we found that the data were relatively concentrated near the average value of 3.69, which is consistent with the results shown in Figure 4b. When the value of “Pedestrian flow” is greater than 3.69, the proportion of extroverted passengers is 9% higher than that of introverted passengers; that is, extroverted passengers are more likely to follow a large crowd for evacuation.
Table 1 showed that the average value of “Crowd density” is 4.01 people. In addition, Table 3 showed that the selection results are negatively correlated with the influencing factor “Crowd density”. Therefore, we mainly count the data that are less than the average value. The distribution of data is relatively scattered, but the partial data were relatively concentrated near the average value of 4.01, which is consistent with the results shown in Figure 4c. When the value of “Crowd density” is smaller than 4.01, the proportion of introverted passengers is 7% higher than that of extroverted passengers; that is, introverted passengers are more likely to avoid dense crowds.

5. Discussion

The similar results about heterogeneity of passengers’ evacuation preference were obtained in [40]. The authors of reference [40] also verified the heterogeneity of the influencing factors “Dist”, “Pedestrian flow” and “Crowd density”. However, we concluded that the factor “Pedestrian flow” is positively correlated with export choice, which was contrary to the conclusion in [40]. The data in [40] were investigated in Australia, while the data in this paper are from China. The different educational and cultural backgrounds of the two countries may cause the opposite results of the influencing factor of “Pedestrian flow”. However, the research results of the influencing factor of “Pedestrian flow” of this paper are more in line with the “herding effect” [41]; that is, people will show a tendency of collective behavior, which is called the herd effect in cases of emergency escape. We further proved that “Dist” has less heterogeneity than “Pedestrian flow” and “Crowd density” by skewness coefficient and kernel density estimation, which are not further explained in [40].
The research on the relationship between passengers’ personality traits and evacuation behavior preference heterogeneity has not been seen in other studies. In this article, we concluded that the extroverted passengers were more likely follow a large crowd for evacuation, referring to “Pedestrian flow”. In the Eysenck Personality Questionnaire [35], it is pointed out that extroverts easily show their emotions and are impulsive, and like to participate in parties with many people, which explains why the extroverted passengers were more likely to follow a large crowd for evacuation to some extent. As for “Crowd density”, we concluded that the introverted passengers were more likely to avoid dense crowds. In [35], it is stated that introverts are quiet, isolated and prefer to be alone rather than contact people, which also explains why the introverted passengers were more likely to avoid dense crowds.
The results showed that passengers have different preferences for different influencing factors during evacuation; that is, the utility weight of the influencing factors is different. In other words, these weights have different distributions in the crowd, and there is heterogeneity in passengers’ decision preferences. At the same time, we also found that passengers with different personality traits have different perceptions of influencing factors. The research results provide a new idea for improving the accuracy of passenger emergency evacuation prediction in subway stations. However, we only considered the relationship between personality traits and evacuation behavior preference in this paper. In the follow-up study, the effects of gender, age, physical strength and other passenger factors on evacuation behavior preference can be considered.

6. Conclusions

This paper used the random coefficient logit model to study the influence of three factors: “Dist”, “Pedestrian flow” and “Crowd density”, on the exit decision of subway station passengers’ emergency evacuation. The model results showed that “Dist” and “Crowd density” have a negative utility impact on passengers’ exit decision; on the contrary, “Pedestrian flow” has a positive utility impact on passengers’ exit decision. In the utility function, the parameters of “Dist”, “Pedestrian flow” and “Crowd density” are random variables and have preference heterogeneity. The influencing factor “Dist” showed the lowest level of heterogeneity, and the influencing factors “Pedestrian flow” and “Crowd density” showed a slightly higher level of heterogeneity. In other words, passengers’ perception of distance is more concentrated; that is, most passengers will choose the nearest exit for escape.
We also found that passengers with different personality traits have different perceptions on influencing factors. There was no significant difference in perceptions between introverted passengers and extroverted passengers on the influencing factor “Dist”. However, the extroverted passengers were more likely follow a large crowd for evacuation on the influencing factor “Pedestrian flow”, and the introverted passengers were more likely to avoid dense crowds on the influencing factor “Crowd density”.

Author Contributions

Conceptualization, H.W., T.X. and F.L.; methodology, H.W., T.X. and F.L.; writing—original draft preparation, H.W.; writing—review and editing, H.W., Z.J. and F.L. All authors have read and agreed to the published version of the manuscript.

Funding

This research is supported by the National Natural Science Foundation of China (71671109).

Institutional Review Board Statement

Not applicable.

Informed Consent Statement

Not applicable.

Data Availability Statement

The data presented in this study are available upon request from the corresponding author. The data are not publicly available as the participants of this study did not agree for their data to be shared publicly.

Conflicts of Interest

The authors declare no conflict of interest.

References

  1. Sakamoto, M.; Sasaki, D.; Ono, Y.; Makino, Y.; Kodama, E.N. Implementation of evacuation measures during natural disasters under conditions of the novel coronavirus (COVID-19) pandemic based on a review of previous responses to complex disasters in Japan—ScienceDirect. Prog. Disaster Sci. 2020, 8, 100127. [Google Scholar] [CrossRef]
  2. Malebary, S.J.; Basori, A.H.; Alkayal, E.S. Reinforcement learning for Pedestrian evacuation Simulation and Optimization during Pandemic and Panic situation. J. Phys. Conf. Ser. 2021, 1817, 12008. [Google Scholar] [CrossRef]
  3. Zhang, T. Discussion on Influencing Factors of fire evacuation in subway station. Fire Sci. Technol. 2015, 12, 1594–1597. [Google Scholar]
  4. Pan, F.Q.; Qi, R.J.; Wang, J.; Zhang, L.x.; Pan, H.T. Analysis on causes of special subway events and influencing factors of crowd evacuation. Transp. Technol. Econ. 2018, 20, 4–8, 13. [Google Scholar]
  5. Liu, Y.; Shen, F.M.; Wang, X.F. Study on Influencing Factors of evacuation route selection in subway station hall. J. Fuzhou Univ. 2018, 46, 410–415. [Google Scholar]
  6. Xu, T.D. Big-Data-Driven ATMS: Driver Behavior Automatic Calibration, Modeling and Application; University of Florida, Scholars’ Press: Gainesville, FL, USA, 2015; ISBN 9781495176913. [Google Scholar]
  7. Xu, T.D. Climate Change and Transportation Adaptation Analysis: Dynamic Travel Behavior and Active Traffic Routing and Control Modeling for Regional Evacuations; University of Florida, Scholars’ Press: Gainesville, FL, USA, 2015; ISBN 9781495176937. [Google Scholar]
  8. Xu, T.D.; Hao, Y. Active group route guidance based on DODE: A novel modeling framework integrating dynamic driver behavior. Can. J. Civil. Eng. 2021, 48, 776–784. [Google Scholar] [CrossRef]
  9. Xu, T.D.; Guan, J.P.; Hao, Y.; Sun, D.J. Real-time traffic state predictor based on dynamic traveller behaviour. P. I. Civil. Eng.-Transp. 2021, 5, 1–11. [Google Scholar] [CrossRef]
  10. Helbing, D.; Buzna, L.; Johansson, A.; Werner, T. Self-organized pedestrian crowd dynamics: Experiments, simulations, and design solutions. Oper. Res. 2005, 39, 1–24. [Google Scholar] [CrossRef] [Green Version]
  11. Blue, V.; Adler, J. Emergent Fundamental Pedestrian Flows from Cellular Automata Microsimulation. Transp. Res. Rec. 1998, 1644, 29–36. [Google Scholar] [CrossRef]
  12. Li, X.; Hong, L.; Xu, R.H. Analysis on Influencing Factors of psychological behavior of emergency evacuation passengers in rail transit stations. Urban Rail. Transit. Res. 2012, 4, 54–57. [Google Scholar]
  13. Wu, J.Z. Research on Emergency Metro Evacuation Simulation in Fire; Southwest Jiaotong University: Chengdu, China, 2016. [Google Scholar]
  14. Lan, S.M. Research on Emergency Evacuation for High-Speed Railway Station; Southwest Jiaotong University: Chengdu, China, 2014. [Google Scholar]
  15. Kobes, M.; Helsloot, I.; De Vries, B.; Post, J.G. Building safety and human behavior in fire: A literature review. Fire Saf. J. 2010, 45, 1–11. [Google Scholar] [CrossRef]
  16. Hoogendoorn, S.P.; Bovy, P.H.L. Pedestrian route-choice and activity scheduling theory and models. Transp. Res. Part B Methodol. 2004, 38, 169–190. [Google Scholar] [CrossRef]
  17. Zhang, H.; Xu, J.; Li, S.; Chen, Y. Evacuation Capacity Estimation for Subway Station Based on Queueing Model. In Lecture Notes in Electrical Engineering, Proceedings of the 4th International Conference on Electrical and Information Technologies for Rail Transportation (EITRT); Springer: Berlin/Heidelberg, Germany, 2019. [Google Scholar]
  18. Zhong, M.; Shi, C.; Tu, X.; Fu, T.; He, L. Study of the human evacuation simulation of metro fire safety analysis in China. J. Loss Prev. Process. Ind. 2008, 21, 287–298. [Google Scholar] [CrossRef]
  19. Graessle, F.; Kretz, T. An Example of Complex Pedestrian Route Choice. In Pedestrian and Evacuation Dynamics; Springer: Berlin/Heidelberg, Germany, 2010. [Google Scholar]
  20. Jiang, C.S.; Yuan, F.; Chow, W.K. Effect of varying two key parameters in simulating evacuation for subway stations in China. Saf. Sci. 2010, 48, 445–451. [Google Scholar] [CrossRef]
  21. Wu, P.; Yang, S.; Zhang, J.J. Research on agent modeling and simulation of netizen group behavior evolution in network public opinion of emergency. Mod. Libr. Inf. Technol. 2015, 31, 65–72. [Google Scholar]
  22. Antonini, G.; Bierlaire, M.; Weber, M. Discrete choice models of pedestrian walking behavior. Transp. Res. Part B 2006, 40, 667–687. [Google Scholar] [CrossRef]
  23. Lovreglio, R.; Borri, D.; dell’Olio, L.; Ibeas, A. A discrete choice model based on random utilities for exit choice in emergency evacuations. Saf. Sci. 2014, 62, 418–426. [Google Scholar] [CrossRef]
  24. Duives, D.; Mahmassani, H. Exit Choice Decisions during Pedestrian Evacuations of Buildings. Transp. Res. Rec. J. Transp. Res. Board 2012, 2316, 84–94. [Google Scholar] [CrossRef]
  25. Wang, F.; Chen, J.C.; Zhang, D.X. The application of stated preference survey on traffic mode split model. J. Transp. Syst. Eng. Inf. Technol. 2007, 5, 90–95. [Google Scholar]
  26. Rose, J.M.; Hess, S. Dual-Response Choices in Pivoted Stated Choice Experiments. Transp. Res. Rec. J. Transp. Res. Board 2009, 2135, 25–33. [Google Scholar] [CrossRef] [Green Version]
  27. Train, K.; Wilson, W.W. Estimation on stated-preference experiments constructed from revealed-preference choices. Transp. Res. Part B Methodol. 2008, 42, 191–203. [Google Scholar] [CrossRef]
  28. Wilson, T. Monte Carlo analysis of SP-off-RP data. J. Choice Model. 2009, 2, 101–117. [Google Scholar]
  29. Train, M.F. Mixed MNL models for discrete response. J. Appl. Econom. 2000, 15, 447–470. [Google Scholar]
  30. Jin, P.H. Medical Statistical Methods, 2nd ed.; Fudan University Press: Shanghai, China, 2003. [Google Scholar]
  31. Liu, J.R.; Hao, X.N. Travel mode choice in city based on random parameters logit model. J. Transp. Syst. Eng. Inf. 2019, 5. [Google Scholar]
  32. Costa, P.T.; Mccrae, R.R. Personality in Adulthood: A Five-Factor Theory Perspective. Int. Cult. Psychol. 2002. [Google Scholar]
  33. Eysenck, H.J. The Structure of Human Personality. J. Consult. Psychol. 1954, 18, 75. [Google Scholar]
  34. Chen, Z.G. Item analysis of Eysenck Personality Questionnaire. J. Psychol. 1983, 15, 85–92. [Google Scholar]
  35. Qian, M.Y.; Wu, G.C.; Zhu, R.C.; Zhang, X. Revision of Eysenck Personality Questionnaire. J. Psychol. 1984, 3, 317–323. [Google Scholar]
  36. Hensher, D.A.; Rose, J.M.; Greene, W.H. Applied choice analysis: NLOGIT for applied choice analysis: A primer. In Applied Choice Analysis: A Primer; Cambridge University Press: Cambridge, UK, 2005. [Google Scholar]
  37. Cao, B. A new car-following model considering driver's sensory memory. Phys. A Stat. Mech. Its Appl. 2015, 427, 218–225. [Google Scholar] [CrossRef]
  38. Wen, L.M.; Zou, S.S.; Lv, F.H. Reliability estimation of skewness coefficient and kurtosis coefficient. Stat. Decis. Mak. 2015, 3, 24–25. [Google Scholar]
  39. Tang, L.; Yang, H.; Zhang, H. The application of the Kernel Density Estimates in predicting VaR. Math. Pract. Theory 2005, 35, 29–35. [Google Scholar]
  40. Haghani, M.; Sarvi, M. Pedestrian crowd tactical-level decision making during emergency evacuations. J. Adv. Transp. 2016, 50, 1870–1895. [Google Scholar] [CrossRef]
  41. Helbing, D.; Farkas, I.; Vicsek, T. Simulating dynamical features of escape panic. Nature 2000, 407, 487–490. [Google Scholar] [CrossRef] [Green Version]
Figure 1. The scenario 1 in the experiment.
Sustainability 13 12540 g001
Figure 2. The mean estimation of the efficiency coefficient.
Sustainability 13 12540 g002
Figure 3. The marginal probability of estimated coefficients. (a) The marginal probability of estimated coefficient “Dist”; (b) The marginal probability of estimated coefficient “Pedestrian flow”; (c) The marginal probability of estimated coefficient “Crowd density”.
Sustainability 13 12540 g003
Figure 4. The kernel density estimate of the influence factors. (a) The kernel density estimate of “Dist”; (b) The kernel density estimate of “Pedestrian flow”; (c) The kernel density estimate of “Crowd density”.
Sustainability 13 12540 g004
Figure 5. The relationship between personality traits and “Dist”. (a) The thermodynamic diagram of personality and “Dist”; (b) The proportion of introverted passengers and extroverted passengers with “Dist” < 27 m.
Sustainability 13 12540 g005
Figure 6. The relationship between personality traits and “Pedestrian flow”. (a) The thermodynamic diagram of personality and “Pedestrian flow”; (b) The proportion of introverted passengers and extroverted passengers with “Pedestrian flow” > 3.69 people.
Sustainability 13 12540 g006
Figure 7. The relationship between personality traits and “Crowd density”. (a) The Thermodynamic diagram of personality and “Crowd density”; (b) The proportion of introverted passengers and extroverted passengers with ““Crowd density” < 4.01 people.
Sustainability 13 12540 g007
Table 1. The interpretation of the meaning of the experimental independent variables.
Independent VariableMeaning of Independent VariableUnit
Distthe distance from passenger location to subway station exitm
Pedestrian flowthe flow of “passengers” evacuating to an exitperson
Crowd densitythe number of “passengers” at the exitperson
Table 2. The average ratings of the “Extroversion scale” based on the proportion of the Chinese population.
SexAgeMSD
Male16–197.742.77
20–298.052.67
30–397.822.68
40–497.342.88
50–596.952.98
60–697.083.01
706.893.08
Female16–198.132.58
20–297.442.79
30–397.502.87
40–497.152.86
50–596.922.90
60–697.282.95
707.283.48
Table 3. The regression results of random parameter logit model.
Independent
Variable
CoefficientStandard
Deviation
Zp95% Confidence
Interval
Dist−0.1010.016−6.430.000[−0.132, −0.070]
Pedestrian flow0.2360.0783.040.002[−0.388, −0.084]
Crowd density−0.4420.105−4.220.000[−0.648, −0.237]
Note: Z stands for statistics of standard normal distribution; p < 0.05 is significant.
Table 4. The standard deviation regression results of random parameter logit model coefficients.
Independent
Variable
CoefficientStandard
Deviation
Zp95% Confidence
Interval
Dist0.1190.0215.670.000[0.084, 0.167]
Pedestrian flow0.8900.2214.030.000[0.548, 1.447]
Crowd density0.3960.1342.960.003[0.204, 0.770]
Note: Z stands for statistics of standard normal distribution; p < 0.05 is significant.
Table 5. The coefficient of skewness of influence factors.
Independent VariableSkewness CoefficientMean ValueMedian
Dist0.9327.0020.89
Pedestrian flow−0.013.693.70
Crowd density0.194.013.90
Publisher’s Note: MDPI stays neutral with regard to jurisdictional claims in published maps and institutional affiliations.

