
Spatial and Temporal Evolution of Dairy Farming Coordination between Economy and Ecology in China


School of Economics & Management, Inner Mongolia University, Hohhot 010021, China
*
Author to whom correspondence should be addressed.
Sustainability 2021, 13(22), 12618; https://0-doi-org.brum.beds.ac.uk/10.3390/su132212618
Submission received: 7 September 2021
/
Revised: 6 November 2021
/
Accepted: 11 November 2021
/
Published: 15 November 2021
(This article belongs to the Topic New Trends in Agri-Food Sector: Environmental, Economic and Social Perspectives)
Abstract
:This paper focuses on the theme of the sustainable dairy industry and explores the coordination between the economy and ecology in dairy farming. Specifically, we constructed a composite dairy economy and ecology (DEE) system to evaluate the status of dairy farming. Based on the panel data of the nine primary milk producing provinces in China from 2003 to 2018, we estimated DEE changes with the coupling coordination degree model from perception of time. We then applied spatial autocorrelation model to analyze spatial heterogeneity. The results show that: (1) Seven of the nine provinces had experienced the three-stage process of economic lag–ecological lag–economic lag. Only Xinjiang and Ningxia have experienced the first two stages and are currently going through the economic lag status. (2) The coupling degree of DEE increased rapidly and has fluctuated around 0.5 since 2009. Furthermore, the degree of coordination of DEE went up continuously, and there was obvious regional differentiation. (3) Reduction of large-scale dairy farms is conducive to coordination between the dairy economy and ecology. (4) The positive spatial spillover effect on the coordination of DEE was not temporally steady. Our findings provide relevant evidence for improving the relationship between the economy and ecology for the sustainability of the dairy industry.
1. Introduction
As an important sector of agriculture and food production, dairy farming is one of the largest drivers of climate change, mostly because of the greenhouse gas (GHG) emissions produced by ruminating animals, as well as the large amount of cow fecal material, raw sewage, and energy consumption. Unlike the dairy industry, which predominantly consists of family ranches in developed countries, the expansion of the scale of the Chinese dairy industry is mainly based on industrialization, and the number of large-scale dairy farms with more than 1000 cows has been increasing continuously over the past 20 years. Under this pattern, the planting of dairy cattle forage and breeding have been separated, which has caused high explicit and implicit economic costs. The treatment of cow feces and sewage takes a significant part, and the overall level of technical efficiency and cost efficiency is low [1]. Noting the serious ecological influence, the government began to implement policies such as encouraging farmers to utilize facilities and equipment to generate biogas power from cattle dung, but with little effect to date. With the expansion of large-scale farming, it is crucial to discern the current status of the dairy economy and ecology precisely and to propose feasible solutions for the sustainability of the Chinese dairy industry.
Cows, a kind of ruminant, produce large amounts of ruminal methane during the digestion of high-fiber diets [2], which cannot be utilized directly. Specifically, a 550-kg dairy cow produces 30–50 kg of feces, 15–25 kg of urine, and 15–20 L of sewage per day. Amounts of contaminants, including feces and urine, which have not been thoroughly processed, or simply processed, are directly discharged into the environment. The lack of processing makes it difficult to degrade pollutants in a short amount of time in natural ecosystems and also causes significant environmental damage. Most of the water used in dairy farms is not charged or symbolically charged [3], which leads to excessive water use in farms, resulting in the unnecessary waste of water resources. In addition, the content of pollutants emitted in dairy farms is related to the scale of cultivation; the emissions of nitrogen, phosphorus, heavy metals, and other trace elements derived from the feces produced at large-scale dairy farms are higher than those of free-range dairy farms [4].
The existing research on the economic and ecological systemic problems of the dairy industry has been limited and has focused mainly on qualitative theoretical guidance. Based on the analysis of the pollution of intensive dairy farming and effective ecological between planting and livestock breeding industry in traditional agricultural areas in China, Dong et al. [5,6] originally proposed that imperative attention should be paid to the pollution in dairy farming and sustainability is an inevitable requirement for the development of dairy industry. Comparing the manure-processing technology of American and Chinese cattle farms, Li et al. [7] emphasized that recycling manure in dairy cattle breeding can not only improve the efficient use of resources but also can increase the economic benefits of cattle farms. Liao and Wei [8] studied the regional economic and ecological effects of Nanshan Ranch’s ecological dairy industry, proposed the main countermeasures for its sustainable development, and provided a practical basis for the economic and ecological dairy development. Pan [9] found that the treatment of manure in dairy cattle breeding and management is a worldwide environmental problem. Taking the measures for manure treatment followed by U.S. dairy farms as a comparison, he analyzed the circular economy factors that have restricted China’s dairy industry. Gerssen-Gondelach et al. [10] concluded that there are huge GHG emission reductions in dairy production in the pasture system of developing countries. In addition, potentially reducing land use changes is usually the most important strategy to reduce GHG emissions in dairy production. Capper and Cady [11] noted that, in the production system of the dairy industry, enteric and manure emissions have made the largest contributions with (80%) GHG emissions per unit of milk, lesser contributions from crops (7.6%), and fertilizer application (5.3%). Gao et al. [12] used the NUFER-animal model to construct a green development index system for the entire industrial chain of China’s dairy industry and clarified an optimized approach for green development in the industry. Based on the previous research, we attempted to evaluate the current status of the dairy industry’s economy and ecology quantitatively.
In this paper, we built a composite evaluation index system – economic–ecological system (EES), including the economic subsystem and ecological subsystem, based on the characteristics of dairy farming. Due to the different types and units of index data in the two evaluation subsystems, the indices cannot be compared directly. Each index has positive and negative effects on the subsystem. Thus, we standardized the indices in the subsystem to eliminate problems associated with measurement units as well as with these positive and negative effects. By deconstructing the dairy farming system from the perspective of the economy and ecology, it can provide a unified research framework.
Our method is based on the theory of synergy, which notes that coordination is the optimal relationship between the regional economic and ecological system, as well as the ultimate foothold to ensure sustainable development in the region. So, we used the coupling–coordination degree model to measure the relationship between the dairy economic system and the ecosystem. In addition, we applied the methodology of spatial statistics to study whether a spatial autocorrelation exists between the economy and ecology in the major milk-producing provinces concentrated in northern China.
The results indicate that the degree of coordination of DEE has been negatively associated with the number of dairy farms in recent years, which is particularly prominent in traditional pastoral areas. We also found that the degree of the coordination of DEE of major dairy-producing regions in China was not randomly distributed, but rather was based on the agglomeration state of different spatial locations.
2. Theoretical Framework
2.1. Background
According to the widely cited 2006 report by the United Nations Food and Agriculture Organization (FAO), 7516 million metric tons of CO2 per year, an equivalent of (CO2e), or 18% of annual GHG around the world, have been attributed to livestock farming. Moreover, the livestock sector’s contribution of 14.5% of total anthropogenic GHG emissions was evaluated by using a global livestock environmental assessment model (GLEAM). Animals that contribute the most to livestock GHG emissions are beef and dairy cattle, accounting for 65% of the total livestock GHG emissions [13]. The rapid development of dairy farming has caused significant environmental problems, including massive accumulation of feces and emissions of wastewater. If these issues are not promptly addressed, they will have a devastating effect on the future development of dairy farming.
Huge amounts of animal and poultry waste have been produced with the rapid development of the intensive livestock and poultry industry, which has caused serious environmental problems. Nitrogen, phosphorus, mineral elements, malodorous substances, biological pathogens, and drug additives are the main components of husbandry fecal pollution. Improper feed ingredients directly lead to the high percentage of the contaminative source in livestock manure [14]. A tremendous amount of sewage from livestock and poultry breeding discharged directly into the environment without proper treatment could heavily degrade the soil quality and contaminate the water systems. Li et al. [15] indicated that the U-shaped environmental Kuznets curve of the N index is associated with livestock and poultry breeding. With economic growth and changing consumption, the problems caused by the animal husbandry model may become increasingly complicated. According to the investigation of the heavy metal pollution in poultry feed and feces under intensive cultivation in Jiangsu Province, Cang et al. [16] found that the content of metal in a great majority of feed samples exceeded the national health standards. To study the heavy-metal pollution chain of feed–feces–soil, Xu et al. [17] collected livestock and poultry breeding and feces data in China from 2000 to 2018 and explored the reduction of heavy metals in cow dung with current technology. Hu et al. [18] held that the prevention of feces pollution generated in concentrated animal feeding operations (CAFOs) should be strengthened (e.g., through digesters and integrated farm systems) to minimize the impact on the environment and human health. In addition, the use of veterinary drugs and feed additives in industrial livestock and poultry breeding should be controlled. This would not only improve the quality of animal food but also make the disposal of septic fertilizer more beneficial to farmland.
The eco-environmental problems involved in the agricultural system are quite complex. Therefore, it is crucial to build a comprehensive and focused evaluation model. Bratt and Lierop [19] constructed a model to integrate and analyze various elements in the EES. Costanza [20] started with the value research of the ecosystem service function and built a theoretical foundation for the study of eco-agricultural system coupling. Wier et al. [21] established a coupling model for the agricultural economy and environment, including the submodel of an economic, agricultural, and environmental impact assessment. Turner et al. [22] constructed an evaluation model of economic and environmental policy effects, including a submodel of economic, agricultural, and environmental assessment. Limburg et al. [23] and other scholars conducted in-depth research on the functional value of the ecosystem and its contribution to human beings based on the theory of ecological and economic systems. Since then, the methods of agri–ecosystem coupling [24], measurement [25], driving forces, and modeling have become the research focus of scholars in various countries.
2.2. Theoretical Framework
The high quality of Chinese dairy industry is bound to meet the sustainable development goal, which aligns with the United Nations Sustainable Development Goals set for achievement by 2030, in recognition of dairy’s role in the global effort to address the world’s sustainability issues. According to the theory of industrial ecology, sustainability is an inevitable path that involves the coordinated development of human activity, resources, and the environment [26]. So, it requires people to analyze the industrial system in view of coordination. Focusing on the ecological problems in the dairy farming section, we examined both the economic system and ecological system and studied the ecological problems of the dairy industry in terms of time and space. Dairy manure has the potential to be used as a fertilizer because of its organic nutrient content and low metal content. In most of the developing regions, livestock manure is either used as fuel or handled in dry systems contributing to lower emissions per LU [27]. Solid and liquid separation has been applied extensively, while under current manure management legislation, the utilization of manure fertilizer has not been promoted extensively in China [28].
As shown in Figure 1, from the perspective of an economic–ecological system, economic systems and ecosystems are evolving systems that are physically and energetically connected to the outside world. Both take the flow of material and energy as the basic structure of the system within the system. In the economic system, growth at a certain moment accumulates more energy for growth at the next moment, making it a growth system with positive feedback. The system is evaluated by scale, production capacity, income, and other indices in dairy EES. An ecological system is a stable system with negative feedback, and it requires a relative balance among various material elements in its development. Function and carrying capacity and other indices are always utilized to evaluate the ecological system. From the perspective of time, humans rely on planning and thinking. According to the principle of economies of scale, as the scale of dairy farming continues to rise, there is going to be pressure on ecology when the economic function of the whole system develops to a certain extent. Aware of the seriousness of these ecological problems, people make adjustments to achieve a new balance. Furthermore, the economy, in turn, guides the development of the dairy farming ecology. In terms of spatial distribution, the dairy industry is a resource-intensive industry [29]. Whether a place has regional advantages in the dairy industry is mainly determined by the local supply of raw milk. Temperature, humidity, altitude, and other factors in different regions of dairy farming have important impacts on production capacity. Milk production is inevitably affected by natural resources, generating a spatial agglomeration of specialized production. Generally speaking, a stronger spillover effect is accompanied with a higher level of regional economic development, which promotes local science and technology and improvements of the institutional system. Furthermore, the basic contradictions between the two systems will be weakened by reducing the dependency of the economic system on the ecosystem, so that the restriction of the ecosystem will not be exceeded. Conversely, if the local economy is less developed and has a relatively low level of technology, the regional economic development would be very dependent on the supply of natural resources that it can stimulate the fundamental contradictions between ecological and economic systems.
3. Methods and Data
3.1. Methods
3.1.1. Evaluation Index System
“Eco” is derived from the ancient Greek word οικοs, which originally meant dwelling or habitat. In the Generelle Morphologie, Haeckel [30] included a section entitled “Oecologie und Chorologie”, in which he defined ecology as the study of the organic and inorganic conditions on which life depends. In modern ecology, ecology refers to the living conditions, the process, and rule of the interaction inside the biotic community. Its purpose is to figure out the coordinated development of humans and the biosphere (nature, resources, and environment). Considering the increasingly prominent contradiction between definite resources and economic growth, the concept of ecology has received increasing attention. The academia, still, has not yet reached a unified system standard for how to evaluate the economic and ecological development of a certain industry. Taking the research status in the field of agroecological efficiency as an example, agroecological efficiency has not been effectively scoped, while the definition of ecological efficiency is directly applied to research in the field of agriculture.
Our research began with the concept of ecology, in which the primary subjects are cow breeders and cows, and the object of the system is the natural environment (including 5 criteria levels and 13 indices as shown in Table 1). We considered the characteristics of dairy cattle breeding and the fundamental principles of the evaluation system, then ascertained all the indices. Among these indices, the economic development indices were composed of three rule layers, which we defined from the perspective of (1) milk yield and output, (2) scale of dairy farm, and (3) income and consumption. Economic criteria mainly reflect the economic benefits of dairy farming. Specifically, milk yield and the proportion of dairy farm output value to husbandry farm output report the productivity, number of large dairy farms reflects the structural composition, dairy farm revenue reports the net return of dairy production, and the expenditure of dairy products of urban and rural residents reports the national dairy consumption. The ecological environment indices were composed of two rule layers, which we defined as (1) the status of the ecological issue of dairy farming, and (2) the ecological pressure and potential regarding dairy farming. Ecological criteria mainly include the nitrogen and heavy metal emissions from milk production, GHG emissions. Specifically, the carbon footprint of milk production reports the GHG emissions, the proportion of wastewater emission from dairy farm to industry and heavy metal pollution report the ecological status of dairy farming. Cyclic utilization of manure in dairy farmland, and the fecal contamination risk index for agricultural livestock and the average load-carrying capacity of farmland report the environmental pressures and potential for improvement facing the dairy industry.
3.1.2. Data Standardization and Comprehensive Evaluation Function
Because of the different types and units of index data in the two evaluation subsystems, the indices cannot be compared directly. Besides, each index has positive and negative effects on the subsystem. Thus, we standardized the indices in the subsystem to eliminate problems associated with measurement units as well as with these positive and negative effects. Assuming that there are n indices, each index has m years of data, forming the original index matrix. The standardized equation is given as follows:
where is the sample value of index i in year t; after standardization, the value range of belongs to [0, 1]. According to the raw data of the EES indices of the dairy industry in each province, we used entropy empowerment to obtain each index weight.
The comprehensive evaluation score of each subsystem is given as follows:
where and are the comprehensive evaluation scores of the dairy economic subsystem and ecological subsystem, respectively; and is the weight of index i, .
3.1.3. Coupling–Coordination Degree Model
The crux of environmental pollution and ecological destruction has three aspects: (1) the retention or exhaustion of resource metabolism on time and spatial scales, (2) the breakage of system-coupling in the structure and function relationship, and (3) the conflict and imbalance of social behavior in economic and ecological management. We used the concept of capacitive coupling in physics and the coefficient of the coupling model for reference [31], which is given by:
where is the degree of coupling of DEE in area j in year t, and and are the composite evaluation scores of dairy economic subsystem and ecological subsystem, respectively; .
The degree of coordination can be used to measure dependency relation inside one system or between two or more systems. Therefore, we introduced the degree of coordination model to reflect the coupling strength of the economic development and ecological environment, as well as the actual situation of each subsystem comprehensively. It provides us a more in-depth analysis for the degree of coordinated development (D) of DEE. The calculation method is given by:
where and are the comprehensive evaluation scores of the dairy EES and the degree of coordination of DEE, respectively; and and are the weight of the dairy economic subsystem and the weight of the dairy ecological subsystem in j region, respectively.
3.1.4. Spatial Autocorrelation
Spatial autocorrelation reflects the pattern of a data set spatially and determines if it is dispersed, clustered, or random based on the locations and values of the feature. We used Moran’s Index to conduct this test, and the equation is given by:
where ωij is the spatial weight between region i and region j; n is the number of regions; Xi is the observation value of area i; Xj is the observation value of area j; , and . Moran’s I ranges from −1 to 1. If Moran’s I > 0, there is a positive spatial correlation; if Moran’s I < 0, there is a negative spatial correlation, and if Moran’s I = 0, this is an independent random distribution state.
3.2. Data
Based on the national and provincial panel data of nine major dairy provinces from 2003 to 2018, we analyzed the coordination between the economy and ecology of the dairy industry in China. The selected provinces include Inner Mongolia, Hebei, Henan, Shandong, Heilongjiang, Liaoning Shaanxi, Xinjiang, and Ningxia, and this selection is based on all provinces whose milk production exceeded 1 million tons in 2018; besides, these nine provinces have been China’s major dairy provinces in the recent 15 years. The economic data are mainly from China Dairy Yearbook, China Animal Husbandry Yearbook, and NBS (National Bureau of Statistics of China). The direct environmental data are from China Environmental Statistical Yearbook, and the indirect data were calculated using the Manual of Pollutant Discharge Coefficient of Livestock and Poultry Breeding Industry in the First National Pollution Source Census issued by the Department of Science, Technology, and Education of the Ministry of Agriculture.
3.3. Descriptive Statistics
Considerable changes in Chinese dairy farming occurred between 2003 and 2018, which are summarized in Table 2 for selected years. For example, milk yield increased by 333% and the number of large-scale dairy farms increased by more than 140%. In line with production growth, the carbon footprint of milk production increased by more than 76%, and the cyclic utilization of manure in dairy farmland increased by 16.18%.
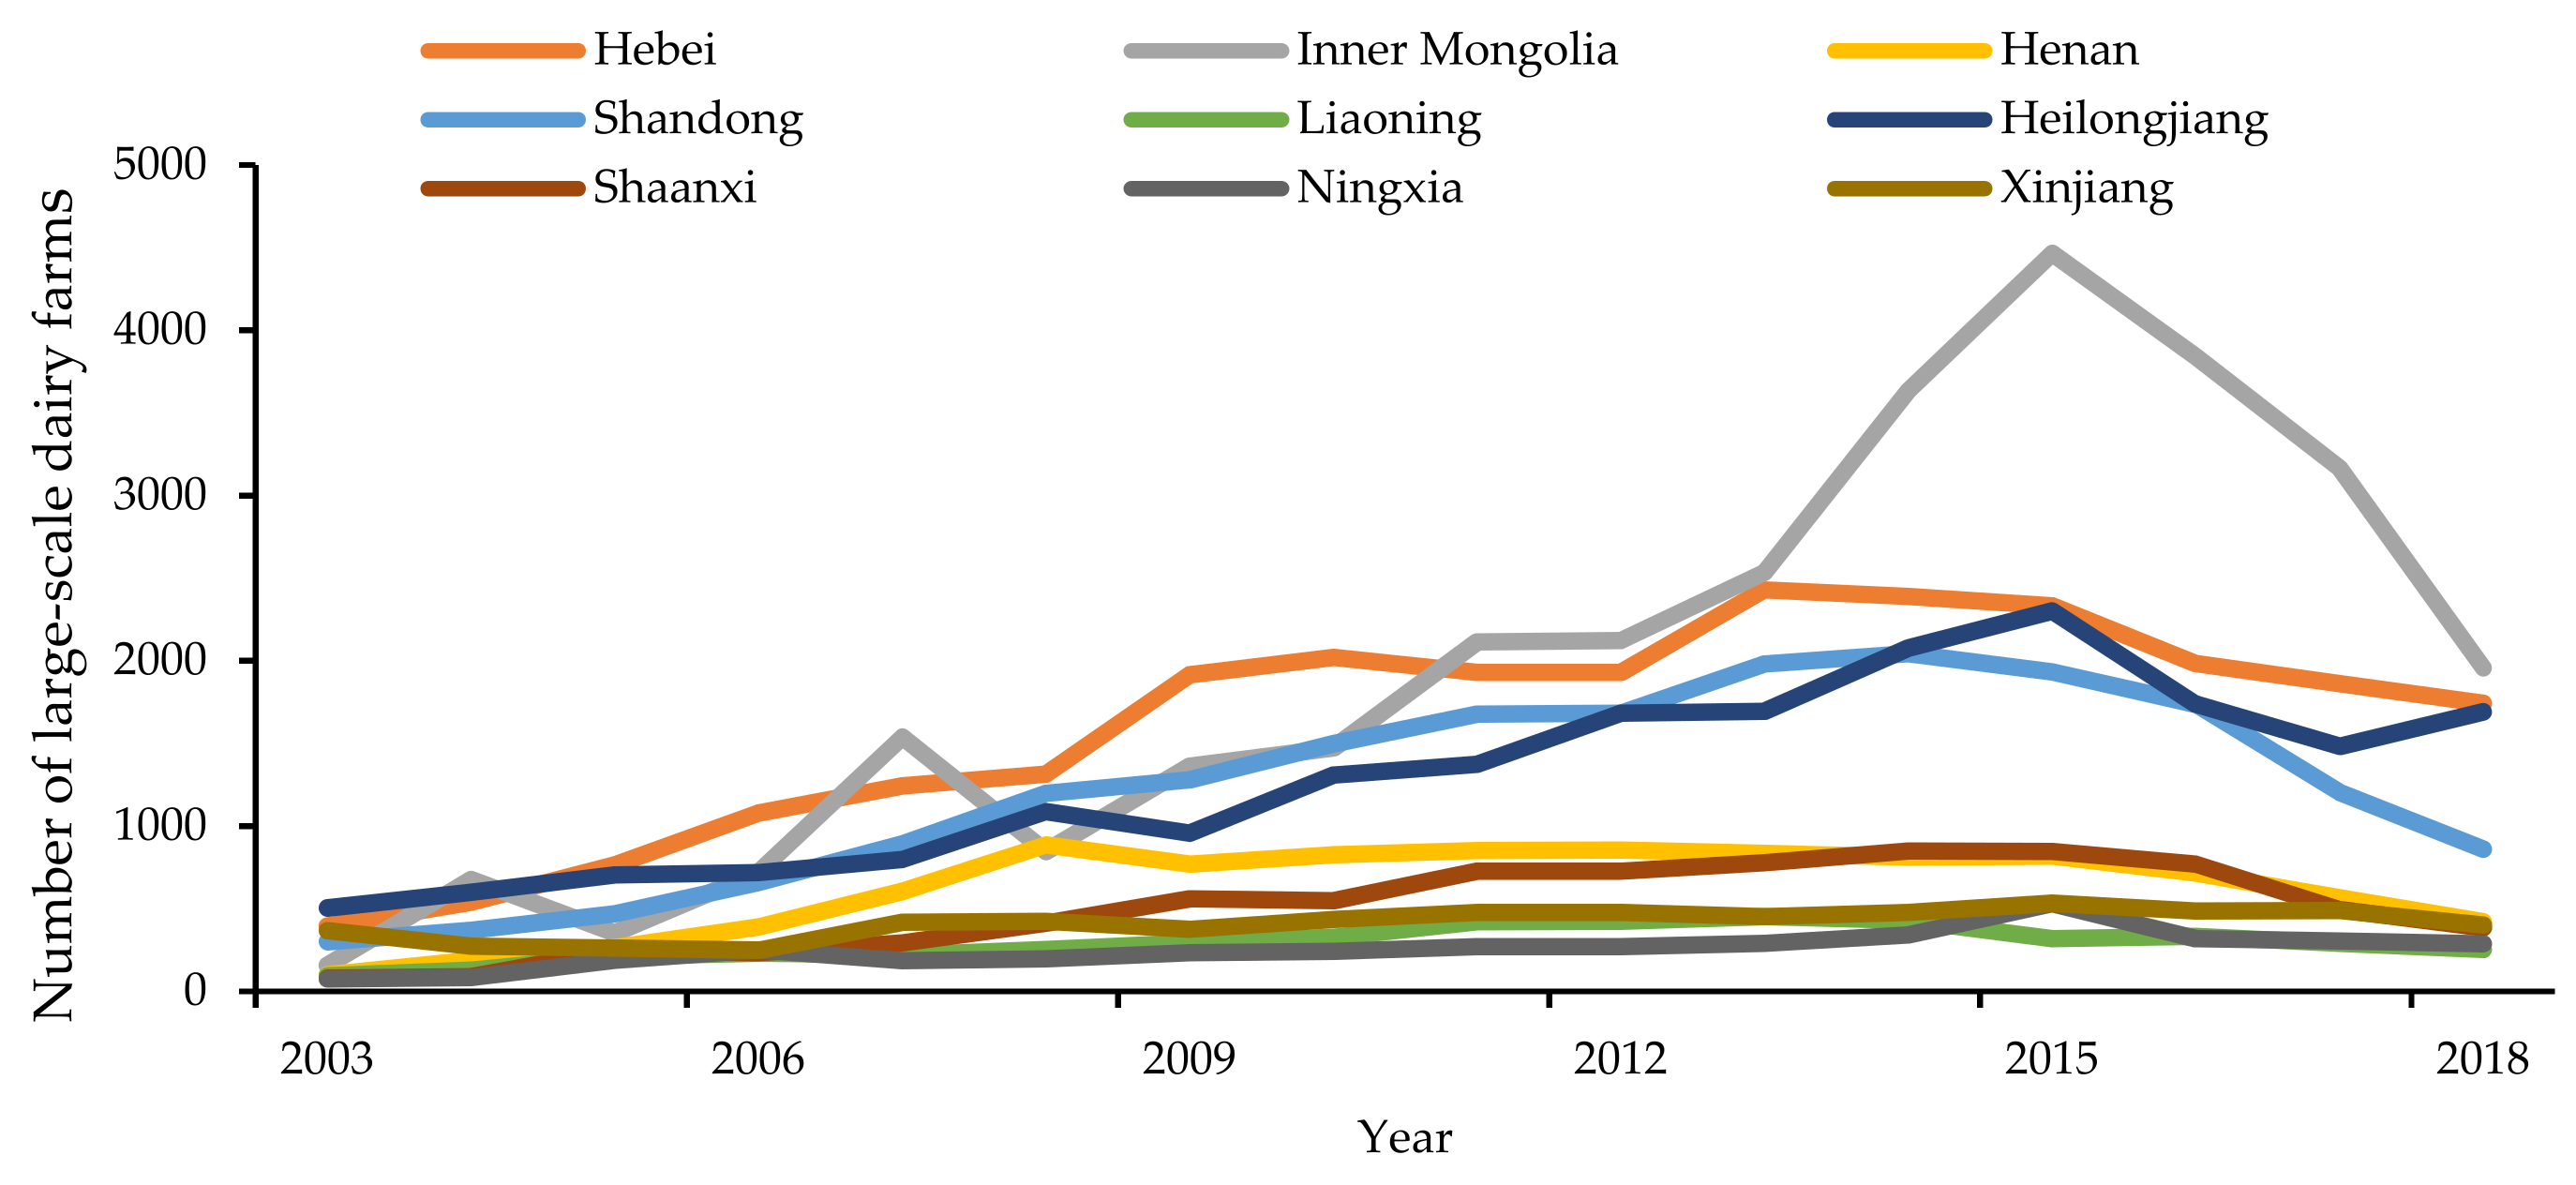
A large increase in animal abundance has rapidly increased CH4 emissions from manure management despite lower emission per LU due to the dominance of dry manure management practices [32]. We graphically explored the relationship of the scale of dairy farms and dairy ecological problems. As shown in Figure 2, the number of dairy farms with more than 1000 cows showed different growth trends before 2015. This scale effect captures expanded economic activity with potential negative environmental implications [33]. With the government’s request of building higher standards and adapting technical devices for dairy farming, the number of large-scale farms began to decline after 2015. At that stage, milk production continued to rise, whereas the carbon footprint of milk production decreased by 3.31% from 2015 to 2018, which indicates that the decrease in the number of large-scale farms was conducive to the coordination of the dairy economy and ecology (DEE) in this phase of Chinese dairy farming.
4. Results
4.1. Coupling Characteristics of Dairy Economy and Ecology
4.1.1. Comparison of Economic and Ecological Subsystems
From 2003 to 2018, the comprehensive evaluation score of the economic subsystem followed an upward trend in the whole process. The score of the national economic subsystem increased from 0.001 to 0.0328, with an increase of 32 times, and the score of the provincial average economic subsystem increased from 0.001 to 0.0476, with an increase of 40 times. As shown in Figure 3, the overall dairy economic growth for nine provinces increased steadily, and there had been just a slowdown in low amplitude from 2008 to 2009 and 2015 to 2017. On the national level, dairy was experiencing slow but steady economic growth from 2003 to 2015, but the growth began to slow slightly after 2015. From 2003 to 2018, the evaluation score of the ecological subsystem showed a U-shaped trend in general. From 2003 to 2006, both the national score and provincial average score decelerated sharply. The Chinese dairy industry prospered in that period; the number of cows increased from 8.9315 million in 2003 to 13.6317 million at the end of 2006, and the sharp increase in the scale of livestock led to deterioration of ecological environment in the short run. In 2008, a “melamine incident” occurred in China’s dairy industry, and consequently, the incidents of milk dumping and cattle killing occurred with increasing frequency. One of the root causes of the melamine infant powered milk scandal was the unfair profit allocation mechanism in the dairy supply chain. The dairy farmers invest much more money and are prone to higher risk but make less profit. The cost and profits of dairy supply chain are imbalanced. At the end of 2008, the number of dairy cattle tailed down to 12.335 million. In 2008–2009, the ecological status of the dairy industry was relatively improved. After several years of fluctuations, beginning in 2015, the ecological evaluation score of the dairy industry followed an upward trend and the ecological status of the dairy industry started to improve. Compared with 2003, the score of national ecological subsystem decreased by 42.1% in 2018, and the score of provincial average ecological subsystem increased by 5.74%.
By comparing the scores of the economic subsystem with the score of ecological subsystem, we determined whether the DEE in every province in a certain year was a type of economic lag or ecological lag. What stands out in Table 3 is the comparison of the type of combined system of DEE of each province from 2003 to 2018. We found the following: In terms of the development of the national dairy industry, except for a few specific years, the overall trend was economic lag. Taking Inner Mongolia as an example, as the most important dairy producing region of China, its economic–ecological development type also reflected the tortuous development of the dairy industry in China over the past 16 years. The dairy industry in Inner Mongolia developed slowly from the year of 2003 to 2005. After 2005, it developed quickly until 2008, when the melamine even happened. This event had serious impact on the dairy industry. After a few years of recovery, numerous national dairy safety incidents broke out again in 2012, which seriously affected consumer confidence in domestic milk. At the same time, foreign dairy products seized the domestic market and the dairy industry in China ushered in a second trough period. It was not until 2017 that development gradually improved.
4.1.2. Degree of Coupling
From 2003 to 2008, the degree of coupling of DEE in both the whole country and major dairy producing regions increased rapidly (Table 4). The degree of national coupling increased from 0.006 to 0.493, and the provincial average degree of coupling of nine provinces increased from 0.093 to 0.49. Affected by the dairy crisis in 2008, the economic system experienced a tremendous turbulence. In 2009, the overall degree of coupling declined significantly. The national dairy degree of coupling dropped to 0.457, and the provincial average degree of coupling dropped to 0.479. Due to the various natural endowment in different regions and the exposure to varying degrees of external shock, after recovering for different lengths of time, the degree of coupling of DEE in most provinces returned to the level close to 0.5. In terms of speed of recovery, Shaanxi and Xinjiang were relatively slow, and the change of degree of coupling in Ningxia was more sensitive than in other regions. Generally, from 2003 to 2018, the DEE of China transitioned from a primary coupling to a harmonious system.
4.2. Spatiotemporal Evolution of Coordination Degree in Different Provinces
4.2.1. Spatiotemporal Evolution of DEE
We explored the differences and connections between the natural system and the economic system from spatial perspective. Since 2003, the degree of coordination of China’s DEE has been on the rise, but the trend has been unstable, and the developing process of the degree of coordination of DEE in different regions has also been significantly different. As shown in Figure 4a, the national transition and provincial average transition was basically the same in past few years, and the provincial change was smoother than that for the whole country. In most years, the trendlines of the national and provincial average degree of coordination coincided, and the development of the dairy industry in nine provinces mainly explained China’s overall trend of coordinated development of DEE. At the beginning of 2003, the degree of coordination of DEE in Heilongjiang, Inner Mongolia, and Xinjiang were higher than the national degree. While the degree of coordination in Shaanxi was the lowest at 0.0143, in Xinjiang it was the highest at 0.7726. By 2018, only the degree of coordination in Inner Mongolia overhauled the national degree, which was at 0.1696, and the degree of Shandong was the lowest, at 0.1482.
Based on the geographical location, we initially divided the nine major dairy provinces into three clusters, as shown in Figure 4. The first cluster of dairy production areas are mostly concentrated in northwest of China, which includes Shaanxi, Ningxia, Xinjiang, and Inner Mongolia. The degree of coordination of this cluster was mostly lower than the national degree before 2007 but it has overtaken the national degree at different velocities since then. More specifically, the trend in Inner Mongolia resembled the national trend, and the degree of coordination in Inner Mongolia exceeded the degree of the national and provincial average. The changes in Shaanxi, Ningxia, and Xinjiang were similar, and this period saw a continuation of the upward trend. The second cluster provinces are concentrated in the central plains, including Hebei, Henan, and Shandong. The degree of coordination of in this cluster is higher than the national degree. In the last 10 years, the degree of coordination in Shandong rose slowly. In contrast, it showed a rapid increase in Henan and Hebei from 2015 onwards, during which there was initially a substantial increase, then a small decrease, and then an increasing trend. The third cluster are concentrated in northeast, which includes Heilongjiang and Liaoning. The degree of coordination in this cluster fluctuated slightly and floated around (0.1, 0.15).
As shown in Figure 5, the coordination of DEE in different regions presented various rates of progress. According to the regional characteristics of major dairy production areas in China, we concluded the following: traditional pastoral area such as Inner Mongolia is on the longevity of the dairy industry, where it has a solid foundation of animal husbandry, superior geographical environment, and unique natural endowment. So, whether from the perspective of resisting dairy risks or the share of market, it has the first mover advantage. Thus, its DEE coordination stays relatively healthy and steady. As for the emerging dairy production areas, such as Henan, their dairy economic foundation is not solid enough to contend with the international dairy products. Additionally, owing to limited breeding areas, mature dairy industry chains and efficient ecological chains have not yet been developed. Thus, the coordinated development of DEE has been slow.
4.2.2. Spatial Autocorrelation
The Global Moran’s Index test for the coordination of DEE in nine major dairy production provinces from 2003 to 2018 is shown in Table 5, and the Moran’s I index results are in the range of (−0.25, 0.25). The feature of sectional variation was periodically observed in the Global Moran’s index of degree of coordination of DEE over time. In 2003, among different regions in the nine provinces, Moran’s I value was less than zero and did not pass the significance test at 10%. Spatial correlation was not obvious because of the low absolute value of the related coefficient. The Global Moran’s Index values were greater than zero from year 2004 to 2006, and there was an obvious positive spatial autocorrelation among regions particularly in 2005. The same was validated by looking at the p-values, and the obtained p-value was less than to 0.1 (p ≤ 0.1) for the three years, ruling out the basic assumption of randomness and independence in the data values. It suggests that there was a positive correlation and potential for agglomeration for dairy industry in China, yet the development occurred in periods of instability. From 2007 to 2012, the Global Moran’s Index values were less than zero and failed the significance test of 10%. By the year of 2013 to 2015, the Global Moran’s Index values were greater than zero, which suggests that there was positive autocorrelation again among the nine provinces. From 2016 to 2018, Moran’s I showed a negative correlation. According to the dynamic evolution over the past 16 years, the regional degree of coordination of the DEE in nine major production provinces has changed significantly. However, because the global Moran’s Index cannot characterize the specific regions and changing features of spatial agglomeration on the coordination, further examination of the local spatial autocorrelation of degree is warranted.
We conducted a local Moran’s I index test for the degree of coordination of DEE in nine provinces for the years 2005, 2009, 2013, and 2018 to examine whether there was a possibility of strategic interactions among provinces (Table 6). Furthermore, we needed to identify the types of spatial associations that existed across provinces in terms of degree of coordination. Specifically, the change trend of Ningxia and Xinjiang was similar, which had a low-low spatial cluster (somewhere with a low degree of coordination of DEE in a low-degree region) in 2005 and 2009, which went up to a high-high cluster (somewhere with high degree of coordination of DEE in a high degree region) in 2013, and went down to a low-high cluster (somewhere with low degree of coordination of DEE in a high degree region) in 2018. Heilongjiang and Liaoning changed from a high-high cluster in 2005 to a low-high (high-low) cluster in 2009, then went up to a high-high cluster in 2013 and decreased to a high-low (high-low) cluster. Inner Mongolia had a low-low cluster in 2003, but then went up to a low-high (high-low) cluster in 2009, 2013, and 2018. With a low-low cluster in the year 2005, Shaanxi turned into a high-low cluster in 2009 and 2013 and then fell back to a low-low cluster in 2018. In 2005 and 2009, Hebei had a high-high cluster, but it went down to a low-low cluster in 2013, and then turned back into a high-high cluster in 2018. Shandong and Henan both experienced a change from a high-high cluster to a low-low cluster and back to a low-high (high-low) throughout the whole period.
In 2018, the degree of coordination of DEE in Shandong, Liaoning, and Ningxia was lower, but these regions were surrounded by areas with a higher degree. In contrast, Inner Mongolia, Xinjiang, Heilongjiang, and Henan had a higher degree of coordination and were surrounded by areas with a lower degree of coordination (Table 5 and Figure 6). This indicates that the degree of coordination of DEE of major dairy-producing regions in China was not randomly distributed but based on the agglomeration state of different spatial location.
5. Discussion
Methane emissions differed based on different livestock categories, with ruminants producing more CH4 than nonruminants and livestock with higher body weight producing more CH4 within the same groups [34]. Globally, dairy and nondairy cattle represent the largest source of CH4 emissions, accounting for 89% of the total emissions from the livestock sector in the 2010s. The largest contribution of cattle toward global emissions was due to higher energy demand (maintenance, growth, activity) and body weight, resulting in higher emissions per unit of livestock [35]. The influence of ruminants on the ecological environment has always been a major concern in the sustainable development of agriculture. In order to find out the law of evolution of dairy farming coordination between economy and ecology, we applied the coupling coordination theory and spatial autocorrelation model to analyze Chinese dairy farming.
The results provide practical applications for Asia and other developing countries. To be specific, choosing an appropriate scale for dairy farming seems to be a more conducive way to break the bottlenecks and improve the economic efficiency of the dairy industry. Breeding plots with high standards should be built considering site selection of dairy plots, layout designing of cattle farms, management of dairy plots, prevention of animal epidemic, and the safe disposal of manure pollution. Besides, the protection can be sustainable by setting up an assessment cycle that is suited to the dairy ecological system, replenishing the accountability, constructing the ecological audit system and green supervision system, and establishing an ecological compensation mechanism Based on preventing the income of dairy farmers from falling, policies, such as increasing environmental subsidies, should be adopted to motivate the farmers to protect the environment spontaneously. Moreover, dairy-producing regions should pay more attention to building local featured dairy brands and developing additional biological and cultural industries to strengthen the degree of market association in the dairy industrial chain and to achieve the goal of energy conservation and emission reduction.
In sum, this paper used models to make a quantitative analysis of the relationship between dairy economy and ecology and creatively analyzed the coordination from both a spatial and temporal perspective. However, there are two limitations in our study. First, because of the accessibility of data on feed ratio in specific farms, we could not take it as one of the variables in the evaluation system, which made it impossible to explore the relationship between economic and ecological in the perspective of nutrition transition. With the development of digital farms, we intend to integrate the economic and ecological problems of dairy processing into the whole dairy industry, which will greatly improve the study. Second, since intestinal fermentation in ruminants is the main source of greenhouse gas emissions in livestock production, the effectiveness of these measures in reducing emissions is uncertain, and more research is needed in future studies on effective mitigation measures related to intestinal fermentation from a nutritional and genetic perspective.
6. Conclusions
Based on the panel data of the nine milk producing provinces in China from 2003 to 2018, this paper analyzed the evolution of dairy farming coordination between economy and ecology in China from a spatial and temporal perspective. The dairy industry in China has experienced a progression of primary developing stage to rapid developing stage to high quality transformation at this stage. It has achieved the crossover of relative coordination to dysregulation to reconstruction of coordination, which is in the exploration stage of synergy reconstruction between economy and ecology. Hidden potential risks resulting from dairy farming and the acquisition of raw milk can be attributed to the lack of uniform safety standards and supervision regulations. Furthermore, the sensitivity and the ability to resist the risks of the dairy industry are obviously different. Taking the traditional dairy region Inner Mongolia as an example, it has a greater ability to resist external risks and a relatively superior dairy ecological environment. However, some regions have not achieved a stable coordination model of economy and ecology (e.g., Ningxia). Each dairy farm should judge the carrying capacity of its ecosystem, and moreover, farms should improve the resilience and innovation of traditional livestock breeding by enhancing production efficiency with a more complete infrastructure. As the concept of intelligent dairy is gradually applied in the dairy industry chain, the promotion of the digital dairy platform and a developed pasture supervising system will enable us to minimize risks. This will also guarantee the ecological sustainability of dairy industry development. In addition, dairy-producing regions should pay more attention to building local featured dairy product brands and developing additional biological and cultural industries to strengthen the degree of market association in the dairy industrial chain and to achieve the goal of energy conservation and emission reduction. To help resolve the problems associated with the current dairy industry in China, we suggest that the following should be considered in policymaking and operation of the dairy industry.
Author Contributions
Conceptualization, G.Q.; methodology, R.L. and G.Q.; software, R.L.; validation, R.L.; formal analysis, R.L.; investigation, R.L.; resources, G.Q.; data curation, R.L.; writing—original draft preparation, R.L.; writing—review and editing, R.L. and G.Q.; visualization, R.L.; supervision, G.Q.; project administration, G.Q.; funding acquisition, G.Q. All authors have read and agreed to the published version of the manuscript.
Funding
This research was funded by the project entitled “Dairy Industry Convergence and Value Chain Reconstruction” from Inner Mongolia Talent Development Fund. The grant number is 12000-130002045.
Institutional Review Board Statement
Not applicable.
Informed Consent Statement
Not applicable.
Data Availability Statement
Data sharing not applicable.
Conflicts of Interest
The authors declare no conflict of interest.
References
- Liu, H.; Peng, H.; Wang, C.; Zhu, W.Q.; Dong, X.X. Comparative Analysis of Dairy Farming Efficiency in Difference Dairy Production Areas in China—Based on Survey Data From 266 Farms. Chin. J. Agric. Resour. Reg. Plan. 2020, 41, 110–119. [Google Scholar] [CrossRef]
- Gao, Z.; Yuan, H.; Ma, W.; Liu, X.; Desjardins, R.L. Methane emissions from a dairy feedlot during the fall and winter seasons in Northern China. Environ. Pollut. 2011, 159, 1183–1189. [Google Scholar] [CrossRef]
- Luo, X.; He, Z.; Liu, F. Study on the utilization of water resources in dairy cattle breeding industry in Beijing. Chin. J. Anim. Sci. 2015, 51, 14–18. [Google Scholar]
- Jia, J.; Sun, R.; Jian, X. Effect of different cultivation modes on pollutant emissions from dairy farms(translated). Jiangsu Agric. Sci. 2009, 1, 311–312. [Google Scholar] [CrossRef]
- Dong, X.; Xu, D.; Cui, Z. Pollution problems and ecological problems in the development of the dairy industry in China. World Agric. 2002, 3, 7–9. [Google Scholar] [CrossRef]
- Dong, X.; Xu, D.; Cui, H. The ecological road of dairy industry in China(translated). Ecol. Econ. 2002, 3, 28–30. [Google Scholar]
- Li, S.L.; Wang, L.C.; Wu, X.Y.; Chai, T.T.; Wu, Z.L.; Tian, J.Y.; Jin, Q.X. China’s dairy industry from the perspective of the development of the U.S. dairy industry(translated). Chin. J. Anim. Sci. 2007, 4, 2–9. [Google Scholar] [CrossRef]
- Liao, R.; Wei, M. On Sustainable Development of Dairy Industrialization in NanShan Pasture. Econ. Geogr. 2007, 27, 990–994. [Google Scholar] [CrossRef]
- Pan, G. The Research of Green Dairy Industry Circular Economy. Ecol. Econ. 2011, 5, 43–46. [Google Scholar]
- Gerssen-Gondelach, S.J.; Lauwerijssen, R.B.G.; Havlík, P.; Herrero, M.; Valin, H.; Faaij, A.P.C.; Wicke, B. Intensification pathways for beef and dairy cattle production systems: Impacts on GHG emissions, land occupation and land use change. Agric. Ecosyst. Environ. 2017, 240, 135–147. [Google Scholar] [CrossRef]
- Capper, J.L.; Cady, R.A. The effects of improved performance in the U.S. dairy cattle industry on environmental impacts between 2007 and 2017. J. Anim. Sci. 2020, 98. [Google Scholar] [CrossRef]
- Gao, W.; Zhang, J.J.; Zhang, Y.F.; Zhang, N.N.; Wang, X.; Bai, Z.H.; Ma, W.Q.; Ma, L. Spatiotemporal characteristics of green development indicators in the whole dairy industry chain in China. Chin. J. Eco-Agric. 2020, 28, 1181–1199. [Google Scholar] [CrossRef]
- Rojas-Downing, M.M.; Nejadhashemi, A.P.; Harrigan, T.; Woznicki, S.A. Climate change and livestock: Impacts, adaptation, and mitigation. Clim. Risk Manag. 2017, 16, 145–163. [Google Scholar] [CrossRef]
- Kong, Y.; Han, L. Environmental Contamination From Animal Faeces in China and Control Countermeasures. J. China Agric. Univ. 2002, 7, 92–96. [Google Scholar] [CrossRef]
- Li, F.; Cheng, S.K.; Yu, H.L.; Yang, D.W. Waste from livestock and poultry breeding and its potential assessment of biogas energy in rural China. J. Clean. Prod. 2016, 126, 451. [Google Scholar] [CrossRef]
- Cang, L.; Wang, Y.-J.; Zhou, D.-M.; Dong, Y.-H. Heavy metals pollution in poultry and livestock feeds and manures under intensive farming in Jiangsu Province, China. J. Environ. Sci. 2004, 16, 371–374. [Google Scholar] [CrossRef]
- Xu, Y.; Li, J.; Zhang, X.B.; Wang, L.Q.; Xu, X.B.; Xu, L.; Gong, H.R.; Xie, H.Y.; Li, F.D. Data integration analysis: Heavy metal pollution in China’s large-scale cattle rearing and reduction potential in manure utilization. J. Clean. Prod. 2019, 232, 308. [Google Scholar] [CrossRef]
- Hu, Y.N.; Cheng, H.F.; Tao, S. Environmental and human health challenges of industrial livestock and poultry farming in China and their mitigation. Environ. Int. 2017, 107, 111. [Google Scholar] [CrossRef]
- Bratt, L.C.; Van Lierop, W.F.J. Economic-ecological modeling: An introduction to methods and applications. Ecol. Model. 1986, 31, 33–44. [Google Scholar] [CrossRef]
- Costanza, R. The value of ecosystem services. Ecol. Econ. 1998, 25, 1–2. [Google Scholar] [CrossRef]
- Wier, M.; Hasler, B.; Andersen, J.M. Evaluating consequences of agricultural policy measures in an integrated economic and environmental model system. Trans. Ecol. Environ. 1999, 27, 113–122. [Google Scholar] [CrossRef]
- Turner, R.K.; van den Bergh, J.C.J.M.; Söderqvist, T.; Barendregt, A.; van der Straaten, J.; Maltby, E.; van Ierland, E.C. Ecological-economic analysis of wetlands: Scientific integration for management and policy. Ecol. Econ. 2000, 35, 7–23. [Google Scholar] [CrossRef]
- Limburg, K.E.; O’Neill, R.V.; Costanza, R.; Farber, S. Complex systems and valuation. Ecol. Econ. 2002, 41, 409. [Google Scholar] [CrossRef]
- Fang, C.; Huang, J.; Bu, W. Theoretical Study on Urbanization Process and Ecological Effect with the Restriction of Water Resource in Arid Area of Northwest China. Arid. Land Geogr. 2004, 27, 1–7. [Google Scholar] [CrossRef]
- Gao, Y.J.; Wang, Z.J.; Hong, Y.J. Studies on the Evaluation Indicator Systemof Economic-ecological-social Effects in Chinese Reservoir Areas. J. Hydroecol. 2009, 2, 138–141. [Google Scholar] [CrossRef]
- Graedel, T.E.; Allenby, B.R. Industrial Ecology; Tsinghua University Press: Beijing, China, 2004. [Google Scholar]
- Dangal, S.R.S.; Tian, H.; Zhang, B.; Pan, S.; Lu, C.; Yang, J. Methane emission from global livestock sector during 1890–2014: Magnitude, trends and spatiotemporal patterns. Glob. Chang. Biol. 2017, 23, 4147–4161. [Google Scholar] [CrossRef]
- Chenyan, L.; Wei, Q.; Melse, R.W.; Lujun, L.; De Buisonjé, F.E.; Yajing, W.; Renjie, D. Patterns of dairy manure management in China. Int. J. Agric. Biol. Eng. 2017, 10, 227–236. [Google Scholar] [CrossRef]
- Luo, X.; He, Z.; Liu, F. Regional Distribution and Dvelopment of China’ Dairy Industry. Agric. Outlook 2016, 12, 45–53. [Google Scholar]
- Haeckel, E. The History of Creation: Or the Development of the Earth and Its Inhabitants by the Action of Natural Causes; Routledge: London, UK, 1889; Volume 1, p. 450. [Google Scholar]
- Illingworth, V. The Penguin Dictionary of Physics; Foreign Language Press: Beijing, China, 1996; pp. 92–93. [Google Scholar]
- van Amstel, A. IPCC 2006 Guidelines for National Greenhouse Gas Inventories; Institute for Global Environmental Strategies: Geneva, Switzerland, 2006; Available online: https://www.ipcc-nggip.iges.or.jp/public/2006gl/ (accessed on 5 November 2021).
- Grossman, G.M.; Krueger, A.B. Environmental Impacts of a North American Free Trade Agreement. CEPR Discuss. Pap. 1992, 8, 223–250. [Google Scholar] [CrossRef]
- Moss, A.R.; Jourany, J.-P.; Newbold, J. Methane production by ruminants: Its contribution to global warming. Annales De Zootech. 2000, 49, 231–253. [Google Scholar] [CrossRef] [Green Version]
- Caro, D.; Davis, S.J.; Bastianoni, S.; Caldeira, K. Global and regional trends in greenhouse gas emissions from livestock. Clim. Chang. 2014, 126, 203–216. [Google Scholar] [CrossRef] [Green Version]
Figure 1.
Theoretical framework.

Figure 2.
Number of large-scale dairy farms.

Figure 3.
Comprehensive evaluation scores of dairy economic subsystem and ecological subsystem.

Figure 4.
Evolution of degree of coordination. (a) Overall. (b) First Cluster. (c) Second Cluster. (d) Third Cluster.
Figure 4.
Evolution of degree of coordination. (a) Overall. (b) First Cluster. (c) Second Cluster. (d) Third Cluster.

Figure 5.
Spatial differentiation of coordination of DEE in different provinces.

Figure 6.
Local spatial autocorrelation Moran’s I scatter plots. (a) 2005, (b) 2009, (c) 2013, (d) 2018.
Figure 6.
Local spatial autocorrelation Moran’s I scatter plots. (a) 2005, (b) 2009, (c) 2013, (d) 2018.


Table 1.
Evaluation index system of the dairy economy and ecology.
| Subsystem | Rule Layer | Index Layer | Attribute |
|---|---|---|---|
| System of Economic development | Yield/Output | Milk yield | + |
| Proportion of dairy farm output value to husbandry farm output value | + | ||
| Scale of dairy farm Income and consumption | Number of large-scale dairy farms | + | |
| Dairy farm revenue | + | ||
| Average annual expenditure on dairy products per person for urban households | + | ||
| Average annual dairy product consumption per person in rural households | + | ||
| System of Ecological environment | Ecological status | Carbon footprint of milk production | − |
| Proportion of wastewater emission from dairy farm to industry | − | ||
| Heavy metal pollution | − | ||
| Ecological pressure/potential | Burden of bearing manure in dairy farmland | − | |
| Cyclic utilization of manure in dairy farmland | + | ||
| Fecal contamination risk index for agricultural livestock | − | ||
| Average load-carrying capacity of farmland | + |
Table 2.
Dairy farming characteristics (2003–2018).
| 2003 | 2006 | 2009 | 2012 | 2015 | 2018 | % Change (2003–2018) | |
|---|---|---|---|---|---|---|---|
| Milk yield (10,000 tons) | 723.49 | 1459.58 | 1935.12 | 2545.19 | 2782.53 | 3132.82 | 333.02 |
| Proportion of dairy farm output value to husbandry farm output value | 3.53% | 4.38% | 5.04% | 4.91% | 5.27% | 4.48% | 26.91 |
| Number of large-scale dairy farms | 3667 | 6040 | 10,144 | 12,313 | 15,379 | 8812 | 140.31 |
| Dairy farm revenue (yuan) | 3065.73 | 5427.88 | 6674.08 | 9551.16 | 11,320.09 | 11,406.77 | 272.07 |
| Average annual expenditure on dairy products per person for urban households (yuan) | 124.70 | 150.23 | 196.14 | 253.57 | 302.85 | 355.91 | 185.41 |
| Average annual dairy product consumption per person in rural households (kg/p) | 1.7 | 3.1 | 3.6 | 5.3 | 5.9 | 6.9 | 305.88 |
| Carbon footprint of milk production (10,000 tons CO2e) | 2078.10 | 3504.07 | 3564.17 | 3778.13 | 3783.96 | 3658.77 | 76.06 |
| Proportion of wastewater emission from dairy farm to industry | 0.50% | 0.68% | 0.65% | 0.81% | 0.91% | 0.66% | 29.99 |
| Heavy metal pollution (tons) | 3587.47 | 5475.08 | 5061.91 | 6000.14 | 6053.56 | 4167.85 | 16.18 |
| Burden of bearing manure in dairy farmland (tons/ha) | 0.59 | 0.91 | 0.75 | 0.90 | 0.90 | 0.61 | 4.73 |
| Cyclic utilization of manure in dairy farmland (tons) | 8066.13 | 12,310.25 | 11,381.27 | 13,490.82 | 13,610.92 | 9371.06 | 16.18 |
| Fecal contamination risk index for agricultural livestock | 0.02 | 0.03 | 0.02 | 0.03 | 0.03 | 0.02 | 3.47 |
| Average load-carrying capacity of farmland (tons) | 23,566.20 | 23,443.50 | 26,037.13 | 26,227.65 | 25,986.73 | 26,466.21 | 12.31 |
Table 3.
Types of combined system of DEE over the years.
| Year/ Region | National | Inner Mongolia | Hebei | Henan | Shandong | Heilongjiang | Liaoning | Shaanxi | Xinjiang | Ningxia |
|---|---|---|---|---|---|---|---|---|---|---|
| 2003 | 1 | 1 | 1 | 1 | 1 | 1 | 1 | 1 | 1 | 1 |
| 2004 | 1 | 1 | 1 | 1 | 1 | 1 | 1 | 1 | 1 | 1 |
| 2005 | 1 | 1 | 1 | 1 | 1 | 1 | 1 | 1 | 1 | 1 |
| 2006 | 1 | 0 | 1 | 1 | 1 | 1 | 1 | 1 | 1 | 1 |
| 2007 | 1 | 0 | 1 | 1 | 1 | 1 | 1 | 1 | 0 | 1 |
| 2008 | 1 | 0 | 0 | 1 | 1 | 1 | 0 | 1 | 1 | 1 |
| 2009 | 1 | 1 | 1 | 1 | 1 | 0 | 1 | 1 | 1 | 1 |
| 2010 | 1 | 0 | 1 | 1 | 1 | 0 | 1 | 0 | 1 | 1 |
| 2011 | 1 | 0 | 0 | 1 | 1 | 0 | 0 | 0 | 1 | 1 |
| 2012 | 0 | 0 | 0 | 0 | 0 | 0 | 1 | 0 | 1 | 0 |
| 2013 | 1 | 1 | 0 | 0 | 0 | 0 | 1 | 0 | 0 | 0 |
| 2014 | 0 | 1 | 0 | 0 | 0 | 0 | 0 | 0 | 0 | 0 |
| 2015 | 0 | 0 | 0 | 0 | 0 | 0 | 0 | 0 | 0 | 0 |
| 2016 | 1 | 0 | 0 | 0 | 0 | 0 | 0 | 0 | 0 | 0 |
| 2017 | 1 | 1 | 1 | 1 | 1 | 1 | 1 | 0 | 0 | 0 |
| 2018 | 1 | 1 | 1 | 1 | 1 | 1 | 0 | 1 | 0 | 0 |
Note: 0 = ecologically lagging, 1 = economically lagging.
Table 4.
Degree of coupling of DEE in different provinces.
| Year/ Region | National | Inner Mongolia | Hebei | Henan | Shandong | Heilongjiang | Liaoning | Shaanxi | Xinjiang | Ningxia | Mean |
|---|---|---|---|---|---|---|---|---|---|---|---|
| 2003 | 0.006 | 0.074 | 0.009 | 0.010 | 0.010 | 0.250 | 0.009 | 0.014 | 0.445 | 0.015 | 0.093 |
| 2004 | 0.171 | 0.326 | 0.288 | 0.199 | 0.242 | 0.338 | 0.284 | 0.311 | 0.418 | 0.278 | 0.298 |
| 2005 | 0.347 | 0.455 | 0.409 | 0.286 | 0.351 | 0.341 | 0.412 | 0.461 | 0.463 | 0.377 | 0.395 |
| 2006 | 0.453 | 0.470 | 0.497 | 0.366 | 0.439 | 0.408 | 0.482 | 0.498 | 0.500 | 0.434 | 0.455 |
| 2007 | 0.468 | 0.487 | 0.497 | 0.455 | 0.460 | 0.454 | 0.488 | 0.483 | 0.499 | 0.480 | 0.478 |
| 2008 | 0.493 | 0.494 | 0.500 | 0.490 | 0.455 | 0.486 | 0.498 | 0.498 | 0.497 | 0.495 | 0.490 |
| 2009 | 0.457 | 0.497 | 0.495 | 0.470 | 0.464 | 0.498 | 0.473 | 0.500 | 0.469 | 0.441 | 0.479 |
| 2010 | 0.495 | 0.500 | 0.497 | 0.498 | 0.480 | 0.479 | 0.496 | 0.500 | 0.486 | 0.459 | 0.488 |
| 2011 | 0.499 | 0.500 | 0.500 | 0.499 | 0.500 | 0.495 | 0.500 | 0.494 | 0.495 | 0.494 | 0.497 |
| 2012 | 0.496 | 0.498 | 0.496 | 0.500 | 0.499 | 0.499 | 0.499 | 0.488 | 0.499 | 0.497 | 0.497 |
| 2013 | 0.498 | 0.495 | 0.495 | 0.498 | 0.500 | 0.498 | 0.497 | 0.482 | 0.500 | 0.491 | 0.495 |
| 2014 | 0.496 | 0.500 | 0.478 | 0.491 | 0.494 | 0.490 | 0.500 | 0.480 | 0.494 | 0.466 | 0.488 |
| 2015 | 0.489 | 0.497 | 0.476 | 0.483 | 0.497 | 0.486 | 0.495 | 0.484 | 0.481 | 0.468 | 0.485 |
| 2016 | 0.500 | 0.500 | 0.496 | 0.485 | 0.500 | 0.498 | 0.470 | 0.478 | 0.471 | 0.456 | 0.484 |
| 2017 | 0.478 | 0.487 | 0.497 | 0.496 | 0.495 | 0.496 | 0.495 | 0.500 | 0.472 | 0.424 | 0.485 |
| 2018 | 0.466 | 0.486 | 0.495 | 0.493 | 0.487 | 0.491 | 0.499 | 0.500 | 0.479 | 0.416 | 0.483 |
Table 5.
Global Moran’s I index test on the degree of coordination of the nine provinces.
| Year | I | SD (I) | p-Value * |
|---|---|---|---|
| 2003 | −0.068 | 0.146 | 0.348 |
| 2004 | 0.074 * | 0.148 | 0.09 |
| 2005 | 0.225 *** | 0.147 | 0.009 |
| 2006 | 0.072 * | 0.153 | 0.099 |
| 2007 | −0.036 | 0.13 | 0.247 |
| 2008 | −0.135 | 0.143 | 0.472 |
| 2009 | −0.149 | 0.152 | 0.437 |
| 2010 | −0.072 | 0.146 | 0.358 |
| 2011 | 0.009 | 0.143 | 0.174 |
| 2012 | −0.017 | 0.149 | 0.235 |
| 2013 | 0.141 ** | 0.144 | 0.032 |
| 2014 | 0.141 ** | 0.153 | 0.041 |
| 2015 | 0.092 * | 0.155 | 0.081 |
| 2016 | −0.054 | 0.127 | 0.289 |
| 2017 | −0.229 | 0.135 | 0.22 |
| 2018 | −0.24 | 0.139 | 0.204 |
Note: ***, **, and * indicate significant at the level of 1%, 5%, and 10%, respectively.
Table 6.
Local autocorrelation analysis based on a dynamic perspective.
| Year | Positive Correlation | Negative Correlation | ||
|---|---|---|---|---|
| H-H | L-L | L-H | H-L | |
| 2005 | Heilongjiang Liaoning Shandong Hebei | Shaanxi Xinjiang Ningxia Inner Mongolia | - | Henan |
| 2009 | Shandong Hebei Henan | Ningxia Xinjiang Inner Mongolia | Heilongjiang | Liaoning Shaanxi |
| 2013 | Heilongjiang Liaoning Xinjiang Ningxia | Shandong Henan Hebei | - | Inner Mongolia Shaanxi |
| 2018 | Hebei | Shaanxi | Shandong Liaoning Ningxia | Henan Heilongjiang Inner Mongolia Xinjiang |
Publisher’s Note: MDPI stays neutral with regard to jurisdictional claims in published maps and institutional affiliations. |
© 2021 by the authors. Licensee MDPI, Basel, Switzerland. This article is an open access article distributed under the terms and conditions of the Creative Commons Attribution (CC BY) license (https://creativecommons.org/licenses/by/4.0/).
Share and Cite
MDPI and ACS Style
Li, R.; Qian, G. Spatial and Temporal Evolution of Dairy Farming Coordination between Economy and Ecology in China. Sustainability 2021, 13, 12618. https://0-doi-org.brum.beds.ac.uk/10.3390/su132212618
AMA Style
Li R, Qian G. Spatial and Temporal Evolution of Dairy Farming Coordination between Economy and Ecology in China. Sustainability. 2021; 13(22):12618. https://0-doi-org.brum.beds.ac.uk/10.3390/su132212618
Chicago/Turabian StyleLi, Ran, and Guixia Qian. 2021. "Spatial and Temporal Evolution of Dairy Farming Coordination between Economy and Ecology in China" Sustainability 13, no. 22: 12618. https://0-doi-org.brum.beds.ac.uk/10.3390/su132212618
Note that from the first issue of 2016, this journal uses article numbers instead of page numbers. See further details here.