Article

Estimating Risk Perception Effects on Courier Companies’ Online Customer Behavior during a Crisis, Using Crowdsourced Data

by
Damianos P. Sakas
,
Ioannis Dimitrios G. Kamperos
* and
Panagiotis Reklitis
Department of Agribusiness and Supply Chain Management, School of Applied Economics and Social Sciences, Agricultural University of Athens, 118 55 Athina, Greece
*
Author to whom correspondence should be addressed.
Sustainability 2021, 13(22), 12725; https://0-doi-org.brum.beds.ac.uk/10.3390/su132212725
Submission received: 28 September 2021 / Revised: 7 November 2021 / Accepted: 15 November 2021 / Published: 17 November 2021
(This article belongs to the Special Issue Crowd-Powered e-Services)

Abstract

:
The ongoing COVID-19 pandemic has proven to be a real challenge for courier companies on a global scale and has affected customer behavior worldwide. This paper attempts to propound a new methodology in order to predict the effect of courier companies’ e-commerce on customers’ risk perception regarding their online behavior after the outbreak, and the final effect of their behavior on the global ranking of the company’s website, utilizing passive crowdsourcing data from five world-leading courier companies as representative examples of their respective business sectors. The results will allow supply chain risk management (SCRM) managers to make effective strategic decisions regarding the efficient allocation of resources to mitigate the corporate risk to their organization during a novel crisis. In our paper, we monitored five key performance indicators (KPIs) over a 24-month period (March 2019–February 2021) as the first of a suggested three-level analysis process using statistical analysis and fuzzy cognitive mapping techniques. We propose that courier service companies should manage the risk of a potential novel crisis by improving the reputation and brand name of the company, since customers tend to trust an established brand.

1. Introduction

1.1. Risk Management and Supply Chains

1.1.1. Risk Management

Viewed from a broader perspective, risk management refers to the coordinated activities of an organization in order to control risk [1]. However, if we want to focus more on enterprises it would be more appropriate to seek definitions for enterprise risk management (ERM) in particular, referring to all the activities of an organization to minimize the effects of risk on its capital and earnings. Risk management is a valuable process that allows organizations to effectively respond to stakeholder expectations by improving the efficiency of the decision-making process and by demonstrating that necessary actions have been taken to manage possible risks to an adequate degree. For a risk management process to be effective, certain principles must be applied. The most common set of principles suggested for successful risk management are known by the acronym PACED [2], standing for:
Proportionate to the level of risks within the organization.
Aligned with other business activities.
Comprehensive, systematic, and structured.
Embedded within business processes.
Dynamic, iterative, and responsive to change.
Several risk management standards and frameworks have been developed, setting out the overall approach to the effective management of risk. Although many national organizations and government bodies have developed their own standards, the approaches are rather similar, pointing to some common steps involved in a successful risk management process. The most common steps are:
  • Risk Identification
  • Risk Assessment
  • Risk Treatment
  • Risk Monitoring
  • Risk Reporting
All standards and frameworks underline the crucial role of communication and feedback during the whole process.

1.1.2. Supply Chain Risk Management

Supply chains are a connecting platform through which products and information flow from suppliers to distributers to end consumers. Disruption to a single link of a supply chain could result in economic catastrophes for the organizations involved. Well-known examples, like the fire at a Phillips semiconductor plant in 2000, followed by production disruption, which in the end led to Ericsson’s $400 million loss [3], prove the interconnection of organizations in the modern economic environment. Low-risk supply chains are the only way to ensure undisrupted and profitable business activities in a highly unstable and dynamic environment. There have been many attempts to define supply chain risk management (SCRM) [4,5,6,7,8]. Adopting a more comprehensive approach, we could define SCRM as “an inter-organizational collaborative endeavor utilizing quantitative and qualitative risk management methodologies to identify, evaluate, mitigate, and monitor unexpected macro and micro level events or conditions, which might adversely impact any part of a supply chain” [9]. Although SCRM complies with the principles and frameworks of general risk management, the classification of risks is specialized. Jüttner et al. [5] categorize supply chain risks (SCR) into three groups: environmental, network-related, and organizational risks. Tang and Musa [10] suggested categorizing SCR into material flow, financial flow, and information flow risks. Other researchers, however, recommend a more detailed classifying of SCR. Following this approach, 11 different types of SCR have been identified: strategic, operations, supply, customer asset impairment, competitive, reputation, financial, fiscal, regulatory, and legal risks.

1.2. Consumer Behavior

A consumer can be defined as any person engaged in the consumption process in order to fulfill either personal needs or the collective needs of a group or a family. The decisions these individuals make on how they will spend their limited resources of time and money can be called consumer behavior and involves questions regarding what and why they buy, where they buy it, when and how often they buy it, and how often they use it [11]. Schiffman et al. [12] defined consumer behavior “as the behavior that consumers display in searching for, purchasing, using, evaluating and disposing of products, services and ideas which they expect will satisfy their needs.” There are many models developed to explain and predict consumer behavior; some of them are based on the notion that consumer behavior is mainly influenced by cultural factors like social class and subcultures, some on social factors as family, roles, and status, some on personal aspects like age and occupation, and some on psychological characteristics like motivations, perceptions, beliefs, and attitudes [11]. Other theories focus on the perception–behavior link and on automatic goal pursuit research, proposing that many choices are made unconsciously and are strongly affected by the environment [13].
Some of the traditional models of consumer buying behavior include the economic model, which is based on the notion of getting the maximum benefits while minimizing the costs [14]; the learning model, stating that consumer behavior is dictated by the need to cover basic needs like food and learned needs like fear [11]; the psychoanalytic model, which takes into consideration the fact that the conscious and unconscious mind both influence consumer behavior [15]; and the sociological model, which relies heavily on the role and influence of the consumer in society [16].
Modern theories of consumer behavior incorporate the Howard–Sheth model, which, in order to explain the consumer choice of a product, uses the concept of stimulus–response [17], as well as the Engel–Kollat–Blackwell model, which considers consumer behavior as a conscious problem-solving and learning model [18]. There is also the Nicosia model, which focuses on communication between the product firm and consumer [19], as well as the stimulus–response model, relying heavily on marketing stimuli that, once entered into the buyer’s “black box,” turn into responses [20].

1.3. Risk Perception and E-Commerce

1.3.1. Risk Perception

Risk perception can be defined as the subjective assessment of the probability of a specified type of accident happening in relation to the subjective evaluation of the probable consequences [21]. Although most researchers describe risk perception as the outcome of an individual’s cognitive process, one could argue that the final decision is affected by several factors beyond the individual [22]. These factors include the social and cultural network formed by the values, symbols, history, and ideology of the individual [22]. The complex nature of risk perception is reflected by the two dominant explanatory theories. The psychometric paradigm developed by Fischhoff et al. [23], has been the theory with the highest influence in the scientific field of risk analysis [24]. This theory is based on a “cognitive map” of hazards, suggesting an explanatory model of how laypeople perceive various risks. However, this theory divides people into only two groups: “experts” and “laypeople,” with no additional distinction made between individuals or groups [25]. Cultural theory [26] suggests a different approach to risk perception research. According to this theory, risk perceptions are culturally biased. An individual is expected to perceive risks regarding societal dangers in such a way as to reinforce his/her beliefs and commitments regarding social function and ordering [27].

1.3.2. Risk Perception and Brand Name in E-Commerce

E-commerce in rapidly growing, mainly because of technology improvement and Internet availability. However, choosing a product or a service from a computer or a mobile device includes risks that online customers perceive in different ways. In a study regarding risk perception in online auctions, the researchers suggested that consumers rely mostly on customized information and word-of-mouth communication in order to make a purchase, with the brand significantly affecting consumers’ perceived risk [28]. The significance of trust as well as the importance of familiarization with the Internet is highlighted in different studies. The researchers propose that site quality and the user’s overall web experience are some of the main factors that are likely to influence trust levels. Positive word-of-mouth and collaborations with well-known business partners are also classified as effective risk-reduction methods, demonstrating the link between brand name and low risk perception [29]. A negative relationship between consumer trust and perceived risk has also been reported by Teo and Liu [30] in their research, suggesting that the reputation of an Internet vendor is positively related to consumer trust. In a different approach, a study regarding the effect of brand name in online shopping reports no significant difference between online shoppers’ perceived risk in relation to brand familiarity [31].

1.4. Crowdsourcing and Web Analytics

1.4.1. Crowdsourcing

The use of a distributed network of individuals to achieve creative solutions to novel problems is not a new idea. In the 19th century, English mathematician Charles Babbage hired “the crowd” to help with calculating astronomical tables [32]. However, the term “crowdsourcing” was first introduced by Jeff Howe and Mark Robinson in 2006, describing a Web-based business model that utilizes the combined effort of several networked individuals recruited by an open call [33]. In crowdsourcing, there are two parties involved, the requesters and the members of the crowd [34]. However, depending on the interplay between these two groups and the task at hand, there are various types of crowdsourcing. Bigham, Bernstein, and Adar [34] suggest direct crowdsourcing, collaborating crowdsourcing, and passive crowdsourcing as three main types. Crowdfunding could be listed as another type of crowdsourcing since, in both cases, the platforms provide financial benefits by lowering search costs and assisting transactions between organizations and members of the crowd [35], resulting in a financial bonus that is usually shared between entrepreneurs and investors [36]. Gebert [37] proposes that the main benefits of crowdsourcing include the low cost, the quality of output, and the ease of use. However, he points to crowd responsiveness, satisfactory results, and issues regarding security and privacy as the main obstacles to paid crowdsourcing. The crowdsourcing business model is increasingly affecting supply chains. In 2018, 85% of the top global brands reported using crowdsourcing during the last decade [38]. Technology improvement enables approaches like crowdsourced delivery and crowdsourced logistics in an attempt to improve delivery times, reduce delivery costs, and lower the environmental impact of unnecessary transport [39].

1.4.2. Passive Crowdsourcing

Unintentionally, people’s ordinary Internet and social media activity generates a vast volume of user-generated material. Passive crowdsourcing is the collection of publicly available information without any solicitation [40]. This crowdsourcing approach is of great use for political or governmental functions. Governments are interested in collecting data from blogs, websites, and social media platforms in order to obtain a better understanding of public opinion [41]. This form of passive “citizen sourcing” using social media monitoring is growing and has been developed as part of the NOMAD European Research Project [42,43]. Environmental sciences also adopt passive crowdsourcing techniques to develop innovative solutions. “Citizen Science” and “Neogeography“ are terms based on this concept whereby users upload data as regular web content and researchers collect and process them for purposes that differ from the users’ initial intention [44]. Passive crowdsourcing used for environmental research applications can produce an undisrupted and direct flow of information on human activities, equal to surveillance and tracking devices as well as automated digital sensors [45]. However, passive crowdsourcing, like active crowdsourcing, faces challenges regarding the quality and uncertainty of results, and is restricted by time and processing cost limitations. The collection of irrelevant and low-quality content seems to be a great obstacle, as well as malicious replication of content [46].

1.4.3. Web Analytics and Big Data

The use of web analytics is a form of passive crowdsourcing that utilizes the Big Data produced by online users during their regular online activity [47]. It is defined as the monitoring and reporting of website usage so that organizations can have a better understanding of the complex interactions between Internet users and websites [48]. These data are mined from websites and processed into usable numerical data called key performance indicators (KPIs). Web analytics KPIs are used to compare objective goals with websites’ and webpages’ performance. The main advantage of KPIs is their simplicity, since they can be easily calculated, tracked over time, and used for assessment and comparison purposes. The use of KPIs can help an organization focus on the strengths and weaknesses of a website and significantly contribute to its improvement [49]. During the last few decades, the possibilities of web analytics have motivated e-commerce organizations to invest significant resources in using KPIs for developing effective evaluation tools for their online strategies, since traditional web usage methods could provide only limited usable data [50]. Web mining of Big Data has been suggested by researchers as a potentially beneficial approach for identifying web customers’ behavior [51]. The use of web analytics in digital marketing in the industrial sector also assists the industry by increasing the monitoring of the complicated selling processes involved [52]. Web analytics, however, are not only intended for marketing optimization. A study by Mikusz et al. [53] highlights the potential of using existing web analytics technology into Internet of Things (IoT) applications including sensor monitoring and user engagement tracking. Data mining of passively crowdsourced data regarding online user behavior has produced criticism regarding user privacy, resulting in antitracking legislation and tools. These actions degrade the quality of web analytics in favor of user privacy. Researchers, however, have suggested overcoming this limitation by using systems that provide web analytics without tracking [54].

1.4.4. Web Analytics and Big Data Applications in the SCRM

Web analytics and Big Data have triggered increasing scientific interest for their potential applications in SCRM [55]; however, a study of the extant literature on SCRM reveals that data-driven techniques receive only sporadic attention. Expert knowledge-based SCRM appears to be the mainstream method; however, the developing topic of digitization in supply chains presents a tremendous chance to develop a data-driven, smart SCRM [56]. Data availability is frequently hampered by legitimate concerns about data security, confidentiality, and privacy. Even their supply chain partners may be hesitant to disclose accurate data to supply chain stakeholders. Fortunately, advances in data management and analysis have led to a slew of innovations that enable secure data processing, storage, and sharing [57]. Shang, Dunson, and Song [58] used Big Data mined from six months of activities of 20 cargo airlines, in an attempt to assess and forecast transport risks. Fan, Heilig, and Voß [59] highlight the possible benefit for SCRM of collecting, analyzing, and monitoring both internal organizational data and environmental data. Researchers also recommend that enterprises should not restrict themselves to data processing and analysis, and that special attention should be paid to the interaction between big data information systems and users. Data mining of multiple information sources is supported by other studies as well. A data mining-based framework to support SCRM was proposed by Er Kara, Oktay Fırat, and Ghadge [60]. The researchers introduced a comprehensive guide to discover useful information from unstructured data, by systematic collection processing and the monitoring of supply chain risk data from multiple information sources. However, their model is difficult to generalize about since it was tested using a single case company. Using the same perspective, Miao et al. [61] suggested the use of both internal and external data in order to sense and predict supply disruptions. Using a different approach, the development of mathematically-based automated inspection methods that can be integrated into SCRM is supported, in order to control and minimize the amount of manual inspection required by the vast amount of data produced by the supply chain in total [62]. In an attempt to utilize the emerging field of social media, a study by Papadopoulos et al. [63] introduced passive crowdsourcing of unstructured Big Data produced by social media users to support a theoretical framework of resilience in supply chain networks for sustainability.

2. Materials and Methods

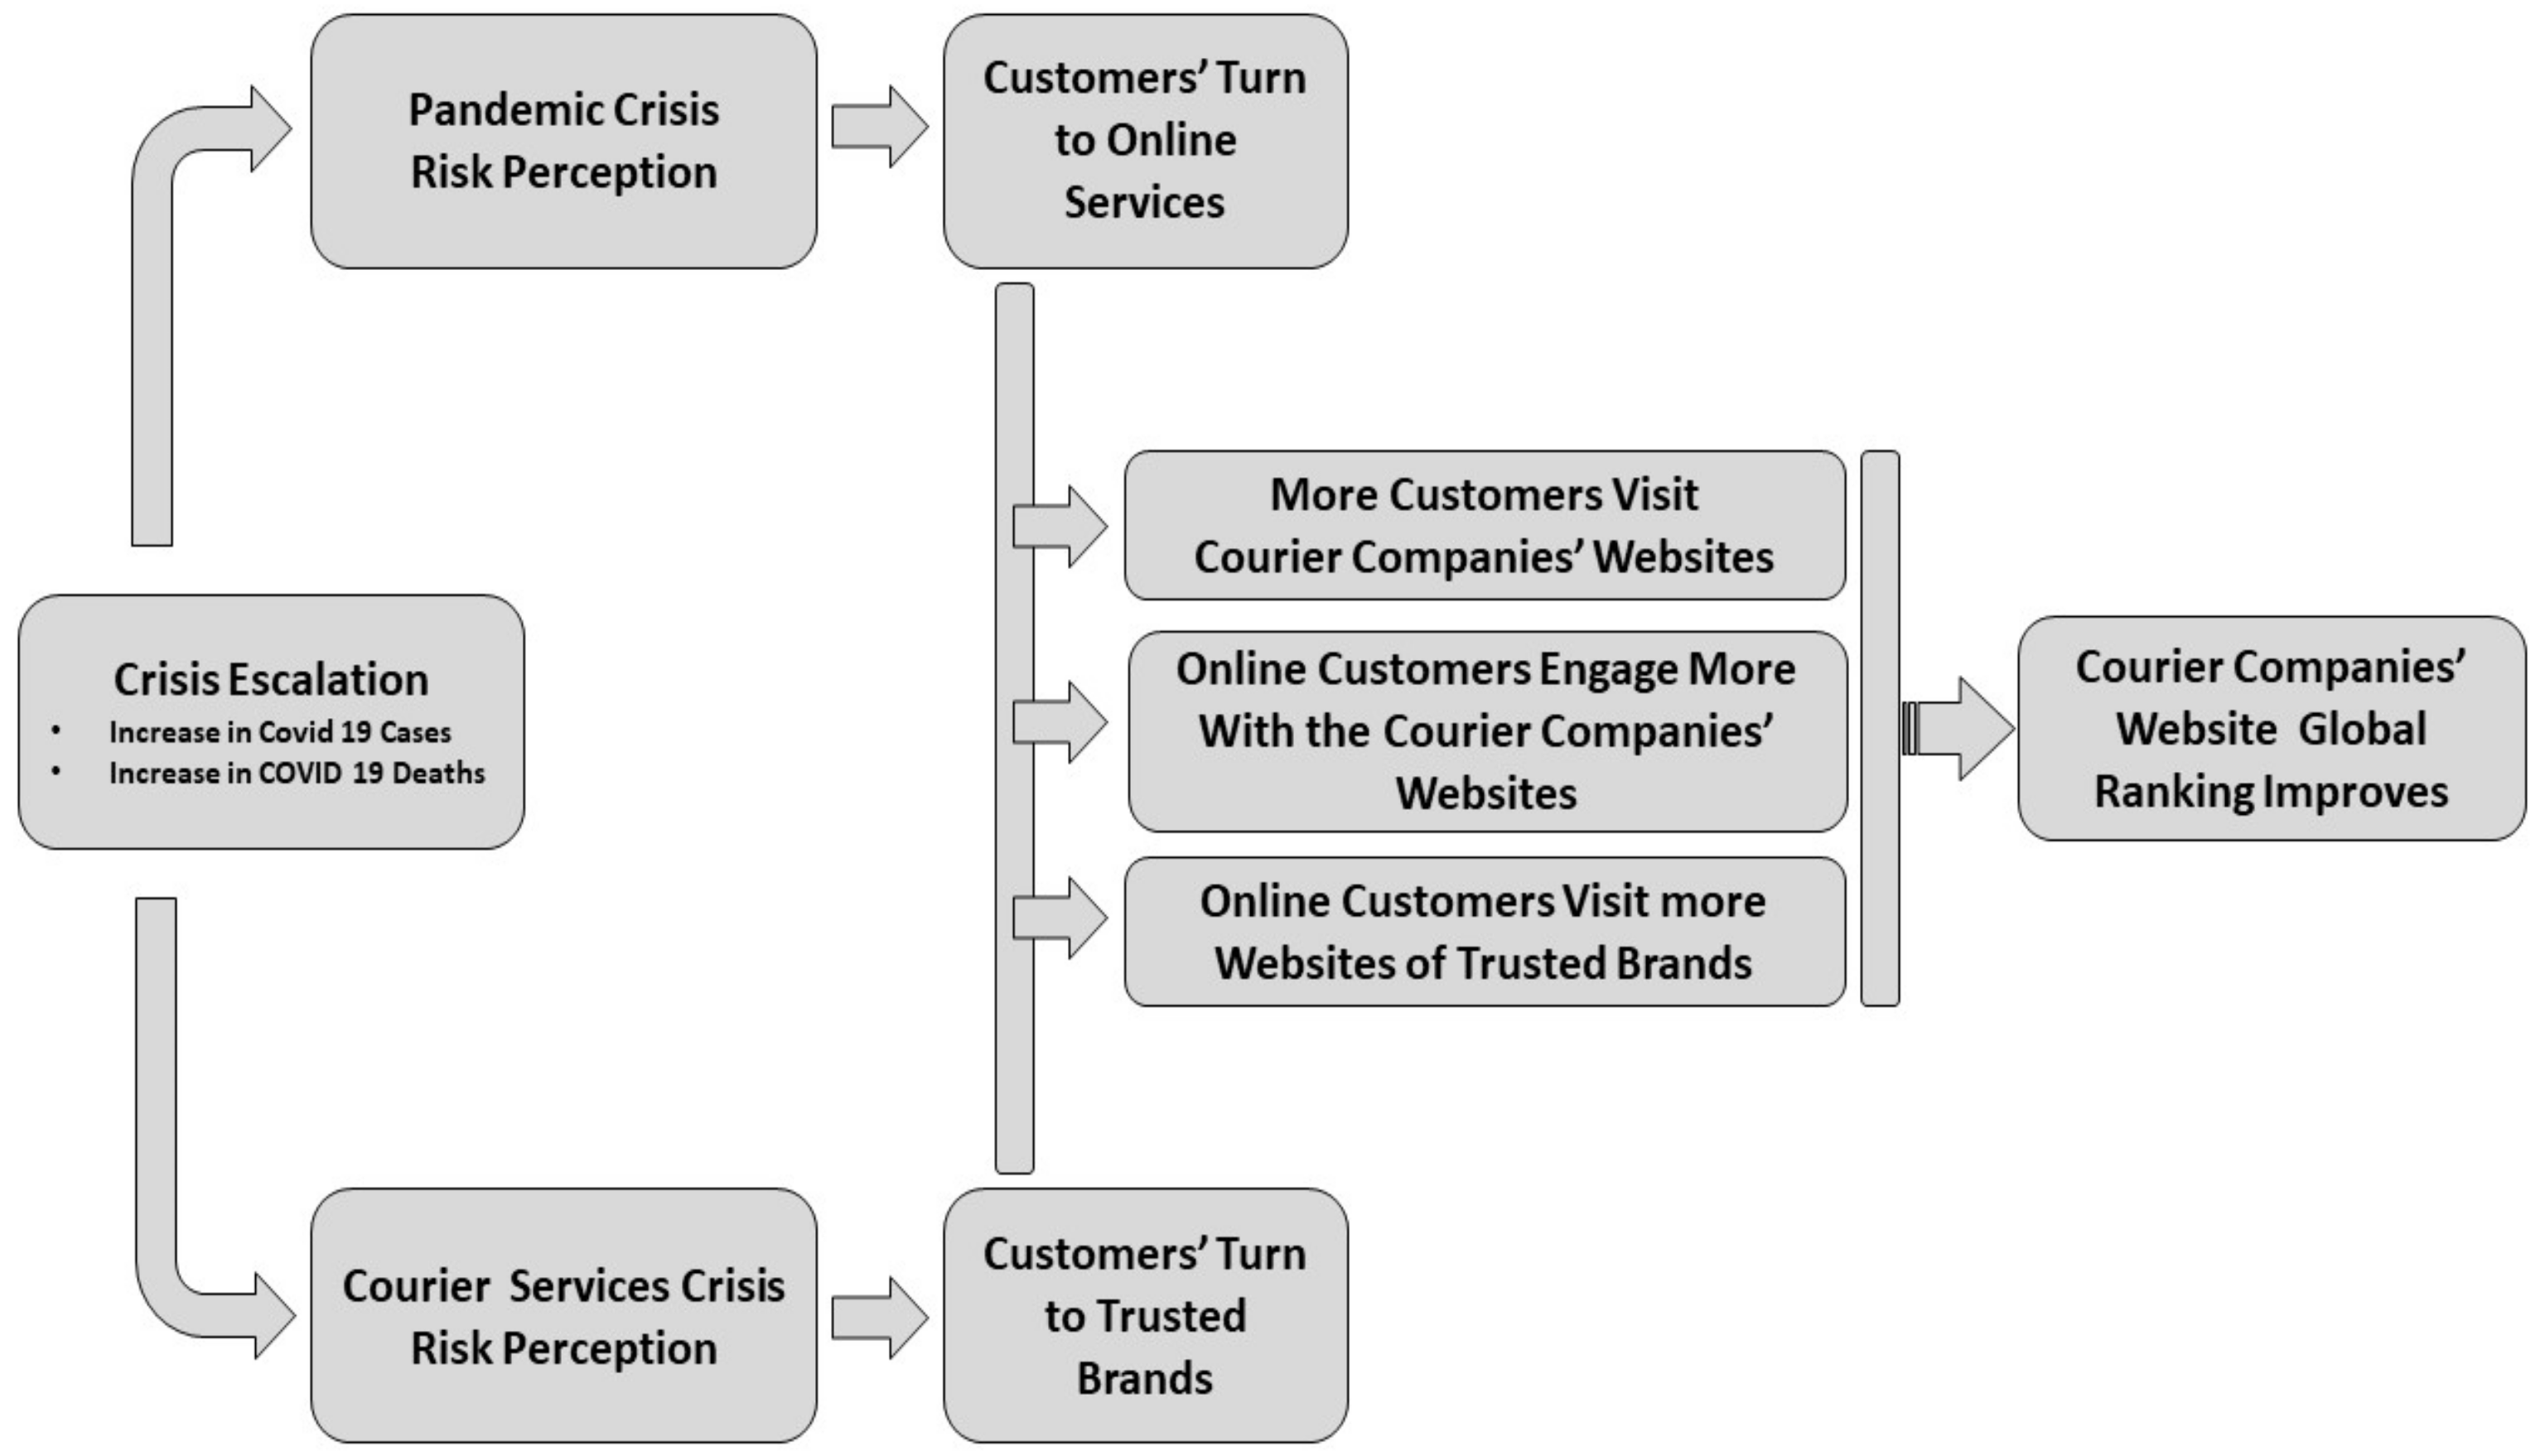
2.1. Problem Formulation and Research Hypotheses

The ongoing COVID-19 pandemic has affected worldwide courier companies in various ways. Many of these changes are still unknown since customers are continually altering their behavior in response to the dynamic nature of the crisis, which was not a natural disaster with chronically static consequences (e.g., earthquake, flood), but displayed almost linear growth, as represented by the increasing numbers of COVID-19 cases and deaths from February 2020 until the time of this study. Courier services’ customers faced a novel danger that was out of their control and, according to the Psychometric Paradigm [23], their risk perception of the pandemic was expected to be very high, pushing them to pursue alternative options, like e-commerce, rather than exposing themselves to COVID-19. Additionally, customers were forced to seek alternative courier service providers since high-profile brands faced real challenges keeping up with the demand, resulting in long delays and bad customer service. That situation raised two fundamental questions. Firstly, how the perceived risk of COVID-19 would affect customers’ online behavior in terms of traffic and user engagement with the company’s website and the effect of these shifts on the website’s global ranking. Secondly, how these metrics would be affected by the escalation of the COVID-19 crisis, represented by confirmed new infections and deaths.
Based on the suggestion that companies’ websites are among the leading customer search tools, we will attempt an interpretation of COVID-19’ effects on courier service customers’ online behavior. For that reason, we will utilize passive crowdsourcing data from companies’ websites, focusing on specific KPIs related to traffic and the ranking of the site in the Google search engine as well as user engagement metrics.
The results will allow SCRM managers to make effective strategic decisions regarding the efficient allocation of resources to mitigate the corporate risk to their organization and provide them with valuable information to answer questions such as:
  • Should I pay for advertisements on the Internet, or will the traffic attracted by my brand name not reward the investment?
  • Is search engine optimization of my organization’s website an effective way to allocate my resources, or do customers prefer more traditional ways of consuming during a crisis?
  • Should I invest financial resources in digital marketing and brand empowerment, or does the brand lose importance for customers after a novel crisis?
To investigate these questions, we settled on four research hypotheses in an attempt to provide insight into the effect of the number of worldwide COVID-19 cases and deaths on the traffic source of the leading courier companies’ root domains and the global ranking of these domains in the web analytics platforms, as well as the depth of customer engagement with these websites:
For all our hypotheses, COVID-19-related metrics (cases and deaths) are independent variables whose effect upon the related KPI (customer behavior) variables (dependent variables) is investigated in this study.
Hypothesis (H1):
The effect of the number of worldwide COVID-19 cases on branded and nonbranded traffic KPIs’ of courier companies’ root domains will be expressed by the global ranking KPI.
The number of reported cases of COVID-19 is the usual indicator used to communicate the course of the pandemic to the community. The general population’s risk perception regarding COVID-19 is expected to increase as the number of COVID-19 cases reported rises. H2 attempts to clarify the effect of this phenomenon on customer behavior regarding their preference for online services and their trust in specific brands, as well as the reflection of this effect on courier companies’ websites’ search engine rankings. Outcomes regarding H1 will assist organizations with planning effective reputational risk management strategies. Predicting customer behavior during a novel crisis will indicate whether or not allocating financial resources to brand empowering and digital marketing is an efficient decision for mitigating the corporate risk of courier companies.
Hypothesis (H2):
Global ranking KPI is an indicator of the number of worldwideCOVID-19 deaths and has effects on the branded and nonbranded traffic KPIs’ of courier companies’ root domains.
Global ranking KPI is one of the most significant indicators regarding website performance. H2 attempts an interpretation of the effects of the number of worldwide COVID-19-related deaths on this KPI by investigating changes in online customer behavior regarding trust in established brand names. COVID-19-related deaths is an index that usually accompanies the reported infection number, but seems to be subsumed in the latter. This study will try to specify the impact of reported COVID-19-related deaths on customer behavior regarding e-shopping courier services, their preference for specific brands during the crisis, and the way these changes in their behavior alter the search engine rankings of the related websites. Results related to Hypothesis 2 will help courier companies develop efficient reputational risk management strategies by predicting in advance customer behavior during a novel crisis. This information will assist with estimating the efficiency of disposing funds for brand empowerment and search engine optimization (SEO) as an effective decision to mitigate the corporate risk to their organization.
Hypothesis (H3):
The pages viewed per user KPI impact from the branded and nonbranded traffic KPIs of courier companies’ root domains has a correlation with the number of worldwide COVID-19 cases.
The pages viewed per user (PVU) KPI is a useful indicator that reveals the depth of online user engagement with a website. During the COVID-19 crisis, PVU is expected to increase since online customers seek more information regarding the problems caused to supply chains by the crisis. H3 research will try to identify the pathways followed by online customers of courier services regarding user engagement and brand name preference and how these change as the number of worldwideCOVID-19 infections reported rises. Outcomes concerning Hypothesis 3 will assist SCRM managers with planning effective corporate risk management strategies. Prediction of customer behavior during a novel crisis can be of great use in suggesting whether or not allocating financial resources to brand empowering and online content optimization is a good decision for mitigating corporate risk to their organization.
Hypothesis (H4):
COVID-19 deaths induced variations in branded and nonbranded traffic KPIs’ of courier companies’ root domains, as reflected in pages viewed per user KPI fluctuations.
The number of COVID-19-related deaths worldwide can serve as a reasonable indicator of the escalation of the pandemic. H4 research will try to link the pandemic’s escalation, in terms of the number of worldwide deaths, with the risk perception of customers and the changes to their behavior. According to preview studies [64], it is expected that we will find increased use of e-shopping alternatives. However, the challenges to supply chains caused by the crisis are expected to affect consumers’ behavior regarding service providers. The way these variables affect user engagement with the courier service provider website is the final purpose of the H4 research. The results of our investigation of Hypothesis 4 will help SCRM managers plan effective corporate risk management strategies. Predicting customer behavior during a novel crisis can be extremely useful for determining whether or not allocating funds to brand empowering and online content optimization is a good strategy for mitigating corporate risk to their organization.
In all four hypotheses, branded traffic as well as the nonbranded variable will be studied separately, forming for every hypothesis two independent subhypotheses.

2.2. Sample Selection, Data Retrieval, and KPIs Alignment

As a representative sample of the courier services business sector, five companies were selected based on their market capitalization as of 1 January 2020 [65]. All five were among the top 10 companies globally and maintained a fully functional website. The five companies selected were UPS, Deutsche Post (DHL), FedEx, S.F. Express, and Royal Mail. We defined 1 March 2020 as the COVID-19 starting point, since it was the month wherein most countries started applying transportation limitations and strict border control policies. We designated the two 12-month periods either side of that date as the pre-COVID-19 period (1 March 2019 to 29 February 2020) and the COVID-19 period (1 March 2020 to 28 February 2021). For these two periods, we mined passive crowdsourced data through web analytics platforms for the root domains of the five selected companies regarding six KPIs. In particular, we gathered data regarding global ranking, organic traffic, branded traffic, nonbranded traffic, bounce rate, and pages viewed per user. For every KPI, we also estimated the total mean value of the five companies for every month, as a representative value of the business sector (dependent variables). This web analytics data processing method was selected in favor of more efficient data handling and statistical analysis.
For the second period (the COVID-19 period) we recorded both globally confirmed cases of COVID-19 (the independent variable) and globally confirmed deaths from COVID-19 (the independent variable) per month, as announced by the World Health Organization (https://covid19.who.int/). These data were processed to form two variables regarding average weekly COVID-19 cases and average weekly COVID-19 deaths for every month of that period.
The Key Performance Indicators used in this paper are presented in Table 1.

3. Statistical Analysis–Model Formulation

3.1. Data Validation and Descriptive Statistics

KPI-related data were divided into pre-COVID-19 and COVID-19 sets and descriptive statistical parameters were extracted for all six dependent variables. Every set of variables was also tested for validation through Cronbach’s alpha testing (Table 2).
At this stage of analysis, all six KPI-related variables can be referred to as the dependent variables of the study.
Cronbach’s alpha testing value suggested moderate to low, but acceptable, internal consistency for all variable sets, except nonbranded traffic, where an unacceptable level of reliability was indicated. This outcome can be partially attributed to the small sample size (N = 12) [70,71]. In our paper, the hypothesis research is based on FCM simulation techniques, and our descriptive statistical analysis serves mostly as standard procedure and for documenting purposes. However, after reprocessing our data as samples by day (730 samples), the Cronbach’s alpha value was corrected to 0.590, which is moderate to low, but at an acceptable level, signifying internal consistency.
Descriptive statistical parameters were also calculated for COVID-19-related variables for the COVID-19 period. No internal consistency control was applied for these variables since they were only available for the second time period, serving as an independent variable at this level of analysis (Table 3).

3.2. Statistical Analysis–Means Comparison

Before any further statistical analysis, we performed an independent samples t-test for all six KPI-related variables, using time period (pre-COVID-19 and COVID-19) as the grouping variable, to investigate any statistically significant difference in their values before and after the COVID-19 outbreak (Table 4).
The analysis outcomes suggest that the variability between the two conditions is different for five of the variables (Levene’s test for equality of variances < 0.5), while the total pages viewed per user variable demonstrated about the same variability between the two conditions (Levene’s test for equality of variances = 0.565). The final results strongly indicated statistically significant differences for all six variables, supporting the notion that all six KPI-related variables were significantly affected by the COVID-19 outbreak, however results regarding Nonbranded Traffic variable can not be adopted to this stage due to unaccepted level of reliability (Cronbach’s alpha = –0.057).

3.3. Sta3.2 Statistical Analysis–Correlations

A Pearson correlation coefficient (PCC–Pearson’s r) statistical analysis was applied to our dataset to clarify any possible linear correlations between pairs of variables. The analysis revealed several statistically significant correlations, some of them demonstrating a very strong linear relationship (Table 4). In particular, a PCC analysis resulted in 24 statistically significant correlations between variables, with 19 of them significant at the 0.01 level and five significant at the 0.05 level (two-tailed) (Table 5).
Both branded and nonbranded traffic seem to be correlated with all of the other variables as well as with each other. These two variables also demonstrate very similar correlation patterns with the other variables as well. A high correlation rate was also seen for organic traffic, which resulted in a significant correlation with all seven other variables—with six of them significant at the 0.01 level.
Pages viewed per user resulted in no statistically significant correlation with most of the other variables; however, it demonstrated a moderate but statistically significant correlation with branded traffic and nonbranded traffic as well as with organic traffic. COVID-19 cases and COVID-19 deaths had a statistically significant correlation with all other variables (with the exception of the pages viewed per user KPI), with most of them significant at the 0.01 level. Finally, bounce rate was also found to be highly correlated with all the other variables, except pages viewed per user, demonstrating in all six cases a statistical significance at the 0.01 level.
In order to clarify how a courier company should manage the corporate and reputational risk deriving from the COVID-19 pandemic, we will utilize the statistical data to develop a fuzzy cognitive map (FCM) that will help us predict customer behavior and KPI fluctuation during various stages of a pandemic. The results of FCM predictive scenarios will help organizations to plan effective risk management strategies and evaluate whether or not they should direct financial resources to brand empowering, digital marketing, and search engine optimization to mitigate their corporate risk.

3.4. Development of a Diagnostic Exploratory Model

3.4.1. Fuzzy Cognitive Map Development

For this analysis, we will utilize the passive crowdsourcing data gathered from the web analytics platforms, developing simulation scenarios based on statistically significant positive and negative interactions between all eight COVID-19 and KPI-related variables selected for this study, and focusing on providing SCRM managers information regarding strategies to reduce the corporate risk generated by novel crises like the COVID-19 pandemic. Moreover, the FCM scenario results will help organizations make efficient choices regarding resource allocation and marketing strategies.
In the previous stage of analysis, we extracted passive crowdsourcing data related to five select globally active courier companies’ root domains for a 24-month period, 12 months before and 12 months after the COVID-19 outbreak, along with COVID-19-related data for the second year. Big Data were integrated into eight variables representing the courier industry sector. These data were tested for reliability by the application of Cronbach’s alpha and we established a cause–effect relationship between KPI-related and COVID-19-related variables through independent samples t-tests.
Data were further processed through Pearson correlation coefficient testing, revealing a total of 24 statistically significant correlations, with 19 of them demonstrating strong correlation characteristics at a statistical significance level of 0.01. These results highlight the dynamic qualities comprising the online customer behavior model during a crisis with the characteristics of the COVID-19 pandemic.
Observation of variables’ fluctuation through statistical analysis allowed us to establish a causative connection between variables with high Pearson correlations (r > 0.800), even without an obvious cause–effect mechanism or even a competitive underlying link. For example, one would expect branded and nonbranded KPIs to present a negative correlation; however, since our model simulates a crisis, where the statistical analysis indicates a significant increase in organic traffic, it is acceptable to propose a strong positive correlation between branded and nonbranded traffic KPIs since they both increase because of an increase in the organic traffic KPI value. This connection is also supported by Baye et al. [72], who reported a positive connection between organic traffic and branded traffic, as well as by Jansen et al. [73], who reported nonbranded traffic as an element contained in organic traffic metrics. The causal connection between branded and nonbranded traffic is also well documented [74,75] through the “Traffic Stealing” and “Adverse Selection” techniques. Strong correlations among COVID-19-related variables and web analytics-related variables are based on consumer behavior research findings [11,12,13,14,15,16,17,18,19,20], which report the behavioral adaptations of consumers responding to external stimuli like a novel crisis.
As a result, we developed a fuzzy cognitive map (FCM) to visualize all the cause– effect interactions between COVID-19- and KPI-related variables studied in this research (Figure 1). Fuzzy cognitive mapping of this dynamic environment provides better assessment and explanatory opportunities for our study since this “soft computing” technique can simulate interaction outcomes between variables with settled correlations and help us produce more powerful suggestions regarding our proposed hypotheses.
Fuzzy cognitive maps (FCMs) are fuzzy graph structures used for illustrating causal reasoning. Their fuzzy nature allows for hazy degrees of causation between vague causal agents [76]. It can be enlisted as a “soft computing” technique for system modeling, and it combines fuzzy logic and neural networks. Although the methodology of creating FCMs is easily adjustable, it is heavily based on human knowledge and expertise [77]. FCMs have proven useful in illustrating decision support systems in many different scientific sectors like medical decision support systems [78], implementing expert decision support in urban design areas [79], and geographical information systems (GIS) [80].
Concurrently with the proliferation of Internet applications and e-commerce in business, firms are geared towards adopting web technologies that will enhance their strategic decision-making abilities [81]. Web mining and web analytics through passive crowdsourcing provide firms with useful data that need to be processed into a more comprehensible format. FCMs can provide that reasoning mechanism by extracting richer inferences from the web-mined row data [82]. The inadequacy of mainstream data analytic tools for exploiting the full potential of Big Data is also highlighted by Choi, Lee, and Irani [83], who introduce an FCM approach as a Big Data Analytics tool (BDA) that will empower decision-making prioritizing in the public sector. Focusing on online customers behavior, Lee and Lee [81] also suggest that a false interpretation of the web analytics results could easily lead to poor conclusions regarding customer behaviors, resulting in a negative impact on marketing and business growth strategies. To overcome this problem, researchers also propose utilizing a FCM-based interpretation of the web analytics data.
The proposed conceptual framework of the cognitive process driving customers to online services during a crisis is presented in Figure 2.

3.4.2. Analyzing Data through FCM Scenarios

After setting the FCM map, six scenarios were run in order to assess the predicted changes to courier companies’ websites’ KPIs in different phases of the crisis. For our scenarios, the sigmoid method was chosen. Before running the state prediction scenarios, component minimum and maximum levels for the number of worldwide COVID-19 cases as well as the number of worldwide COVID-19 deaths were set. No negative values were chosen for these components due to the nature of the variables. For both variables, the lowest and highest value of the COVID-19 period (1 March 2020 to 28 February 2021) were set to “0” and “1,” respectively.
For scenarios with different numbers of daily new worldwide COVID-19 cases, a “0” value of 1.189 cases and a “1” value of 780,326 cases were set after retrieving data from google.com. The seven-day average values were preferred to exclude extreme values that would affect the scenarios’ results (Figure 3).
Two scenarios were run: scenario 1 (Figure 4) at a level of 0.6 (467,428 daily cases) and scenario 2 (Figure 5) at a level of 0.85 (662,190 daily cases). The results of scenario 1 run (Figure 4) demonstrated a prediction of increases in branded traffic (+2%), nonbranded traffic (+2%), and organic traffic (+1%). A decrease was predicted for global ranking (–1% at 482, meaning 1% improvement) as well as bounce rate (–2%). No significant change was observed in the pages viewed per user KPI. Scenario 1 results indicated that, during the first phase of a novel crisis, courier companies are expected to attract more traffic to their websites through paid advertisements, search engine optimization, and backlinks in order to effectively manage the corporate risk generated. The results of scenario 1 indicate that allocating funds for online content optimization is not a viable corporate risk management strategy.
The results of the scenario 2 run (Figure 5) predicted an increase in branded traffic (+6%), nonbranded traffic (+5%), and organic traffic (+3%). A decrease was predicted for global ranking (–2%, meaning a 2% improvement) and bounce rate (–6%). No significant change was observed in the pages viewed per user KPI. The scenario 2 results suggest that, as a crisis escalates, courier companies should further strengthen their brand name in order to effectively manage the corporate risk generated. Companies should allocate financial resources for digital marketing and are expected to direct more traffic to their websites through paid advertisement search engine optimization and backlinks. The results of scenario 2 also indicate that providing funds to online content optimization is not an effective corporate risk management strategy.
For scenarios with different figures for the number of daily worldwide COVID-19 deaths, a “0” value of 59 deaths and a “1” value of 14,306 deaths were set after retrieving data from google.com. The seven-day average values were preferred to exclude extreme values that would affect the scenarios’ results (Figure 6).
Two scenarios were run: scenario 3 (Figure 7) at a level of 0.6 (8584 daily deaths), and scenario 4 (Figure 8) at a level of 0.85 (12,160 daily deaths).
The results of the scenario 3 run (Figure 7) demonstrated an increase in branded traffic (+2%), nonbranded traffic (+2%), and organic traffic (+1%). A decrease was predicted for global ranking (–1%, meaning a 1% improvement) and bounce rate (–2%). No significant change was observed in the pages viewed per user KPI. The results of scenario 3 align with the results of scenario 1, indicating that during the first phase of a novel crisis, courier companies should direct more traffic to their websites through paid advertisements, search engine optimization, and backlinks in order to effectively manage the corporate risk generated. The scenario 3 results do not support allocating funds for online content optimization as a viable corporate risk management strategy.
The results of the scenario 4 run (Figure 8) demonstrated an increase in branded traffic (+6%), nonbranded traffic (+5%), and organic traffic (+3%). A decrease was predicted for global ranking (–2%, meaning a 2% improvement) and bounce rate (–5%). No significant change was observed in the pages viewed per user KPI. The scenario 4 results are consistent with the scenario 2 results, indicating that, as a crisis escalates, courier companies should strengthen their brand to effectively manage the corporate risk. Companies should budget for digital marketing and be prepared to drive more traffic to their website through paid advertising, search engine optimization, and backlinks. The results of scenario 2 also show that allocating funds to online content optimization is ineffective as a corporate risk management strategy.
2 more scenarios were run applying the effects of both COVID-19 global daily cases and COVID-19 global daily deaths. For these 2 mixed scenarios “0” and “1” values were retained from previous scenarios. For scenario 5, in order to investigate the impact of both independent variables on the KPI related variables, we chose a random date (24 December 2020) and retrieved data regarding global COVID-19 cases and deaths (Figure 9). We then converted data into FCM component level indicators resulting at 0.86 for COVID-19 cases (667.680) and 0.81 for COVID-19 deaths (11.585).
The results of the scenario 5 run (Figure 10) demonstrated an increase in branded traffic (+11%), non-branded traffic (+8%), and organic traffic (+7%). A decrease was predicted for global ranking (–3%, meaning a 3% improvement) and bounce rate (–1%). No significant change was observed in the pages viewed per user KPI. These results indicate a remarkable change in customers’ reaction to the crisis when both risk factors affect their consuming decisions. These outcomes suggest that, in the case of a crisis involving more than one risk source, courier companies should be prepared to lower the corporate risk generated by directing funds to empower their brand name via digital marketing as well as their e-commerce capabilities—for example, through search engine optimization, paid advertisements, paid keywords, and backlinks. Companies should not focus their corporate risk mitigation strategies on content optimization.
For scenario 6, in order to predict the impact of a more lethal pandemic on our variables, we selected FCM component level indicators that reflected significantly more deaths than our crowdsourced data for a given number of COVID-19 cases (within the given “0” and “1” values”), suggesting a 0.85 level for COVID-19 deaths (12,160) for a 0.6 level of COVID-19 cases (467,428).
The results of the scenario 6 run (Figure 11) demonstrated an increase in branded traffic (+8%), nonbranded traffic (+6%), and organic traffic (+5%). A decrease was predicted for global ranking (–2%, meaning a 2% improvement) and bounce rate (–7%). No significant change was observed in the pages viewed per user KPI. These results suggest that the lethality of a pandemic seems to affect customer behavior in a moderate way. Organizations should not focus on this factor when developing their corporate risk management plans since it should not affect their decisions regarding the allocation of financial resources for corporate risk mitigation.

4. Results

The following section describes the first period of the COVID-19 pandemic globally (December 2019 to March 2020), as well as its impact on courier service e-commerce clients’ online behavior. This time span encompasses the beginning of the pandemic as well as the first mandatory shelter-in-place restrictions imposed in most countries. Changes in the web analytics data of courier companies’ websites are provided and analyzed. FCM scenarios’ results are reported and associated with our proposed hypotheses.

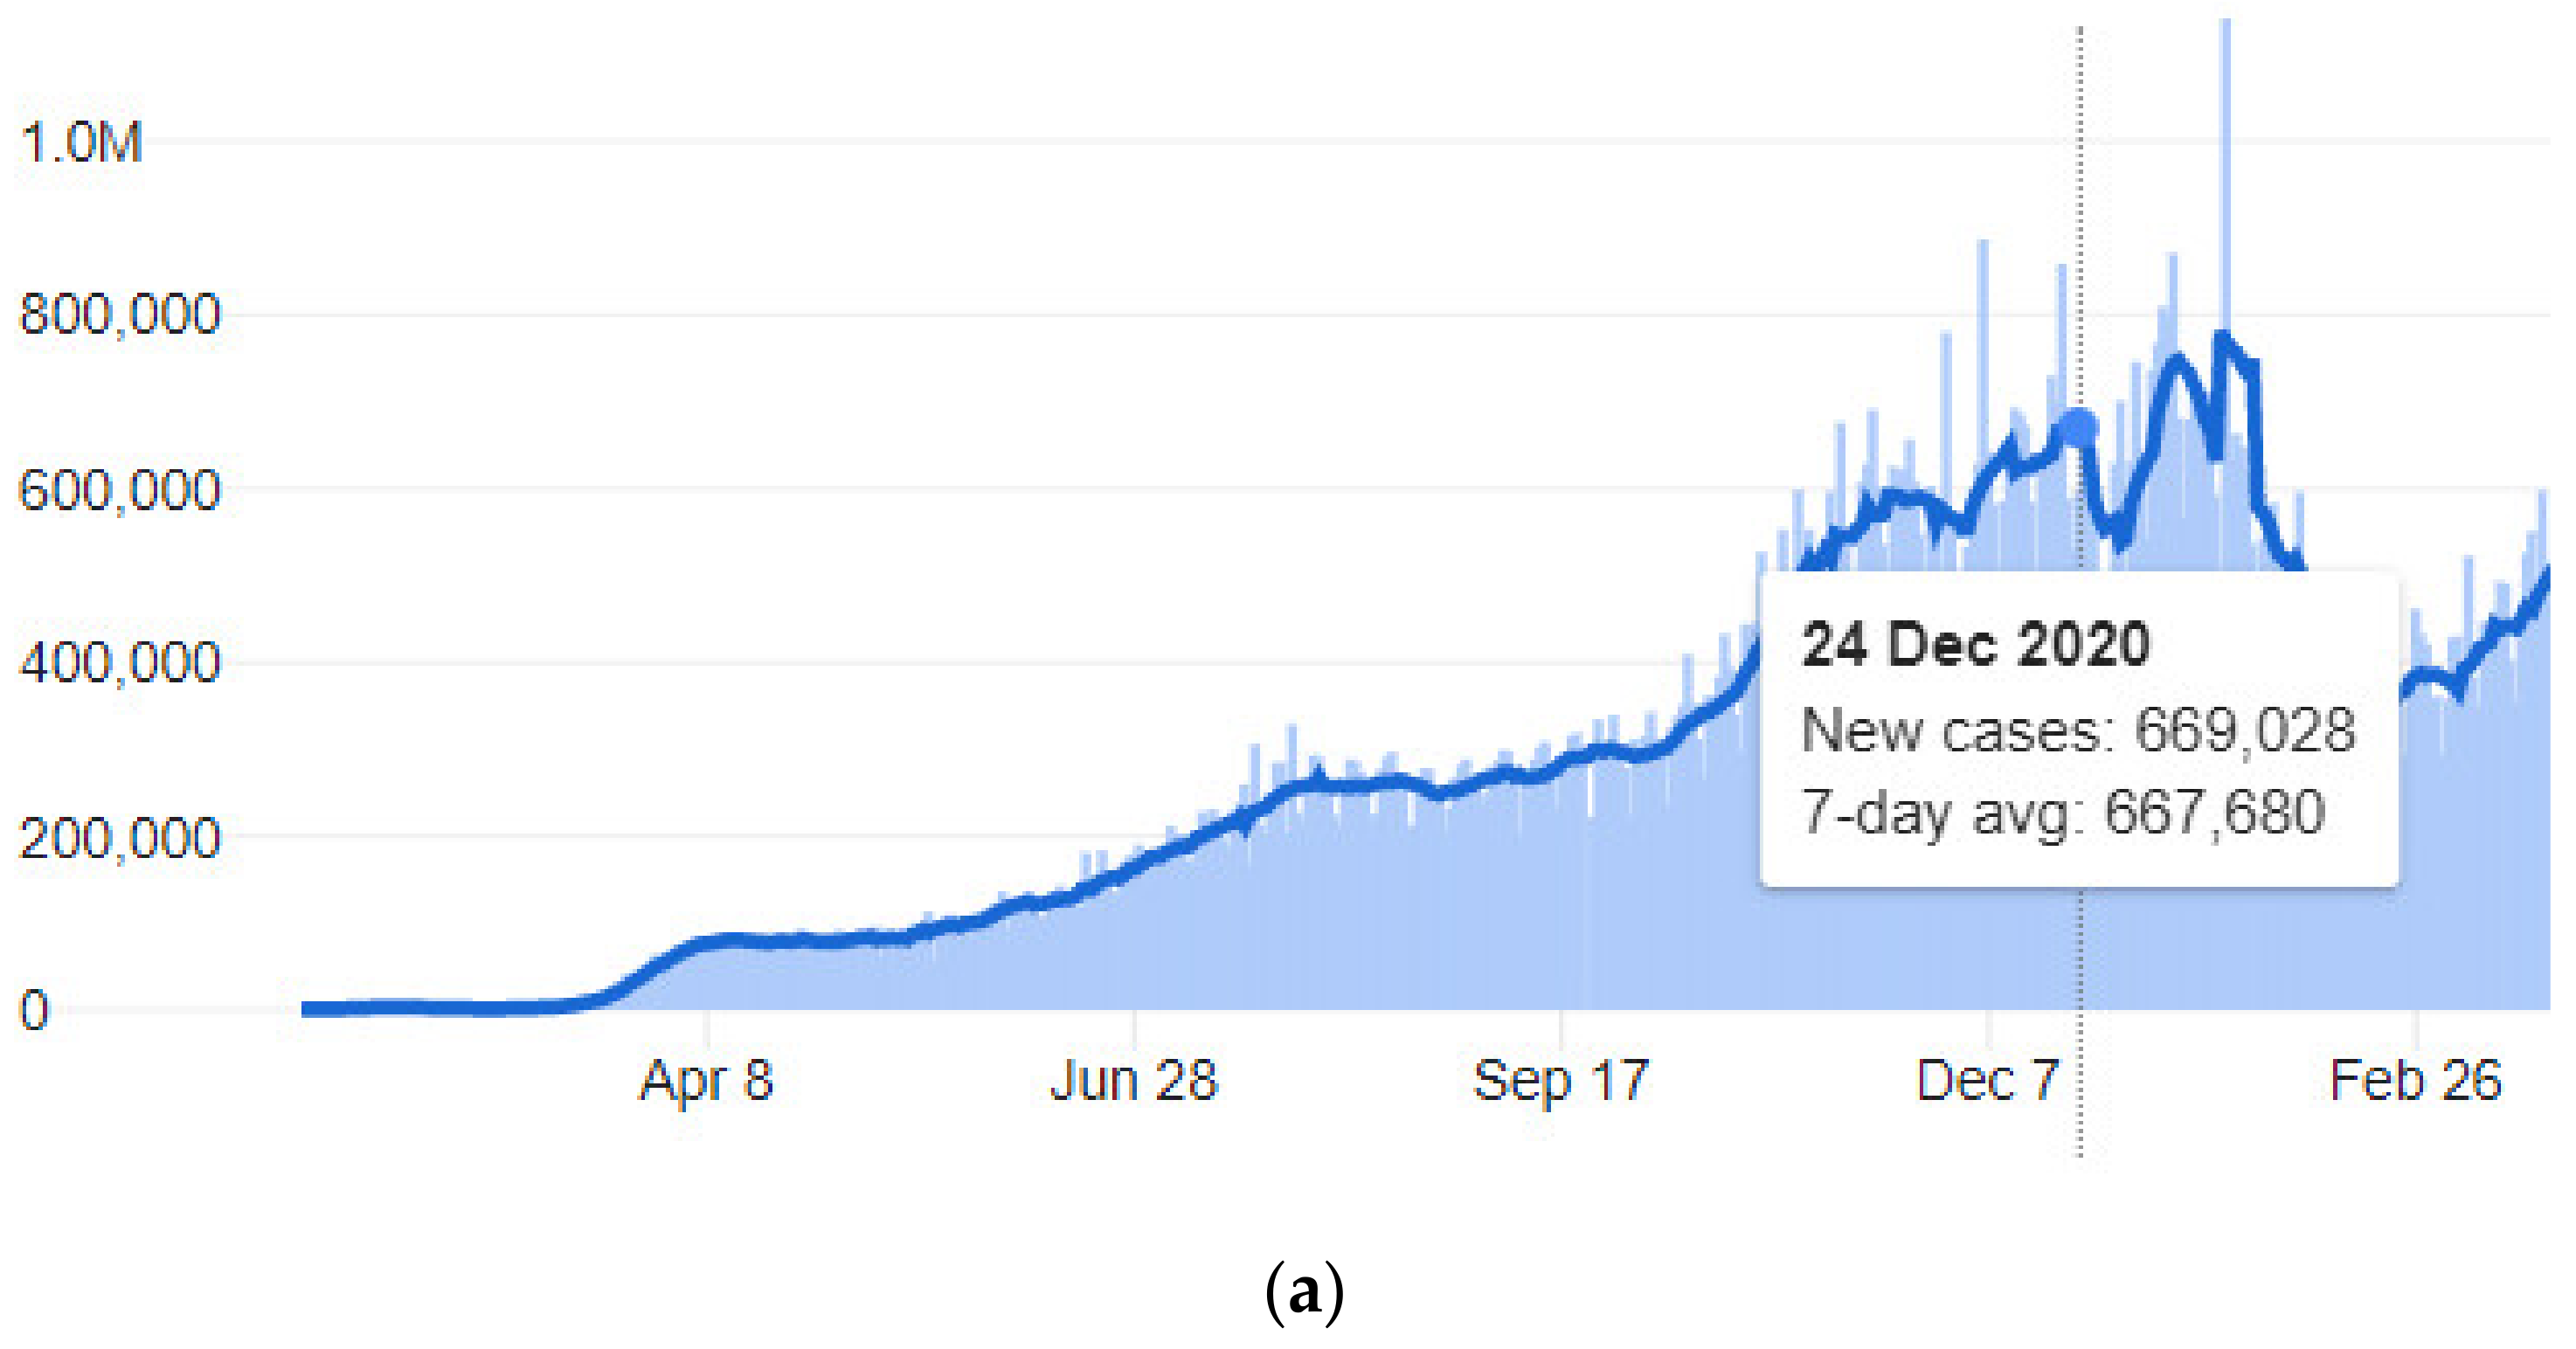
4.1. The COVID-19 Pandemic

The first reports regarding COVID-19 came on 31 December 2019 from China, when the Wuhan Municipal Health Commission reported cases of “viral pneumonia.” On 30 January 2020, the World Heath Organization (WHO) declared the outbreak a public health emergency of international concern and on 11 March 2020 it was declared a pandemic. Most countries started to adopt shelter-in-place restrictions during the last week of February 2020, up to the end of March 2020. These restrictions triggered a huge increase in courier services’ workload, leading to serious delays and service disruptions.

4.2. Changes to Customers’ Online Behavior after the COVID-19 Outbreak

The statistical results indicate that, after the COVID-19 outbreak, consumers significantly increased their online research into courier services. This indicates that the perceived risk of the COVID-19 hazard led consumers to seek more secure ways of covering their needs via courier services. Further analysis indicated that consumers used specific brand names as search terms, while nonbranded traffic underwent a significant decrease, suggesting that consumers’ risk perception guided them to choose trusted suppliers. User engagement after the outbreak was also significantly affected, suggesting that consumers were engaging more with the websites content. These changes significantly improved the global ranking KPI of the courier companies’ websites.

4.3. Changes in Customer Online Behavior during the COVID-19 Escalation

Both branded and nonbranded traffic tended to increase as the crisis escalated in terms of new infection cases; however, branded traffic seemed to respond more to this escalation. The global ranking of the related web domains improved as the crisis escalated as well, affected to a significant degree by the increase in both branded and nonbranded traffic for the websites. These findings are directly related to hypotheses H1a and H1b.
We suggest that the number of worldwide deaths from COVID-19 had a similar effect on the KPI-related variables as the number of COVID-19 cases variable, resulting in an improved global ranking of the courier companies’ websites through increased nonbranded and branded traffic, with the latter demonstrating a stronger response to the crisis escalation in terms of the number of deaths worldwide. These results are directly connected to hypotheses H2a and H2b.
Further analysis indicated that, although consumers engaged significantly more with courier companies’ websites during the COVID-19 crisis, the pages viewed per user KPI was not related to the escalation of the pandemic crisis in terms of the global infection rate, providing straight answers to the questions posed by hypotheses H3a and H3b. The same results can be applied to the H4a- and H4b-related research questions, indicating that consumer user engagement, as expressed by the pages viewed per user KPI, is not affected to a significant degree by the crisis’ escalation in terms of the number of deaths reported. However, a statistical analysis indicated that increased user engagement with the courier companies’ websites and consumers’ increased interest in both branded and nonbranded courier services during the crisis were correlated to a moderate degree.

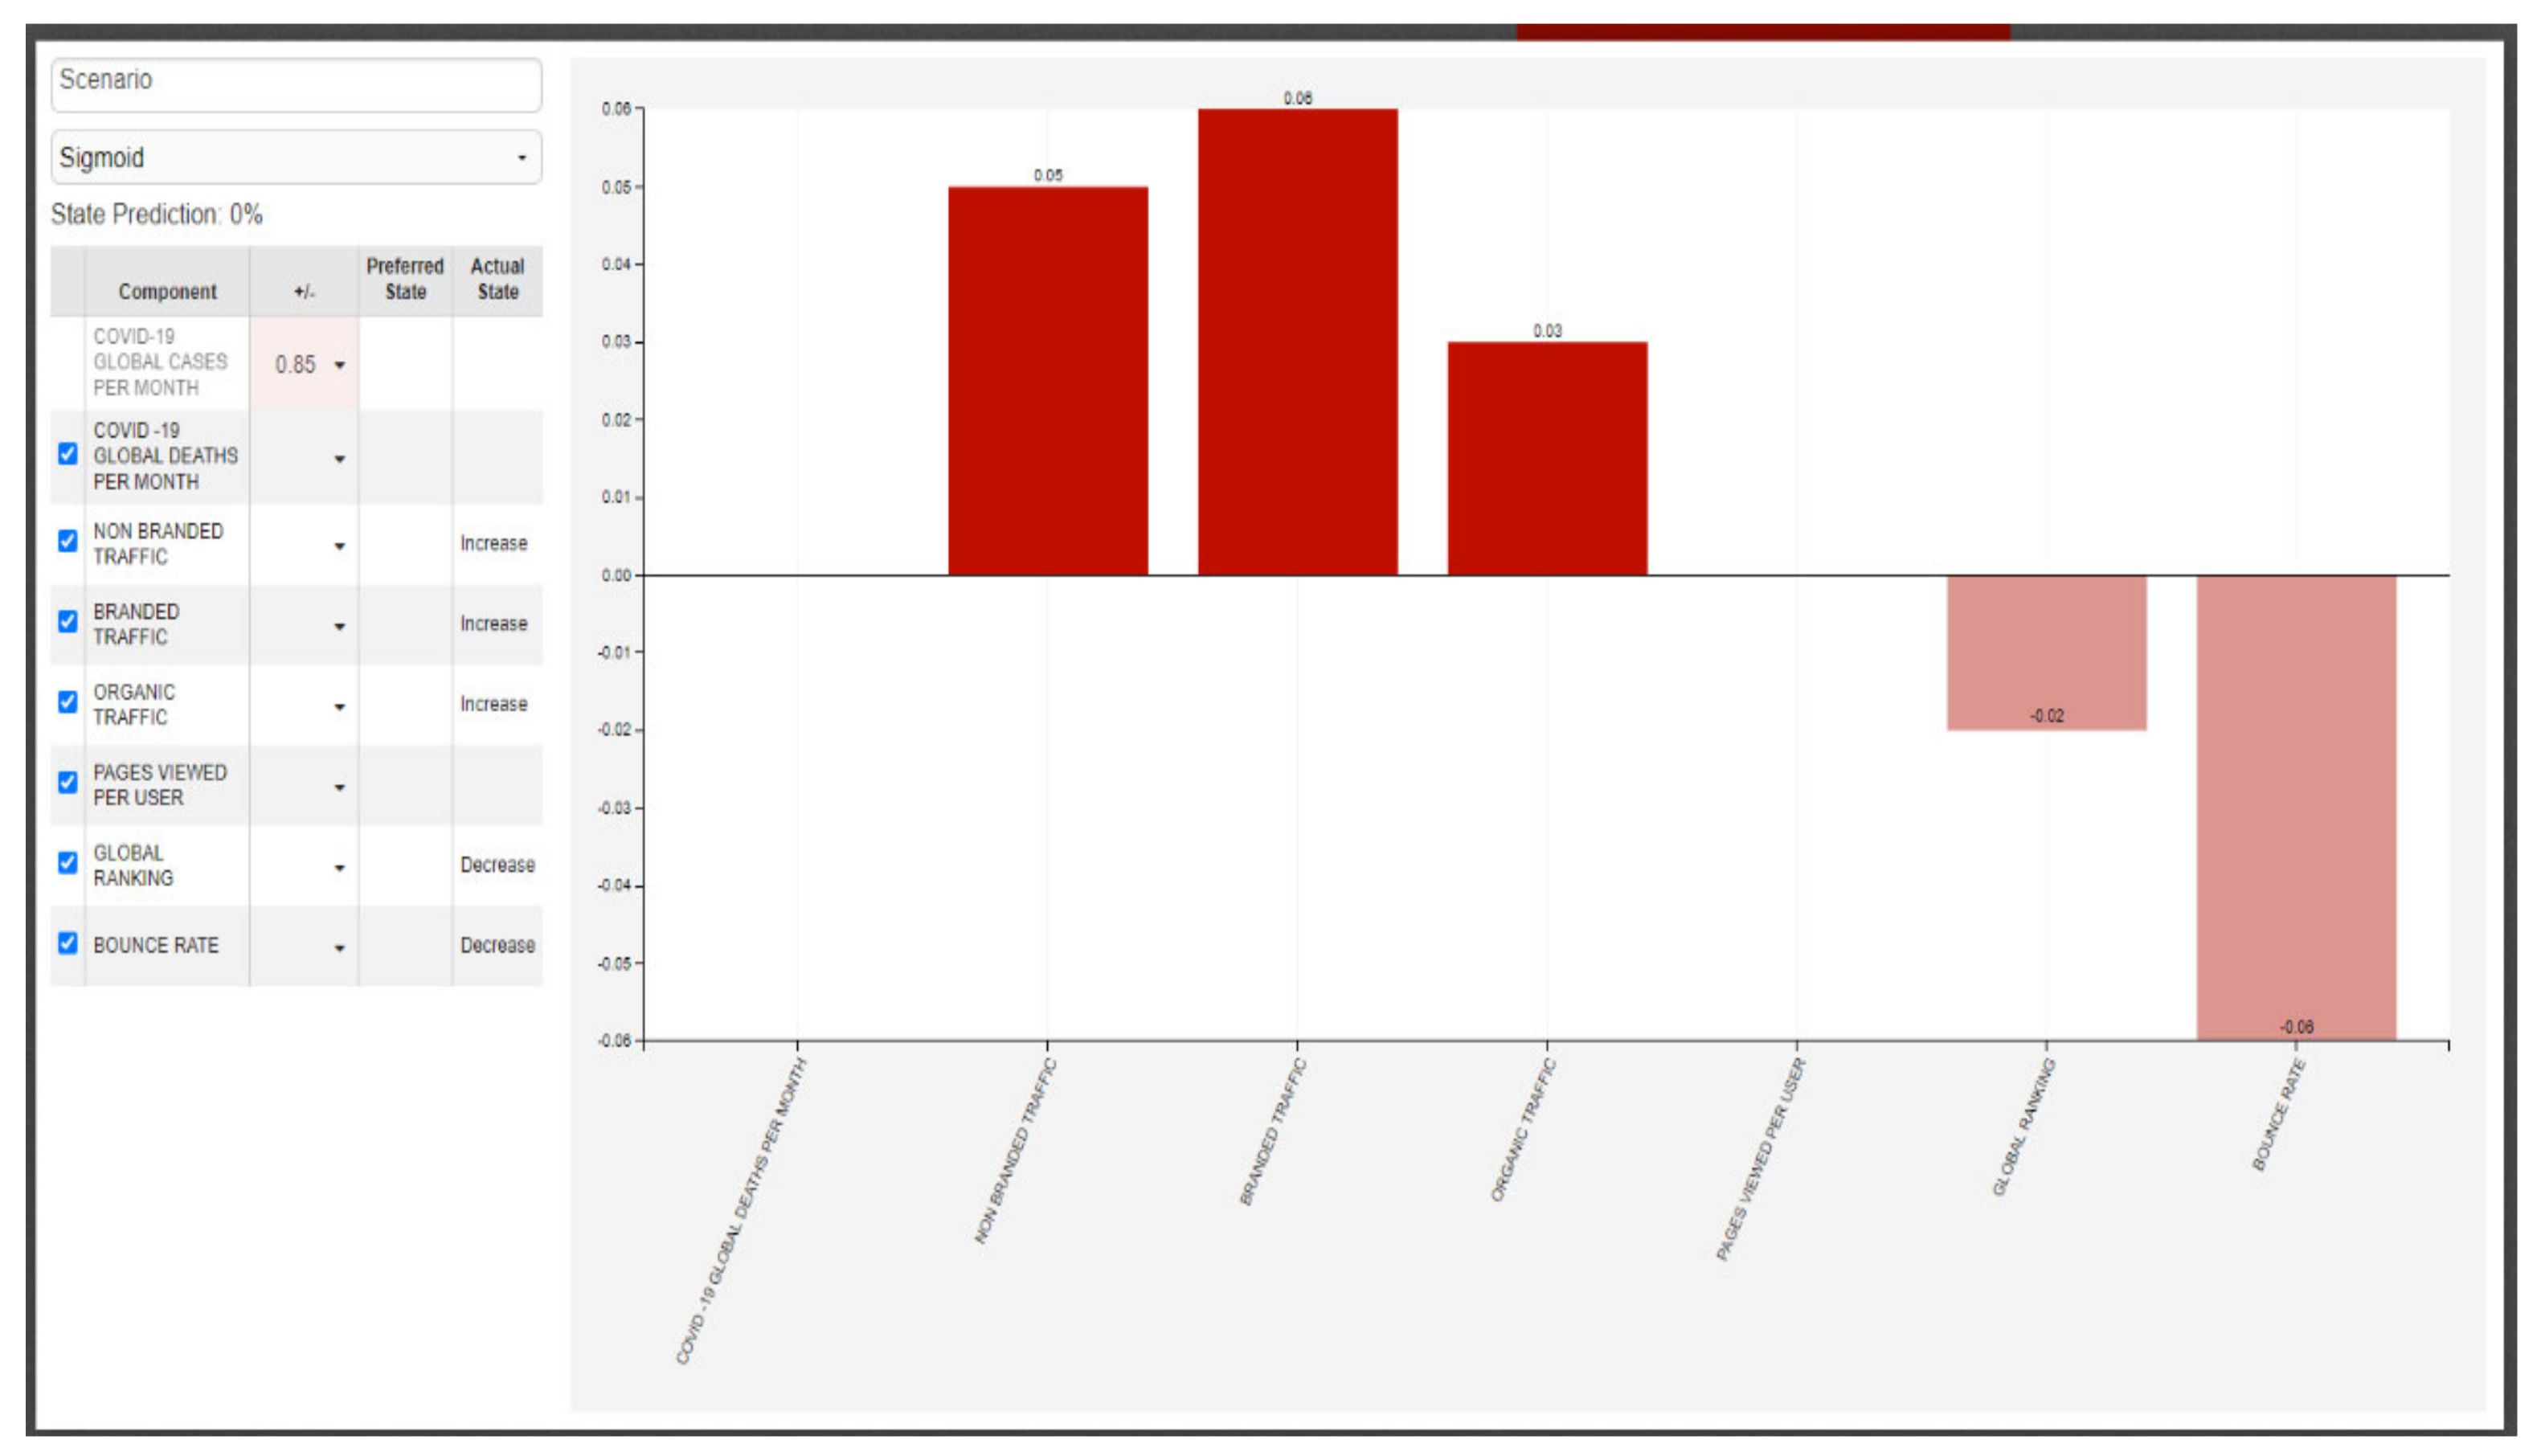
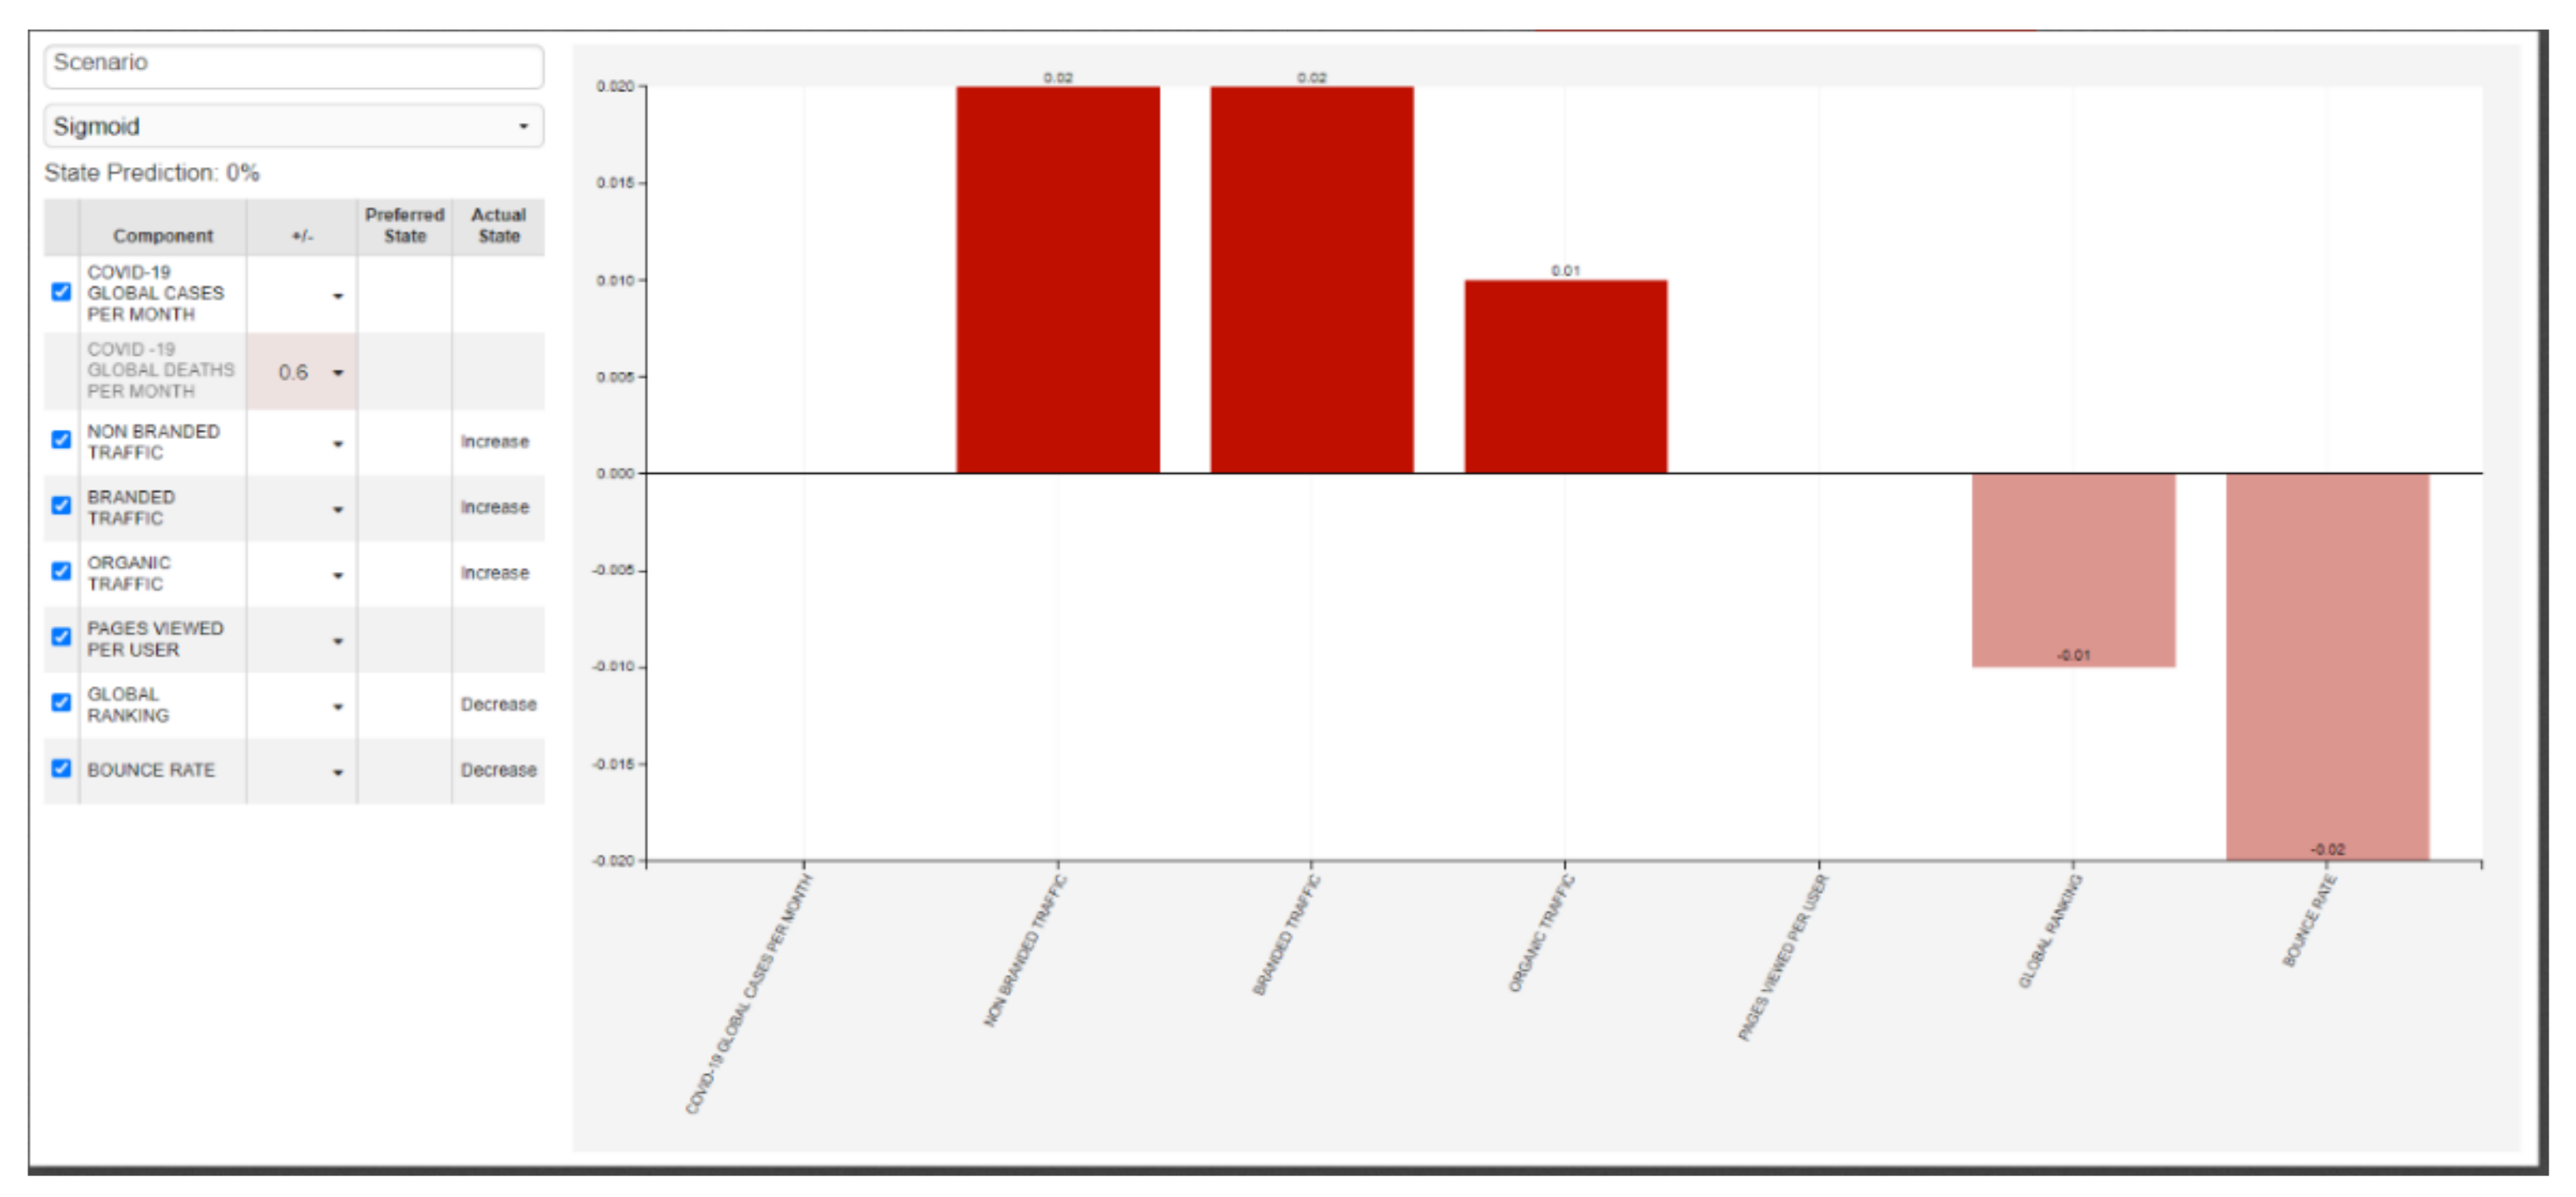
4.4. Fuzzy Cognitive Mapping Scenario Results

We ran six FCM scenarios for the COVID-19 crisis. In scenarios 1 and 2 we simulated a moderate (1) and a more acute (2) state of the crisis in terms of confirmed cases. Scenarios 1 and 2 verified the statistical results and indicated that, as the number of COVID-19 cases increases, global ranking improves (decreases) following an increase in nonbranded traffic and branded traffic values, with the latter demonstrating a more significant increase. These results support the findings regarding H1a and H2b hypotheses. Scenarios 1 and 2 also support the notion that an increase in the number of confirmed cases does not have a significant effect on the pages viewed per user KPI, as shown by our statistical outcomes regarding hypotheses H3a and H3b.
For our study, we also simulated a moderate (scenario 3) and more acute (scenario 4) level of crisis escalation, as reflected in the number of confirmed COVID-19-related deaths. Scenarios 3 and 4 confirmed our statistical findings, indicating that, as the number of COVID-19-related deaths increases, the global ranking improves (decreases) as nonbranded traffic and branded traffic values increase, with the latter showing a more significant increase. The findings related to Hypotheses H1a and H2b are supported by these scenarios. Scenarios 1 and 2 further support the idea that, based on our statistical results for H4a and H4b, an increase in the number of COVID-19-related deaths has no substantial impact on the pages viewed per user KPI.
For scenario 5, a random date was selected to simulate the effect of both independent variables on the KPI-related variables at the same time. Scenario 5 resulted in more significant changes, regarding both traffic-related and user engagement variables, than both the statistical analysis and scenarios 1–4—following, nevertheless, the same pattern.
Scenario 6 simulated a more lethal pandemic, with more deaths for a given number of infections than for COVID-19. The outcomes suggested that lethality did not significantly affect customer behavior; the results were consistent with those of scenarios 1–4.
In scenarios 5 and 6, the pages viewed per user KPI did not demonstrate any significant change.
The FCM simulation scenarios’ results suggest that, as a crisis escalates, courier companies should further strengthen their brand reputation, in order to more effectively manage the corporate risk generated. Companies should direct financial resources towards digital marketing development and should be prepared to direct more traffic to their websites via paid advertisement, search engine optimization, and backlinks. The results of the FCM simulation scenarios indicate that companies should not focus on online content optimization or adjust their corporate risk management planning to be in line with crisis lethality, since in both cases investing funds seems not to be an effective corporate risk management strategy.

5. Discussion

The purpose of this paper has been to introduce a new methodology whereby passive crowdsourcing data can be utilized by supply chain risk management departments to predict the effect of courier companies’ e-commerce customers’ risk perception on their online behavior after the outbreak and during the escalation of a novel crisis, as well as the final effect of their behavior on the global ranking of the company’s website. This information will allow SCRM managers to make effective strategic decisions regarding efficient investments to mitigate the corporate risk to their organization.
Our analysis included data mining from web analytics platforms regarding traffic-related KPIs, as well as root domain rankings and website visitor behavior information.
Comparison of data before and during the COVID-19 outbreak indicated that all six investigated KPIs were significantly affected by the pandemic. The results regarding the traffic-related KPIs support the findings of Forster and Tang [64]. For this study, in order to calculate the impact of the 2003 Hong Kong SARS crisis on ecommerce, researchers used sales units compared to the daily number of SARS infections. Researchers reported a significant growth in online sales for supermarkets. These findings align with the results of our study. Another study with similar results during the COVID-19 crisis [84] also indicated a significant increase in e-commerce activity. This study also analyzed e-commerce customer behavior during the COVID-19 crisis through a statistical analysis of web analytics data, social media analytics data, financial data, and questionnaires. The findings of this study are supported by our FCM-based findings, further suggesting that, during a health-related crisis, consumers turn to online shopping solutions for products or services. This trend is expected due to the movement restrictions applied in almost all countries, resulting in an increased demand for online shopping for goods and services. This outcome is aligned with the react–cope–adapt (RCA) model [85], which states that consumers, after initially reacting to a new constraint on their environment, develop new coping strategies and adopt new behaviors. Although this framework was developed for economical constraints, the results suggest that it could be applied to pandemic-related traffic restrictions as well.
Our results also support the findings of a study by Sheth (2020) wherein the consumer behavior adaptation to COVID-19-induced house arrest included adopting new technologies in order to facilitate consumption.
Online customer preferences regarding specific brands were also significantly affected by the crisis: a data analysis revealed that customers, after the start of this crisis, arrived at courier companies’ websites by using the company name as a search query. This finding endorses the psychometric paradigm [23], suggesting that, although courier companies faced great challenges delivering the expected level of services, online customers trusted particular companies with a good reputation, rather than searching for courier services in general. However, this relationship is not related to the escalation of the crisis, since there was no clear connection between the number of reported COVID-19 cases or deaths and the nonbranded /branded traffic ratio since both KPIs increased during the escalation of the crisis (with a higher increase for Branded Traffic), suggesting that, although consumers clearly turned to established brands, during the crisis they increased their interest in both branded and nonbranded alternatives, with a relatively higher interest in well-established brands. These findings triggered interest in the study of McCullough [86,87], who suggested that consumers may replace the negative experiences they had with a brand with previous positive experiences in order to restore their relationship with the brand through “consumer forgiveness”. Our results suggest that, during a crisis, consumers are more willing to forgive a product failure or bad service from a brand they have been engaged with in the past. The importance of the “trust” factor, as highlighted by the outcomes of our research, is also supported by the authors of [88], who indicated that building trust is one of the key factors for effective selling online. The findings regarding economical constraints in [89] are not supported by our findings, suggesting important differences between pandemic related and economical crises. In particular, while economic restrains promote more cost-efficient choices (nonbranded, private-label choices), pandemic-induced constraints encourage the choice of more trustworthy sources.
The findings also suggested that the global ranking KPI of courier services companies’ root domains improves (decreases), mostly due to increased organic traffic. This increase is possible to correlate with the escalation of the crisis, but more in terms of the reported number of COVID-19-related infections than the number of worldwide COVID-19-related deaths. This may be explained by the fact that the predominant information reported regarding the global COVID-19 escalation is the number of infections rather than deaths. This notion is also supported by the FCM simulation of a more lethal pandemic (scenario 6), where the results were mainly affected by the COVID-19 cases variable rather than the COVID-19 deaths variable.
After the COVID-19 outbreak, the pages viewed per user KPI significantly increased, but only to a moderate degree (pre-COVID-19 period average = 2.36 pages, COVID-19 period average = 2.49). This result can be interpreted by customers visiting COVID-19-related information webpages of the root domain. This increase seems not to be affected by the escalation in the COVID-19 crisis.

6. Conclusions, Limitations, and Future Research

6.1. Conclusions

We propose that, in the event of a crisis similar to the COVID-19 pandemic, courier service customers will increase their online visits to courier companies’ websites and look for services by using previously trusted brands as keywords. As the crisis escalates, customer traffic to courier businesses root domains appears to increase, through either branded or nonbranded search pathways, with a higher increase for already trusted options. However, although customers increase their engagement with the web domains they visit, this is not affected by the crisis escalation.
Based on the findings of this research, we propose that courier service companies should manage the risk of a potential crisis by investing funds in improving the corporate reputation and brand name of the organization, since customers tend to trust an established brand. This preference has a dynamic nature since customers seem to rely more on established brands as the crisis escalates.
We also suggest that an effective way to mitigate the corporate risk generated by a novel crisis is focusing on digital marketing development and customer traffic increase through paid advertisement and search engine optimization (SEO), since there is strong evidence that, during a crisis, customers increase the use of e-shopping for courier services and seek for information on their webpages regarding the crisis.

6.2. Limitations of the Research

The sample used for our study consisted of five companies and considered their market capitalization as of 1 January 2020. This criterion was selected to ensure the homogeneity of the sample in terms of financial size. However, although all five companies were active on a global scale, not all of them depended to the same extent on their website for their commercial activity, meaning that the KPIs extracted in some cases indicated significant differences between companies. Setting up a sample based on website traffic homogeneity could be an alternative research design method.
Data were collected via online web analytics platforms; however, the availability of this data varied by courier company, and not all KPIs were available on all platforms, making it challenging for researchers to collect high-quality data for a wide sample. Web analytics data, on the other hand, are solely available through this source and can be beneficial for research purposes. To overcome this challenge, future research could focus on studying specific platform KPIs so that a uniformity of data can be secured without any further processing.
The use of fuzzy cognitive mapping and crowdsourcing data to investigate the effect of a crisis on online customer behavior is a relatively new methodology. This explains why there is a scarcity of previous research and why it is difficult for researchers to compare their findings to older methodologies. A greater usage of “soft computing” approaches in online customer behavior will allow a greater number of comparative results to be extracted.

6.3. Future Research

Our findings are based on “soft computing” methods and could be improved with more sophisticated techniques. Agent-based modeling could be utilized in future research to predict in more detail the cognitive mechanism behind courier companies’ online customers’ behavior during an ongoing crisis. Moreover, future research could focus on the effect of more KPI crowdsourced data, enriching the existing cognitive model and simulating customers’ mental process in more detail.

Author Contributions

Conceptualization, I.D.G.K. and D.P.S.; Methodology, I.D.G.K.; Software, I.D.G.K.; Validation, D.P.S., I.D.G.K. and P.R.; Formal Analysis, I.D.G.K.; Investigation, I.D.G.K.; Resources, I.D.G.K.; Data Curation, I.D.G.K.; Writing—Original Draft Preparation, I.D.G.K.; Writing—Review & Editing, D.P.S.; Visualization I.D.G.K.; Supervision, D.P.S.; Project Administration, P.R.; Funding Acquisition. All authors have read and agreed to the published version of the manuscript.

Funding

This research received no external funding.

Conflicts of Interest

The authors declare no conflict of interest.

References

  1. British Standards Institution Risk Management-Guidelines (BS ISO 31000:2018 2018). Available online: https://0-www-bsigroup-com.brum.beds.ac.uk/en-GB/iso-31000-risk-management/ (accessed on 14 February 2021).
  2. Hopkin, P. Fundamentals of Risk Management: Understanding, Evaluating and Implementing Effective Risk Management; Kogan Page Publishers: New York, NY, USA, 2018; ISBN 9780749483081. [Google Scholar]
  3. Chopra, S.; Sodhi, M. Managing Risk to Avoid Supply-Chain Breakdown; MIT Sloan Management Review: Cambridge, MA, USA, 2004. [Google Scholar]
  4. Goh, M.; Lim, J.; Meng, F. A stochastic model for risk management in global supply chain networks. Eur. J. Oper. Res. 2007, 182, 164–173. [Google Scholar] [CrossRef]
  5. Jüttner, U.; Peck, H.; Christopher, M. Supply chain risk management: Outlining an agenda for future research. Int. J. Logist. Res. Appl. 2003, 6, 197–210. [Google Scholar] [CrossRef] [Green Version]
  6. Norrman, A.; Jansson, U. Ericsson’s Proactive Supply Chain Risk Management Approach After a Serious Sub-Supplier Accident. Int. J. Phys. Distrib. Logist. Manag. 2004, 34, 434–456. [Google Scholar] [CrossRef]
  7. Tang, C.S. Perspectives in supply chain risk management. Int. J. Prod. Econ. 2006, 103, 451–488. [Google Scholar] [CrossRef]
  8. Thun, J.-H.; Hoenig, D. An empirical analysis of supply chain risk management in the German automotive industry. Int. J. Prod. Econ. 2009, 131, 242–249. [Google Scholar] [CrossRef]
  9. Ho, W.; Zheng, T.; Yildiz, H.; Talluri, S. Supply Chain Risk Management: A Literature Review. Int. J. Prod. Res. 2015, 53, 5031–5069. [Google Scholar] [CrossRef]
  10. Tang, O.; Musa, N. Identifying Risk Issues and Research Advancements in Supply Chain Risk Management. Int. J. Prod. Econ. 2011, 133, 25–34. [Google Scholar] [CrossRef] [Green Version]
  11. Jisana, T.K. Consumer behaviour models: An overview. Sai Om J. Commer. Manag. 2014, 1, 34–43. [Google Scholar]
  12. Schiffman, L.G.; Kanuk, L.L.; Kumar, S.R.; Wisenblit, J. Consumer Behavior; Pearson Education: London, UK, 2010. [Google Scholar]
  13. Dijksterhuis, A.; Smith, P.K.; van Baaren, R.B.; Wigboldus, D.H.J. The Unconscious Consumer: Effects of Environment on Consumer Behavior. J. Consum. Psychol. 2005, 15, 193–202. [Google Scholar] [CrossRef]
  14. Zaichkowsky, J.L. Consumer behavior: Yesterday, today, and tomorrow. Bus. Horiz. 1991, 34, 51–59. [Google Scholar] [CrossRef]
  15. Sirgy, M.J. Self-Concept in Consumer Behavior: A Critical Review. J. Consum. Res. 1982, 9, 287. [Google Scholar] [CrossRef]
  16. Dimanche, F.; Havitz, M.E. Consumer Behavior and Tourism: Review and Extension of Four Study Areas. J. Travel Tour. Mark. 1995, 3, 37–57. [Google Scholar] [CrossRef]
  17. Reddipalli, R. Howard Sheth Model of Consumer Behaviour on Buying a Smartphone. SSRN J. 2020. [Google Scholar] [CrossRef]
  18. Tidwell, P. Compensatory Versus Non-Compensatory Choice Strategies in Limited Problem Solving Consumer Behavior: Engel-Kollat-Blackwell Versus Howard Models. In Proceedings of the 1996 Academy of Marketing Science (AMS) Annual Conference, Phoenix, AZ, USA, 29 May–1 June 1996; Wilson, E.J., Hair, J.F., Eds.; Springer International Publishing: Cham, UK, 2015; pp. 220–224, ISBN 978-3-319-13143-6. [Google Scholar]
  19. Vignali, C. Benetton’s Brand Position Explored and Developed through Nicosia’s Consumer-behaviour Model. J. Text. Inst. 1999, 90, 48–59. [Google Scholar] [CrossRef]
  20. Sherman, E.; Mathur, A.; Smith, R.B. Store environment and consumer purchase behavior: Mediating role of consumer emotions. Psychol. Mark. 1997, 14, 361–378. [Google Scholar] [CrossRef]
  21. Sjöberg, L.; Moen, B.-E.; Rundmo, T. Explaining risk perception. An. Eval. Psychom. Paradig. Risk Percept. Res. 2004, 10, 612–665. [Google Scholar]
  22. Weinstein, N.D. Unrealistic optimism about future life events. J. Personal. Soc. Psychol. 1980, 39, 806–820. [Google Scholar] [CrossRef]
  23. Fischhoff, B.; Slovic, P.; Lichtenstein, S.; Read, S.; Combs, B. How Safe Is Safe Enough? A Psychometric Study of Attitudes Toward Technological Risks and Benefits. Policy Sci. 1978, 9, 127–152. [Google Scholar] [CrossRef]
  24. Siegrist, M.; Keller, C.; Kiers, H.A.L. A new look at the psychometric paradigm of perception of hazards. Risk Anal. 2005, 25, 211–222. [Google Scholar] [CrossRef] [PubMed]
  25. Marris, C.; Langford, I.; Saunderson, T.; O’Riordan, T. Exploring the “psychometric paradigm”: Comparisons between aggregate and individual analyses. Risk Anal. 1997, 17, 303–312. [Google Scholar] [CrossRef]
  26. Douglas, M.; Wildavsky, A. Risk and Culture: An Essay on Selection of Technologicaland Environmental Dangers. Rev. Française De Sociol. 1982, 28, 178–181. [Google Scholar]
  27. Kahan, D.M. Cultural Cognition as a Conception of the Cultural Theory of Risk. In Handbook of Risk Theory: Epistemology, Decision Theory, Ethics, and Social Implications of Risk; Roeser, S., Hillerbrand, R., Sandin, P., Peterson, M., Eds.; Springer: Dordrecht, The Netherlands, 2012; pp. 725–759. ISBN 978-94-007-1433-5. [Google Scholar]
  28. Ha, H.-Y. The Effects of Consumer Risk Perception on Pre-purchase Information in Online Auctions: Brand, Word-of-Mouth, and Customized Information. J. Comput.-Mediat. Commun. 2002, 8, JCMC813. [Google Scholar] [CrossRef]
  29. Corbitt, B.J.; Thanasankit, T.; Yi, H. Trust and e-commerce: A study of consumer perceptions. Electron. Commer. Res. Appl. 2003, 2, 203–215. [Google Scholar] [CrossRef]
  30. Teo, T.S.H.; Liu, J. Consumer trust in e-commerce in the United States, Singapore and China. Omega 2007, 35, 22–38. [Google Scholar] [CrossRef]
  31. Huang, W.; Schrank, H.; Dubinsky, A.J. Effect of brand name on consumers’ risk perceptions of online shopping. J. Consum. Behav. Int. Res. 2004, 4, 40–50. [Google Scholar] [CrossRef]
  32. Babbage, C. On the Economy of Machinery and Manufactures; Cambridge University Press: Cambridge, UK, 2010; ISBN 978-0-511-69637-4. [Google Scholar]
  33. Howe, J. The Rise of Crowdsourcing. Wired Mag. 2006, 14, 1–4. [Google Scholar]
  34. Bigham, J.P.; Bernstein, M.S.; Adar, E. Human-Computer Interaction and Collective Intelligence. Bytes 2014, 170014. [Google Scholar] [CrossRef]
  35. Allon, G.; Babich, V. Crowdsourcing and Crowdfunding in the Manufacturing and Services Sectors. M&SOM 2020, 22, 102–112. [Google Scholar] [CrossRef] [Green Version]
  36. Babich, V.; Tsoukalas, G.; Marinesi, S. Does Crowdfunding Benefit Entrepreneurs and Venture Capital Investors? Manuf. Serv. Oper. Manag. 2021, 23, 508–524. [Google Scholar] [CrossRef]
  37. Gebert, M. Crowdsourcing and Risk-Management Understanding of the Risks and Potentials Associated with Crowdsourcing in a Business Context; GRIN Publishing: München, Germany, 2015; ISBN 978-3-656-93021-1. [Google Scholar]
  38. Ta, H. Assessing the Impacts of Crowdsourcing in Logistics and Supply Chain Operations. Theses Diss. 2018, 60, 19–33. [Google Scholar]
  39. Paloheimo, H.; Lettenmeier, M.; Waris, H. Transport reduction by crowdsourced deliveries—A library case in Finland. J. Clean. Prod. 2016, 132, 240–251. [Google Scholar] [CrossRef]
  40. Borgo, R.; Micallef, L.; Bach, B.; McGee, F.; Lee, B. Information Visualization Evaluation Using Crowdsourcing. Comput. Graph. Forum 2018, 37, 573–595. [Google Scholar] [CrossRef] [Green Version]
  41. Loukis, E.; Charalabidis, Y.; Androutsopoulou, A. Evaluating a Passive Social Media Citizensourcing Innovation. In Proceedings of the Electronic Government, Thessaloniki, Greece, 14 August 2015; Tambouris, E., Janssen, M., Scholl, H.J., Wimmer, M.A., Tarabanis, K., Gascó, M., Klievink, B., Lindgren, I., Parycek, P., Eds.; Springer International Publishing: Cham, UK, 2015; pp. 305–320. [Google Scholar]
  42. Charalabidis, Y.; Loukis, E.; Androutsopoulou, A.; Karkaletsis, V.; Triantafillou, A. Passive crowdsourcing in government using social media. Transform. Gov. People 2014, 8. [Google Scholar] [CrossRef]
  43. Loukis, E.; Charalabidis, Y. Active and Passive Crowdsourcing in Government. Public Adm. Inf. Technol. 2015, 10, 261–289. [Google Scholar] [CrossRef]
  44. Connors, J.P.; Lei, S.; Kelly, M. Citizen Science in the Age of Neogeography: Utilizing Volunteered Geographic Information for Environmental Monitoring. Ann. Assoc. Am. Geogr. 2012, 102, 1267–1289. [Google Scholar] [CrossRef]
  45. Arts, K.; Melero, Y.; Webster, G.; Sharma, N.; Tintarev, N.; Tait, E.; Mellish, C.; Sripada, S.; MacMaster, A.-M.; Sutherland, H.; et al. On the merits and pitfalls of introducing a digital platform to aid conservation management: Volunteer data submission and the mediating role of volunteer coordinators. J. Environ. Manag. 2020, 265, 110497. [Google Scholar] [CrossRef]
  46. Ciceri, E. Humans in the loop: Optimization of active and passive crowdsourcing. Politec. Di Milano 2015, 27, 2903. [Google Scholar]
  47. Sakas, D.P.; Giannakopoulos, N.T. Harvesting Crowdsourcing Platforms’ Traffic in Favour of Air Forwarders’ Brand Name and Sustainability. Sustainability 2021, 13, 8222. [Google Scholar] [CrossRef]
  48. Weischedel, B.; Matear, S.; Deans, K.R. The use of emetrics in strategic marketing decisions: A preliminary investigation. IJIMA 2005, 2, 109. [Google Scholar] [CrossRef]
  49. Kirsh, I.; Joy, M. Splitting the Web Analytics Atom: From Page Metrics and KPIs to Sub-Page Metrics and KPIs. In Proceedings of the 10th International Conference on Web Intelligence, Mining and Semantics, Biarritz, France, 30 June–3 July 2020; pp. 33–43. [Google Scholar]
  50. Phippen, A.; Sheppard, L.; Furnell, S. A practical evaluation of Web analytics. Internet Res. 2004, 14, 284–293. [Google Scholar] [CrossRef]
  51. Mani, V.; Delgado, C.; Hazen, B.; Patel, P. Mitigating Supply Chain Risk via Sustainability Using Big Data Analytics: Evidence from the Manufacturing Supply Chain. Sustainability 2017, 9, 608. [Google Scholar] [CrossRef] [Green Version]
  52. Järvinen, J.; Karjaluoto, H. The use of Web analytics for digital marketing performance measurement. Ind. Mark. Manag. 2015, 50, 117–127. [Google Scholar] [CrossRef] [Green Version]
  53. Mikusz, M.; Clinch, S.; Jones, R.; Harding, M.; Winstanley, C.; Davies, N. Repurposing Web Analytics to Support the IoT. Computer 2015, 48, 42–49. [Google Scholar] [CrossRef] [Green Version]
  54. Akkus, I.E.; Chen, R.; Hardt, M.; Francis, P.; Gehrke, J. Non-tracking web analytics. In Proceedings of the 2012 ACM Conference on Computer and Communications Security, Raleigh, NC, USA, 16–18 October 2012; Association for Computing Machinery: New York, NY, USA, 2012; pp. 687–698. [Google Scholar]
  55. Sakas, D.P.; Reklitis, D.P. The Impact of Organic Traffic of Crowdsourcing Platforms on Airlines’ Website Traffic and User Engagement. Sustainability 2021, 13, 8850. [Google Scholar] [CrossRef]
  56. Schlüter, F. Procedure Model for Supply Chain Digitalization Scenarios for a Data-Driven Supply Chain Risk Management. In Revisiting Supply Chain Risk; Zsidisin, G.A., Henke, M., Eds.; Springer Series in Supply Chain Management: Cham, UK, 2019; Volume 7, pp. 137–154. ISBN 978-3-030-03812-0. [Google Scholar]
  57. Baryannis, G.; Validi, S.; Dani, S.; Antoniou, G. Supply Chain Risk Management and Artificial Intelligence: State of the Art and Future Research Directions. Int. J. Prod. Res. 2018. [Google Scholar] [CrossRef]
  58. Shang, Y.; Dunson, D.; Song, J.-S. Exploiting Big Data in Logistics Risk Assessment via Bayesian Nonparametrics. Oper. Res. 2017, 65, 1574–1588. [Google Scholar] [CrossRef] [Green Version]
  59. Fan, Y.; Heilig, L.; Voß, S. Supply Chain Risk Management in the Era of Big Data. In Design, User Experience, and Usability: Design Discourse; Lecture Notes in Computer Science; Marcus, A., Ed.; Springer International Publishing: Cham, UK, 2015; Volume 9186, pp. 283–294. ISBN 978-3-319-20885-5. [Google Scholar]
  60. Er Kara, M.; Oktay Fırat, S.Ü.; Ghadge, A. A data mining-based framework for supply chain risk management. Comput. Ind. Eng. 2020, 139, 105570. [Google Scholar] [CrossRef]
  61. Miao, H.; Ji, H.; Wang, Q.; Ren, C.; Lougee, R. Big data fueled process management of supply risks: Sensing, prediction, evaluation and mitigation. In Proceedings of the Winter Simulation Conference, Savannah, GA, USA, 7–10 December 2014; IEEE: Savanah, GA, USA, 2014; pp. 1005–1013. [Google Scholar]
  62. Li, D.; Wang, X. Dynamic supply chain decisions based on networked sensor data: An application in the chilled food retail chain. Int. J. Prod. Res. 2017, 55, 5127–5141. [Google Scholar] [CrossRef] [Green Version]
  63. Papadopoulos, T.; Gunasekaran, A.; Dubey, R.; Altay, N.; Childe, S.J.; Fosso-Wamba, S. The role of Big Data in explaining disaster resilience in supply chains for sustainability. J. Clean. Prod. 2017, 142, 1108–1118. [Google Scholar] [CrossRef] [Green Version]
  64. Forster, P.W.; Tang, Y. The Role of Online Shopping and Fulfillment in the Hong Kong SARS Crisis. In Proceedings of the 38th Annual Hawaii International Conference on System Sciences, Big Island, HI, USA, 3–6 January 2005; p. 271a. [Google Scholar]
  65. World Top Courier Companies by Market Value as on 2020. Available online: https://www.value.today/world-top-companies/courier?title=&field_headquarters_of_company_target_id&field_company_category_primary_target_id&field_market_value_jan_2020_value_1=&page=0 (accessed on 18 May 2021).
  66. SEO Glossary|Semrush. Available online: https://www.semrush.com/kb/925-glossary (accessed on 18 May 2021).
  67. What Is Organic Traffic? Definition—Omniconvert. Available online: https://www.omniconvert.com/what-is/organic-traffic/ (accessed on 18 May 2021).
  68. Bagdasarova, I. What Is Branded Traffic and How to Increase It. Available online: https://www.promodo.com/blog/branded-traffic-why-its-crucial-for-ecommerce-and-how-to-increase-it/ (accessed on 18 May 2021).
  69. WAA Standards Committee. Web Analytics Definitions; Web Analytics Association: Washington, DC, USA, 2008. [Google Scholar]
  70. Bonett, D.G. Sample Size Requirements for Testing and Estimating Coefficient Alpha. J. Educ. Behav. Stat. 2002, 27, 335–340. [Google Scholar] [CrossRef]
  71. Bujang, M.A.; Omar, E.D.; Baharum, N.A.; Clinical Research Centre, Serdang Hospital, Ministry of Health, Selangor, Malaysia; National Clinical Research Centre, Ministry of Health, Kuala Lumpur, Malaysia. A Review on Sample Size Determination for Cronbach’s Alpha Test: A Simple Guide for Researchers. MJMS 2018, 25, 85–99. [Google Scholar] [CrossRef] [PubMed]
  72. Baye, M.R.; De los Santos, B.; Wildenbeest, M.R. Search Engine Optimization: What Drives Organic Traffic to Retail Sites? J. Econ. Manag. Strategy 2016, 25, 6–31. [Google Scholar] [CrossRef] [Green Version]
  73. Jansen, B.J.; Sobel, K.; Zhang, M. The Brand Effect of Key Phrases and Advertisements in Sponsored Search. Int. J. Electron. Commer. 2011, 16, 77–106. [Google Scholar] [CrossRef]
  74. Simonov, A.; Hill, S. Competitive Advertising on Brand Search: Traffic Stealing and Click Quality. Mark. Sci. 2021, 40, 923–945. [Google Scholar] [CrossRef]
  75. Simonov, A.; Hill, S. Competitive Advertising on Brand Search: Traffic Stealing, Adverse Selection and Customer Confusion. SSRN J. 2018. [Google Scholar] [CrossRef] [Green Version]
  76. Kosko, B. Fuzzy cognitive maps. Int. J. Man-Mach. Stud. 1986, 24, 65–75. [Google Scholar] [CrossRef]
  77. Papageorgiou, E.; Stylios, C.; Groumpos, P. Fuzzy Cognitive Map Learning Based on Nonlinear Hebbian Rule. In AI 2003: Advances in Artificial Intelligence; Lecture Notes in Computer Science; Gedeon, T.D., Fung, L.C.C., Eds.; Springer Berlin Heidelberg: Berlin/Heidelberg, Germany, 2003; Volume 2903, pp. 256–268. ISBN 978-3-540-20646-0. [Google Scholar]
  78. Stylios, C.D.; Georgopoulos, V.C.; Malandraki, G.A.; Chouliara, S. Fuzzy cognitive map architectures for medical decision support systems. Appl. Soft. Comput. 2008, 8, 1243–1251. [Google Scholar] [CrossRef]
  79. Xirogiannis, G.; Stefanou, J.; Glykas, M. A fuzzy cognitive map approach to support urban design. Expert Syst. Appl. 2004, 26, 257–268. [Google Scholar] [CrossRef]
  80. Liu, Z.; Satur, R. Contextual fuzzy cognitive map for decision support in geographic information systems. IEEE Trans. Fuzzy Syst. 1999, 7, 495–507. [Google Scholar] [CrossRef]
  81. Lee, K.C.; Lee, S. Interpreting the web-mining results by cognitive map and association rule approach. Inf. Process. Manag. 2011, 47, 482–490. [Google Scholar] [CrossRef]
  82. Lee, K. Fuzzy cognitive map approach to web-mining inference amplification. Expert Syst. Appl. 2002, 22, 197–211. [Google Scholar] [CrossRef]
  83. Choi, T.-M.; Chan, H.; Yue, X. Recent Development in Big Data Analytics for Business Operations and Risk Management. IEEE Trans. Cybern. 2016, 99. [Google Scholar] [CrossRef]
  84. Guthrie, C.; Fosso-Wamba, S.; Arnaud, J.B. Online consumer resilience during a pandemic: An exploratory study of e-commerce behavior before, during and after a COVID-19 lockdown. J. Retail. Consum. Serv. 2021, 61, 102570. [Google Scholar] [CrossRef]
  85. Hamilton, R.W.; Mittal, C.; Shah, A.; Thompson, D.V.; Griskevicius, V. How Financial Constraints Influence Consumer Behavior: An Integrative Framework. J. Consum. Psychol. 2019, 29, 285–305. [Google Scholar] [CrossRef]
  86. Sheth, J. Impact of Covid-19 on consumer behavior: Will the old habits return or die? J. Bus. Res. 2020, 117, 280–283. [Google Scholar] [CrossRef]
  87. McCullough, M.E. Forgiveness as Human Strength: Theory, Measurement, and Links to Well-Being. J. Soc. Clin. Psychol. 2000, 19, 43–55. [Google Scholar] [CrossRef]
  88. Kim, R.Y. The Impact of COVID-19 on Consumers: Preparing for Digital Sales. IEEE Eng. Manag. Rev. 2020, 48, 212–218. [Google Scholar] [CrossRef]
  89. Sarmento, M.; Marques, S.; Galan—Ladero, M. Consumption dynamics during recession and recovery: A learning journey. J. Retail. Consum. Serv. 2019, 50, 226–234. [Google Scholar] [CrossRef] [Green Version]
Figure 1. Fuzzy cognitive map (FCM) displaying the correlations between all eight variables. Positive and negative correlations are indicated by blue and orange arrows, respectively. The direction of the arrow demonstrates the cause–effect relationship and the width of the arrow is related to the strength of the correlation. This FCM was created using the Mental Modeler cloud-based application (http://www.mentalmodeler.com).
Sustainability 13 12725 g001
Figure 2. Conceptual framework for understanding the proposed mechanisms that affect courier companies’ websites’ global ranking during the COVID-19 crisis escalation.
Sustainability 13 12725 g002
Figure 3. (a) Screenshot from google.com demonstrating the number of daily new worldwide cases of COVID-19, with the date selected as the “0” level value; (b) screenshot from google.com demonstrating the number of daily new worldwide cases of COVID-19, with the date selected as the “1” level value.
Sustainability 13 12725 g003
Figure 4. Screenshot from mentalmodeler.com demonstrating the results of scenario 1.
Sustainability 13 12725 g004
Figure 5. Screenshot from mentalmodeler.com demonstrating the results of scenario 2.
Sustainability 13 12725 g005
Figure 6. (a) Screenshot from google.com demonstrating the number of daily new worldwide cases of COVID-19, with the date selected as the “0” level value; (b) screenshot from google.com demonstrating the number of daily new worldwide cases of COVID-19, with the date selected as the “1” level value.
Sustainability 13 12725 g006
Figure 7. Screenshot from mentalmodeler.com demonstrating the results of scenario 3.
Sustainability 13 12725 g007
Figure 8. Screenshot from mentalmodeler.com demonstrating the results of scenario 4.
Sustainability 13 12725 g008
Figure 9. (a) Screenshot from google.com demonstrating the number of daily new worldwide cases of COVID-19 in scenario 5; (b) screenshot from google.com demonstrating the number of daily new worldwide cases of COVID-19 in scenario 5.
Sustainability 13 12725 g009aSustainability 13 12725 g009b
Figure 10. Screenshot from mentalmodeler.com demonstrating the results of scenario 5.
Sustainability 13 12725 g010
Figure 11. Screenshot from mentalmodeler.com demonstrating the results of scenario 6.
Sustainability 13 12725 g011
Table 1. Description of the examined Key Performance Indicators (KPIs).
KPIDescription of the KPI
Global RankingGlobal ranking indicates how much of a presence a domain has on the Internet based on organic rankings and search traffic. This number is calculated based on the visibility of the domain’s ranking for the keywords that are displayed in the web analytics platform database [66].
Organic TrafficOrganic traffic is a metric used for referring to the visitors that land on your website as a result of unpaid (“organic”) search results [67].
Branded TrafficBranded traffic is the percentage of website traffic that comes from visitors who have included your brand name in the search queries [68].
Nonbranded TrafficNonbranded traffic is every search query that did not contain the company’s name but still resulted in a visit to the site [58].
Bounce RateBounce rate is a metric that tells you the percentage of users who land on one page of a website and then leave the site without viewing any other pages [66].
Pages Viewed per UserPages viewed per user shows the number of page views in a reporting period divided by the number of visits in the same reporting period [69].
Table 2. Descriptive statistics of KPI-related variables with Cronbach’s alpha evaluation.
VariableTime PeriodNMeanStandard DeviationStandard Error MeanCronbach’s Alpha
Global
Ranking
pre-COVID-19121,499,8391,290,78237,2620.673
COVID-1912959,013191,39755,251
Branded Trafficpre-COVID-19124.8131.8820.5430.683
COVID-19128.9831.5470.447
Nonbranded Trafficpre-COVID-193652,299,2451,722,149497,1420.590
COVID-19365570,118101,20829,216
Organic
Traffic
pre-COVID-1912854,649,533854,649,533246,716,0690.609
COVID-191217,552,223,0003,591,808,6401,036,865,843
Bounce
Rate
pre-COVID-19120.4440.05550.01600.562
COVID-19120.3600.01580.005
Pages Viewed
per User
pre-COVID-19122.3560.1060.0310.594
COVID-19122.4890.0900.026
Table 3. Descriptive statistics of COVID-19-related variables.
VariableNMeanStandard DeviationStandard Error Mean
COVID-19 Cases122,215,802,6601,504,470,070434,303,099
COVID-19 Deaths1249,644,34724,349,4487,029,080
Table 4. Descriptive independent samples t-test results of KPI-related variable for pre-COVID-19 and COVID-19 differences.
Variable Levene’s Test for Equality of Variancest-test for Equality of Means
Significance (2-Tailed)Mean DifferenceStandard Error Difference
Global Ranking0.1750.000540,82566,642
Branded Traffic0.1990.000−4.1690.703
Nonbranded Traffic0.0000.0051,729,127497,999
Organic Traffic 0.0000.000−5,818,833,5501,065,814,052
Bounce Rate0.0000.0000.0850.0167
Pages Viewed per User0.5650.003−0.1330.040
Table 5. Statistically significant correlations between variables after PCC analysis.
VariablesPearson CorrelationSignificance
(2-Tailed)
Branded TrafficandCOVID-19 Cases0.8680.000
Branded TrafficandCOVID-19 Deaths0.8430.001
Branded TrafficandGlobal Ranking−0.7740.003
Branded TrafficandPages Viewed per User0.6600.019
Branded TrafficandBounce Rate−0.7750.003
Branded TrafficandOrganic Traffic0.9860.000
Branded TrafficandNonbranded Traffic0.9590.000
Nonbranded TrafficandCOVID-19 Cases0.8670.000
Nonbranded TrafficandCOVID-19 Deaths0.8760.000
Nonbranded TrafficandGlobal Ranking−0.6620.019
Nonbranded TrafficandPages Viewed per User0.6740.016
Nonbranded TrafficandBounce Rate−0.7730.006
Nonbranded TrafficandOrganic Traffic0.9530.000
Organic Traffic andCOVID-19 Cases0.9000.000
Organic Traffic andCOVID-19 Deaths0.8930.000
Organic Traffic andGlobal Ranking−0.7560.004
Organic Traffic andPages Viewed per User0.6100.035
Organic Traffic andBounce Rate−0.7830.003
Bounce RateandCOVID-19 Cases−0.8420.001
Bounce RateandCOVID-19 Deaths−0.7510.005
Bounce RateandGlobal Ranking0.7510.005
Global RankingandCOVID-19 Cases−0.8060.002
Global RankingandCOVID-19 Deaths−0.5970.04
COVID-19 CasesandCOVID-19 Deaths0.8680.000
Publisher’s Note: MDPI stays neutral with regard to jurisdictional claims in published maps and institutional affiliations.

