
Building Integrated Photovoltaic (BIPV) in Southeast Asian Countries: Review of Effects and Challenges


School of Housing Building and Planning, Universiti Sains Malaysia, George Town 11800, Malaysia
*
Authors to whom correspondence should be addressed.
Sustainability 2021, 13(23), 12952; https://0-doi-org.brum.beds.ac.uk/10.3390/su132312952
Submission received: 25 August 2021
/
Revised: 4 November 2021
/
Accepted: 5 November 2021
/
Published: 23 November 2021
(This article belongs to the Special Issue Towards Sustainable Built Environment: Trending Methods and Practices)
Abstract
:Fossil fuel consumption for electricity generation in the building sector is at an all-time high in line with the country’s economic growth. This scenario will increase the global CO2 emissions and large carbon footprints, thus leading to global warming. In recent years, most of the research related to the building sector has focused on the development of new techniques to reduce buildings’ energy consumption through energy conservation, energy efficiency, and the implementation of renewable energy technologies. The introduction of photovoltaic (PV) technology has become the most prominent renewable energy (RE) that can be integrated into building components. Even though the Building Integrated Photovoltaic (BIPV) has been available for decades, but its implementation in Southeast Asian countries has not gained widespread acceptance compared to European countries and other parts of Asia. This paper aims to investigate the effects and challenges of BIPV implementation in Southeast Asian Countries (Cambodia, Indonesia, Laos, Malaysia, Singapore, Thailand, Vietnam, and the Philippines), focusing on climate effects, the initial cost of PV technology, government policies, and initiatives. An in-depth literature review from past research, policies, and reports taken between 2016 to 2021 has been conducted and found that the environmental parameters directly influence the performance of BIPV systems and affect efficiency. This study pointed at Feed-in Tariff (FiT), policies and initiatives offered by the government in Southeast Asian countries are not beneficial and discourage building owners to adopt the BIPV technology or any other RE technology. Governments should revise the current policies to promote and attract more building owners to take part in the efforts to minimize CO2 emissions from the building industry.
1. Introduction
In recent years, most research related to building components and design are focused on energy conservation, energy efficiency and the integration of RE technologies into building components or systems to make buildings more sustainable and resilient towards climate change and global warming. BIPV are the most promising technologies, especially when combined with a semi-transparent solar cell, due to the ability to generate electricity without affecting the design of the building’s facade, particularly in glazed high-rise buildings [1]. Semi-transparent photovoltaics (STPVs) have shown that they can produce renewable energy and provide the occupant with a decent amount of natural daylight. Despite the many advantages of BIPV technology for the building owner and its occupants, the implementation of such technologies is not widely used in certain countries, especially in the southeast Asia region. According to Southeast Asia Energy Outlook 2019, the contribution of solar and wind energy to the total energy supply remains small [2,3]. This paper aims to conduct an overall review of the recent literature of BIPV, applications, challenges, and how governments are initiating and promoting PV technologies through feed-in tariff methods in some Southeast Asian countries, by analysing the collected data to find out which country managed to operate with the full potential of BIPV technology. Moreover, this paper investigates and explores the potential of BIPV in Southeast Asian countries and maximise the applications of BIPV not only on rooftops of the buildings but also on the building’s façade [4].
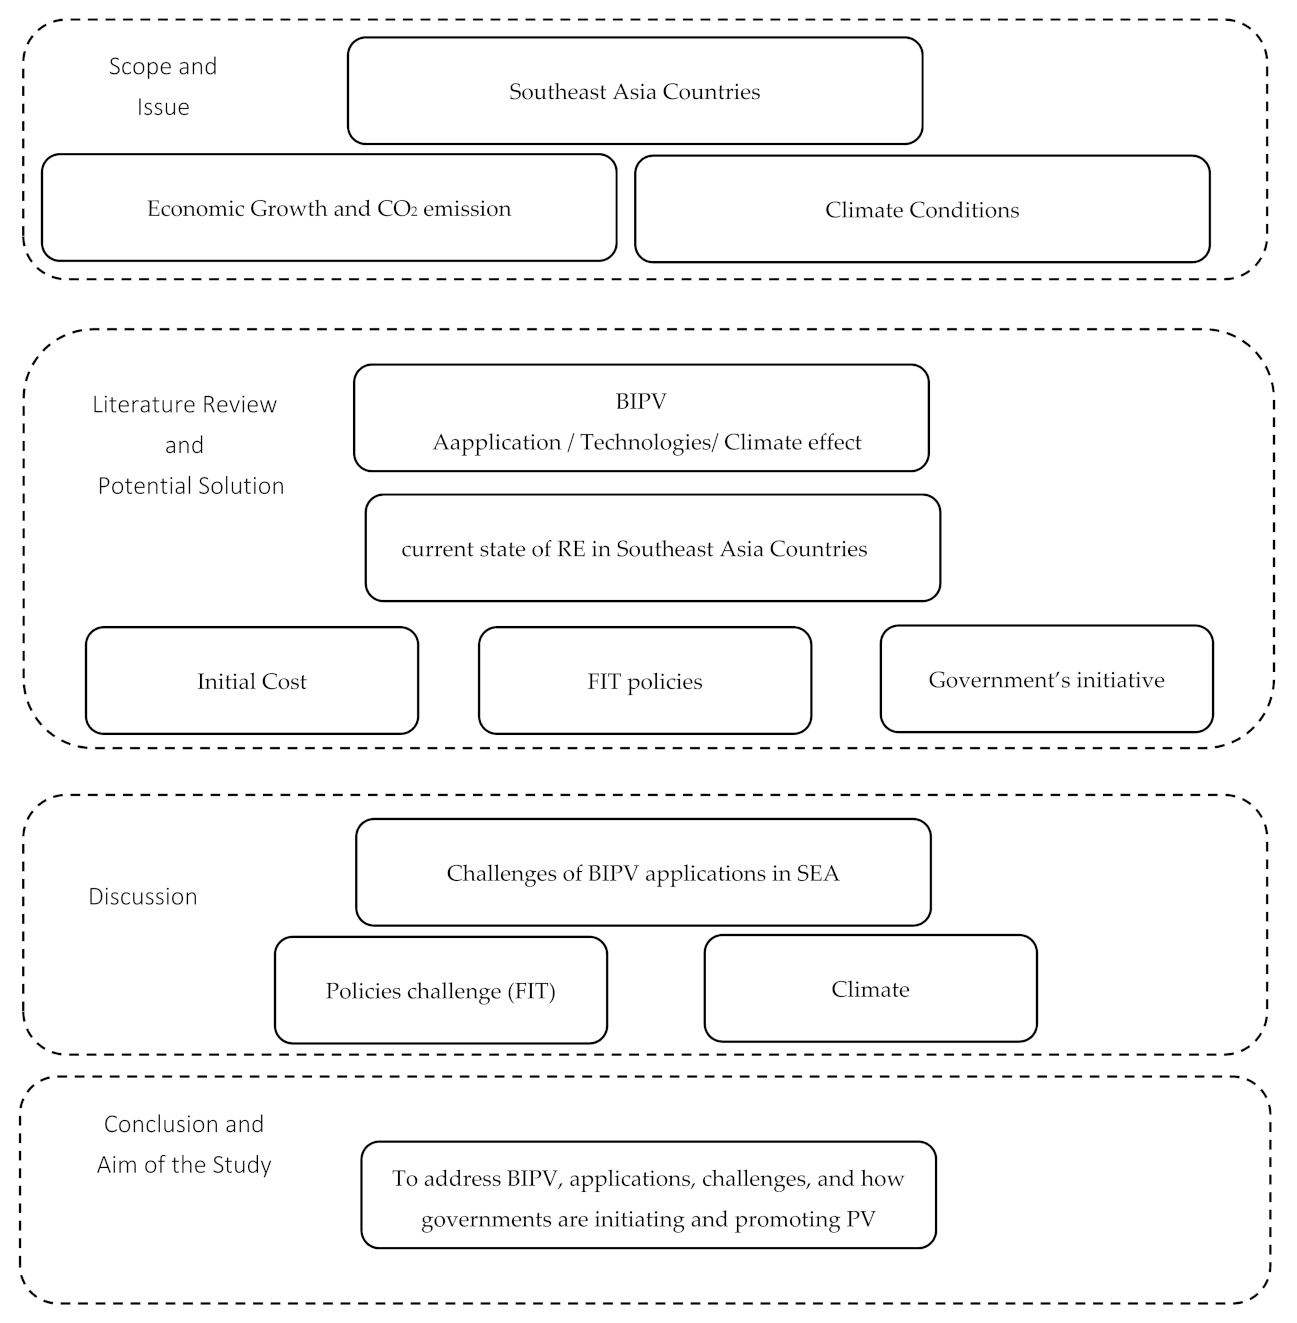
A thorough review was conducted from past research articles and government reports between 2016 to 2021 regarding the BIPV application in Southeast Asian countries. This paper will focus on the current state of BIPV technologies, initial cost, the feed-in tariff policy and government initiatives. The data collected in this paper will include data from the members of the ASEAN Plan of Action for Energy Cooperation (APAEC), which includes Cambodia, Indonesia, Laos, Malaysia, Singapore, Thailand, Vietnam, and the Philippines. Information from other Asian and European regions was used to compare and evaluate the findings. Figure 1 shows the framework of this study [5,6,7].
1.1. Economic Growth and CO2 Emission
Despite an ongoing energy revolution and economic transformation, China and India are the leaders in renewable energy generation in Asia. Meanwhile, Southeast Asian countries continue to rely on fossil fuels for electricity generation, despite having demonstrated potential for sustainable energy sources. This step, however, is fraught with difficulties [8]. Moreover, Southeast Asia’s economies have expanded rapidly in recent decades, resulting in increased energy dependency and CO2 emissions as shown in Figure 2. Thailand, Singapore, and Vietnam had a downward curve between the years 1991 to 2007, then witnessed a surprisingly upward trend afterwards, which can be related to the increase in energy consumption. Moreover, the Philippines and Malaysia share a rising linear load in their CO2 emissions. On the other hand, Cambodia, Lao PDR, and Indonesia show similarities in their CO2 emissions, which are increasing rapidly.
The ASEAN Plan of Action for Energy Cooperation (APAEC) 2016–2025 [10] includes more strategic goals and sensitive plans for renewable energy, which is divided into two phases: Phase 1: 2016–2020 and Phase 2: 2020–2025. The combined goal is to generate 23% of the Southeast Asia region′s (Cambodia, Indonesia, Laos, Malaysia, Singapore, Thailand, Vietnam, and the Philippines) with renewable energy by the year 2025. In the Total Primary Energy Supply (TPES), a million tonnes of oil equivalent (MTOE) value of 625 in 2017 is projected to increase 2.5 times to 1589 in 2040. Furthermore, according to the 6th ASEAN Energy Outlook [2], the MTOE value of 874 is targeted for 2025.
1.2. Climate Conditions in Southeast Asia Countries
PV technology requires the amount of solar radiation to generate useable energy. Understanding the climate condition especially solar radiation and sky condition is important in BIPV application. Southeast Asian countries are located within the equatorial which has a tropical climate. This region experiences a fairly constant climate, with abundant rainfall, high humidity and temperatures throughout the years. This region also experiences clear and partly cloudy sky conditions with relatively high average yearly solar radiation. Table 1 summarize the climate condition for Southeast Asian countries.
2. Building Integrated Photovoltaics (BIPV)
BIPV technology has transformed the building façade into a sustainable energy generator. PV is seen as a clean and safe solution to the pressing problems of climate change and fossil fuel depletion. PV technologies have evolved into a significant area of research and development because of many scientific publications and patents. Aside from cell technologies, the balance of systems (BoS) components such as panels, electronics, and energy storage are being researched. PV is considered “the cleanest and safest technology for generating electricity even at the GW production scale” among the broad range of current renewable energy sources. Since the discovery of the PV effect in the nineteenth century, technology has progressed dramatically. This progression is vertical in terms of solar cell forms, technological generations and efficiencies, as well as horizontal in terms of its related technical fields in chemistry, physics, electronics, and mechanics, as well as at the production and implementation market dynamics level [13].
2.1. Application of Building Integrated Photovoltaics
The main photovoltaic systems implementation is off-grid residential solar modules, off-grid photovoltaic, grid-connected PV systems [14]. The integration of PV systems into the building can be seen as cladding components in external shading devices, roofing tiles, rain-screen cladding, curtain walling and ventilated facades [15]. Figure 3 indicates the integration of PV panels into building components. Figure 4a shows the integration of opaque PV module in motorized shading device panel, while Figure 4b shows opaque PV cells in semi-transparent glazing panel. About 80% of the BIPV market are roof-mounted and the other 20% of the BIPV market are façade-mounted. Yun 2007 examined and stated that the installation of PV modules in a building must take into consideration, the design of the interior rooms and the artificial lighting loads, the type of use of the glazing and the presence of shading devices [16].
The integration of opaque modules as buildings’ double-skin façade may increase the heat gain into building due to the photovoltaic effects. By adding a ventilated air gap behind the PV facade and roof, the increase in building surface temperature can be reduced [15,16]. The ventilated air break could provide natural ventilation and daylight in the room, in addition to reducing the building surface temperature. Yoo et al. [17] also found that ventilation gaps behind the photovoltaic module will help to decrease the module temperature, thus increasing the system performance.
Norton [18] investigated the double façade of BIPV, i.e., air gaps can improve energy efficiency on both sides of the photovoltaic system. The air gap shall be small, but maintenance shall be sufficient. It was also proposed to carry out experiments to achieve fins behind PV modules, which reduce building surface temperature. The distance between the fins should be greater, fewer fine materials are needed and the temperature of the PV module should be controlled [18,19].

The PV modules must consider the angle and direction of the inclination to increase BIPV performance [21]. In addition, the climate status and location of buildings must be analysed, to find the best performing BIPV integration strategy [5]. Building the surrounding environment and location play a significant role in BIPV integration. The main factor is that the site needs a sufficient amount of solar radiation to generate power [22]. For example, a fully glazed facade is not recommended for tropical climate countries unless the shading is provided. The technology not only reduces solar thermal gain by shading the building in façade-mounted BIPV applications but also absorbs the solar radiation and converts it into electricity for the buildings’ use [23].
In terms of daylight and view, there is sometimes a conflict between architectural goals and the energy performance of BIPV to achieve maximum power generation [24]. But according to architectural creativity, different approaches to the BIPV system can be made based on climatic conditions. Ghazali [25] evaluated the cost and performance of Photovoltaic (PV) façade on building envelope (facade) using System Advisor Model (SAM) developed by the National Renewable Energy Laboratory (NREL) to estimate the potential of PV that applied on a vertical facade in Malaysia. A Heterojunction Intrinsic Thin-film module (HIT-Si) had been used with 15.6% of nominal efficiency. Moreover, the study addressed that the PVs applied on the facade have the potential to generate energy from 400 MWh to 700 MWh annually, while the PVs on the roof generate energy about 240 MWh annually. According to the results, the vertical façade of BIPV components facing east and west collects a maximum solar incident compared to the other six directions. The south and the north, however, are less irradiating. Although the roof of the building (horizontal facade) received higher incident radiation than the skin of the building (vertical facade) due to the wider area, it maximised the vertical facade to the east and west, employing a panel system that could produce significantly higher energy per year, of around 800 MWh [25].
In addition, the integration of STPV with building facades helps improve the thermal consumption of the building by changing thermal resistance and significantly affecting the transmission of heat through the façade of the building. The primary issue was the heat generated by the sun′s solar rays since PVs replace a part of the building that is built into the building. Over the years, numerous design approaches have been developed in line with the study of the integration of PV modules into buildings. Allowing for an air gap behind the PV panel, placing PV cells with clear glass between them, and changing the angle of inclination to enhance solar receptivity were all used to improve solar receptivity [26]. Architectural techniques not only improve energy efficiency, but also promote indirect daylight and, in some cases, natural ventilation.
2.2. Technologies of Building Integrated Photovoltaics
Despite this, the use of semi-transparent solar cells in building facades is still limited because they depend on the orientation of the building, the number of users, the size of the space and the climate conditions [1,27]. However, over the past few decades, most research has focused on BIPV and tried to find many alternatives by using the latest technologies available to achieve the best possible transparency and power [28].
Tak et al. [1] have studied the effect of changeable organic semi-transparent solar (COSW), in which the transparency can be amended by adjusting its temperature and solvent vapor pressure. This research used a simulation by evaluating the energy consumption, electricity production and thermal effect. According to the findings, the semi-transparent solar cell window has a great deal of potential in terms of user convenience and energy conservation. In terms of energy consumption, the proposed semi-transparent solar cell window reduced consumption by 14.80 kW/m2, 11.51 kW/m2 and 15.02 kW/m2 for the south-facing, east-facing, and west-facing facades, respectively, and increases user satisfaction, particularly in spring and autumn.
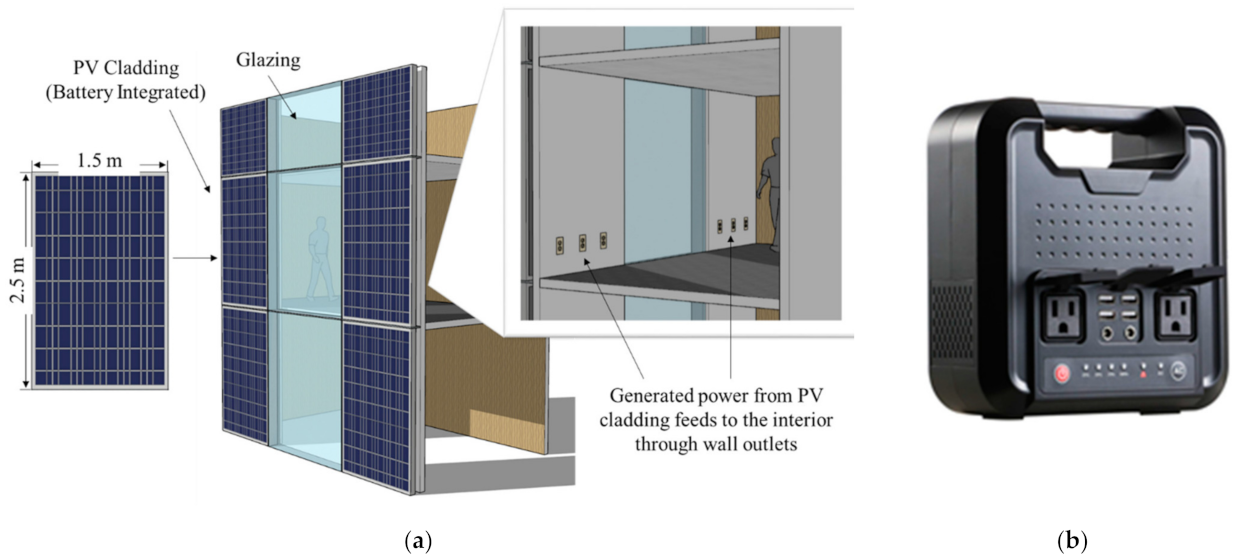
Kim et al. [29] created a well-developed design of PV cladding systems that will make a significant contribution to meeting the targets for renewable energy and zero-energy building. Normally, photovoltaic panels built into buildings are vertically oriented with no batteries attached [29]. However, this study proposed a BIPV system for each location that is linked to one or more storage batteries, making the system independent of the other generation of power in the building and referred to as the “Perma-Power Connection Building” cladding feature (Figure 5). The proposed design is intended to be a standalone device that will be extremely convenient for installation, maintenance, and operation [29].
Corrao [30], performed mechanical tests new BIPV component, the proposed component showed the potential to have insulation properties and structural functions in addition to power generation in highrise buildings [30,31]. Green energy production, building protection, and energy conservation can all be ensured in harmony with the climate and the needs of the users. The use of a support structure made from polypropylene materials for the 3D glass sub-components integrated with transparent and coloured dye-sensitized solar cells could increase the panel’s mechanical resistance to horizontal forces caused by winds and earthquakes, thus ensuring that stable translucent and active building envelopes are constructed [31].
Attoye [25] researched to determine the potential of BIPV in apartment construction in North Cyprus. This study used BIM software to create a 3D model of an existing building and analysed numerous cost considerations as well as the benefits of including BIPV systems into apartment complexes during the design stage [25]. Furthermore, qualitative methodologies were employed in the study, as well as an economic analysis, to determine the practicality and feasibility of this technology and to assess willingness to pay.
2.3. Building Integrated Photovoltaics and Climate Effect
2.3.1. Heating and Cooling Performance of Building Integrated Photovoltaics
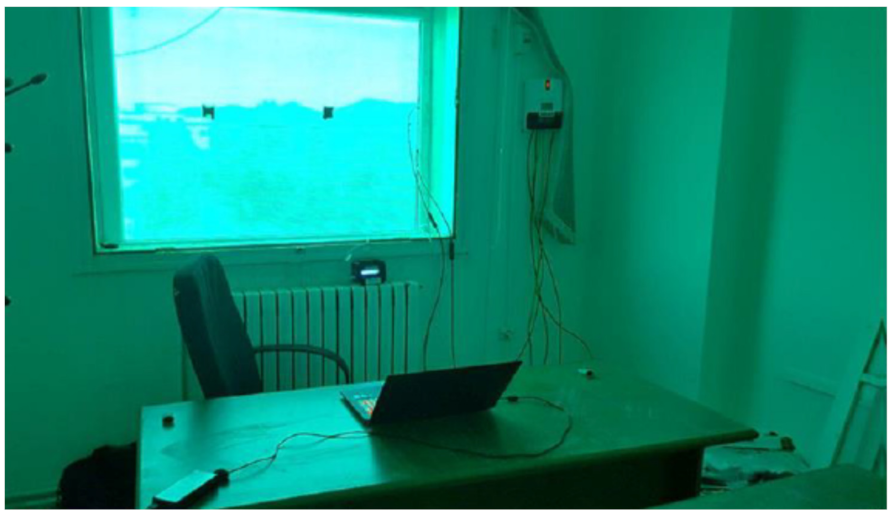
Mesloub [32] has researched an Algerian office (Figure 6) to determine the best BIPV window efficiency for total energy consumption in a semi-arid environment. Extensive simulations were used in the analysis for base-model, as well as nine commercially available BIPV modules with different Window Wall Ratios (WWR), tilting angles and cardinal orientations [32,33]. According to the findings, the best BIPV window design included double-glazed PV modules with a medium WWR towards the south facade and double-glazed PV modules with a maximum energy saving of 60% towards the south orientation. On the other hand, an contrasted the effects of semi-transparent photovoltaics with low-emissivity (Low-E) glass double-layer, clear glass double-layer, and heat-absorbing glass double-layer in a building with semi-transparent photovoltaics. Furthermore, the effects of temperature settings, air penetration, and changes in building operating time were investigated, as all factors have a significant impact on heating and cooling loads [33,34,35]. When BIPV was used instead of clear glass windows, the study found that heating and cooling loads had been reduced by 18%. In addition, the study found that increasing temperature and air penetration reduced the reduction of heating and cooling loads and that these features could be better managed if Si-BIPV were installed in the building [34].
Lu and Law investigated the power and thermal behaviour of a semi-transparent single-glazed photovoltaic window for the Hong Kong office building [36], which helped them estimate energy output in terms of power generation and heat gain. According to the research, the annual savings for cooling water and air conditioning systems are between 900 and 1300 kWh. Furthermore, Figure 7 shows the difference in the annual total heat gain between clear glass and BIPV modules. Moreover, Figure 7 shows that heat gain cut down by almost 65% throughout all the five orientations, which is related to that transmittance of glass is much higher than that of BIPV modules [36]. Tian et al. [37] examined the energy potential of semi-transparent photovoltaic windows in terms of energy output, the energy consumption of lighting and energy consumption of air conditioning. The result showed that semi-transparent photovoltaic windows able to save nearly 30% of the total building load on a standard sunny day.
2.3.2. Daylighting and Shading, and The Performance of Building Integrated Photovoltaics
BIPV has recently become a component of environmentally friendly building design, allowing for façades and the generation of renewable energy [3,38]. Additionally, dye-sensitized solar cells, cadmium telluride, crystalline silicon, copper indium gallium selenide, and amorphous silicon are now available as PV cells. Despite the low energy efficiency of amorphous silicon solar cells, a-Si semi-transparent photovoltaic glazing will admit some daylighting, providing better visual comfort than opaque crystalline silicon solar cell-based PV glazing [3]. Furthermore, active and passive strategies have been tested to maintain heating issues by using photovoltaics as a shading system, which aids in improving the energy efficiency of the building [38]. It has been demonstrated that by implementing these techniques, the energy consumption of a typical family house can be reduced by half.
PV cells can be used in more than just windows; they can also be used in other types of house glazing, such as skylights. Fan [39] used the DAYS programme in their research to create a static and dynamic analysis of the indoor light environment for a specific skylight photovoltaic glass, which aids in determining the required area ratio of PV materials, see Figure 8, which shows an enclosed atrium form that had been used. The study also discovered that, depending on the environment and location, the optimal area ratio ranges between 30% and 70%. Moreover, Mesloub [32,33] studied photovoltaic integrated shading devices and semi-transparent photovoltaics in a hot environment to see how they influenced energy efficiency and visual comfort, refer to Figure 9 that shows the BIPV window that had been tested. An unfilled egg-crate photovoltaic integrated shading device, a louvre photovoltaic integrated shading device with ten slats tilted 30 degrees outward, a louvre photovoltaic integrated shading device with five slats tilted 30 degrees outward, and an inclined single panel photovoltaic integrated shading device was also investigated. This study also showed that using photovoltaic integrated shading devices significantly improved the overall energy efficiency [32,39].
Despite the fact that PV systems have been on the market for a long time, unfortunately, Southeast Asian countries are still holding back in taking full advantage of PVs and continue to rely on fossil fuels. Southeast Asia’s climate hosts significant environmental support for PV systems to fully perform since there are no heating loads, for example. Furthermore, applying BIPV technologies proved to rapidly decrease the glare index, which can be a problem in tropical countries, and leads to relying on artificial lighting even during the daytime. Moreover, Table 2 summarise past studies in non-tropical countries for BIPV technologies, which can be applied to Southeast Asian countries [34,35,40].
2.3.3. Building Integrated Photovoltaics, Environmental Energy Production
BIPV managed to improve the overall energy performance [33]; for example, PVs have the potential to cut down around 400 kWh of energy consumption throughout the year, which provides almost 50% of electricity demand for a single-family detached housing unit in Cyprus. Solar PV will make a significant contribution to addressing current environmental and energy issues because it is carbon-free and emits no toxins. Furthermore, the production of cells PV panels requires a significant amount of energy, as well as the use of toxic chemicals. Silicon tetrachloride, sulphur hexafluoride, and cadmium are examples of potentially hazardous environmental materials. To address these concerns, many governments have enacted policies and legislation to prevent environmental degradation [40]. This includes the recycling of obsolete PV equipment, as well as the disposal of electronic equipment and the manufacturer′s responsibility for the eventual disposal or recycling of the electronic equipment [41]. Although the BIPV method necessitates energy consumption during the panel′s cell construction, it is regarded as a far superior alternative to relying on fossil fuels, which emit greenhouse gases. BIPV use on a large scale can help to mitigate the greenhouse effect on the atmosphere, as well as other environmental issues like global warming and air pollution [22].
3. Current State of Renewable Energy/PV Generated
Southeast Asian countries recently moved toward reducing their CO2 emission, and to reach that target Southeast Asian countries moved on to make Renewable Energy resources effective in generating. Table 3 summarise the approximate power generation in Southeast Asian countries using Renewable Energy and focusing on solar PV.
3.1. Initial Cost of the PV installation in Southeast Asia
Improving building energy efficiency at a later stage is more expensive and sometimes ineffective. As a result, making early energy design decisions is the most cost-effective way [42]. According to Shukla [5], in the coming years, BIPV will become more appealing and competitive. A cost reduction of 25–50% is expected to be sufficient to open the BIPV market with little or no government support [5]. Furthermore, increasing the accuracy in electricity yield estimation and applying a structured tariff for the cost analysis will help to promote the application of PV technology for a more sustainable future [43]. BIPV adoption in the construction industry remains low due to the high initial capital cost, the high cost of the BIPV module, and the high cost of BIPV construction [44,45].
BIPV performance indicates that all socioeconomic variables should be optimised for maximum electricity production while maintaining overall thermal comfort in spaces [39]. The integration of PV system as part of building component (wall and glazing panel) is financially beneficial to the buildings’ in the long-term as it can protect the building at the same time generate on-site electricity for the buildings’ use [40]. Buildings with PV systems as glazing reduce energy consumption, electricity costs, CO2 emissions, and have a shorter payback period due to the PV system′s one-time installation cost [46]. As a result, there would be significant cost savings in terms of building materials and labour when compared to non-solar energy systems [22]. Installation methods have an impact on BIPV performance, as does payback time. If the installation is done correctly, the payback period can be reduced to just nine years [22,23]. However, if only a grid-connected PV system or PV array is used, it should be cost-effective in the long overall 20-year life cycle value. The life-cycle cost process will be used to measure and assess the payback period, which includes measuring the current value and the system’s life-cycle time [46,47].
Compared to Europe and North America, the initial cost of BIPV in Southeast Asia is considered high; for example, the market price range for 4 kW to 12 kW solar PVs in Malaysia is between $3500 and $9500, which is three times the average price in other countries. This can be attributed to the country′s high labour costs and high living costs in comparison to its neighbouring countries such as Thailand and Indonesia [48]. In addition, the minimum price of solar modules in Indonesia is $235/kWh prices quickly rise to between $970/kW and $1400/kW depending on module size, quality, and location [49].
In the United Kingdom, on the other hand, the average price of PV continues to fall. For example, in 2014, the 3.8 kW PV system cost more than $11,000, but by 2020, the average cost for 4 kWp is around $8652, which means that there is a 25% loss in just six years [50]. Furthermore, the US market′s price range for 4 kW is around $8318 after the federal solar tax credit.
3.2. Feed-in Tariff Policies in Southeast Asia Countries
In 2015, Cambodia was classified as a lower-middle-income country. From 1998 to 2018, the Gross Domestic Product (GDP) increased at an annual rate of 8%. Despite these magnificent, Cambodia’s GDP per capita in 2019 is around $1643, ranking it as one of the lowest in Southeast Asia. Furthermore, approximately five million Cambodians remain without electricity, while electricity tariffs were high because of the country′s heavy reliance on imported fossil fuels for power generation, limiting economic competitiveness [51]. In February 2016, when global solar PV prices had begun to fall, the government issued its first large-scale tender for a 10 MW solar PV facility at Bavet in Svay Rieng Province. The tender resulted in a competitive tariff of $0.091 kWh, which is slightly lower than Electricité du Cambodge (EDC) average supply cost ($0.095 /kWh in 2015) [51].
In 2017, the national cost of production in Indonesia was $0.07/kWh, which indicates that in areas like West Java, which is mostly powered by low-cost coal-fired power plants, the government will not spend more than $0.07 /kWh to construct renewable energy projects [52]. Meanwhile, the cost for solar technology was $0.10/kWh in 2017, making it difficult for solar technology to compete with coal in Java at such prices Regional production costs are greater in more distant places, such as Eastern Indonesia. Hence, the state-owned electric provider Perusahaan Listrik Negara (PLN) will pay more to expand renewables. In East Nusa Tenggara, for example, the 2017 local production benchmark was around $0.18/kWh, and the tariff for remote grids is limited to $0.20/kWh [52]. Certain projects may be feasible at those rates. Renewables are unlikely to be financially viable in areas where low-cost coal is prevalent, such as Sumatra and Java. Every year, the cost of production benchmark will change, undermining one of the main benefits of FITs: long-term and consistent pricing.
On the other hand, Laos announced a goal in 2011 to achieve 30% small-scale renewables in the energy mix by 2025 as part of its renewable energy development strategy. Laos now has a lot of promise in small-scale hydro and solar energy, which is a more cost-effective and convenient alternative than large-scale deployment. Laos has not yet implemented a feed-in tariff or auction policy for the year 2020 [53]. Laos has a limited renewable energy regulatory framework and has yet to announce any price rates. For Laos to provide attractive tax and other fiscal incentives for investors, feed-in tariff mechanisms are the favoured alternative [53]. For the time being, Laos lacks a separate authority to set electricity pricing and oversee the execution of power sector operations; each power purchase agreement is negotiated on an individual basis between the ministry and power producers.
Moreover, Malaysia established a goal of generating roughly 1000 MW of renewable energy between 2011 and 2015, accounting for 5.5% of the country’s total electricity generation mix [54]. However, the Sustainable Energy Development Authority (SEDA) began to promote sustainable energy as a viable option for the country to achieve energy security, and to that end, SEDA implemented a FIT programme for holders of a guaranteed quota generation of electricity from solar panels. The amount of electricity generated is usually measured in kilowatt-hours (kWh), which is based on the amount of sunlight insolated. In addition, a PV panel with a peak power of 1 watt (1 Wp) can generate 1 to 2 kWh of electricity per year [54]. Malaysia receives 4 kWh/m2 of daily solar radiation, as well as more than 10 h of daily sunshine; all these factors make PV system applications more suitable for generating electricity in Malaysia.
Recently, advanced BIPV system development has increased the life span of PV systems to more than 30 years, and the estimated minimum payback period for a solar PV system on Malaysia’s roof façade is six years, making investments in this sector very profitable, particularly in tropical countries like Malaysia [54,55]. Surprisingly, Singapore’s government has not implemented any subsidies, such as FIT, but has instead taken steps to promote and facilitate the use of renewable energy when such technologies become economically feasible. Another option is to create an R&D support and funding structure for renewables to create capabilities within the industry [56]. In addition, the Energy Market Authority (EMA) continues to reduce its regulations to foster corporate innovation.
Thailand’s average daily solar radiation is 5.6–6.7 kWh/m2, indicating that the country can use solar radiation as an alternative energy source across the country, potentially strengthening energy security in the future [57]. Couture and Gagnon’s classification of FIT remuneration includes four payment elements: technology or fuel, project size, resource quality at a specific site, and location. Rooftop and ground-mounted PV systems are now eligible for a fixed-price FIT of $0.17/kWh for ground-mounted PV systems beginning in 2014.
As it is known, FIT are the feed laws, minimum price payments, energy payments, and standard offer contracts. Furthermore, advanced renewable tariffs, have been demonstrated to be more effective in stimulating the development of renewable energy resources than other policies [58]. Currently, a Ministry of Energy does not yet exist in Vietnam. As a result, the Ministry of Industry and Trade (MOIT) and the government are responsible for all energy-related policies. In Vietnam, the Electricity Corporation of Vietnam (EVN) has announced that it will purchase solar power from partners at a rate of $0.0935 kWh, but this decision only applies to solar photovoltaic technology, unfortunately, not for other types of solar power generation such as solar concentrators [59]. Furthermore, FIT was implemented logically and straightforwardly as part of a comprehensive and long-term programme that included financial incentives. Since its start, the sole modification to the programme has been a reduction in the rate provided for solar in response to higher-than-expected demand from developers [52]. In 2016, the Philippines’ FIT policies were deemed to have one of the highest retail prices in Southeast Asia, which were approximately $0.17 kWh. Furthermore, the high cost of electricity in the Philippines led to an immediate increase in renewable energy from 2012 to 2017 [52].
3.3. Government Incentive in Southeast Asia Countries
Although Southeast Asian countries rely primarily on fossil fuels to meet their energy needs, governments have recently been compelled to take action to develop sustainable and environmentally friendly energy sources in response to rising energy demand [8]. Because the current policy is used to stabilise energy and ensure economic growth, the Southeast Asian region is still energy stable. Cambodia’s government adopted a renewable energy policy in 2013, intending to have 70% of households in all villages fully electrified by 2030, and the government has published a “Strategic Plan for Green Growth by 2030, which has been established as a national roadmap. A framework for planned renewable energy development in rural areas has been developed. It intended to produce electricity utilising dependable renewable energy technology through the Renewable Electricity Action Plan [60,61].
The Indonesian government established a national energy policy in 2006. The policy’s goal is to achieve optimal renewable energy consumption on a national scale by 2025. Increased use of renewable energy is expected to reduce reliance on gas, coal, and oil by 30%, 33%, and 20%, respectively. Furthermore, renewable energy shares will increase by 5%. The goal of national energy policy is to maximise the use of renewable energy sources. Domestic energy demand is expected to quadruple or increase by 15%, by 2025 when compared to 2005 [8,62,63,64]. On the other hand, Laos has enacted a comprehensive renewable energy development plan. Unfortunately, the programme did not include water-based renewable energy, but it did establish a 30% renewable energy share and a 10% biofuel consumption target. Laos has also built a rural electrification project to meet the increased demand for electrical energy in the country’s outlying areas [65].
Malaysia, like other Southeast Asian countries, has pushed for a 5% renewable energy consumption target by 2030 to meet its electrical energy needs. Malaysia made considerable progress in developing a renewable energy technology roadmap in 2016, considering both land and ocean potential. In addition, the government has charged The Directorate of National Authority (NOD) with conducting marine surveillance on Malaysia’s renewable energy potential [8,66]. Moreover, by 2012 the authority of sustainable energy developers (SEDA) had been assigned the task to regulate the growth of renewable energy. For the development of renewable energy, FIT has been introduced to benefit the developer [54]. In addition, the Singaporean government hopes to reduce GHG emissions by 16% by 2020 by signing a global agreement. Nonetheless, the Singapore government has made several smart and efficient efforts to achieve efficient renewable energy, to achieve carbon reductions at the BAU level of between 7% and 11% by 2020 [67].
Despite the lack of a national renewable energy policy, research institutes and academics continue to investigate and conduct research on renewable energy’s potential [68]; the Thai government enacted legislation to promote energy conservation (ENCON) through Renewable Portfolio Standards (RPS), to achieve a 3–5% renewable energy use target for all new power generation capacity developments [8,64,66]. The Alternative Energy Development Planning Commission has designated geothermal energy and electricity generated by the sea’s tidal wave as renewable energy sources (AEDP). The combined use of wave energy and tidal current is expected to generate 2 MW of electricity. However, until recently, it could not be used to generate electricity.
The Electricity Corporation of Vietnam (EVN) is the sole provider of electricity and the wholesaler of electricity in Vietnam most of the time. Furthermore, Vietnam must establish strong policies to encourage the private sector to engage in renewable energy, which will be backed by energy policy, which may include international treaties, legislation, and investment incentives. Furthermore, feed-in tariffs are the most appropriate mechanism because it provides a stable environment for renewable energy investors by offering either a long-term fixed-price or the electricity market price [59]. Previously, the energy market in the Philippines was an integrated monopoly controlled by the National Power Corporation, which oversaw generating, transmitting, and distributing power across the country. However, since the passage of the Electric Power Industry Reform Act, most of the power generation in the Philippines has been managed by Independent Power Producers (IPPs) [52]. Furthermore, the state-owned National Transmission Corporation was created to take over many of the tasks of the National Power Corporation, which is also in charge of the FIT Allowance fund, which oversees disbursing money to qualified renewable energy companies. Tariffs collected on consumers support a large portion of the FIT Allowance budget [52]. The Philippines established and authored the Renewable Energy Act, which resulted in the formation of a National Renewable Energy Board to address renewable energy policy, with the primary objective of enhancing the Philippines’ energy security. In addition, the National Renewable Energy Board recommended FIT rates, which were ultimately authorised in 2011 [52]. Table 4, summarizing Southeast Asia countries’ targets for renewable energy generation, policies related to renewable energy, the initial rate of the feed-in tariff, and initial PV cost for 4 kW PV.
3.4. Challenges of BIPV Application in Southeast Asia
3.4.1. Climate Challenges
Climate conditions have a significant impact on BIPV efficiency. The primary climatic factors that influence BIPV efficiency are solar radiance, ambient temperature, cloud cover and humidity. Continuous solar radiance ensures that the BIPV module or panel operates at maximum efficiency. Aside from that, if the ambient temperature rises, so does the temperature of the BIPV module, reducing the module’s performance. Any shading from the cloud cover on the BIPV reduces power production because it reduces solar radiance.
Ismail [69], conducted a case study on Zero Energy Buildings (ZEB) in Singapore in 2013 and discovered that hybrid systems combining PV panels, battery banks, and diesel generators were the best option when compared to stand-alone PV or diesel generators. The BIPV method has had mixed results in other countries, such as India. Instead, it resulted in the opposite of a poor BIPV method. According to Pillai [8], the hot climate affected the temperature of internal air inside a BIPV structure and increased it higher than the ambient outside temperature.
The outcome of any PV system depends on several factors such as type of module, connection, site (location) and application. Humada et al., 2018 [70] has compared the performance ratio of PV system output among Southeast Asian countries and found that the average performance ratio ranges between 70.2% to 79%. This value is lower compared to other regions, which can achieve up to 85% to 90%.
3.4.2. Feed-In Tariff Policies Challenges
There are several efforts and strategies to promote and support the use of renewable energy. The feed-in tariff scheme is the most widely applied strategy and has proven efficient in promoting RE technology by providing benefits to the project owner and ratepayers [71]. However, the price of FIT as offered by the government can also be unattractive to building owners to adopt the use of BIPV in Southeast Asian countries.
Cambodia was classed as a lower-middle-income country in 2015. Between 1998 and 2018, the Gross Domestic Product (GDP) rose at an annual pace of 8%. Furthermore, this tender resulted in a competitive rate of $0.091 kWh in 2016, which is slightly lower than EDC’s average supply cost ($0.095/kWh in 2015). Furthermore, Renewables in Indonesia are unlikely to be financially feasible in places where low-cost coal is prevalent, such as Sumatra and Java. The cost of production baseline will change every year, undermining one of the major benefits of FITs: long-term and stable pricing. However, the feed-in tariff rates in Malaysia for individual solar PV 4 kW, can reach up to almost $0.26/kWh, which is almost more than double Solar’s global rate of $0.10/kWh [52,54]. In addition, in 2017, the National Energy Policy Council (NEPC) in Thailand announced that government agencies would receive a $0.12/kWh incentive (a 30% decrease from the $0.17/kWh rate) (NEPC, 2017), which is still within range of the global solar rate of $0.1/kWh. Following its implementation in 2006, the FIT policy increased the total accumulative capacity of grid-connected New England Power Company projects from 6662 to 3024 MW between 2006 and 2017 [52,57].
Vietnam implemented FIT for solar-generated power in 2017, but the policy is unstable, which may be linked to the unreasonable price at which electricity would be acquired from the Electricity Corporation of Vietnam (EVN). As a result, Vietnam’s FIT policy does not attract investors to invest in the renewable energy industry [59]. On the other hand, in 2016, the Philippines’ FIT regulations were regarded to have one of the highest retail costs in Southeast Asia, at around $0.17 per kWh. Furthermore, from 2012 to 2017, the high cost of power in the Philippines resulted in immediate growth in renewable energy.
4. Conclusions
BIPV has proven to be one of the most powerful systems for reducing thermal and cooling energy consumption while also providing renewable energy. BIPV or energy-efficient systems, on the other hand, necessitate a significant upfront investment, which includes labour, delivery, design, and the cost of the modules themselves. However, overall, it would benefit both consumers and the environment. Energy-saving technologies can be viewed as a long-term investment toward a better future. Furthermore, the efficiency of BIPV is affected by several factors such as environment, location, daylighting, and shading, among others. Moreover, the weather is considered a huge challenge to the efficacy of BIPV. The primary environmental parameters influencing BIPV efficiency are temperature, humidity, and solar radiation. As the temperature of the surrounding air rises, so does the temperature of the BIPV module, reducing the module’s performance. Furthermore, the consistent sun brightness ensures that the BIPV module or panel functions optimally. Electricity generation is lowered when the BIPV is shaded because of the sun’s brightness.
In recent years, several techniques as well as innovative technology/products, have been introduced to improve the architectural integration of PVs in buildings, which improves building comfort by integrating PVs into shading elements. Furthermore, because user comfort varies from one area to the next, such as the differences between tropical and moderate climates, the climate has a significant impact on cooling and heating energy use.
The high installing cost of BIPV is another challenge that Southeast Asian countries face. The most significant impediment is the cost of implementing BIPV technology, which can be broken down into labour costs, distribution costs, initial costs, and module costs. Despite the government’s efforts to assist building owners in installing this equipment, prices remain high. Aside from that, people are satisfied with existing electricity generation methods such as geothermal and fossil fuel, which are significantly less expensive than BIPV technology. Furthermore, the governments need to keep updating their feed-in tariff policies in a way that grabs the householders attention, for example, Malaysia and the Philippines feed-in tariff is considered successful and profitable, despite the high initial cost of the PV ($3500–$9500), compared to its neighbouring countries. The basic FIT rate in Malaysia and the Philippines is $0.17 /kWh, and the FIT policy in Malaysia provides an extra bounce up to $0.9 /kWh when having one or more of the following criteria: use as an installation in buildings or building structures, use as building materials, use of locally manufactured or assembled solar PV modules, and use of locally manufactured or assembled solar inverters. These types of policies give householders the motivation to start to invest in BIPV, and all Southeast Asian countries should provide and adopt policies such as these.
Author Contributions
Conceptualization, H.E.R. and A.G.; methodology, H.E.R., A.G. and M.H.M.I.; validation, H.E.R., A.G. and M.H.M.I.; formal analysis, H.E.R.; investigation, H.E.R.; resources, H.E.R.; data curation, A.G.; writing—original draft preparation, H.E.R. and A.G.; writing—review and editing, H.E.R., A.G. and M.H.M.I.; visualization, H.E.R.; supervision, A.G.; project administration, H.E.R. and A.G.; funding acquisition, A.G. All authors have read and agreed to the published version of the manuscript.
Funding
This research received funding from Universiti Sains Malaysia Short-Term Research Grant (304/PPBGN/6315430).
Institutional Review Board Statement
Not applicable.
Informed Consent Statement
Not applicable.
Data Availability Statement
Not applicable.
Acknowledgments
The authors would like to thank the School of Housing, Building, and Planning and also Division of Research and Innovation, Universiti Sains Malaysia for providing financial support.
Conflicts of Interest
The authors declare no conflict of interests.
References
- Tak, S.; Woo, S.; Park, J.; Park, S. Effect of the Changeable Organic Semi-Transparent Solar Cell Window on Building Energy Efficiency and User Comfort. Sustainability 2017, 9, 950. [Google Scholar] [CrossRef] [Green Version]
- IEA. Southeast Asia Energy Outlook 2019; IEA Publications: Paris, France, 2019. [Google Scholar]
- Qiu, C.; Yang, H. Daylighting and overall energy performance of a novel semi-transparent photovoltaic vacuum glazing in different climate zones. Appl. Energy 2020, 276, 115414. [Google Scholar] [CrossRef]
- Krawietz, A.S.A. Sustainable Buildings and BIPV: An International Perspective. SETA Network. 2011. Available online: https://www.bre.co.uk/filelibrary/BIPV%202/Silke_Krawietz.pdf (accessed on 11 October 2021).
- Shukla, A.K.; Sudhakar, K.; Baredar, P.; Mamat, R. BIPV in Southeast Asian countries—Opportunities and challenges. Renew. Energy Focus 2017, 21, 25–32. [Google Scholar] [CrossRef] [Green Version]
- Shukla, A.K.; Sudhakar, K.; Baredar, P.; Mamat, R. BIPV based sustainable building in South Asian countries. Sol. Energy 2018, 170, 1162–1170. [Google Scholar] [CrossRef]
- Zomer, C.; Nobre, A.; Reindl, T.; Rüther, R. Shading analysis for rooftop BIPV embedded in a high-density environment: A case study in Singapore. Energy Build. 2016, 121, 159–164. [Google Scholar] [CrossRef]
- Mamat, R.; Sani, M.; Sudhakar, K. Renewable energy in Southeast Asia: Policies and recommendations. Sci. Total Environ. 2019, 670, 1095–1102. [Google Scholar]
- Akbar, A.; Rehman, A.; Ullah, I.; Zeeshan, M.; Alam Afridi, F.E. Unraveling the Dynamic Nexus Between Trade Liberalization, Energy Consumption, CO2 Emissions, and Health Expenditure in Southeast Asian Countries. Risk Manag. Healthc. Policy 2020, 13, 1915. [Google Scholar] [CrossRef]
- Asia Pacific Energy Research Centre (A.P.E.R.C). APEC Energy Demand and Supply Outlook, 6th ed.; Asia Pacific Energy Research Centre: Tokyo, Japan, 2016. [Google Scholar]
- Solargis. Weather Data and Software for Solar Power Investments. 2021. Available online: https://solargis.com/ (accessed on 11 October 2021).
- WeatherSpark.com, C.L.V. The Typical Weather Anywhere on Earth. 2020. Available online: https://weatherspark.com/ (accessed on 11 October 2021).
- Shubbak, M.H. Reviews, Advances in solar photovoltaics. Technol. Rev. Pat. Trends 2019, 115, 109383. [Google Scholar]
- Zahedi, A. Solar photovoltaic (PV) energy; latest developments in the building integrated and hybrid PV systems. Renew. Energy 2006, 31, 711–718. [Google Scholar] [CrossRef]
- Bloem, J. Evaluation of a PV-integrated building application in a well-controlled outdoor test environment. Build. Environ. 2008, 43, 205–216. [Google Scholar] [CrossRef]
- Yun, G.Y.; McEvoy, M.; Steemers, K. Design and overall energy performance of a ventilated photovoltaic façade. Sol. Energy 2007, 81, 383–394. [Google Scholar] [CrossRef]
- Yoo, S.-H. Optimization of a BIPV system to mitigate greenhouse gas and indoor environment. Sol. Energy 2019, 188, 875–882. [Google Scholar] [CrossRef]
- Huang, M.J.; Eames, P.C.; Norton, B. Phase change materials for limiting temperature rise in building integrated photovoltaics. Solar Energy 2006, 80, 1121–1130. [Google Scholar] [CrossRef]
- Charron, R.; Athienitis, A.K. Optimization of the performance of double-facades with integrated photovoltaic panels and motorized blinds. Solar Energy 2006, 80, 482–491. [Google Scholar] [CrossRef]
- Fung, T.Y.; Yang, H. Study on thermal performance of semi-transparent building-integrated photovoltaic glazings. Energy Build. 2008, 40, 341–350. [Google Scholar] [CrossRef]
- Budhiyanto, A.; Suryabrata, J.A.; Saragih, S. Study of Shading Device Building-Integrated Photovoltaic Performance on Energy Saving; Petra Christian University: Jawa Timur, Indonezia, 2018. [Google Scholar]
- Alim, M.A.; Tao, Z.; Hassan, M.K.; Rahman, A.; Wang, B.; Zhang, C.; Samali, B. Is it time to embrace building integrated Photovoltaics? A review with particular focus on Australia. Solar Energy 2019, 188, 1118–1133. [Google Scholar] [CrossRef]
- Mendis, T.; Pathirana, K.; Kumara, W. Optimised Building Integrated Photovoltaic Systems for Utilisation on Facades in the Tropical Climate. 2019. Available online: http://ir.kdu.ac.lk/handle/345/2322 (accessed on 11 October 2021).
- Attoye, D.E.; Hassan, A.; Aoul, K.A.T. A Review on Building Integrated Photovoltaic Façade Customization Potentials. Sustainability 2017, 9, 2287. [Google Scholar] [CrossRef] [Green Version]
- Ghazali, A.; Salleh, E.I.; Haw, L.C.; Mat, S.; Sopian, K. Performance and financial evaluation of various photovoltaic vertical facades on high-rise building in Malaysia. Energy Build. 2017, 134, 306–318. [Google Scholar] [CrossRef]
- Radhi, H. Energy analysis of façade-integrated photovoltaic systems applied to UAE commercial buildings. Sol. Energy 2010, 84, 2009–2021. [Google Scholar] [CrossRef]
- Attoye, D.E.; Adekunle, T.O.; Tabet Aoul, K.A.; Hassan, A.; Attoye, S.O. A conceptual framework for a building integrated photovoltaics (BIPV) educative-communication approach. Sustainability 2018, 10, 3781. [Google Scholar] [CrossRef] [Green Version]
- Song, A.; Lu, L.; Liu, Z.; Wong, M.S. A Study of Incentive Policies for Building-Integrated Photovoltaic Technology in Hong Kong. Sustainability 2016, 8, 769. [Google Scholar] [CrossRef] [Green Version]
- Kim, A.A.; Reed, D.A.; Choe, Y.; Wang, S.; Recart, C. New building cladding system using independent tilted BIPV panels with battery storage capability. Sustainability 2019, 11, 5546. [Google Scholar] [CrossRef] [Green Version]
- Kim, J.H.; Kim, S.M.; Kim, J.T. Experimental Performance of an Advanced Air-Type Photovoltaic/Thermal (PVT) Collector with Direct Expansion Air Handling Unit (AHU). Sustainability 2021, 13, 888. [Google Scholar] [CrossRef]
- Corrao, R. Mechanical tests on innovative BIPV façade components for energy, seismic, and aesthetic renovation of high-rise buildings. Sustainability 2018, 10, 4523. [Google Scholar] [CrossRef] [Green Version]
- Mesloub, A.; Albaqawy, G.A.; Kandar, M.Z. The OPTIMUM performance of Building Integrated Photovoltaic (BIPV) windows under a semi-arid climate in algerian office buildings. Sustainability 2020, 12, 1654. [Google Scholar] [CrossRef] [Green Version]
- Mesloub, A.; Ghosh, A.; Touahmia, M.; Albaqawy, G.; Noaime, E.; Alsolami, B. Performance Analysis of Photovoltaic Integrated Shading Devices (PVSDs) and Semi-Transparent Photovoltaic (STPV) Devices Retrofitted to a Prototype Office Building in a Hot Desert Climate. Sustainability 2020, 12, 10145. [Google Scholar] [CrossRef]
- An, H.J.; Yoon, J.H.; An, Y.S.; Heo, E. Heating and Cooling Performance of Office Buildings with a-Si BIPV Windows Considering Operating Conditions in Temperate Climates: The Case of Korea. Sustainability 2018, 10, 4856. [Google Scholar] [CrossRef] [Green Version]
- Peng, C.; Huang, Y.; Wu, Z. Building-integrated photovoltaics (BIPV) in architectural design in China. Energy Build. 2011, 43, 3592–3598. [Google Scholar] [CrossRef]
- Lu, L.; Law, K.M. Overall energy performance of semi-transparent single-glazed photovoltaic (PV) window for a typical office in Hong Kong. Renew. Energy 2013, 49, 250–254. [Google Scholar] [CrossRef]
- Tian, H.; Zhang, W.; Xie, L.; Wu, Y.; Sun, Y.; Chen, M.; Wang, W.; Wu, X. Study on the Energy Saving Potential for Semi-Transparent PV Window in Southwest China. Energies 2018, 11, 3239. [Google Scholar] [CrossRef] [Green Version]
- Ogbeba, J.E.; Hoskara, E. The Evaluation of Single-Family Detached Housing Units in terms of Integrated Photovoltaic Shading Devices: The Case of Northern Cyprus. Sustainability 2019, 11, 593. [Google Scholar] [CrossRef] [Green Version]
- Fan, Z.; Yang, Z.; Yang, L. Daylight performance assessment of atrium skylight with integrated semi-transparent photovoltaic for different climate zones in China. Build. Environ. 2021, 190, 107299. [Google Scholar] [CrossRef]
- Ismail, A.M.; Ramirez-Iniguez, R.; Asif, M.; Munir, A.B.; Muhammad-Sukki, F. Progress of solar photovoltaic in ASEAN countries: A review. Renew. Sustain. Energy Rev. 2015, 48, 399–412. [Google Scholar] [CrossRef]
- Vaka, M.; Walvekar, R.; Rasheed, A.K.; Khalid, M. A review on Malaysia’s solar energy pathway towards carbon-neutral Malaysia beyond Covid’19 pandemic. J. Clean. Prod. 2020, 273, 122834. [Google Scholar] [CrossRef] [PubMed]
- Yau, Y.; Lim, K. Energy analysis of green office buildings in the tropics—Photovoltaic system. Energy Build. 2016, 126, 177–193. [Google Scholar] [CrossRef]
- Van Vuuren, D.J.; Marnewick, A.L.; Pretorius, J.H.C. Validation of a Simulation-Based Pre-Assessment Process for Solar Photovoltaic Technology Implemented on Rooftops of South African Shopping Centres. Sustainability 2021, 13, 2589. [Google Scholar] [CrossRef]
- Zhang, T.; Wang, M.; Yang, H.J.E. A review of the energy performance and life-cycle assessment of building-integrated photovoltaic (BIPV) systems. Energies 2018, 11, 3157. [Google Scholar] [CrossRef] [Green Version]
- Aaditya, G.; Mani, M. Climate-responsive integrability of building-integrated photovoltaics. Int. J. Low Carbon Technol. 2013, 8, 271–281. [Google Scholar] [CrossRef] [Green Version]
- Chow, T.; Chan, A.; Fong, K.; Lin, Z.; He, W.; Ji, J. Annual performance of building-integrated photovoltaic/water-heating system for warm climate application. Appl. Energy 2009, 86, 689–696. [Google Scholar] [CrossRef]
- Fudholi, A.; Sopian, K.; Yazdi, M.H.; Ruslan, M.H.; Ibrahim, A.; Kazem, H.A. Performance analysis of photovoltaic thermal (PVT) water collectors. Energy Convers. Manag. 2014, 78, 641–651. [Google Scholar] [CrossRef]
- Bhd, E.S. How Much does a Solar Energy System Cost in Malaysia? 2021. Available online: https://www.nextenergy.my/how-much-does-a-solar-energy-system-cost-in-malaysia/ (accessed on 11 October 2021).
- Ltd., M.P. Why Indonesia Struggles to Tap Its Solar Energy Potential. 2021. Available online: https://www.channelnewsasia.com/climate-change/why-indonesia-struggles-tap-its-solar-energy-potential-1339626 (accessed on 11 October 2021).
- Clissitt, C. Solar Panel Costs 2021. 2021. Available online: https://www.theecoexperts.co.uk/solar-panels/cost (accessed on 11 October 2021).
- Tharakan, P.; Connett, D.; Yeneza, G.; Planas, F.V.; Thukral, K. Crowding in Private Capital to Enable Cambodia’s Clean Energy Evolution. FINANCING CLEAN ENERGY IN DEVELOPING ASIA. 2021. Available online: http://www.indiaenvironmentportal.org.in/files/file/Financing%20Clean%20Energy%20in%20Developing%20Asia.pdf#page=136 (accessed on 11 October 2021).
- Guild, J. Feed-in-tariffs and the politics of renewable energy in Indonesia and the Philippines. Asia Pac. Policy Stud. 2019, 6, 417–431. [Google Scholar] [CrossRef] [Green Version]
- Vakulchuk, R.; Chan, H.Y.; Kresnawan, M.R.; Merdekawati, M.; Overland, I.; Sagbakken, H.F.; Yurnaidi, Z. Lao PDR: How to Attract More Investment in Small-Scale Renewable Energy? Norwegian Institute of International Affairs (NUPI): Oslo, Norway,, 2020. [Google Scholar]
- Malik, S.A.; Ayop, A.R. Solar energy technology: Knowledge, awareness, and acceptance of B40 households in one district of Malaysia towards government initiatives. Technol. Soc. 2020, 63, 101416. [Google Scholar] [CrossRef]
- Husain, A.A.; Ahmad Phesal, M.H.; Abdul Kadir, M.Z.; Ungku Amirulddin, U.A. Short Review on Recent Solar PV Policies in Malaysia. In E3S Web of Conferences; EDP Sciences: Les Ulis, France, 2020. [Google Scholar]
- Bhunia, P. How the Singapore Government Plans to Boost Solar Power Capacity to 1 Gigawatt Peak beyond 2020 from 140 Megawatt Peak Today. 2017. Available online: https://opengovasia.com/how-the-singapore-government-plans-to-boost-solar-power-capacity-to-1-gigawatt-peak-beyond-2020-from-140-megawatt-peak-today/ (accessed on 11 October 2021).
- Sagulpongmalee, K.; Therdyothin, A.; Nathakaranakule, A. Analysis of feed-in tariff models for photovol-taic systems in Thailand: An evidence-based approach. J. Renew. Sustain. Energy 2019, 11, 045903. [Google Scholar] [CrossRef]
- Minh, P.V.; Le Quang, S.; Pham, M.H. The Effect of Retail Electricity Price Levels on the FI Values of Smart-Grid Rooftop Solar Power Systems: A Case Study in the Central Highlands of Vietnam. Sustainability 2021, 13, 3528. [Google Scholar] [CrossRef]
- Lan, T.T.; Techato, K.; Jirakiattikul, S. The Challenge of Feed-In-Tariff (FIT) Policies Applied to the Development of Electricity from Sustainable Resources–Lessons for Vietnam. Int. Energy J. 2019, 19, 199–212. [Google Scholar]
- Terabe, S.; Takada, K.; Yai, T. International cooperation in transportation research among East Asian countries: Experience of the Eastern Asia society for transportation studies (EASTS). Case Stud. Transp. Policy 2017, 5, 55–60. [Google Scholar] [CrossRef]
- Mahapatra, M.; Upadhyaya, S.; Aviso, S.; Babu, A.; Hutchings, G.; Parida, S. Selection of vaccine strains for serotype O foot-and-mouth disease viruses (2007–2012) circulating in Southeast Asia, East Asia and Far East. Vaccine 2017, 35, 7147–7153. [Google Scholar] [CrossRef] [PubMed]
- Mendoza, J.M.F.; Schmid, A.G.; Rivera, X.C.S.; Rieradevall, J.; Azapagic, A. Sustainability assessment of home-made solar cookers for use in developed countries. Sci. Total. Environ. 2019, 648, 184–196. [Google Scholar] [CrossRef]
- Pambudi, N.A. Geothermal power generation in Indonesia, a country within the ring of fire: Current status, future development and policy. Renew. Sustain. Energy Rev. 2018, 81, 2893–2901. [Google Scholar] [CrossRef]
- Kusumadewi, T.V.; Limmeechokchai, B. CO2 mitigation in residential sector in Indonesia and Thailand: Potential of renewable energy and energy efficiency. Energy Procedia 2017, 138, 955–960. [Google Scholar] [CrossRef]
- Riva, F.; Ahlborg, H.; Hartvigsson, E.; Pachauri, S.; Colombo, E. Electricity access and rural development: Review of complex socio-economic dynamics and causal diagrams for more appropriate energy modelling. Energy Sustain. Dev. 2018, 43, 203–223. [Google Scholar] [CrossRef]
- Dellano-Paz, F.; Calvo-Silvosa, A.; Antelo, S.I.; Soares, I. Energy planning and modern portfolio theory: A review. Renew. Sustain. Energy Rev. 2017, 77, 636–651. [Google Scholar] [CrossRef]
- Ali, Q.; Khan, M.T.I. Dynamics between financial development, tourism, sanitation, renewable energy, trade and total reserves in 19 Asia cooperation dialogue members. J. Clean. Prod. 2018, 179, 114–131. [Google Scholar] [CrossRef]
- Narayan, S.; Doytch, N. An investigation of renewable and non-renewable energy consumption and economic growth nexus using industrial and residential energy consumption. Energy Econ. 2017, 68, 160–176. [Google Scholar] [CrossRef]
- Ismail, M.S.; Moghavvemi, M.; Mahlia, T.M.I. Techno-economic analysis of an optimized photovoltaic and diesel generator hybrid power system for remote houses in a tropical climate. Energy Convers. Manag. 2013, 69, 163–173. [Google Scholar] [CrossRef]
- Humada, A.M.; Aaref, A.M.; Hamada, H.M.; Sulaiman, M.H.; Amin, N.; Mekhilef, S. Modeling and characterization of a grid-connected photovoltaic system under tropical climate conditions. Renew. Sustain. Energy Rev. 2018, 82, 2094–2105. [Google Scholar] [CrossRef]
- Ramli, M.A.; Twaha, S. Analysis of renewable energy feed-in tariffs in selected regions of the globe: Lessons for Saudi Arabia. Renew. Sustain. Energy Rev. 2015, 45, 649–661. [Google Scholar] [CrossRef]
Figure 1.
The framework for this study.

Figure 2.
CO2 emissions in Southeast Asia Countries [9].
Figure 2.
CO2 emissions in Southeast Asia Countries [9].


Figure 5.
(a) PV panel is part of the façade, and the battery is enclosed in the wall with power outlets available inside. (b) Sample of the shelf battery suitable for a BPPL cladding panel system [29].
Figure 5.
(a) PV panel is part of the façade, and the battery is enclosed in the wall with power outlets available inside. (b) Sample of the shelf battery suitable for a BPPL cladding panel system [29].

Figure 6.
The tested BIPV window was placed in the office building chosen for the experiment [32].
Figure 6.
The tested BIPV window was placed in the office building chosen for the experiment [32].

Figure 7.
Annual total heat gain through PV window and clear glass window [36].
Figure 7.
Annual total heat gain through PV window and clear glass window [36].

Figure 8.
Spatial form 65 of atrium space (Enclosed Four Directional) [39].
Figure 8.
Spatial form 65 of atrium space (Enclosed Four Directional) [39].

Figure 9.
The different PVSDs configurations were used in the simulations [33].
Figure 9.
The different PVSDs configurations were used in the simulations [33].


| Cambodia | Indonesia | Laos | Malaysia | Singapore | Thailand | Vietnam | Philippines | |
|---|---|---|---|---|---|---|---|---|
| Capital City | Phnom Penh | Jakarta | Vientiane | Kuala Lumpur | Singapore | Bangkok | Hanoi | Manila |
| Average Solar Radiation, yearly. (2007–2018) | 1500 kWh/m2 | 1168 kWh/m2 | 1314 kWh/m2 | 1022 kWh/m2 | 1580 kWh/m2 | 1241 kWh/m2 | 1296 kWh/m2 | 1703 kWh/m2 |
| Sky Condition/Average in the year 2020 | Clear and partly cloudy 49%, overcast and mostly cloudy 51% (Nov–Mar)/overcast and mostly cloudy 92%, clear and partly cloudy 8% (Mar–Nov) | Clear and partly cloudy 37%, overcast and mostly cloudy 63% (May–Oct)/overcast and mostly cloudy 90%, clear and partly cloudy 10% (Oct–May) | Clear and partly cloudy 68%, overcast and mostly cloudy 32% (Oct–Apr)/overcast and mostly cloudy 92%, clear and partly cloudy 8% (Apr–Oct) | Clear and partly cloudy 26%, mostly cloudy 74% (Dec–Mar)/overcast and mostly cloudy 91%, clear and mostly clear 9% (Mar–Dec) | Clear and partly cloudy 24%, mostly cloudy 76% (Jan–Apr)/overcast and mostly cloudy 91%, clear and mostly clear 9% (Apr–Jan) | Clear and partly cloudy 58%, mostly cloudy 42% (Nov–Mar)/overcast and mostly cloudy 93%, clear and mostly clear 7% (Nov–Mar) | Overcast and mostly cloudy 92%, clear and mostly clear 68% lasts for 7 months (Oct–May). | Overcast and mostly cloudy 92% and lasts for almost 7 months (Apr–Nov), and clear and mostly clear 52% lasts for 5 (Nov–Apr). |
| Latitude Longitude | 11°33′44.82″ N, 104°54′57.64″ E | 6°12′52.63″ S, 106°50′42.47″ E | 17°58′0.01″ N, 102°36′0″ E | 3°8′28.32″ N, 101°41′11.51″ E | 1°17′22.81″ N, 103°51′0.25″ E | 13°45′14.33″ N, 100°30′5.18″ E | 21°04′31″ N, 105°48′59″ E | 14°36′03″ N, 120°59′03″ E |
Table 2.
Summary of past studies shows the heating and cooling set-points for each study’s model and its effect on the performance of BIPV.
Table 2.
Summary of past studies shows the heating and cooling set-points for each study’s model and its effect on the performance of BIPV.
| Author/Year | Location | Setting Points (Hourly & Daily) | Findings |
|---|---|---|---|
| Abdelhakim Mesloub, 2020 [34] | Algeria | Heating set-point 21 °C (08:00–17:00) Cooling set-point 24 °C (08:00–17:00) | The appropriate BIPV window design was double-glazing PV modules with medium WWR. The PV significantly minimize the glare index compared to the base model. |
| Abdelhakim Mesloub, 2020 [35] | Saudi Arabia | Heating set-point 31.1 °C Cooling set-point 10.6 °C | The PVSDs improved overall energy performance and reduced glare. The PVSD had a conversion efficiency of 20% and was generated. extra energy. |
| Changyu Qiu, 2020 [3] | Different climate zones in China | Heating set-point 25 °C Cooling set-point 22 °C | The vacuum PV glazing balanced daylighting availability and visual comfort by providing sufficient daylight. The vacuum glazing leads to additional cooling consumption in the moderate climate zone. The vacuum PV glazing has an energy-saving potential between 35% to 66% depends on the climate zone. |
| John Emmanuel Ogbeba, 2019 [38] | Cyprus | ASHRAE Standard 55 | PV openings reduce energy consumption by 50% and cut down up to 400 kWh of energy consumption through the year. PV generates 2800 W, which provides up to 50% of the electricity demand. |
| Hao Tian, 2018 [37] | China | Heating set-point 26 °C Cooling set-point 18 °C | STPV windows provide 0.26 kWh/per day, which saves around 30% of building load on a typical sunny day. Energy-saving of STPV windows was predicted with a substantial value of 54% in one of the case studies |
| Hyung Jun An, 2018 [34] | Korea | Heating set-point 24°C Cooling set-point 22 °C | Using the BIVP model reduced the heating and cooling loads by 18.2%. The increase in temperature settings affected the reduction of the heating and cooling loads. |
Table 3.
The current state of Renewable Energy and solar energy generation in Southeast Countries in Megawatt (MW) [8].
Table 3.
The current state of Renewable Energy and solar energy generation in Southeast Countries in Megawatt (MW) [8].
| Country | RE (Hydro, Geothermal, Wind) | Solar (PV) |
|---|---|---|
| Cambodia | 1270 MW | 6 MW |
| Indonesia | 6660 MW | 12 MW |
| Laos | 4170 MW | 1 MW |
| Malaysia | 5470 MW | 182 MW |
| Singapore | - | 57 MW |
| Thailand | 6023 MW | 1.610 MW |
| Vietnam | 46,410 MW | - |
| Philippines | 6557 MW | 132 MW |
Table 4.
Summarise the solar renewable energy situation in Southeast Asia in terms of targets, policies, FIT rates, and the initial cost of PVs.
Table 4.
Summarise the solar renewable energy situation in Southeast Asia in terms of targets, policies, FIT rates, and the initial cost of PVs.
| Country | Targets for Renewable Energy Generation | Policies Related to Renewable Energy | Initial Rate of Feed-in Tariff (USD) | Initial PV Cost for 4 kW PV (USD) |
|---|---|---|---|---|
| Cambodia [51,60,61] | Increase capacity of hydropower to 2.241 MW by 2020. | Renewable Energy Development Program | $0.091 kWh | - |
| Indonesia (Java/East Nusa Tenggara) [8,52,62,63,64,69] | Increase share of new and renewable energy in primary energy supply to reach 23% by 2025 and 31% by 2050. | Energy Law (law no.30) National Energy Implementation Program 2005–2025 | $0.07/kWh/$0.20/kWh | $4800 |
| Laos [53,65] | Achieve 30% share of renewables in primary energy supply by 2025. | Rural Electrification Master Plan (REMP) (2010–2020) | - | - |
| Malaysia [8,48,54,55,66] | Increase the capacity of renewables to 2.080 MW by 2020 and 4.000 MW by 2030. | Renewable Energy Law (2011) SEDA Law (2011) Feed-in Tariff Scheme (2011) | $0.26/kWh | $3500 |
| Singapore [56,67,69] | Increase solar photovoltaic capacity to 350 MW by 2020. | - | - | $13,317 (8 kW) |
| Thailand [56,58,68] | Rise in the growth of renewable energy consumption to 30% by 2036; This includes increasing the share of renewables-based power generation capacity to 20.11% and share of renewables in transport fuel consumption to 25.04% by 2036. | Power Development Plan 2010–2013 Renewable and Alternative Energy Development Plan (AEDP 2012–2021) Feed-in Premium (Adder): Feed-in tariff (2007) amended (2009) review rate (2013) | $0.12/kWh | - |
| Vietnam [59] | Increase the share of non-hydro renewables-based power generation capacity to 12.5% by 2025 and 21% by 2030. | Government’s Decision No. 37/2011/QD-TTg, Renewable Energy Act (2008) | $0.0935/kWh | - |
| Philippines [52,69] | Triple the installed capacity of renewables-based power generation from 2010 level to 15 GW by 2030. | Clean Metering, Renewable Energy Representative Funds, FITs, and Options for Green Energy | $0.17/kWh | $7200 (5 kW) |
Publisher’s Note: MDPI stays neutral with regard to jurisdictional claims in published maps and institutional affiliations. |
© 2021 by the authors. Licensee MDPI, Basel, Switzerland. This article is an open access article distributed under the terms and conditions of the Creative Commons Attribution (CC BY) license (https://creativecommons.org/licenses/by/4.0/).
Share and Cite
MDPI and ACS Style
Rababah, H.E.; Ghazali, A.; Mohd Isa, M.H. Building Integrated Photovoltaic (BIPV) in Southeast Asian Countries: Review of Effects and Challenges. Sustainability 2021, 13, 12952. https://0-doi-org.brum.beds.ac.uk/10.3390/su132312952
AMA Style
Rababah HE, Ghazali A, Mohd Isa MH. Building Integrated Photovoltaic (BIPV) in Southeast Asian Countries: Review of Effects and Challenges. Sustainability. 2021; 13(23):12952. https://0-doi-org.brum.beds.ac.uk/10.3390/su132312952
Chicago/Turabian StyleRababah, Haitham Esam, Azhar Ghazali, and Mohd Hafizal Mohd Isa. 2021. "Building Integrated Photovoltaic (BIPV) in Southeast Asian Countries: Review of Effects and Challenges" Sustainability 13, no. 23: 12952. https://0-doi-org.brum.beds.ac.uk/10.3390/su132312952
Note that from the first issue of 2016, this journal uses article numbers instead of page numbers. See further details here.