
Comparing the Recommendations of Buyers of Energy-Efficient and Inefficient Vacuum Cleaners


1
Department of Design, Organisation and Strategy, Faculty of Industrial Design Engineering, Delft University of Technology, 2628 CE Delft, The Netherlands
2
Department of Sustainable Design Engineering, Faculty of Industrial Design Engineering, Delft University of Technology, 2628 CE Delft, The Netherlands
*
Author to whom correspondence should be addressed.
Sustainability 2021, 13(23), 12988; https://0-doi-org.brum.beds.ac.uk/10.3390/su132312988
Submission received: 17 September 2021
/
Revised: 17 November 2021
/
Accepted: 22 November 2021
/
Published: 24 November 2021
(This article belongs to the Special Issue Sustainability and Consumer Behavior: Perspectives and Developments)
Abstract
:Although environmental awareness is increasing every year, and most people say they prefer to buy more sustainable products, many still do not act on their promise at the cash counter. Sustainable products are often still perceived to have lower quality or reduced performance. Recommendations of sustainable buyers might reduce this perceived risk of sustainability. In this research, the Net-Promotor-Scores (NPS) and the underlying reasons for such recommendations of 888 vacuum cleaner buyers were analyzed. The buyers of energy-efficient vacuum cleaners were found to be significantly less positive about their purchase. A difference in scores is, however, not caused by the difference in the energy efficiency of the products, but by differences in other drivers to recommend a product, such as perceived cleaning performance, ease of use and value for money. Additionally, higher suction power and increased weight positively mediated NPS ratings, irrespective of energy efficiency. Focusing design and communication on these aspects rather than on energy efficiency alone can be used to reduce the perceived green risk and increase trust in sustainable products. In this way, recommendations of buyers of energy-efficient appliances can be an effective additional tool in increasing sustainable consumption.
1. Introduction
Green marketing has been researched since the 1970s. The development of the theory has mostly been focused on green consumers and how to target those who would be willing to pay more for greener options [1,2,3]. Although most people say they would prefer to buy a more sustainable product providing the performance, quality and price are the same [4], only a small minority actually buys sustainable products. To attract only the minority of consumers is, however, not enough to change the impact consumption has on the environment. It is necessary to urge more consumers to act on their promise to buy more sustainable products. “Sustainability” might offer additional customer value but is still seldom the main reason to buy. At the cash counter, superseding issues, such as performance or image, prevail. Research of different product categories found that people often perceive sustainable products as having a higher cost of ownership. Cost is regarded not only in terms of money but even more so in terms of perceived lower performance or quality; for instance, sustainable shoes are seen as less fashionable [5], refurbished tires perceived as being of lower quality [6], and energy-efficient appliances as underperforming less sustainable options [7]. People need to be assured that more sustainable or energy-efficient products do not necessarily come at the cost of other buying criteria. There is a need to communicate the value of sustainability in a more integrated manner with other product values. Experiences and recommendations of more environmental friendly products from customers are effective in confirming sustainable value and creating recurring sales [8]. This research seeks answers on whether the recommendations of buyers of energy-efficient vacuum cleaners have the potential to increase the consumption of energy-efficient models.
The theoretical background regarding sustainable consumption is addressed in the next paragraph. Then, the research on the quantitative measurement of customer satisfaction and recommendations is addressed. Before concluding with the research questions, we introduce vacuum cleaners as our research topic.
1.1. Sustainable Consumption
Recent literature studies on green marketing [2] and green consumption [9] show that green marketing strategies and research on sustainable consumption are increasingly moving away from mainly targeting green consumers with green products. Rex and Baumann [10] recommended broadening the targeted population with more mainstream consumers and including green features in conventional products. They also highlighted that the customer perceived increased risks of sustainable buying as a critical issue that needs to be addressed. Empirical research verified that reducing green perceived risk can not only increase green trust, but can also raise green purchase intentions [11]. Dangelico et al. [12] found that there are positive roles for functional value and value for money in driving green purchase behavior and highlighted that product characteristics, related to quality, performance and price, are key for green product success. Marketeers should avoid green marketing myopia mistakes [13] by including products’ environmental attributes as additional benefits and carefully integrating them, in both design and communication, with other superseding attributes, such as performance, quality and image.
When addressing mainstream consumers, it is more effective to focus on personal benefits, e.g., health, fun, ease of use or image, instead [14]. Environmental benefits are perceived as more abstract than, for instance, caring for family, personal image or health. Environmental issues are considered less urgent, more distant, and solvable in the future, unlike more personal problems [15].
Another issue to address to drive sustainable consumption is consumer behavior and habits [9]. Most people tend to stick to past behavior. If they adopt more sustainable behavior and consumption, they will tend to stick to it.
1.2. Product Recommendations
Overall product satisfaction is a prerequisite for recurring behavior and sales, as well as for recommendations to convince others of the quality and value of more sustainable products. Dangelico et al. [12] showed the mediating effect of green purchase satisfaction on the links between personal norms and green purchase frequency. They highlighted the relevance of considering purchase satisfaction when studying green purchase behavior, although this has received limited attention in the past.
Satisfaction can be viewed as a positive post-purchase customer perceived value. Perceived value involves more than one aspect of value simultaneously [16], e.g., functional value, economic value, social value, hedonic value, and altruistic value. There is consensus that this depends on the individual attitudes, the context and the product/service itself. There is, however, less consensus on how to measure satisfaction. This can be either performed on multiple of the abovementioned aspects or on only one dimension, as proposed in the Net-Promotor-Score (NPS).
Reichheld proposed the NPS with the slogan “the one number you need to grow” [17]. NPS basically condensed the measurement of satisfaction into one dimension by asking customers (on a scale of zero to ten) how likely it is that they would recommend the product or service to their family or friends. This was based on the idea that willingness to promote a company or product is a strong indicator of perceived quality and value. When customers recommend a product, they are putting their own reputations on the line. Consumers would only take that risk if they were intensely loyal. The NPS is not without criticism [18,19,20]. It proved not to be a reliable predictor of future sales growth, as claimed by Reichheld. The validity of the NPS as a measurement of satisfaction, however, is neither inferior nor superior to more dimensional methods to measure satisfaction [20]. The benefit of the NPS is that it asks only one simple question: would you recommend this product to your family and friends? The question is easily understood and quick to answer. A second reason for the use of the NPS is that recommendations and word of mouth are playing a major role in influencing customers. Consumers would only take that risk if they are intensely loyal. The NPS is not without critics [18,19,20]. Allen and Spialek [21] showed that sustainable food buyers are more likely to provide word of mouth recommendations than those who bought less sustainable food. They predict that green WoM will increasingly become a strategic business concern. Not only word of mouth (WoM) from family, friends and colleagues, as measured by the NPS, is gaining interest, but also eWoM by influencers on social media. Ismagilova et al. [22] found that for people to be willing to buy based on a recommendation, the credibility and similarity (homophily) of the source is highly important. This explains why friends and family are seen as trusted sources; they know each other. On the other hand, people tend to advise their loved ones to perform less risky behavior compared to the risks they would take themselves [23]. As highlighted in the last paragraph, sustainable consumption is still perceived as riskier than buying less sustainable options.
1.3. Vacuum Cleaners
For this research, extensive NPS data from Philips Consumer Electronics on consumers of vacuum cleaners were used. Vacuum cleaners are an ideal product category for research on sustainable consumption.
First, vacuum cleaning is a well-researched and described product category in respect to sustainability. Furthermore, 75% of the environmental cost over the life cycle (calculated by Life Cycle Analysis) of a vacuum cleaner is caused by its energy consumption [24]. Reduced input power is, therefore, essential for more sustainable consumption. Input power had no significant association with weight or price but also not with suction power. Suction power is the factor that defines the quality of vacuuming to a large extent. Other research [7] on the reasons for buying either energy-efficient or -inefficient vacuum cleaners found no significant difference in the reasons to buy between buyers of either low- or high-input models, except for 6% of the buyers who bought a low-input model for its environment friendliness. This last group, buyers of low-input power for reasons of environmental friendliness, was defined as green buyers. Obviously, no customers bought energy-inefficient vacuum cleaners for reasons of environmental friendliness.
Second, in 2016, the European Union implemented new legislation that maximized the allowable input wattage of vacuum cleaners at 1600 Watt [25], thus effectively defining the border between energy-efficient and -inefficient vacuum cleaners at 1600 Watt. In 2011, there was an approximately equal number of vacuum cleaner models above and under 1600 Watt on the European market. This makes it possible to compare both energy-efficient and -inefficient models. Both low- and high-input power models were available with similar specifications in suction power, weight and price [7]. All the vacuum cleaners under 1600 Watt were promoted as energy efficient and better for the environment.
Finally, Philips’ product portfolio covered the complete spectrum of vacuum cleaner products offered to the market. It aimed to cater to the complete range of prospective buyers and as such covers all products, from high to low end, targeting both mainstream and green buyers. Since all specifications in suction power, weight and price were available in both low- and high-input power models [7] and input power has no correlation with performance [24], no difference was expected in recommendations between buyers of high- and low-input power models after experiencing product use.
1.4. Research Questions
Based on the previous paragraphs, we deduce that sustainable consumption can be encouraged by reducing the perceived risk of sustainable consumption. Previous research [11,12] concludes that this can be achieved by increasing satisfaction with and trust in sustainable products both directly by product use and indirectly by product recommendations. This research explores whether recommendations of sustainable consumers might be effective in increasing sustainable consumption. In this regard, it is essential that the customers of energy-efficient models report higher or at least the same NPS ratings as those who bought a less energy-efficient vacuum cleaner from an otherwise comparable specification. This leads to our four underlying research questions.
(RQ1) Are buyers of low-input power vacuum cleaners as positive in their NPS as those who bought high-input power models?
Both low- and high-input power vacuum cleaners were available in comparable product specifications (suction power, weight, and price) and comparable performance. Since the vacuum cleaners are, except for input power, comparable, we also expected NPS levels between the consumer groups to be comparable. Most low-input buyers bought their vacuum cleaners for the same reasons as high-input buyers, except for those who bought an energy-efficient model for the main reason that it is energy efficient. We expect the same difference to be reflected in the NPS ratings between the three consumer groups.
(RQ2) Do consumers of low- or high-energy models recommend for different reasons?
Since high input powered versions are not bought for reasons of environmental friendliness and they are scientifically not environmental friendly, we expect a difference between the two groups.
(RQ3) Are the specifications of buyers of low- and high-input power vacuum cleaners comparable besides their input power?
All specifications in weight, suction power and price were available in both low- and high-input versions [7]. The reason for this might be that the buyers of low-energy versions bought different specifications in weight, suction power or price than those who bought high-power vacuum cleaners.
(RQ4) Are there different mediation effects for buyers of low/high-input power vacuum cleaners on NPS rating?
We expected specifications such as suction power and weight and some of the main reasons to recommend mediating NPS ratings.
In Section 2, the ‘Materials and Methods’ describe how the NPS data from the vacuum cleaner buyers were collected. In Section 3, results are reported. Section 4 discusses the results and highlights academic and managerial implications of this research. This section also describes the limitations of this research and provides directions for further research. Section 5 summarizes the conclusions.
2. Material and Methods
In this research, Net Promotor Score (NPS) data of vacuum cleaner customers obtained from Philips Consumer Electronics were used. Buyers who registered their vacuum cleaners for warranty answered questions regarding their demographics (age, country of living, household, and sex) as well as reason to buy and article number. These data were combined with the procured product specifications, i.e., input power (Watt), weight (kg), suction (Watt) and price (EUR). After three months, and ample time to experience and judge their product, they received an email with a link to answer a number of questions. Owners were asked to rank on a 11-point scale of zero (very unlikely) to ten (very likely) how likely it is that they would recommend the procured article to family or friends. They were also asked to pick one out of 12 reasons of recommendation (accessories, brand & reputation, cleaning performance, customer support, design & look, ease of use, environmental friendliness, noise & emissions, price, product features, reliability/durability, and others). In total, 888 customers answered the additional questionnaire. Sufficient answers were obtained to allow meaningful conclusions (see Appendix A, Table A1 for the number of respondents per customer group and a further numerical specification of their reactions).
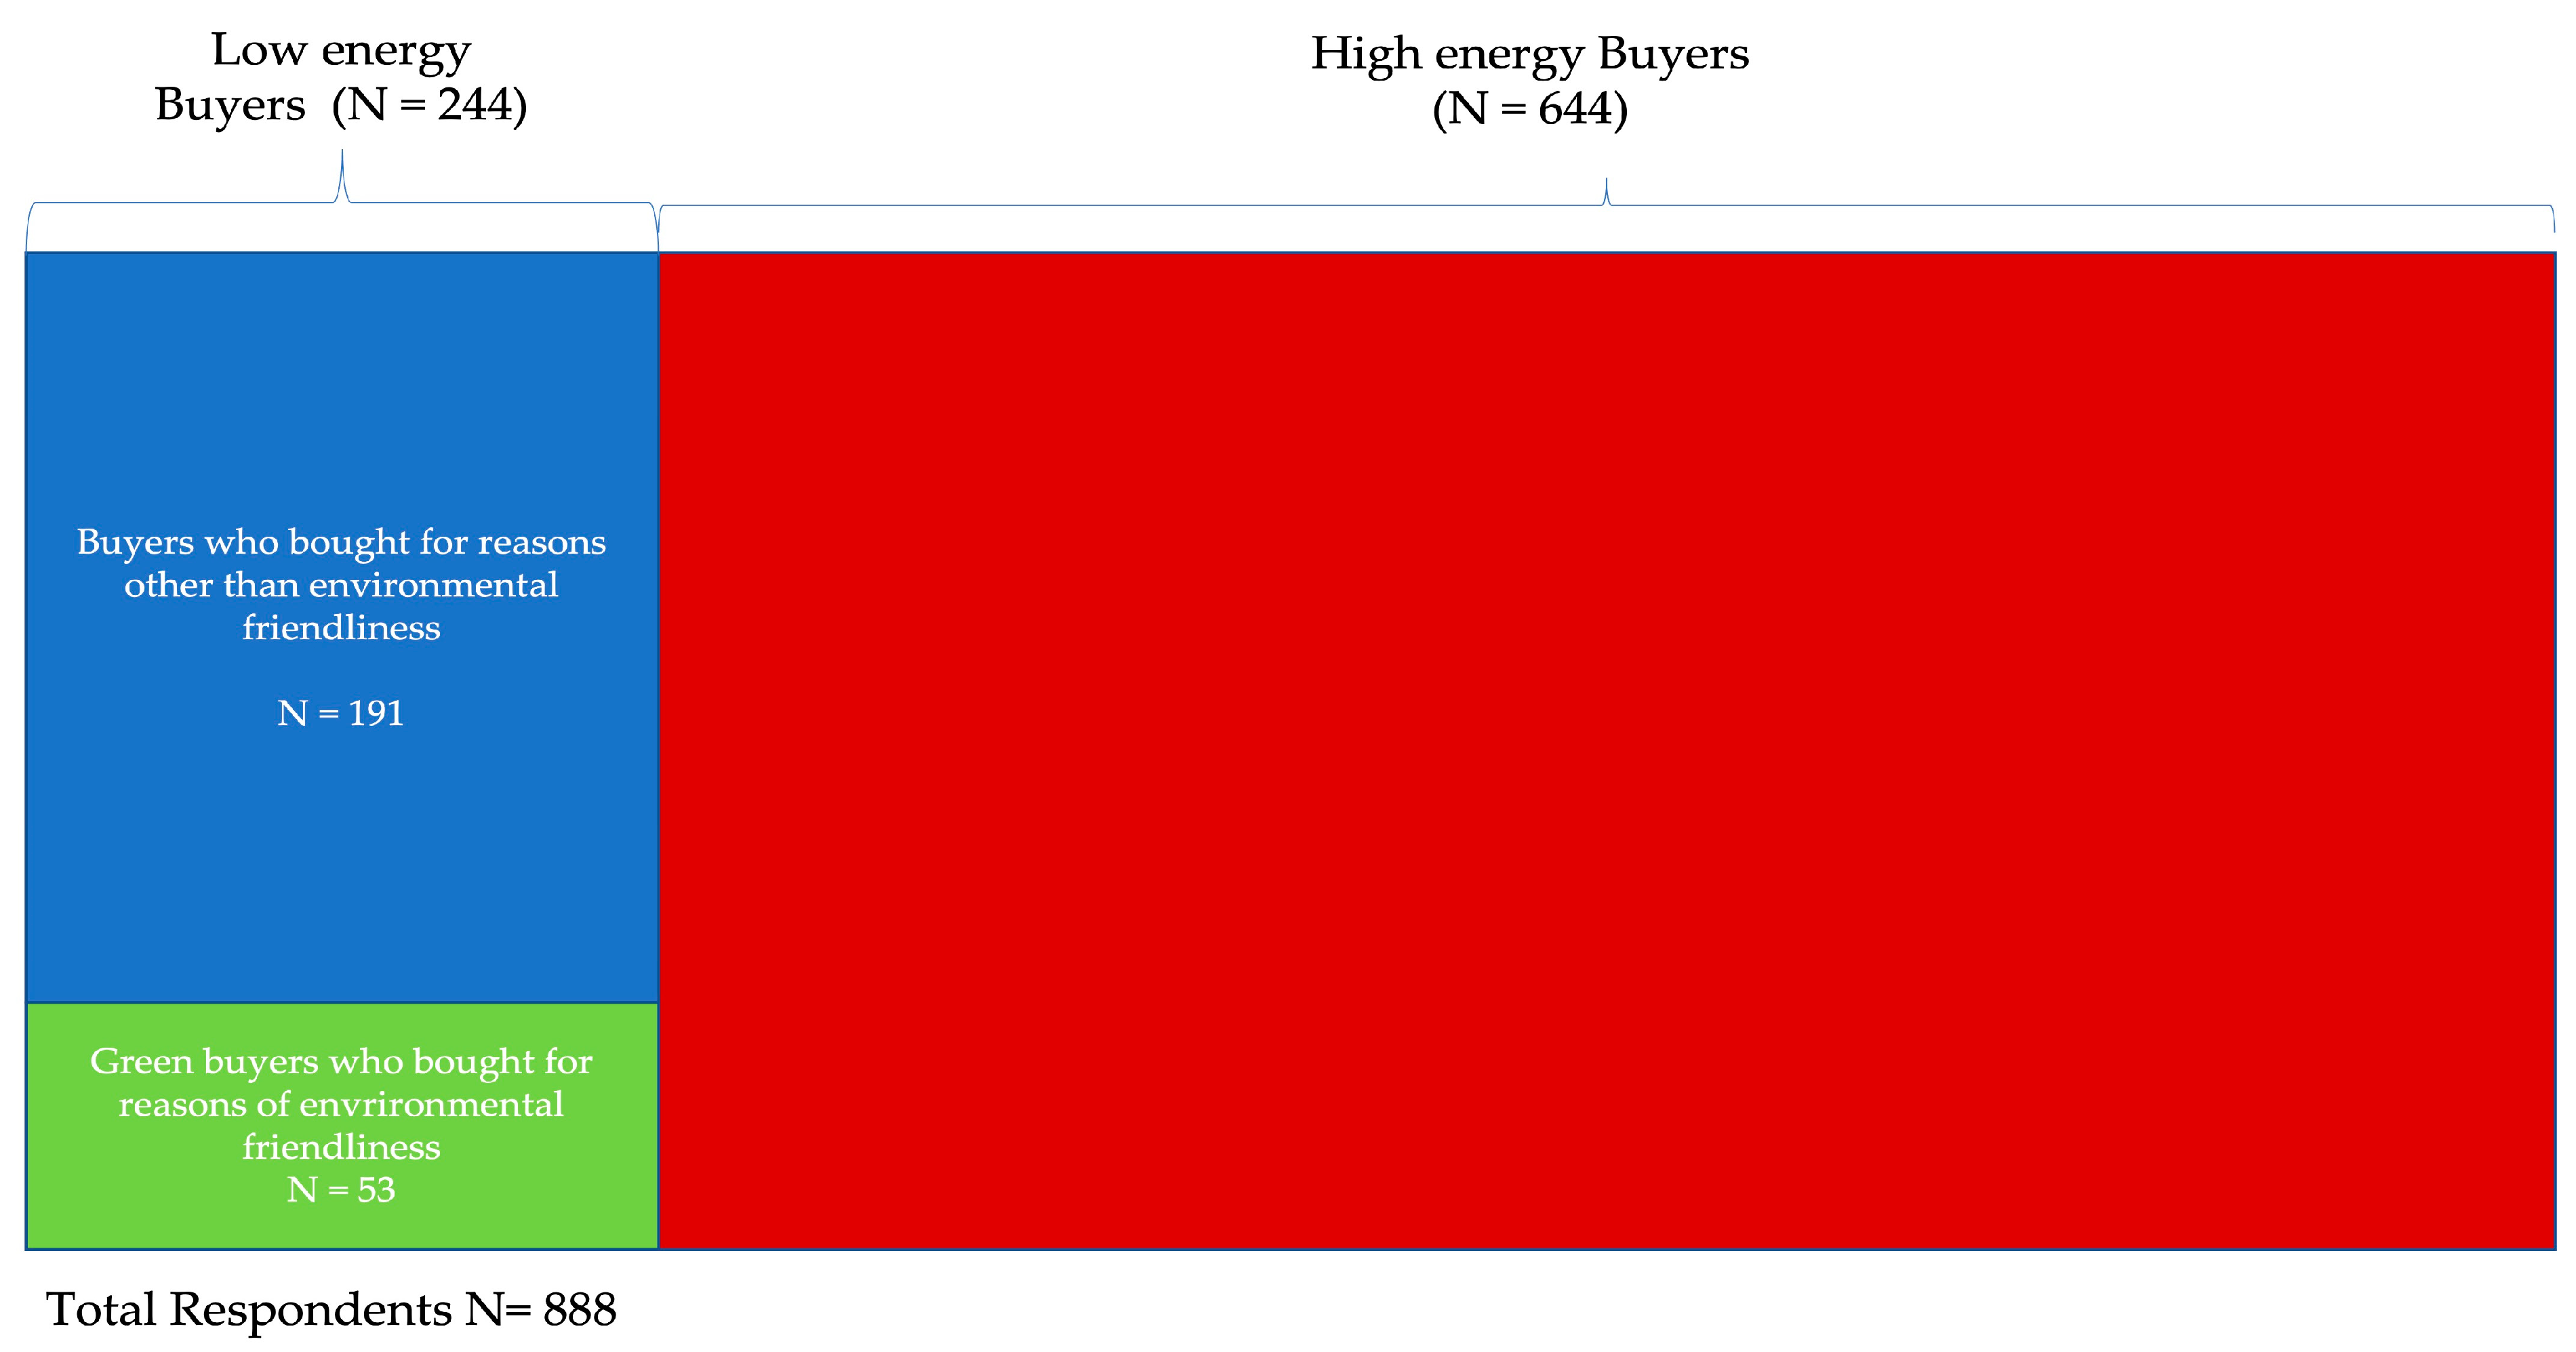
Only data of European customers were used, as the vacuum cleaners’ specifications as well as regulation and legislation are identical across the continent. The respondents were split in line with the future energy efficiency legislation for vacuum cleaners by the European Union [25] in less or more than 1600 Watt input power. Previous research [7] showed that the buying reasons of most low-energy buyers do not differ much from those of the high-energy buyers, except for a smaller group buying a low-energy vacuum cleaner due to its environmental friendliness. Therefore, it was decided to start this research with the same 3 buyer groups: buyers (N = 244 or 27% of the total population) who bought low-input power versions (including 53 green buyers who bought a model for its environmental friendliness, 6% of the total population) and buyers of high-input power versions (N = 644 or 73% of the total population), as shown in Figure 1.
When customers are asked about their satisfaction with their bought product or service, the distribution of satisfaction ratings, e.g., with the NPS score, tends to be biased towards higher satisfaction levels [26]. This is understandable, since all customers expect to be satisfied with their new product; otherwise, they would have bought nothing or another product. The lack of normality in the distribution makes statistical tests which compare means, such as t-tests, of questionable validity. Comparing distributions is more informative. The method of data collection was identical for all customer groups; therefore, comparing distributions would deliver valid results.
To analyze the data, several tests were performed by using SPSS as a software tool. For normality, skewness (the symmetry of the distribution) and kurtosis (tailedness, which would be three in case of normal distribution) were calculated.
To test for differences between groups, Analysis of Variance (ANOVA), specifically the “one-way-between-groups” version, was used to test for differences between groups. Due to non-normal distributions, the Welch and Brown–Forsyth F test based on the deviations of the group data from their individual medians was used. This is valid considering the large sample size [27].
A mediation analysis was used to determine the interactions of attributes and reasons for satisfaction in NPS ratings. Mediation occurs if the strength of the relation between the predictor (in our case, the input power) and outcome (NPS ratings) is reduced or increased by including a mediator. To estimate the model the PROCESS-macro for SPSS by Andrew Hayes [28].
3. Results
3.1. Are Buyers of Low-Input Power Vacuum Cleaners as Positive in Their NPS Ratings as Those Who Bought High-Input Power Models?
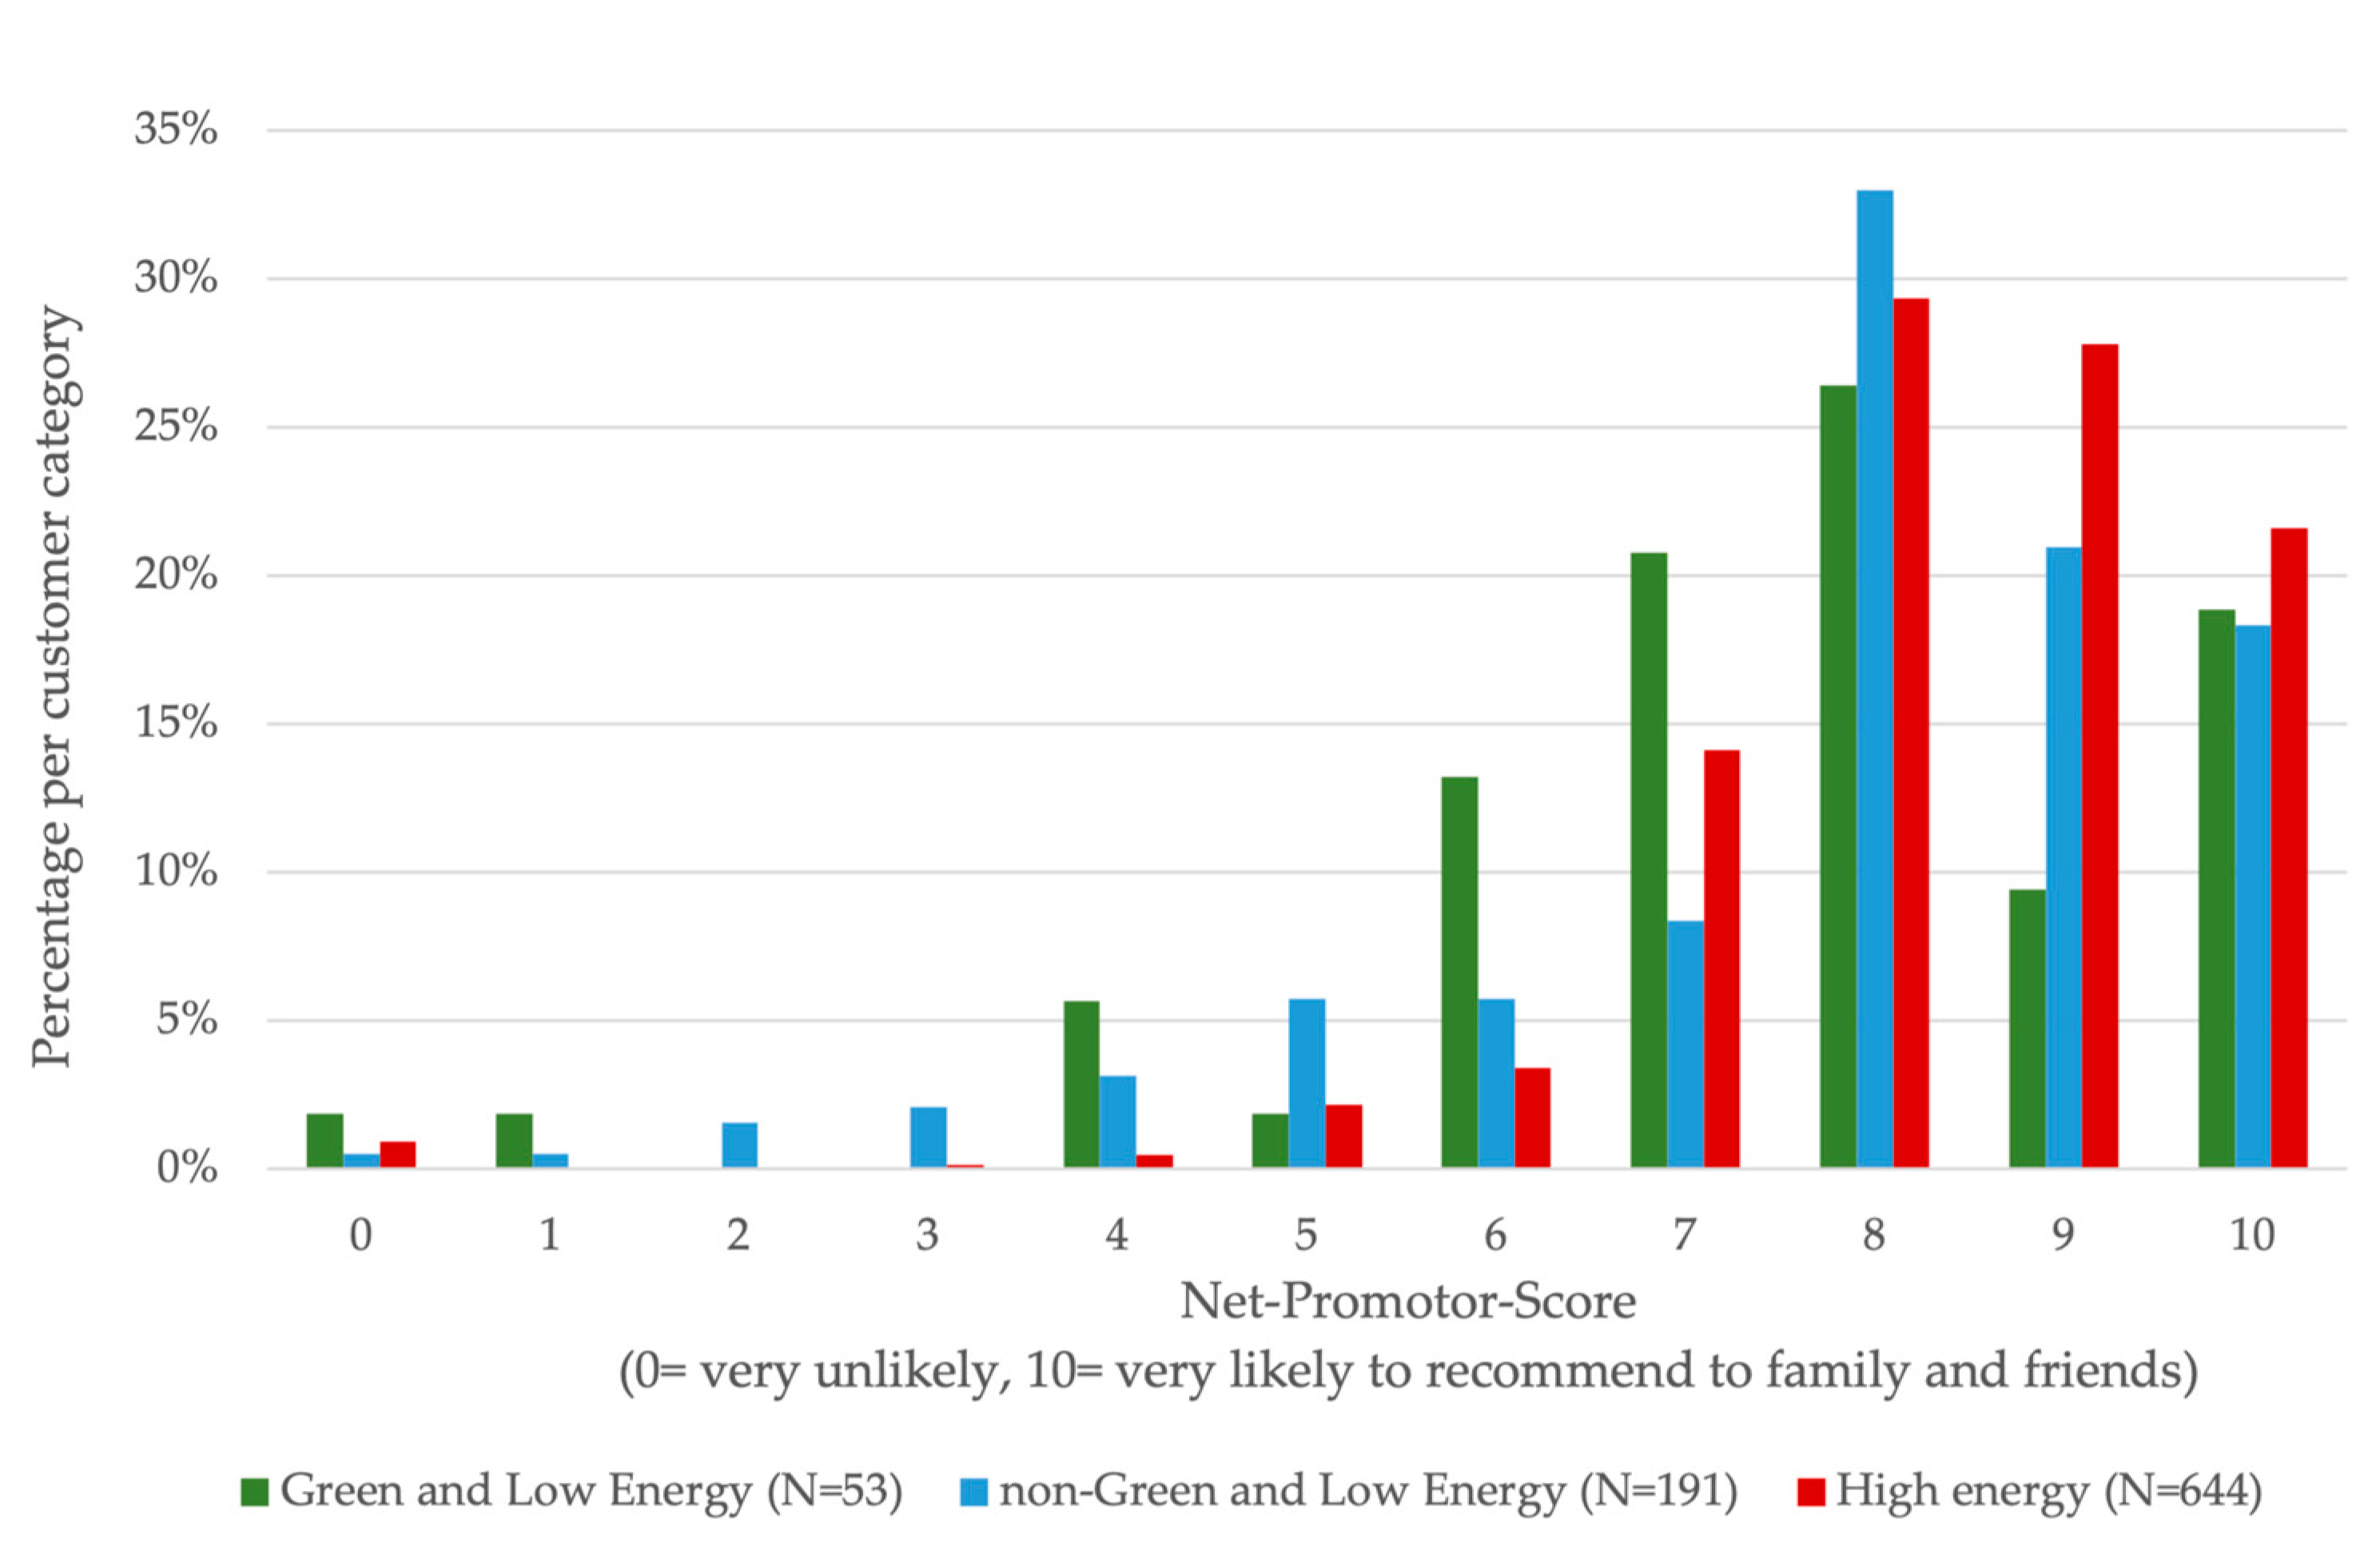
In Figure 2, the NPS scores for each customer group are shown (see also the corresponding cross table in Appendix A, Table A2). As described in Section 2, there is a clear positive bias shown in the asymmetry (skewness of −1.81) towards higher recommendations. The distribution is further strongly tailed with only 6.3% of the customers rating negative (a score of a five or less). All three groups show a median of 8.
The NPS scores of the three independent customer groups in Figure 2 show that the high-energy buyers (MeanHE = 8.33, Std. DeviationHE = 1.49) are most positive in their recommendations. More importantly, green low-energy buyers (MeanGL = 7.43, S.D.GL = 2.14) are those who are the least positive. The non-green low-energy buyers are found in between (MeannGL = 7.80, S.D.nGL = 1.99). A one-way between-group analysis of variance (descriptions in Appendix A, Table A3) was conducted to explore whether the three independent customer groups differ significantly in their level of recommendation. The Welch and Brown–Forsyth test, to test if the groups are different from one another, is significant (p < 0.001), which makes it unlikely that the differences observed are due to random sampling. It showed a difference between at least two of the groups (F (2, 885) = 13.21, p < 0.001). The post-hoc test showed that there was no significant difference (p = 0.391) between the low-energy buying groups but a significant difference (p < 0.001) between high-energy and green low-energy buyers (95% confidence interval (C.I.) = [0.34, 1.46]) as well as between the high-energy and non-green low energy buyers (95% C.I. = [0.21, 0.86]). Since there is no significant difference between the low-energy buying groups, these groups were combined in the further analysis.
The high-power buyers are significantly more positive in their recommendations than the low-energy buyers; the difference in the NPS means between high and low energy is 0.62 compared to the mean of the total sample (8.17). Considering the skewness of the data, this is a considerable effect. Therefore, energy efficiency comes at a cost to customer perceived value of the vacuum cleaners.
No significant difference was observed in NPS ratings between green buyers and non-green buyers of low-energy models.
3.2. Do Consumers of Low- or High-Energy Models Recommend for Different Reasons?
To determine whether low and high buyers differ in their reasons to promote, we only considered satisfied buyers (NPS rating higher than five).
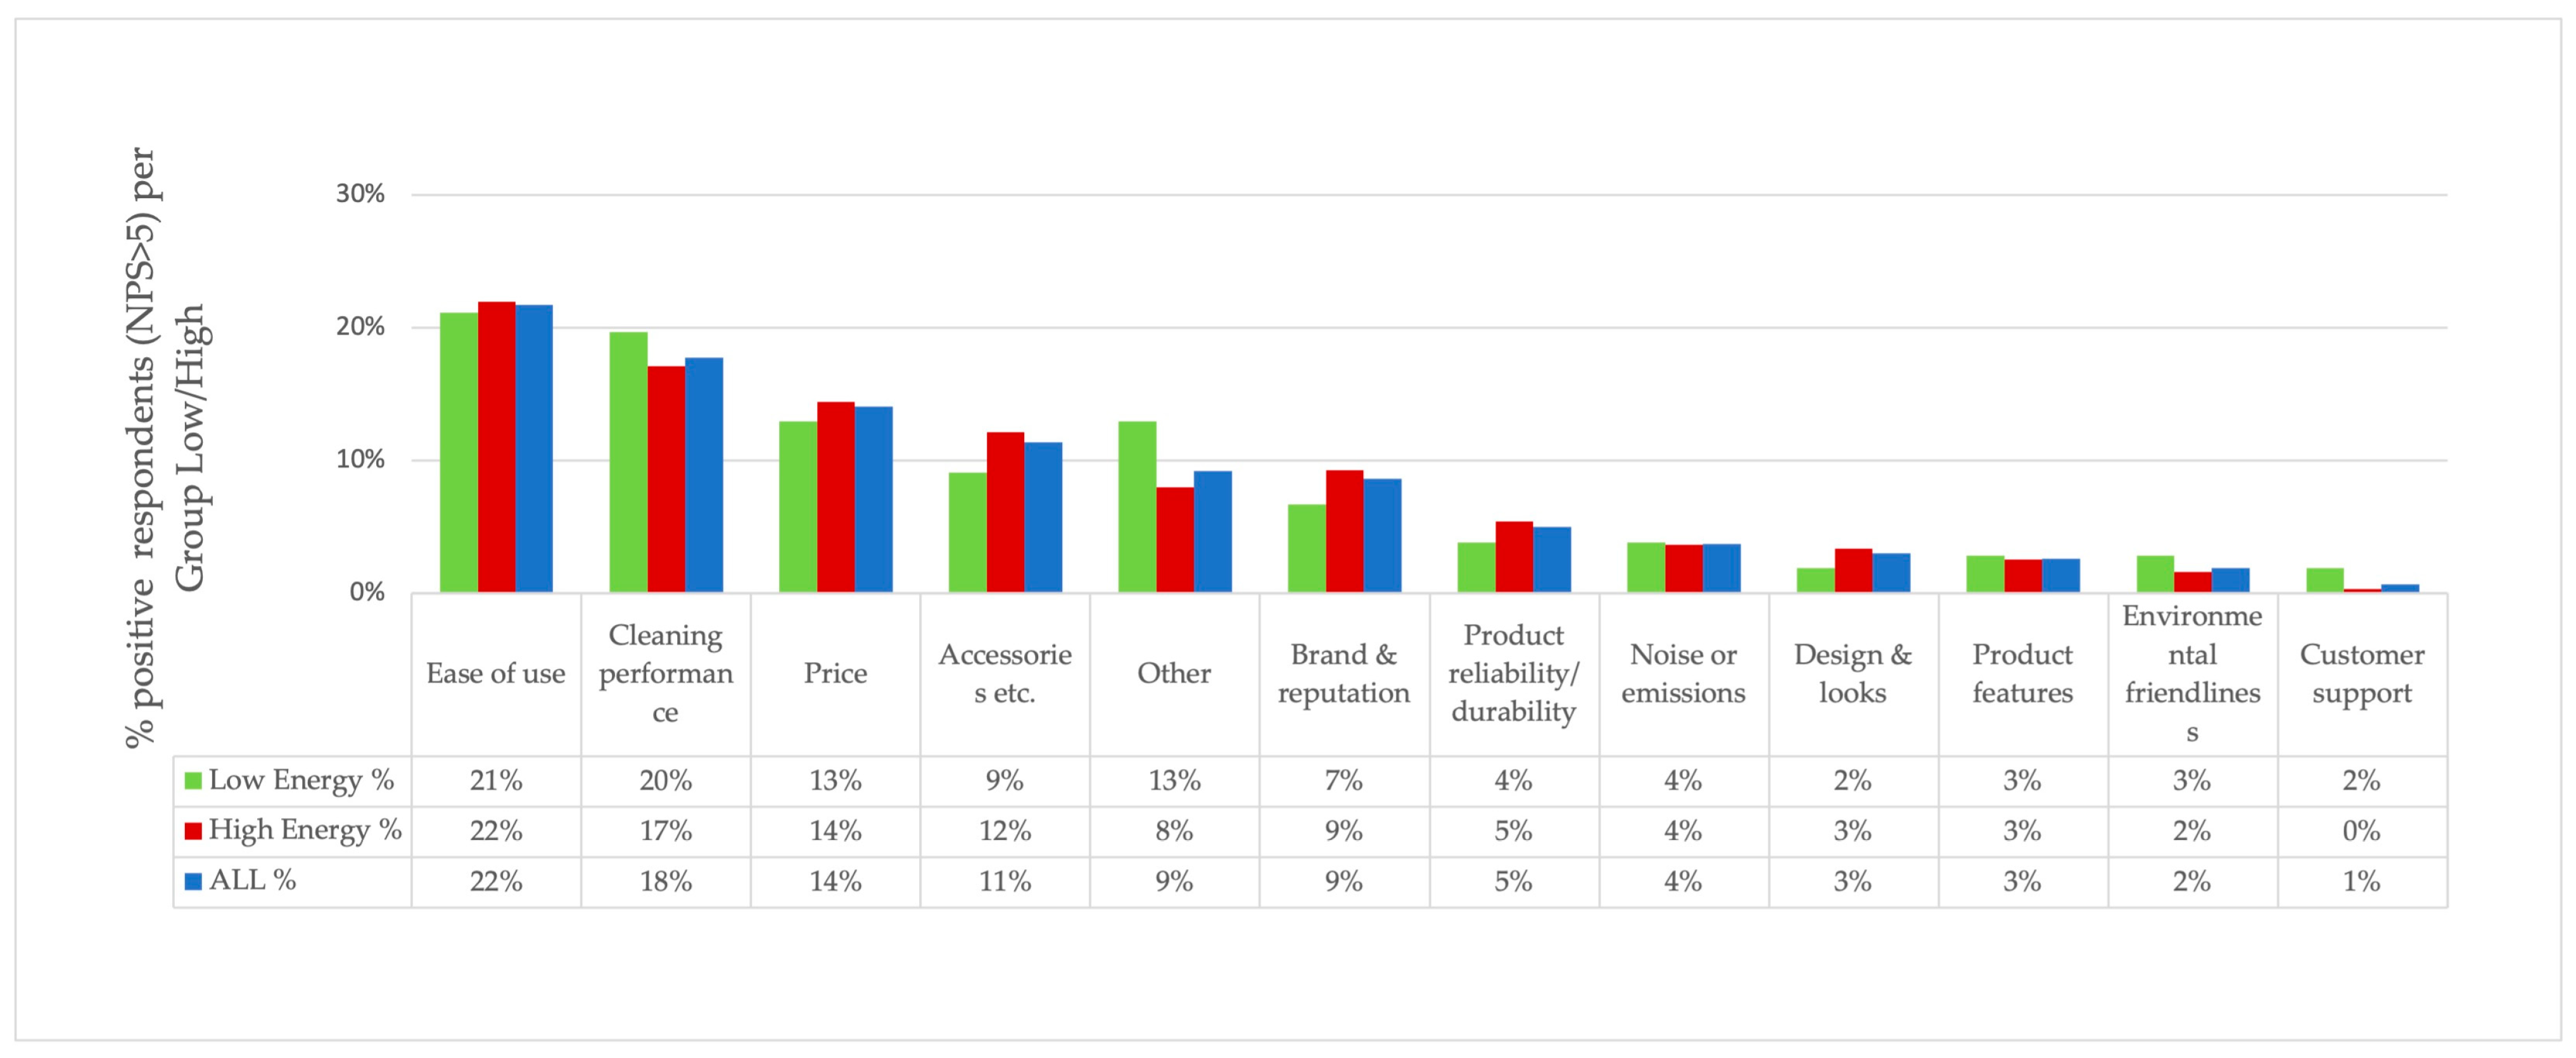
Figure 3 shows the reasons for recommendation of the positive customers, also presented from high frequency to low frequency. The customers named ease of use, cleaning performance, price, accessories, other, and brand and reputation as the main reasons for promoting, as these attributes account for more than 80% of the reasons to buy. For all customer groups, environmental friendliness is a reason to promote in only 2–3% of the cases.
To check whether the reasons for recommendation are related to the NPS rating or to the (in) efficiency of the vacuum cleaners, Pearson Chi-square tests [27] were performed. The tests showed that there was a significant association between the NPS rating and the main reason for recommendation (X2 (11, N = 888) = 28.72, p = 0.003).
There was, however, no significant association between low or high power and the main reasons for recommendation, X2 (11, N = 888) = 17.09, p = 0.105.
Low- and high-energy buyers are not significantly different in their reasons for recommendation. The NPS rating comes from their reasons for the NPS and not from whether their vacuum cleaner is energy efficient or not. This raises an additional research question as to whether their perception is steered by specification attributes other than input power, i.e., suction power, weight or price, which were all found to be input power-independent [7] attributes. Both efficient and inefficient models were available with comparable specifications, except for input power, but the bought models might have had a different spread.
3.3. Do the Specifications of Vacuum Cleaners Bought by Promotors Differ between Low- and High-Power Models?
To test whether the low- and high-powered vacuum cleaners bought by positive recommending owners had significantly different specifications, a one-way analysis of variance was performed. The means and standard deviations, as well as the significances, are presented in Table 1.
The price in EUR between the low- and high-powered vacuum cleaners of the promoting customers is not significantly different, although price, i.e., value for money, is an important reason to promote. Both suction power (F (1, 540) = 447.03) and weight (F (1, 371) = 14,261) are significantly (both p < 0.001) different between the two groups of owners. Energy-efficient buyers bought vacuum cleaners with significantly less suction power and weight, although models with a higher suction power and weight were available. Suction power and weight are also attributes that are not related to input power wattage.
3.4. Mediation Effects on NPS Ratings of Promotors
Due to the results presented in Section 3.1, Section 3.2 and Section 3.3, weight, suction power and one or more of the reasons for the NPS rating might explain NPS ratings. This effect is called mediation. To find the indirect effect of the variables on NPS ratings, an ordinary least squares path analysis (using Preachers’ SPSS Process script [28] Model 4) was conducted on the data of the promotors (NPS > 5). The direct effect from input power on NPS ratings was not significant (p = 0.48). This is very important and means that input power alone has no impact on NPS ratings, and it also confirms the outcomes of 3.2; the choice for low- or high-input power is not significant for the NPS rating. The indirect effects of weight and suction, often mentioned by buyers as a major buying criterion, were neglectable (effect 0.002).
Four reasons to promote had a significant (all p < 0.002) direct effect on NPS ratings independent from input power: brand and reputation (b = 0.64, t = 4.47), cleaning performance (b = 1.14, t = 10.14), ease of use (b = 0.60, t = 5.70), and perceived price (b = 0.50, t = 4.17). Promotors who promoted their purchase based on these aspects were more positive in their recommendations, whether they bought an energy-efficient vacuum cleaner or not.
4. Discussion
The main question of this paper is to what degree buyers of energy-efficient vacuum cleaners are effective in promoting sustainable products.
As shown in Section 3.1, buyers of energy-inefficient models are much more positive in their recommendations compared to the buyers of energy-efficient models. Here, it should be taken into account that the low- and high-energy models on the European market showed, in contrast to the input power, no significant differences in specification [7], so in the first instance, no difference between customer groups was expected. Furthermore, Section 3.2 and Section 3.4 showed that input power is not the reason for the lower NPS ratings or being satisfied or not.
Persons who bought an energy-efficient model bought a model with significantly lower suction power and weight (Table 1) compared to those who bought inefficient vacuum cleaners (in Section 3.3). This is interesting as higher specifications were also available in energy-efficient models. All energy-efficient models were sold with communication focusing on energy efficiency, which might have put the energy-efficient models into a one-sided environmental perspective, at the cost of more important attributes, such as cleaning performance which is related to suction power [7,24]. This is potentially penalized with lower NPS ratings. As recommended by different researchers [7,10,14], the primary focus in the design and communication of sustainable products should be on conventional criteria such as performance and personal benefits. The environmental performance should be an integral part of the design but not a focal point of communication to avoid backlash in reduced trust and increased risk.
Satisfaction is determined by people’s reasons for the NPS and not from whether their vacuum cleaner is energy efficient or not. Low-energy buyers find other aspects important compared to high-energy buyers and, therefore, judge on other criteria, which are not directly related to energy efficiency (Section 3.2). This is supported by the results from Section 3.4, which show that the direct effect of input power on NPS ratings is neglectable. One needs to take into account that specifications such as suction power, weight and price are not significantly associated with the height of input power. They do, however, impact the perceived performance, e.g., perceived cleaning performance, perceived ease of use and perceived value for money [7,29]. These performance-related perceptions do have a direct effect on NPS levels. However, these are independent of input power.
It should be taken into account that recommendations, especially those coming from close personal relations, are colored by the knowledge of the person in mind. People recommend lower risks to people they know than risks they would take themselves [23]. Considering that most people bought energy-inefficient vacuum cleaners, some still might perceive a sustainable choice to carry more risk in the short term. The environmental benefit is also much more abstract compared to the perceived personal benefit, e.g., a clean floor for children to play on.
5. Conclusions
5.1. Academic Implications
The most important academic implication of this research is the support for research recommending targeting a broader population with sustainable products and energy-efficient appliances rather than targeting only green consumers who buy mainly based on environmental credentials. Figure 2 and the supporting one-way between-group analysis of variance showed no difference in satisfaction between the green and non-green energy-efficient buyers. This is support for the recommendations of Rex and Baumann [10] and Ottman [13] to target consumers for sustainable products much broader than only green consumers. Sustainability should be an integrated aspect of products. Product communication should be focused on personal benefits and performance rather than on environmental benefits. The results of the mediation show that functional value, quality and performance are key for green product success, as suggested Dangelico et al. [12].
This research showed that energy-efficient buyers are less effective promotors compared to buyers of energy-inefficient vacuum cleaners. This makes them, at the moment, ineffective in reducing the perceived risk of sustainability or increasing trust in sustainable products, as proposed by Chen and Chang [11]. The present research showed lower value or satisfaction ratings for energy-efficient buyers. A difference might be caused by the fact that the present research tested, unlike in the case of Chen and Chang, actual purchases. We suspect the recommendations for sustainable products measured by the NPS based on recommendations to relatives might be somewhat more negatively biased than the methods used by Chen and Chang, which measured the perceptions of respondents. Helfinstein et al. [23] suggest that recommendations to close relatives might be risk avoiding. Although we found that energy efficiency was not the direct reason for lower NPS ratings, the input power might have colored the attributes that were reasons to recommend.
5.2. Managerial Implications for Design and Communication of Sustainable Products
This research showed that buyers of energy-efficient vacuum cleaners are not effective in recommending sustainable products. It also showed that energy efficiency itself is not the cause for this. There are a few options available to reduce the perceived risk of sustainability through a combination of improved design, up to date technology (IT and sensor-assisted energy management) and a linked benefit communication strategy [13]. Possible options can be found in the following:
- Design focused on (perceived) performance: for example, focus the design of energy-efficient vacuum cleaners on increasing ease of use and cleaning performance. As shown in Section 3.4, both are reasons that lead to higher NPS levels. Technically, this is feasible. Modern 900 Watt vacuum cleaners show better cleaning performance and increased suction via more airflow effective accessories and connectors [30]. Make designs look powerful and robust to increase the perceived performance and quality [31]. Focusing product design and specification on reliability and durability, cleaning performance and ease of use can additionally improve satisfaction ratings independently from energy efficiency.
- Focus product communication predominantly on personal benefits, such as clean floors, reduced time to clean, and ease to handle. When communicating environmental benefits, this should be linked to benefits [13] such as reduced cost, longer lifetime, and higher quality.
5.3. Legislative Implications
In Section 3.1, it is shown that, at the moment, buyers of energy-efficient vacuum cleaners are not effective promotors. As long as energy efficiency is not promoted by customers and continues to be perceived as a risk to performance producers are encouraged to sell energy-inefficient instead of energy-efficient models. Unfortunately, the event after Dyson successfully challenged the eco-design directives for vacuum cleaners in court [32] proofed this. Awaiting reformulated directives, scheduled for 2023, many producers directly took the opportunity to temporary reintroduce high-power models, undermining their own messages in recent years that energy efficiency does not come at the cost of performance, an effect already observed more than 20 years ago for TVs and audio equipment [33]. Producers were not able to disseminate messages about energy saving in a way that results in a significant shift toward low-energy models. This makes it legitimate and unavoidable to implement energy consumption-reducing legislation, effectively taking energy efficiency out of the buying decision-making process. The market will not likely move by itself as long as there are energy-inefficient models on the market. When design and communication are not applied appropriately and satisfactorily, this will make implementing energy efficiency legislation, such as that of the European Commission [25], unavoidable. Awaiting EU legislation in 2023 to reduce the maximum input power even further to 900 Watt has stimulated innovation in energy efficiency enormously. At present, the top 20 vacuum cleaners with the highest performance rating have an input power of less than 900 Watt [30,34].
5.4. Limitations and Further Research
This research has some limitations. One is the concise character of the NPS as a measurement instrument. NPS has been used by multiple for profit and not for profit organizations in multiple branches. Although the NPS by scholars is not viewed as a valid predictor for business success or future behavior [18], the validity of a one-dimensional measure for satisfaction is acceptable [16]. Although the one-dimensional question “how likely are you to recommend?” has validity, it is lacking details in the reasons for satisfaction. This is overcome by asking customers to pick a reason for their rating as well. Customers could select only one chief reason and one second reason for their rating. The latter were hardly reported and, therefore, omitted from the analysis. More interesting and useful data would have been collected when more comprehensive Likert scores were used and customers were asked to rate the degree to which each attribute affected their satisfaction rating.
Only one product category was researched, and the results might be different for other white goods, which, for instance, have a stronger emotional effect on people, such as espresso machines, cars or music appliances. Additionally, products with stronger personal or health benefits, such as organic produce, might provide different results. On the other hand, the results are in line with those for televisions [33], although this relates to a study of approximately 20 years ago.
European consumer data were used as the models sold had the same specification. In other regions, the specifications and likely also the results might differ. The sold vacuum cleaners in countries such as Brazil, China and India have different specifications and are most often smaller and lighter with lower watt engines. Use patterns, flooring and cleaning practices in other regions might also be different and lead to other outcomes. It might be interesting to repeat this study for those customers.
5.5. Final Conclusions
Buyers of more energy-efficient vacuum cleaners make poor promotors compared to those who bought energy-inefficient models. A difference in satisfaction comes from the different reasons for the satisfaction of energy-efficient buyers rather than from the energy efficiency itself. Objectively, there is no reason for such a negative perception; there is no difference in the technical performance between energy-efficient models and inefficient models [7,24]. Apparently, large parts of the buying public have a subjective perception that the performance of the energy-efficient models is lower, even if this objectively is not the case. This strongly suggests that communication about energy efficiency has to be improved drastically. This can be achieved by taking energy efficiency out of a specific environmental context and taking energy independent attributes into account. Many consumers see sustainability as of great societal interest but not as the most important or discriminating attribute of their product. Environmental benefits should be positively linked to product attributes that are perceived to be of primary interest, both in design as well as in communication. For vacuum cleaners, these are suction performance, accessories, ease of use and value for money. With designs that better balance airflow among motors, hoses and suction heads and application of the latest technology (IT and sensors), the technical performance, including the environmental performance, can be further improved. When communicated well, this can also contribute substantially to the perceived performance and reduce the perceived risk of sustainable consumption. This might even prove to be successful in attracting currently inefficient buying customers.
Since energy efficiency comes at the cost of the perceived customer value and additional perceived risk, producers proved to be reluctant to switch to energy efficiency as long as there are energy-inefficient models with higher perceived consumer value on the market. If this issue is not satisfactorily addressed, energy-reducing legislation is unavoidable and yields faster reductions in energy consumption. (Vacuum) cleaning has a large cultural element and is performed differently in different cultures. It seems that the perception problems regarding energy efficiency are also, to a large extent, Western ones. In Asia and Brazil, vacuum cleaners with lower energy consumption on average are sold in large quantities. This demonstrates that the present design and knowledge, and changed communication, offer a wide range of improvement options.
Recommendations and (e-) word of mouth of sustainable and energy-efficient customers can grow trust in a company’s communication regarding issues that cannot be supported with hard figures or have a strong emotional component, such as the environment or sustainability. It should be noted that positive emotions play an important role in the value perception of customers. Increasing the positive recommendations and word of mouth of sustainable buyers can be an additional tool to increase sustainable consumption beyond the greenest consumers.
Author Contributions
Conceptualization, M.V.; methodology, M.V.; validation, A.S., J.S.; formal analysis, M.V.; writing—original draft preparation, M.V.; writing—review and editing, M.V.; supervision, J.S. All authors have read and agreed to the published version of the manuscript.
Funding
This research received no external funding.
Institutional Review Board Statement
Ethical approvement was waived; The used data was not collected by the authors. The anonymized data was donated by Philips N.V, who collected the data in 2010 from their buyers. Respondents volunteered out of free will.
Informed Consent Statement
Informed consent was obtained from all subjects involved in the study by Philips N.V. to use their data anonymized for research purpose.
Data Availability Statement
Data is published at 4TU.researchdata htpps://doi.org/10.4121/17059862 (accessed on 17 November 2021).
Acknowledgments
We like to thank Philips N.V. in donating the anonymized customer data.
Conflicts of Interest
The authors declare no conflict of interest.
Appendix A

Table A1.
Descriptives: number of respondents per prime cause of satisfaction per consumer category (N = 888).
Table A1.
Descriptives: number of respondents per prime cause of satisfaction per consumer category (N = 888).
| Prime Cause Satisfaction | Green and Low Energy | Non-Green and Low Energy | High Energy | Total |
|---|---|---|---|---|
| Ease of use | 13 | 37 | 140 | 190 |
| Cleaning performance | 10 | 35 | 108 | 153 |
| Price | 4 | 28 | 92 | 124 |
| Accessories etc. | 6 | 20 | 83 | 109 |
| Other | 9 | 23 | 54 | 86 |
| Brand & reputation | 3 | 11 | 58 | 72 |
| Product reliability/durability | 0 | 10 | 34 | 44 |
| Noise or emissions | 2 | 7 | 25 | 34 |
| Product features | 1 | 8 | 18 | 27 |
| Design & looks | 2 | 2 | 21 | 25 |
| Environmental friendliness | 3 | 6 | 9 | 18 |
| Customer support | 0 | 4 | 2 | 6 |
| Total | 53 | 191 | 644 | 888 |
Table A2.
Descriptives: NPS Scores in spread per customer group.
| Green and Low Energy (N = 53) | Non-Green and Low Energy (N = 191) | High Energy (N = 644) | Total (N = 888) | Total % | |
|---|---|---|---|---|---|
| 0 | 2% | 1% | 1% | 8 | 1% |
| 1 | 2% | 1% | 0% | 2 | 0% |
| 2 | 0% | 2% | 0% | 3 | 0% |
| 3 | 0% | 2% | 0% | 5 | 1% |
| 4 | 6% | 3% | 0% | 12 | 1% |
| 5 | 2% | 6% | 2% | 26 | 3% |
| 6 | 13% | 6% | 3% | 40 | 5% |
| 7 | 21% | 8% | 14% | 118 | 13% |
| 8 | 26% | 33% | 29% | 266 | 30% |
| 9 | 9% | 21% | 28% | 224 | 25% |
| 10 | 19% | 18% | 22% | 184 | 21% |
| total | 100% | 100% | 100% | 888 | 100% |
Table A3.
Descriptives: One-way between-groups analysis of variance (N = 888).
| Input Power | N | Mean | SD | Std. Error | 95% Confidence Interval for Mean | Min | Max | ||
|---|---|---|---|---|---|---|---|---|---|
| Lower Bound | Upper Bound | ||||||||
| NPS Score | <1600 Watt | 240 | 7.71 | 2.03 | 0.13 | 7.45 | 7.97 | 0 | 10 |
| >1600 Watt | 648 | 8.33 | 1.49 | 0.06 | 8.22 | 8.45 | 0 | 10 | |
| Total | 888 | 8.17 | 1.67 | 0.06 | 8.06 | 8.28 | 0 | 10 | |
| Satisfaction (0 = NPS ≤ 5, 1 = NPS > 5) | <1600 Watt | 240 | 0.87 | 0.34 | 0.02 | 0.82 | 0.91 | 0 | 1 |
| >1600 Watt | 648 | 0.96 | 0.19 | 0.01 | 0.95 | 0.98 | 0 | 1 | |
| Total | 888 | 0.94 | 0.24 | 0.01 | 0.92 | 0.95 | 0 | 1 | |
| Accessoires | <1600 Watt | 240 | 0.11 | 0.31 | 0.02 | 0.07 | 0.15 | 0 | 1 |
| >1600 Watt | 648 | 0.13 | 0.33 | 0.01 | 0.1 | 0.15 | 0 | 1 | |
| Total | 888 | 0.12 | 0.33 | 0.01 | 0.1 | 0.14 | 0 | 1 | |
| Brand & Reputation | <1600 Watt | 240 | 0.06 | 0.24 | 0.02 | 0.03 | 0.09 | 0 | 1 |
| >1600 Watt | 648 | 0.09 | 0.29 | 0.01 | 0.07 | 0.11 | 0 | 1 | |
| Total | 888 | 0.08 | 0.27 | 0.01 | 0.06 | 0.1 | 0 | 1 | |
| Cleaning Performance | <1600 Watt | 240 | 0.19 | 0.39 | 0.03 | 0.14 | 0.24 | 0 | 1 |
| >1600 Watt | 648 | 0.17 | 0.37 | 0.02 | 0.14 | 0.2 | 0 | 1 | |
| Total | 888 | 0.17 | 0.38 | 0.01 | 0.15 | 0.2 | 0 | 1 | |
| Ease of Use | <1600 Watt | 240 | 0.2 | 0.40 | 0.03 | 0.15 | 0.25 | 0 | 1 |
| >1600 Watt | 648 | 0.22 | 0.41 | 0.02 | 0.19 | 0.25 | 0 | 1 | |
| Total | 888 | 0.21 | 0.41 | 0.01 | 0.19 | 0.24 | 0 | 1 | |
| Environmental friendliness | <1600 Watt | 240 | 0.03 | 0.18 | 0.01 | 0.01 | 0.06 | 0 | 1 |
| >1600 Watt | 648 | 0.02 | 0.12 | 0.01 | 0.01 | 0.02 | 0 | 1 | |
| Total | 888 | 0.02 | 0.14 | 0.01 | 0.01 | 0.03 | 0 | 1 | |
| Product Reliability/Durability | <1600 Watt | 240 | 0.04 | 0.2 | 0.01 | 0.02 | 0.07 | 0 | 1 |
| >1600 Watt | 648 | 0.05 | 0.22 | 0.01 | 0.04 | 0.07 | 0 | 1 | |
| Total | 888 | 0.05 | 0.22 | 0.01 | 0.04 | 0.06 | 0 | 1 | |
References
- Straughan, R.D.; Roberts, J.A. Environmental segmentation alternatives: A look at green consumer behavior in the new millennium. J. Consum. Mark. 1999, 16, 558–575. [Google Scholar] [CrossRef]
- Dangelico, R.M.; Vocalelli, D. “Green marketing”: An analysis of definitions, strategy steps, and tools through a systematic review of the literature. J. Clean. Prod. 2017, 165, 1263–1279. [Google Scholar] [CrossRef]
- Peattie, K.J.; Crane, A. Green marketing: Legend, myth, farce or prophesy? Qual. Mark. Res. 2005, 8, 357–370. [Google Scholar] [CrossRef] [Green Version]
- Vogtländer, J.G.; Mestre, A.; van der Helm, R.; Scheepens, A.; Wever, R. Eco-Efficient Value Creation, Sustainable Design and Business Strategies; VSSD: Delft, The Netherlands, 2013. [Google Scholar]
- Visser, M.; Gattol, V.; van der Helm, R. Communicating sustainable shoes to mainstream consumers: The impact of advertisement design on buying intention. Sustainability 2015, 7, 8420–8436. [Google Scholar] [CrossRef] [Green Version]
- Luchs, M.G.; Swan, K.S.; Creusen, M.E.H. Perspective: A review of marketing research on product design with directions for future research. J. Prod. Innov. Manag. 2016, 33, 320–341. [Google Scholar] [CrossRef]
- Visser, M.; Schoormans, J.; Vogtländer, J. Consumer buying behaviour of sustainable vacuum cleaners—Consequences for design and marketing. J. Clean. Prod. 2018. [Google Scholar] [CrossRef]
- DߣSouza, C.; Taghian, M.; Lamb, P.; Peretiatkos, R. Green products and corporate strategy: An empirical investigation. Soc. Bus. Rev. 2006, 1, 144–157. [Google Scholar] [CrossRef] [Green Version]
- Testa, F.; Pretner, G.; Iovino, R.; Bianchi, G.; Tessitore, S.; Iraldo, F. Drivers to green consumption: A systematic review. Environ. Dev. Sustain. 2021, 23, 4826–4880. [Google Scholar] [CrossRef]
- Rex, E.; Baumann, H. Beyond ecolabels: What green marketing can learn from conventional marketing. J. Clean. Prod. 2007, 15, 567–576. [Google Scholar] [CrossRef] [Green Version]
- Chen, Y.S.; Chang, C.H. Enhance green purchase intentions. Manag. Decis. 2012, 50, 502–520. [Google Scholar] [CrossRef]
- Dangelico, R.M.; Nonino, F.; Pompei, A. Which are the determinants of green purchase behaviour? A study of italian consumers. Bus. Strategy Environ. 2021, 30, 2600–2620. [Google Scholar] [CrossRef]
- Ottman, J.A.; Stafford, E.R.; Hartman, C.L. Avoiding green marketing myopia: Ways to improve consumer appeal for environmentally preferable products. Environment 2006, 48, 22–36. [Google Scholar] [CrossRef]
- Ottman, J.A. Green Marketing: Challenges & Opportunities for the New Marketing Age, 3rd ed.; NTC Business Books: Chicago, IL, USA, 1995. [Google Scholar]
- Liberman, N.; Trope, Y. The role of feasibility and desirability considerations in near and distant future decisions: A test of temporal construal theory. J. Personal. Soc. Psychol. 1998, 75. [Google Scholar] [CrossRef]
- Zeithaml, V.A.V.V.A. Three decades of customer value research: Paradigmatic roots and future research avenues. J. Serv. Res. 2020, 23, 409–432. [Google Scholar] [CrossRef]
- Reichheld, F.F. The one number you need to grow. Harv. Bus. Rev. 2003, 81, 46–54. [Google Scholar]
- Keiningham, T.L.; Aksoy, L.; Cooil, B.; Andreassen, T.W.; Williams, L. A holistic examination of net promoter. J. Database Mark. Cust. Strategy Manag. 2008, 15, 79–90. [Google Scholar] [CrossRef] [Green Version]
- Kristensen, K.; Eskildsen, J. Is the nps a trustworthy performance measure? TQM J. 2014, 26, 202–214. [Google Scholar] [CrossRef]
- Van Doorn, J.; Leeflang, P.S.H.; Tijs, M. Satisfaction as a predictor of future performance: A replication. Int. J. Res. Mark. 2013, 30, 314–318. [Google Scholar] [CrossRef]
- Allen, M.W.; Spialek, M.L. Young millennials, environmental orientation, food company sustainability, and green word-of-mouth recommendations. J. Food Prod. Mark. 2018, 24, 803–829. [Google Scholar] [CrossRef]
- Ismagilova, E.; Slade, E.; Rana, N.P.; Dwivedi, Y.K. The effect of characteristics of source credibility on consumer behaviour: A meta-analysis. J. Retail. Consum. Serv. 2020, 53, 101736. [Google Scholar] [CrossRef] [Green Version]
- Helfinstein, S.M.; Mumford, J.A.; Poldrack, R.A. If all your friends jumped off a bridge: The effect of others’ actions on engagement in and recommendation of risky behaviors. J. Exp. Psychol. Gen. 2015, 144, 12–17. [Google Scholar] [CrossRef]
- Mälkki, H.; Vanhanen, H.; Heiskanen, J. Product-Specific Eup Studies of Lots 15 to 18; Nordic Council of Ministers: Copenhagen, Denmark, 2010. [Google Scholar]
- European Union. Implementing directive 2009/125/ec of the european parliament and of the council with regard to ecodesign requirements for vacuum cleaners. In L 192/24; European Union Commision, Ed.; Official Journal of the European Union: Brussels, Belgium, 2013; Volume 666. [Google Scholar]
- Peterson, R.A.; Wilson, W.R. Measuring customer satisfaction: Fact and artifact. J. Acad. Mark. Sci. 1992, 20, 61. [Google Scholar] [CrossRef]
- Field, A. Discovering Statistics Using Ibm Spss Statistics, 5th ed.; Sage Publications Ltd.: London, UK, 2018. [Google Scholar]
- Hayes, A.F. Introduction to Mediation, Moderation, and Conditional Process Analysis: A Regression-Based Approach; The Guilford Press: New York, NY, USA, 2013. [Google Scholar]
- Luchs, M.G.; Naylor, R.W.; Irwin, J.R.; Raghunathan, R. The sustainability liability: Potential negative effects of ethicality on product preference. J. Mark. 2010, 74, 18–31. [Google Scholar] [CrossRef] [Green Version]
- Consumentenbond. Stofzuigers Vermogen en Energielabel. Available online: https://www.consumentenbond.nl/stofzuiger/vermogen-en-energielabel#no3 (accessed on 1 September 2021).
- Mugge, R.; Dahl, D.W.; Schoormans, J.P.L. “What you see, is what you get?” guidelines for influencing consumers’ perceptions of consumer durables through product appearance. J. Prod. Innov. Manag. 2017, 35, 309–329. [Google Scholar] [CrossRef]
- General Court of the European Union. Press release no 168/18: The general court annuls the regulation on the energy labelling of vacuum cleaners. In Judgment in Case T-544/13 RENV; Curia: Luxembourg, 2018. [Google Scholar]
- Stevels, A.L.N. Adventures in Ecodesign of Electronic Products 1993–2007; Delft University of Technology: Delft, The Netherlands, 2007. [Google Scholar]
- Rames, M.; Hansen, P.M.S.; Gydesen, A.; Huang, B.; Peled, M.; Maya-Drysdale, L.; Kemna, R.; van den Boorn, R.; Gydesen, A. Review Study on Vacuum Cleaners—Final Report. Available online: https://ekosuunnittelu.info/wp-content/uploads/2019/06/Vacuum-cleaner-review_final-report-.pdf (accessed on 9 October 2021).
Figure 1.
The 3 groups of respondents divided into one group of high-energy buyers and two groups of low-energy buyers.
Figure 1.
The 3 groups of respondents divided into one group of high-energy buyers and two groups of low-energy buyers.

Figure 2.
NPS scores (0 = very unlikely to 10 = very likely to recommend this product to family and friends) of 888 respondents.
Figure 2.
NPS scores (0 = very unlikely to 10 = very likely to recommend this product to family and friends) of 888 respondents.

Figure 3.
Percentage of the positive customers (NPS rating > 5, N = 832) per low/high customer groups reporting one of 12 main reasons for recommendations.
Figure 3.
Percentage of the positive customers (NPS rating > 5, N = 832) per low/high customer groups reporting one of 12 main reasons for recommendations.

Table 1.
Specification differences for promoting (NPS > 5) low- and high-energy consumers (N = 832).
Table 1.
Specification differences for promoting (NPS > 5) low- and high-energy consumers (N = 832).
| Low Energy <1600 W (N = 208) | High Energy >1600 W (N = 624) | Total (N = 832) | Sign. (2-Tailed) | ||||
|---|---|---|---|---|---|---|---|
| Mean | Standard Deviation | Mean | Standard Deviation | Mean | Standard Deviation | No Equal Variance Assumed | |
| Suction power (W) | 335.8 | 44.5 | 422.5 | 67.4 | 400.8 | 72.9 | p < 0.001 |
| Weight (kg) | 5.91 | 0.63 | 6.52 | 0.66 | 6.36 | 0.70 | p < 0.001 |
| Price (Eur) | 153.3 | 54.7 | 151.1 | 32.1 | 151.68 | 39.0 | p = 0.590 |
Publisher’s Note: MDPI stays neutral with regard to jurisdictional claims in published maps and institutional affiliations. |
© 2021 by the authors. Licensee MDPI, Basel, Switzerland. This article is an open access article distributed under the terms and conditions of the Creative Commons Attribution (CC BY) license (https://creativecommons.org/licenses/by/4.0/).
Share and Cite
MDPI and ACS Style
Visser, M.; Stevels, A.; Schoormans, J. Comparing the Recommendations of Buyers of Energy-Efficient and Inefficient Vacuum Cleaners. Sustainability 2021, 13, 12988. https://0-doi-org.brum.beds.ac.uk/10.3390/su132312988
AMA Style
Visser M, Stevels A, Schoormans J. Comparing the Recommendations of Buyers of Energy-Efficient and Inefficient Vacuum Cleaners. Sustainability. 2021; 13(23):12988. https://0-doi-org.brum.beds.ac.uk/10.3390/su132312988
Chicago/Turabian StyleVisser, Mirjam, Ab Stevels, and Jan Schoormans. 2021. "Comparing the Recommendations of Buyers of Energy-Efficient and Inefficient Vacuum Cleaners" Sustainability 13, no. 23: 12988. https://0-doi-org.brum.beds.ac.uk/10.3390/su132312988
Note that from the first issue of 2016, this journal uses article numbers instead of page numbers. See further details here.