
Multi-Objective Land Use Allocation Optimization in View of Overlapped Influences of Rail Transit Stations


1
School of Traffic and Transportation, Beijing Jiaotong University, No.3 Shangyuancun, Haidian District, Beijing 100044, China
2
School of Transportation Management & Engineering, People’s Public Security University of China, No.1 Muxidinanli, Xicheng District, Beijing 100038, China
*
Author to whom correspondence should be addressed.
Sustainability 2021, 13(23), 13219; https://0-doi-org.brum.beds.ac.uk/10.3390/su132313219
Submission received: 18 October 2021
/
Revised: 22 November 2021
/
Accepted: 26 November 2021
/
Published: 29 November 2021
(This article belongs to the Special Issue Mobility Sustainability: Ecological, Smart and Connected Transportation Systems)
Abstract
:Taking into consideration the overlapped influences of multiple rail transit stations upon land use characteristics, this study newly develops a multi-objective land use allocation optimization model to decide the land use type and intensity of every undeveloped land block of an urban area. The new model is solved by successively utilizing the non-dominated sorting genetic algorithm and the technique for order performance by similarity to ideal solution to obtain the least biased Pareto-optimal land development scheme. The study area is an urban region around two metro stations in Beijing of China. The influencing scopes of these two stations are overlapped in part, and many of the land blocks in the study area are not yet developed. It is shown that the newly developed land use allocation optimization model is able to rationally achieve multi-objectives in coordination to the most extents for the sustainable urban development in view of the integrated effect of multiple rail transit stations.
1. Introduction
One of major urban transport planning goals is to establish a much attractive and highly accessible public transport system that is able to meet requirements of travelers [1] for the realization of sustainable mobility in a large scale. Mass rail transits have played and will continue to play the key role in safe, efficient and environment-friendly operation of such a public transport system, especially for a big city. Travel preferences of people in the influencing scopes of rail transit stations are directly affected by land uses around the stations. From the transit-oriented development perspective, diversifying the land use types, strengthening the land development intensities, etc. contribute to reducing comprehensive connection costs of rail transit trips and increasing rail transit utilizations [2,3], which will certainly decrease car trips. At the same time, factors on other aspects including social equality promotion, life quality improvement, environmental protection, etc. cannot be ignored in the Land Use Allocation Design (LUAD) of an urban area for the establishment of its sustainable rail transit system.
Therefore, a LUAD problem is always transformed into a multi-objective optimization issue [4] solved by developing a mathematical programming model to decide the scheme about locations, sizes and intensities of various land use types in a certain region [5]. It is believed that within the distance scope of usually 1200.00 meters around a rail transit station [6,7,8], the land use characteristics of each land block influence the amount of rail transit trips to and from the station. If the influencing scopes of more than one rail transit stations are partially overlapped, a rail transit traveler sometimes has to choose one of the stations, taking into account not only the impedances such as walking distances to the stations but also the land use allocations around them [9,10]. People prefer to use a rail transit station surrounded by diverse types of land blocks which are approximately equal in scale [11,12] especially within its 500.00 meter-radius distance [13,14] regarded usually as the standard rail transit walking connection service distance [15]. However, these facts are seldom considered together in the allocation design of land uses around at least two rail transit stations whose influencing scopes are partly overlapped to obtain the optimal land development scheme for the most achievement of each of multi-objectives.
Having the integrated consideration of the effect of various elements based on these facts, this study newly develops a Multi-Objective Land Use Allocation Optimization (MOLUAO) model to have the LUAD of an urban area with its land blocks affected by multiple rail transit stations. Rail transit trip amount and connection cost, road travel time expense, land use compactness and conflict, and environmental impact are determined as the multi-objectives of the MOLUAO model by types and intensities of different land blocks for the optimal land development scheme from an overall perspective. Because it is impossible to improve the function value of any objective without weakening at least that of another one, a solution to a multi-objective optimization problem is in fact non-dominated [16]. Meanwhile, genetic algorithms are identified as effective in obtaining non-dominated solutions to multi-objective programming problems [17]. Therefore, in view of its favorable searching speed and reliable local and global searching abilities, the non-dominated sorting Genetic Algorithm (GA) proposed by Deb et al. [18] is referred to the design the GA utilized in this study to obtain the set of Pareto-optimal solutions to the MOLUAO model. Thereafter, according to the Technique for Order Performance by Similarity to Ideal Solution (TOPSIS) [19], the least biased Pareto-optimal solution is selected as the optimal land development scheme. The urban region around two metro stations named Shahe and Shahe University Park in Beijing is selected as the study area where many land blocks are undeveloped.
The rest of this paper is organized as follows. The existing studies on the multi-objective LUAD problem are reviewed in Section 2. Section 3 introduces the land use status of the study area. The MOLUAO model is established in Section 4, and its solution program is explained in Section 5. Section 6 optimizes the land development allocation of the study area by applying the MOLUAO model solved with the GA designed in this research and the TOPSIS. The conclusions of this study are offered in Section 7.
2. Literature Review
Focusing on achieving the multi-objectives, continuous studies have been made on the allocation optimizations of land uses from different perspectives. Taking a certain urban region in Changsha of China as an example, Yu et al. [20] develop a two-step interactive approach to adjust scales and intensities of various land use types around a rail transit station according to its passenger transport demand which is affected by the land uses within its service area. In order to directly forecast rail transit passenger flows at station-level, geographically weighted regression is applied in the research of Cardozo et al. [21] to evaluate the land use allocation effect. Paying close attention to the land use type diversification, Jun et al. [11] analyze the influence of the land use characteristics upon the metro trips in Seoul. In consideration of the trade-off among economic development, environmental and ecological benefit and social equity, Cao et al. [22] propose a heuristic method named as the boundary-based fast GA to solve a multi-objective land use allocation optimization model established according to a reference point method. Also based on a reference point method, a land use allocation optimization model with a spatial component is put forward by Stewart and Janssen [23] for the achievements of additive and spatial objectives in a geographical information system.
With system dynamics integrated into the particle swam optimization which incorporates the genetic operators, the land use allocation in discrete geographic space is rationally achieved in the work of Liu et al. [24] to reflect the complex behaviors of land use systems at different scales. Regarding land use pattern distribution as a sequence of the spatial competitions between different land use types, a loosely coupled model utilizing multi-stakeholder games is proposed by Liu et al. [25] to coordinate the land use types of the competition zones for globally optimal allocation of various land use types. In order to maximize economic, ecological and social benefits, Zhang et al. [26] integrate particle swarm optimization into a multi-agent system to develop a land use allocation optimization model by simulating the decision-making processes and human-environment adaptive interactions at different levels. Different from ordinarily applying a single algorithm to search for the optimal solution(s) to a LUAD problem, hybridizing Tabu search, GA, greedy randomized adaptive search problem and simulated annealing is recommended by Mohammadi et al. [27] to improve the problem-solving efficiency and quality in practice.
As the premise of the optimal land use allocation especially in a rural area, rational land partitioning is significant for the prevention of land fragmentation. Hakli and Uğuz [28] propose an automated land partitioning method that is capable of processing multi-criteria simultaneously and evaluating different solutions in a short time. Taking into account the spatially explicit effect of historical land use transition and policy interventions, Liu et al. [29] utilize both a spatial discrete particle swarm optimization and cellular automata-Markov simulation approach to optimize future land use pattern in the context of rural land use development. From a regional development perspective, four cellular automata models incorporating logistic regression, particle swarm optimization, generalized simulated annealing and GA, respectively, are developed in the work of Feng et al. [30] and applied in comparison to simulate the land use change in the Yangtze River Delta of China from 2005 to 2015. Considering stakeholder preferences on conflicting objectives, a new simulated annealing algorithm is suggested by Li and Ma [31] to solve a goal programming model for the determination of an agreeable land use scheme with ideal land use benefit and compactness.
In consideration of rail transit ridership, transport accessibility, environmental condition and land use characteristics including compactness and conflict degree, Ma et al. [32] develop a multi-objective programming model for the optimal station-level transit-oriented development planning. Gradient boosting decision trees are used by Ding et al. [33] to highlight the roles of mixed and compact land development, car ownership and quantity of rail transit stations in an urban area in determining rail transit travel demand. In accordance with the principle that activity location choices decide urban land use patterns, an agent-based model based on mixed utility function, discrete location choice modeling and land use transformation modeling is developed in the study of Li et al. [34] to explain the urban residential land use increase. In the viewpoint of regional environmental conservation assessment and planning, Mirghaed et al. [35] apply ecosystem services into the land use allocation decision process to improve the land use pattern regarding land use integrity and habitat fragmentation. Taking natural environment, population change and policy planning as indicators, Bayesian belief network is adopted in the research of Zeng et al. [36] to obtain the optimal land use scheme according to the efficiencies of different ecosystem services.
In the review study of Rahman and Szabó [37], it has been found that the most common three objectives used in urban land use allocation optimization are maximizations of compactness, compatibility and suitability. Moreover, there is no generalized method to measure the economic, environmental and social benefits from land use planning activities. Despite many valuable research findings, the existing studies considering the influences of rail transit stations upon the optimal land use schemes concentrate on the land use allocation around a single rail transit station. In these studies, the passenger flows around a rail transit station are mainly determined by the travel demands in the walking service area of the station.
3. Study Area
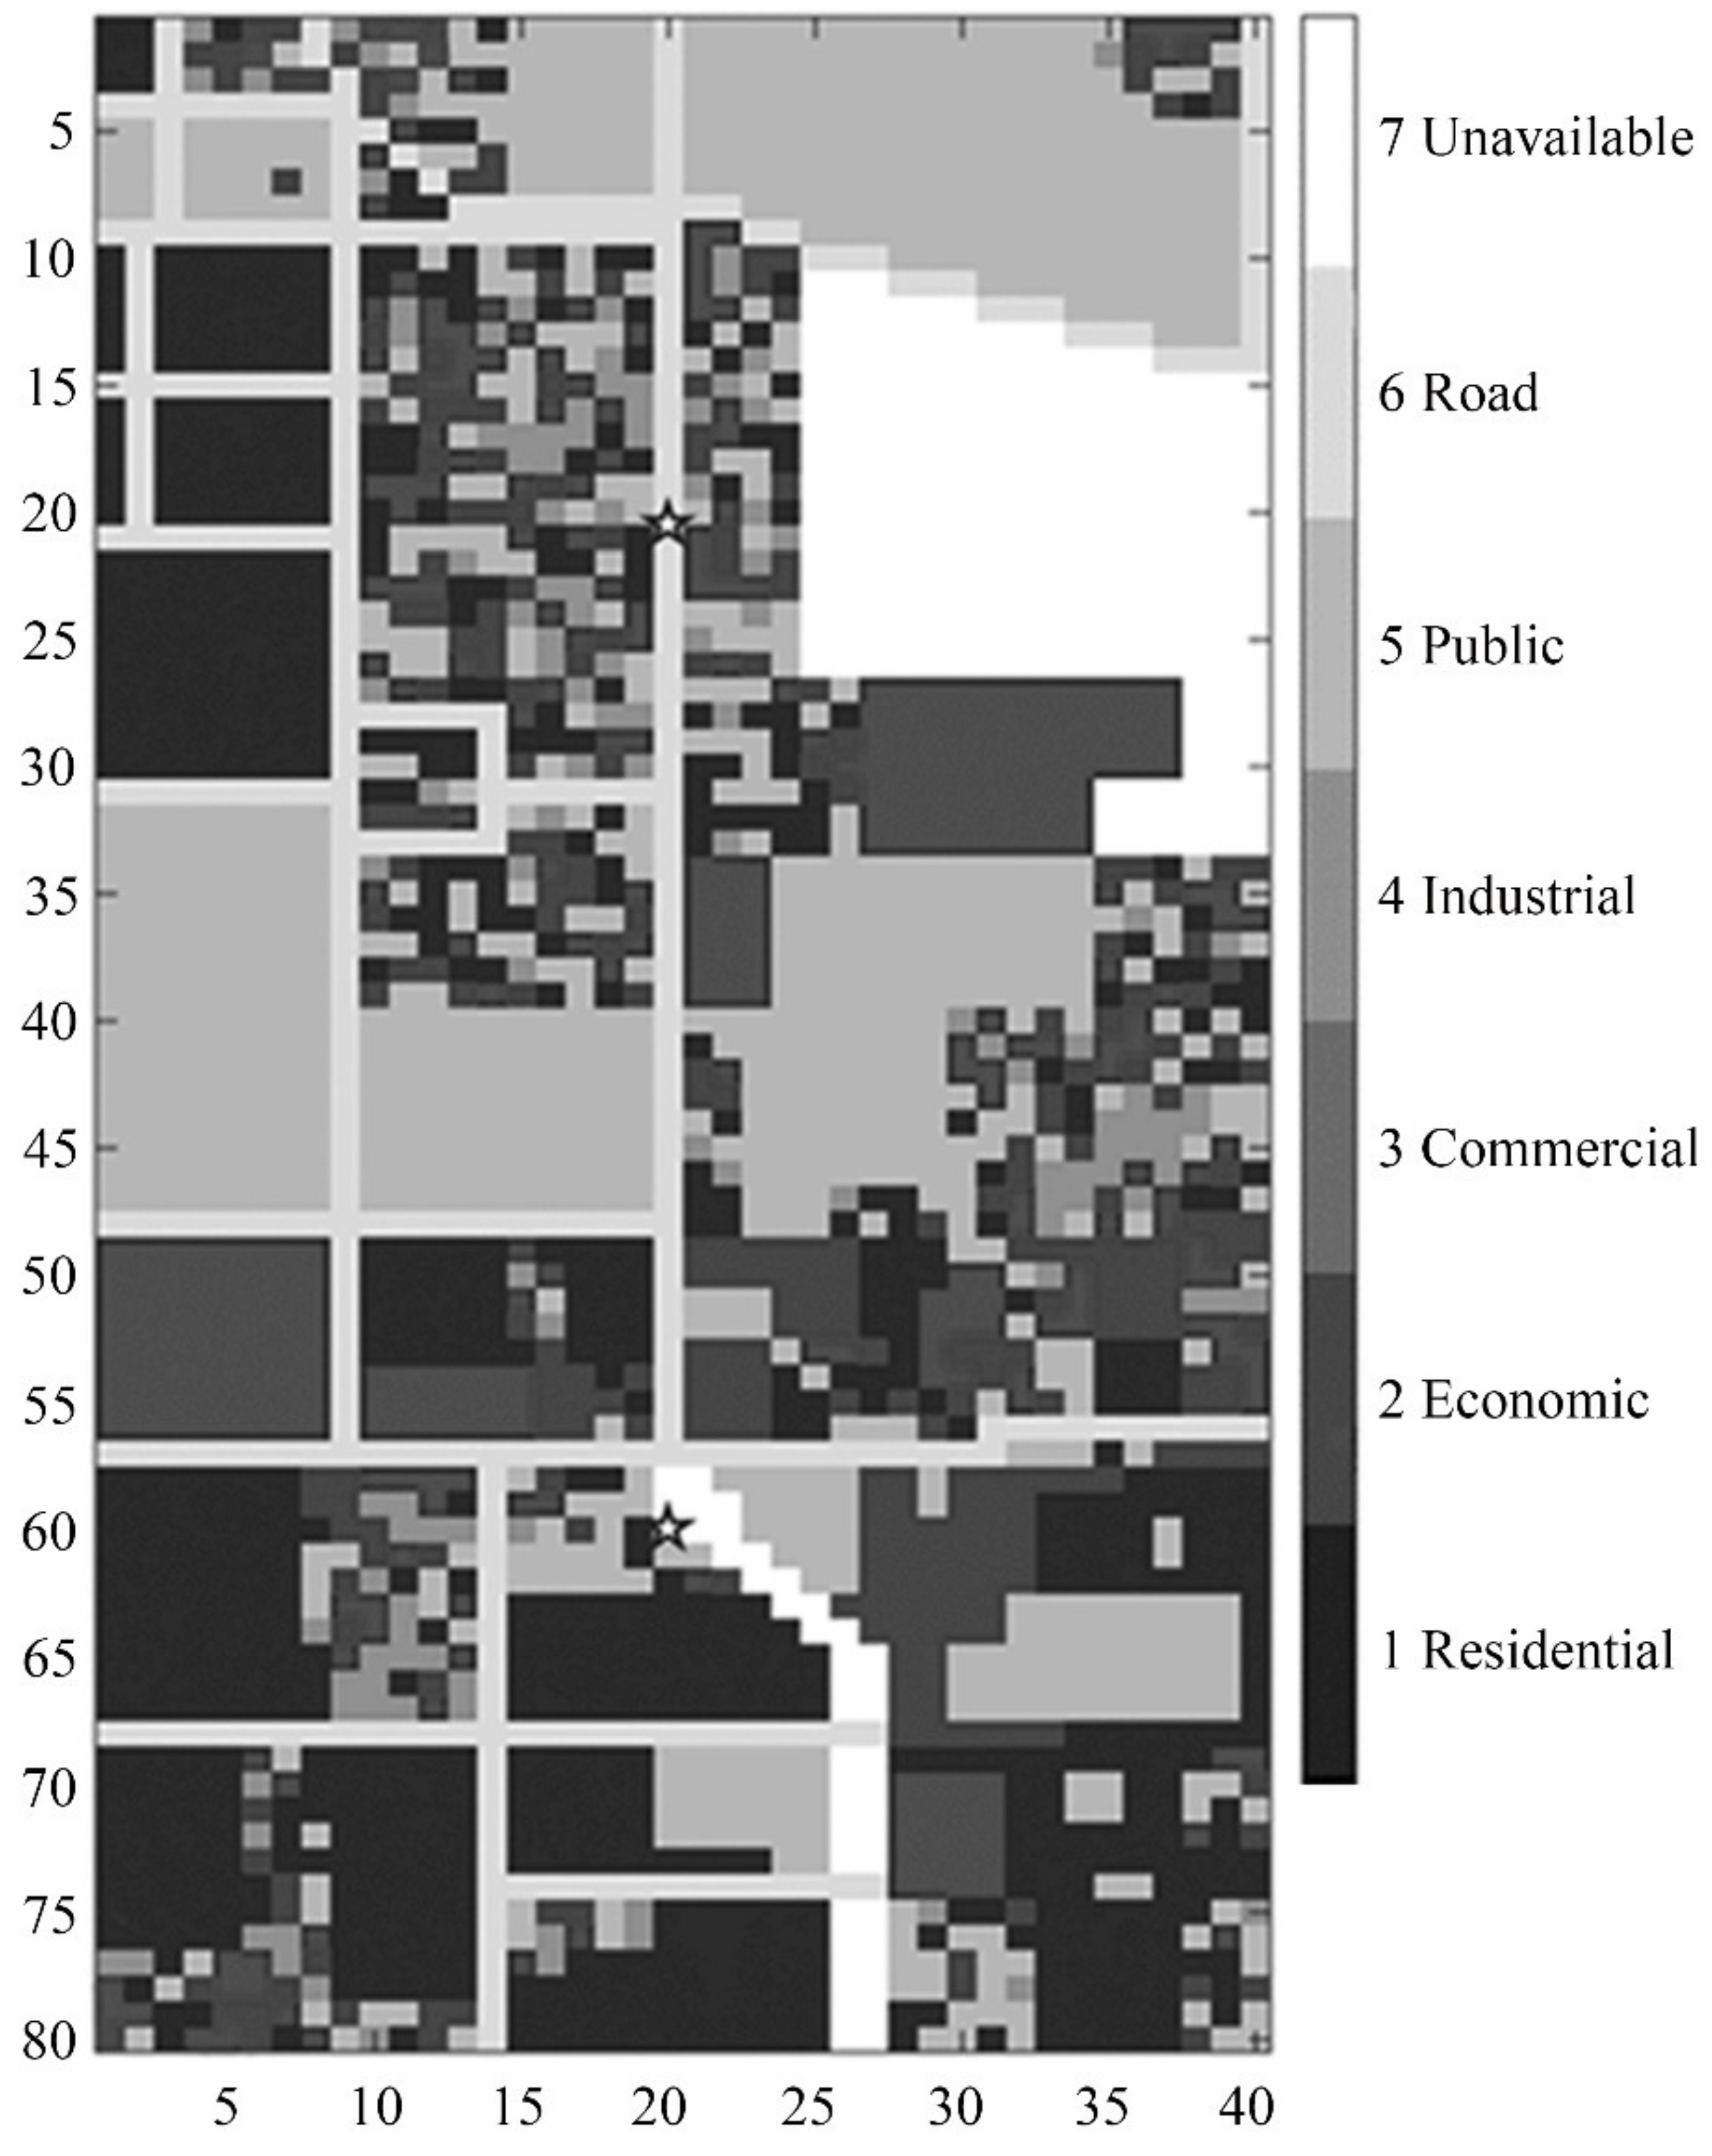
Represented by the stars in Figure 1, the two metro stations are located at the central part of the study area divided into 40 × 80 two-dimensional grid cells and each of these cells has the equal size of 50.00 × 50.00 square meters. Every land cell in the study area is within the influencing scope of at least one of the two metro stations. As shown in Figure 1, all the 3200 land cells of the study area are classified with the numbers from 0 to 7 into the undeveloped, residential, economic, commercial, industrial, public, road and unavailable types in correspondence. The public land uses refer to schools, parks, medical facilities, etc. The economic land use type means that the land cells are utilized by economic enterprises. The commercial land uses include department stores, hotels, restaurants, retails and so on. None of the 296 land cells for nature conservation or agriculture at this time is available for the land development of the study area.
The land use intensity of a land cell in the study area is denoted by its floor area ratio, as illustrated in Figure 2. The land use intensities of the 296 unavailable land cells are too low and all treated as 0.00 in this work. The land use intensities of the 926 undeveloped land cells are 0.00 indeed now. These undeveloped land cells require the optimal land development scheme about their types and intensities in consideration of their spatial correlations to achieve multi-objectives to the most extents for the sustainable development of the study area. Moreover, the influences of the land cells utilized at present in the study area by the residential, economic, commercial, industrial, public and road infrastructures upon the undeveloped land cells in neighborhood also need to be considered in searching for the optimal land development scheme.
4. Modeling Work
In order to reduce rail transit connection costs, increase rail transit utilizations, improve traffic accessibility, promote social equality, ameliorate life quality and protect environment, six interrelated objectives are established in Equations (1), (2), (6) and (7)–(9), respectively, for the development of the MOLUAO model. As shown in Equation (1), the first objective is to maximize the metro trips (i.e., ) owing to developing the undeveloped land cells into those with various types and different intensities in the study area, according to the research of Ma et al. [32] and Cervero and Kockelman [3]. As the second objective, the minimization of the total comprehensive connection cost of all the metro trips resulting from the developments of all the undeveloped land cells (i.e., ) is shown in Equation (2), together with Equations (3)–(5) which provide further detailed descriptions for the variables involved. The normalized Euclidean distance explained in Equation (3) is utilized to evaluate the impedance between an undeveloped land cell and a metro station. Based on the work of Yin et al. [38], Equations (4) and (5) improve the traditional land use entropy model to reflect the ratios of the undeveloped land cells with different land development types and their spatial correlations. In this way, the mixture degree of various land development types around a metro station is indicated more rationally.
where is the set of all the undeveloped land cells in the study area, denotes the set of all the land development types, and represent metro trips generated and attracted per unit intensity of the land development type in the peak commuting hours [39], represents the intensity of the land development type in the land cell after its development, is 0–1 variable representing if the land cell is developed into the land development type (i.e., by taking the value of 1) or not (i.e., by taking the value of 0), and denotes size of the land cell .
where represents the set of the metro stations in the study area, and are row and column coordinates of the land cell , and denote row and column coordinates of the metro station , is the set of all the undeveloped land cells within a certain distance (which is 500.00 meters in this study) around the metro station , stands for 0–1 variable representing if the land cell is developed into the land development type (i.e., by taking the value of 1) or not (i.e., by taking the value of 0), represents the amount of all the land cells in , is the amount of all the types in , and denotes 0–1 variable denoting if the metro trips from and to the land cell after its development utilize the metro station (i.e., by taking the value of 1) or not (i.e., by taking the value of 0).
The road trips generated from and attracted to every land cell in the study area are allocated to each road link through the free assignment technique based on the first principle of Wardrop [40]. The third objective is to minimize the total time cost of all the road trips (i.e., ), as given in Equation (6), according to the travel time function developed by U.S. Bureau of Public Roads [41]. In other words, it is the maximization of the traffic accessibility of the study area [42]. In order to maximize the land use allocation compactness (i.e., ) which affects sustainable urban development and social equality promotion [22] and is evaluated by the number of adjacent cells with the same land use type [43], Equation (7) is put forward to clarify the fourth objective for all the land cells in the study area. Because different conflicts between adjacent land cells with various land use types do unequal harms to life quality of people [32], the fifth objective is to minimize the total degree of all the conflicts between the adjacent land cells in the study area (i.e., ), as shown in Equation (8). The degrees of the conflicts between every two land use/development types are shown in Table 1 with reference to the work of Ma et al. [32].
Relatively bigger numerical values provided in Table 1 represent more serious land use conflicts. The fourth and fifth objectives take into consideration the spatial correlations between the land use/development types of all the land cells in the multi-objective allocation optimization. In addition, it has been widely identified that a sustainable land development allocation strategy must consider environmental protection, so the sixth objective interpreted in Equation (9) focuses on reducing the negative environmental impact caused by the land cell developments (i.e., ).
where and are traffic flows generated from and attracted to the land cell in the peak commuting hours on the road link , is time cost of free flow on the road link , represents traffic capacity of the road link , and and are parameters determined according to the type of a road link.
where denotes the amount of the land cells which are adjacent to the land cell and have the land use/development type .
where represents the set of all the land cells adjacent to the land cell , is 0–1 variable denoting if the land use/development type of the land cell is (i.e., by taking the value of 1) or not (i.e., by taking the value of 0), and denotes degree of the conflict between the land use/development type and the land use/development type .
where is the pollution treatment cost per unit intensity of the land development type .
Besides the afore-explained six objective functions, the MOLUAO model also includes a number of constraints, as shown in the equations from (10) to (19). It is shown in Equation (10) that each undeveloped land cell in the study area will be developed into one of the land development types in . At the same time, the metro trips resulting from each of the land cells choose one of the metro stations in the study area, as clarified in Equation (11). Moreover, all the land development types in are found within a certain distance (i.e., 500.00 meters in this research) around every metro station in the study area, as indicated in Equation (12). Furthermore, Equation (13) decides the upper and lower limits to the metro trips utilizing a station. It is shown in Equation (14) that the development intensity of each undeveloped land cell in the study area should have an upper limit for any of the land development types in . The development scales of commercial and residential land blocks have their own upper limits proportional to the land development scale of the whole study area, as explained in Equations (15) and (16), respectively. In addition, based on the upper and lower limits to the economic land development floor area ratio, the constraints on the economic land development scale of the study area are interpreted in Equation (17). For the conservations of the traffic flows, Equations (18) and (19) are indispensable.
where and are lower and upper limits of the trips utilizing each metro station in the study area, is intensity upper limit of the land development type for every undeveloped land cell, , and represent the intensity of the commercial, residential and economic land developments in the land cell after its development, , and denote 0–1 variables representing if the land cell has the commercial, residential or economic land development (i.e., by taking the value of 1) or not (i.e., by taking the value of 0), and are proportion upper limits of the commercial and residential land development scales of the study area, and stand for upper and lower limits of the floor area ratio of the economic land development in the study area, and and are road trips generated and attracted per unit intensity of the land use/development type in the peak commuting hours [39].
5. Solution Program
The solutions to a multi-objective optimization problem are non-dominated [16] and a GA is able to effectively find them [17]. In consideration of its superior searching speed and ability, a non-dominated sorting GA is designed in the first place to solve the MOLUAO model, with reference to the work of Deb et al. [18]. An individual in the designed GA represents a land development allocation solution and has three chromosomes which are land development type, land development intensity and metro trip station choice. The genes of each chromosome are the corresponding details of all the undeveloped land cells in the study area after their developments. The process of the designed GA is illustrated in Figure 3 and explained step by step below for obtaining the Pareto-optimal solution set.
- Step 1:
- Decide the maximum iteration number and set the iteration number = 0. Generate individuals randomly until the individuals satisfying all the afore-explained constraints of the MOLUAO model reach an adequate quantity (i.e., ). Initialize the population (i.e., ) with all the generated individuals. Have all the genes in a chromosome of an individual encoded as their gene types denoted by the integers from 1 to the number of all the gene types of the category this chromosome belongs to.
- Step 2:
- Have = + 1. Abandon every invalid individual unable to satisfy all the constraints of the MOLUAO model. Calculate the values of all the objectives interpreted in the modeling work of this study for each individual in after converting all the maximum objectives into the minimum objectives by employing a negative sign.
- Step 3:
- Randomly choose an individual (i.e., ). Compare all the objective values of with those of another randomly chosen individual (i.e., ). If each objective value of is no bigger than the corresponding one of and at least one objective value of is smaller than that of , is classified as Rank 1. If none of the other individuals is classified as Rank 1 after comparing with every other individual, change and make the same comparisons until Rank 1 has all its individual(s). Repeat these actions to select the individual(s) for each next rank from the unclassified individuals until only one individual is left finally, and the left individual is classified as the last rank. The non-dominated sorting of all the individuals in is made in this way.
- Step 4:
- If more than two individuals are classified as the same rank, based on the ascending sequence of their values for each objective, their crowding distances are computed by Equation (20). If an individual classified as a rank with at least two individuals, takes the first or last order in any of the ascending sequences of the values of all the individuals classified as this rank for different objectives, its crowding distance is set to infinity. If all the individuals classified as a rank have their maximum and minimum objective values equal to each other for any one of the objectives, each of the individuals has an infinite crowding distance. The crowding distances of the individuals in are determined by these rules.where denotes crowding distance of the individual classified as rank , represents value of the individual immediately after the individual in the ascending order of the values of all the individuals classified as rank for the objective , is value of the individual immediately before the individual in the ascending order of the values of all the individuals classified as rank for the objective , stands for maximum value of every individual classified as rank for the objective , and is minimum value of all the individuals classified as rank for the objective .
- Step 5:
- If the size of is bigger than , remove the individual classified as the last rank from , mark individuals in at random, and delete the unmarked ones. All the individuals in are paired up randomly. The individual left over after the others are paired up is selected directly. The ranks of two individuals in each pair are compared. If their ranks are different, select the individual which has the relatively small rank. If their ranks are the same, compare their crowding distances and select the one with the bigger crowding distance. If their crowding distances are also the same, select one of them at random. If the maximum iteration number is reached, output as the Pareto-optimal solution set. Otherwise, go to Step 6.
- Step 6:
- Owing to its superiority in searching sparse high-dimensional solutions to multi-objective optimization problems [44], simulated binary crossover is carried out. The individuals selected in Step 5 are paired up randomly. The unpaired individual keeps unchanged. The code changes caused by the crossover operation of two individuals in a pair (i.e., and ) at a gene site of their two offspring individuals (i.e., and ) are explained in Equations (21) and (22).where and represent codes at the gene site of and , is the rounded value of , and are codes at the gene site of and , denotes random variable, and is non-negative parameter (decided as 20.00 in this study).
- Step 7:
- Because of its relatively better performance in a real-coded GA [45], polynomial mutation is executed here. Every individual selected in Step 5 and generated in Step 6 is mutated by changing the code of its every gene, according to Equations (23) and (24). Add all the new individuals obtained in last and this step into and go back to Step 2.where is code at the gene site after the mutation, represents code at the gene site before the mutation, denotes gene type amount of the category of the chromosome covering the gene site , is random variable, and represents non-negative parameter (set as 20.00 in this research).
Equation (25) explains the Euclidean distance from the solution to every minimum value of all the objectives of a multi-objective optimization problem after converting its maximum objectives into the corresponding minimum objectives. On the basis of the TOPSIS, the Pareto-optimal solution with the minimum Euclidean distance is selected in the Pareto-optimal solution set obtained by applying the proposed GA as the final solution to the MOLUAO model.
where is Euclidean distance from the solution to each minimum objective value, and stands for the value of the solution for the objective.
Figure 3.
Flowchart of the GA designed in this work.

6. Results and Discussion
The MOLUAO model solved by successively applying the designed GA and the TOPSIS is used to get the optimal land use scheme which decides the development types and intensities of all the undeveloped land cells in the study area for the most achievement of every afore-established objective in coordination. Each of the undeveloped land cell is utilized by the residential, economic, commercial, industrial, public or road infrastructure. Solid wastes and sewage are considered as the main factors of the impact on the environment in the land use allocation optimization of all the undeveloped land cells. The Pareto-optimal solution set consisting of 80 solutions is obtained after 2000 iterative computations of the GA designed in this research. As shown in Table 2, in comparison to the other solutions in the Pareto-optimal solution set, has the minimum and is able to coordinately achieve all the six interrelated objectives of the MOLUAO model to the most extents. As a result, is selected as the optimal land development scheme of the study area in this work. Obviously different from those shown in Figure 1 and Figure 2, the land use type and intensity allocations of are illustrated in Figure 4 and Figure 5, respectively.
Of course, the land use planners are also able to make different choices in the entire set of the Pareto-optimal solutions in accordance with their specific land development planning focuses. For example, it is indicated in Table 2 that, for the most achievement of a certain objective, , , , , and focus on the optimums of , , , , and , respectively. In order to increase the rail transit utilizations to the greatest extent in the study area, is the most suitable choice. At this time, increases to some extent, as shown in Table 2. In other words, for the sake of stressing the achievement of , has to ignore achieving the other objectives in a certain degree. If the emphasis of the land use allocation optimization is put on minimizing the total connection cost of all the metro trips utilizing the two stations in the study area, is selected from the Pareto-optimal solution set. Supposing the land development scheme is heavily weighted in favor of improving the road traffic accessibility, is the most effective way which juggles the other objectives at the same time. For the purpose of improving the land use allocation compactness to the utmost, provides the most practicable avenue. If the land development in the study area concentrates on reducing all the conflicts between the adjacent land cells, tells the answer to the LUAD problem. By contrast, the most rational land development scheme focusing primarily on the environment protection is explained by .
7. Conclusions
In consideration of overlapped influences of multiple rail transit stations upon characteristics of land uses around them, the multi-objective land use allocation optimization is made with the MOLUAO model developed in this study for the sustainable development of an urban area from an integrated viewpoint. The designed GA and the TOPSIS are successively utilized to find the least biased Pareto-optimal solution to the MOLUAO model to provide the optimal land development scheme determining the land use type and intensity of each undeveloped land block. The urban region in which two metro stations have their partly overlapped influencing scopes and many of the land blocks are undeveloped is selected in Beijing as the study area of this work. It is proved that the MOLUAO model solved with the GA designed in this research, and the TOPSIS is able to make the rational multi-objective LUAD to obtain the optimal land development scheme in view of the overlapped effect of multiple rail transit stations for the sustainable urban development. Furthermore, if the study area is an entire city, the effect of the urban rail transit network configuration on the optimal multi-objective land development of the city can be interpreted by utilizing the MOLUAO model, the designed GA and the TOPSIS, according to the locations of different rail transit stations with the overlapped influences.
In future research, the impacts of more factors such as economic activity, weather condition, travel time period in a day, etc. on the LUAD ought to be considered in the modeling work to validate the research findings in more detail. Moreover, the correlations between characteristics of land uses, choices of travel modes, influences of rail transit stations, etc. also need to be further analyzed in the multi-objective land use allocation optimization study. Finally, it would be worthwhile to explore some hybrid algorithms for the improvements of both computation efficiency and solution quality of the multi-objective optimization.
Author Contributions
Conceptualization, X.F.; methodology, X.F. and Z.R.; software, Z.T.; validation, X.F., X.N. and Z.T.; formal analysis, X.F. and Z.R.; investigation, Z.R. and Z.T.; resources, Z.T.; data curation, Z.R.; writing—original draft preparation, X.F.; writing—review and editing, X.F.; funding acquisition, X.N. All authors have read and agreed to the published version of the manuscript.
Funding
This research was funded by Scientific Research Project of Ministry of Public Security of P.R. China, grant number 2020LLYJGADX020.
Institutional Review Board Statement
Not applicable.
Informed Consent Statement
Not applicable.
Data Availability Statement
Data utilized in this study are obtained through the field survey conducted by the authors and please contact the corresponding author if the data are needed.
Conflicts of Interest
The authors declare no conflict of interest. The funder had no role in the design of the study.
References
- Zhang, X.; Zhang, Q.; Sun, T.; Zou, Y.; Chen, H. Evaluation of urban public transport priority performance based on the improved TOPSIS method: A case study of Wuhan. Sustain. Cities Soc. 2018, 43, 357–365. [Google Scholar] [CrossRef]
- Curtis, C. Planning for sustainable accessibility: The implementation challenge. Transp. Policy 2008, 15, 104–112. [Google Scholar] [CrossRef]
- Cervero, R.; Kockelman, K. Travel demand and the 3Ds: Intensity, diversity, and design. Transp. Res. D Transp. Environ. 1997, 2, 199–219. [Google Scholar] [CrossRef]
- Tong, D.; Murray, A. Spatial optimization in geography. Ann. Am. Assoc. Geogr. 2012, 102, 1290–1309. [Google Scholar] [CrossRef]
- Stewart, T.; Janssen, R.; Herwijnen, M. A genetic algorithm approach to multiobjective land use planning. Comput. Oper. Res. 2004, 31, 2293–2313. [Google Scholar] [CrossRef]
- Wang, Y.; de Almeida Correia, G.H.; de Romph, E.; Timmermans, H.J.P. Using metro smart card data to model location choice of after-work activities: An application to Shanghai. J. Transp. Geogr. 2017, 63, 40–47. [Google Scholar] [CrossRef] [Green Version]
- Gutiérrez, J.; Cardozo, O.D.; García-Palomares, J.C. Transit ridership forecasting at station level: An approach based on distance-decay weighted regression. J. Transp. Geogr. 2011, 19, 1081–1092. [Google Scholar] [CrossRef]
- Sohn, K.; Shim, H. Factors generating boardings at metro stations in the Seoul metropolitan area. Cities 2010, 27, 358–368. [Google Scholar] [CrossRef]
- Iseki, H.; Liu, C.; Knaap, G. The determinants of travel demand between rail stations: A direct transit demand model using multilevel analysis for the Washington D.C. Metrorail system. Transp. Res. A Policy Pract. 2018, 116, 635–649. [Google Scholar] [CrossRef]
- Ding, C.; Wang, D.; Ma, X.; Li, H. Predicting short-term metro ridership and prioritizing its influential factors using gradient boosting decision trees. Sustainability 2016, 8, 1100. [Google Scholar] [CrossRef] [Green Version]
- Jun, M.J.; Choi, K.; Jeong, J.E.; Kwon, K.H.; Kim, H.J. Land use characteristics of subway catchment areas and their influence on subway ridership in Seoul. J. Transp. Geogr. 2015, 48, 30–40. [Google Scholar] [CrossRef]
- Chakraborty, A.; Sabyasachee, M. Land use and transit ridership connections: Implications for state-level planning agencies. Land Use Policy 2013, 30, 458–469. [Google Scholar] [CrossRef]
- Pan, H.; Li, J.; Shen, Q.; Shi, C. What determines rail transit passenger volume? Implications for transit oriented development planning. Transp. Res. D Transp. Environ. 2017, 57, 52–63. [Google Scholar] [CrossRef]
- Kuby, M.; Barranda, A.; Upchurch, C. Factors influencing light-rail station boardings in the United States. Transp. Res. A Policy Pract. 2004, 38, 223–247. [Google Scholar] [CrossRef]
- Lee, S.; Yi, C.; Hong, S.P. Urban structural hierarchy and the relationship between the ridership of the Seoul Metropolitan Subway and the land-use pattern of the station areas. Cities 2013, 35, 69–77. [Google Scholar] [CrossRef]
- Feng, C.; Lin, J. Using a genetic algorithm to generate alternative sketch maps for urban planning. Comput. Environ. Urban Syst. 1999, 23, 91–108. [Google Scholar] [CrossRef]
- Li, Y.; Guo, H.; Li, H.; Xu, G.; Wang, Z.; Kong, C. Transit-oriented land planning model considering sustainability of mass rail transit. J. Urban Plan. Dev. 2010, 136, 243–248. [Google Scholar] [CrossRef]
- Deb, K.; Pratap, A.; Agarwal, S.; Meyarivan, T. A fast and elitist multiobjective genetic algorithm: NSGA-II. IEEE Trans. Evol. Comput. 2002, 6, 182–197. [Google Scholar] [CrossRef] [Green Version]
- Wang, S.; Zhao, D.; Yuan, J.; Li, H.; Gao, Y. Application of NSGA-II algorithm for fault diagnosis in power system. Electr. Power Syst. Res. 2019, 175, 105893. [Google Scholar] [CrossRef]
- Yu, X.; Xie, H.; Tang, Z.; Yan, K. Interactive planning and design of land use and transportation in rail transit station area. J. Tongji Univ. 2011, 39, 370–375. (In Chinese) [Google Scholar]
- Cardozo, O.D.; García-Palomares, J.C.; Gutiérrez, J. Application of geographically weighted regression to the direct forecasting of transit ridership at station-level. Appl. Geogr. 2012, 34, 548–558. [Google Scholar] [CrossRef]
- Cao, K.; Huang, B.; Wang, S.; Lin, H. Sustainable land use optimization using boundary-based fast genetic algorithm. Comput. Environ. Urban Syst. 2012, 36, 257–269. [Google Scholar] [CrossRef]
- Stewart, T.J.; Janssen, R. A multiobjective GIS-based land use planning algorithm. Comput. Environ. Urban Syst. 2014, 46, 25–34. [Google Scholar] [CrossRef]
- Liu, X.; Ou, J.; Li, X.; Ai, B. Combining system dynamics and hybrid particle swarm optimization for land use allocation. Ecol. Model. 2013, 257, 11–24. [Google Scholar] [CrossRef]
- Liu, Y.; Tang, W.; He, J.; Liu, Y.; Ai, T.; Liu, D. A land-use spatial optimization model based on genetic optimization and game theory. Comput. Environ. Urban Syst. 2015, 49, 1–14. [Google Scholar] [CrossRef]
- Zhang, H.; Zeng, Y.; Jin, X.; Shu, B.; Zhou, Y.; Yang, X. Simulating multi-objective land use optimization allocation using Multi-agent system—A case study in Changsha, China. Ecol. Model. 2016, 320, 334–347. [Google Scholar] [CrossRef]
- Mohammadi, M.; Nastaran, M.; Sahebgharani, A. Development, application, and comparison of hybrid meta-heuristics for urban land-use allocation optimization: Tabu search, genetic, GRASP, and simulated annealing algorithms. Comput. Environ. Urban Syst. 2016, 60, 23–36. [Google Scholar] [CrossRef]
- Hakli, H.; Uğuz, H. A novel approach for automated land partitioning using genetic algorithm. Expert Syst. Appl. 2017, 82, 10–18. [Google Scholar] [CrossRef]
- Liu, D.; Tang, W.; Liu, Y.; Zhao, X.; He, J. Optimal rural land use allocation in central China: Linking the effect of spatiotemporal patterns and policy interventions. Appl. Geogr. 2017, 86, 165–182. [Google Scholar] [CrossRef]
- Feng, Y.; Liu, Y.; Tong, X. Comparison of metaheuristic cellular automata models: A case study of dynamic land use simulation in the Yangtze River Delta. Comput. Environ. Urban Syst. 2018, 70, 138–150. [Google Scholar] [CrossRef]
- Li, X.; Ma, X. An improved simulated annealing algorithm for interactive multi-objective land resource spatial allocation. Ecol. Complex. 2018, 36, 184–195. [Google Scholar] [CrossRef]
- Ma, X.; Chen, X.; Li, X.; Ding, C.; Wang, Y. Sustainable station-level planning: An integrated transport and land use design model for transit-oriented development. J. Clean. Prod. 2018, 170, 1052–1063. [Google Scholar] [CrossRef]
- Ding, C.; Cao, X.; Liu, C. How does the station-area built environment influence Metrorail ridership? Using gradient boosting decision trees to identify non-linear thresholds. J. Transp. Geogr. 2019, 77, 70–78. [Google Scholar] [CrossRef]
- Li, F.; Xie, Z.; Clarke, K.C.; Li, M.; Chen, H.; Liang, J.; Chen, Z. An agent-based procedure with an embedded agent learning model for residential land growth simulation: The case study of Nanjing, China. Cities 2019, 88, 155–165. [Google Scholar] [CrossRef] [Green Version]
- Mirghaed, F.A.; Mohammadzadeh, M.; Salmanmahiny, A.; Mirkarimi, S.H. Decision scenarios using ecosystem services for land allocation optimization across Gharehsoo watershed in northern Iran. Ecol. Indic. 2020, 117, 106645. [Google Scholar] [CrossRef]
- Zeng, L.; Li, J.; Zhou, Z.; Yu, Y. Optimizing land use patterns for the grain for Green Project based on the efficiency of ecosystem services under different objectives. Ecol. Indic. 2020, 114, 106347. [Google Scholar] [CrossRef]
- Rahman, M.M.; Szabó, G. Multi-objective urban land use optimization using spatial data: A systematic review. Sustain. Cities Soc. 2021, 74, 103214. [Google Scholar] [CrossRef]
- Yin, C.; Shao, C.; Wang, X.; Xiong, Z.; Cui, W. Influence of land use mix on non-work travel behavior based on modified entropy index. J. Beijing Jiaotong Univ. 2018, 42, 92–97. [Google Scholar]
- Institute of Transportation Engineers. Trip Generation Manual, 10th ed.; Institute of Transportation Engineers: Washington, DC, USA, 2017. [Google Scholar]
- Papacostas, C.S.; Prevedouros, P.D. Transportation Engineering and Planning, 2nd ed.; Prentice Hall: Englewood Cliffs, NJ, USA, 1993. [Google Scholar]
- Transportation Research Board Business Office. Highway Capacity Manual 2008; National Research Council: Washington, DC, USA, 2009.
- Lin, J.; Li, C. A grey programming model for regional transit-oriented development planning. Pap. Reg. Sci. 2008, 87, 119–138. [Google Scholar] [CrossRef]
- Gabriel, S.; Faria, J.; Moglen, G. A multi-objective optimization approach to smart growth in land development. Socioecon. Plan. Sci. 2006, 40, 212–248. [Google Scholar] [CrossRef] [Green Version]
- Deb, K.; Agrawal, R.B. Simulated binary crossover for continuous search space. Complex Syst. 1995, 9, 115–148. [Google Scholar]
- Zeng, G.; Chena, J.; Li, L.; Chen, M.; Wu, L.; Dai, Y.; Zheng, C. An improved multi-objective population-based extremal optimization algorithm with polynomial mutation. Inf. Sci. 2016, 330, 49–73. [Google Scholar] [CrossRef]
Figure 1.
Current allocation of different land use types.

Figure 2.
Current allocation of different land use intensities.

Figure 4.
Land use type of every land cell in the optimal scheme.

Figure 5.
Land use intensity of each land cell in the optimal scheme.


Table 1.
Degrees of conflicts between various land use/development types.
| Land Use Types | Residential | Economic | Commercial | Industrial | Public | Road |
|---|---|---|---|---|---|---|
| Residential | 0.00 | 5.00 | 4.00 | 8.00 | 0.00 | 2.50 |
| Economic | 5.00 | 0.00 | 2.00 | 4.00 | 5.00 | 0.00 |
| Commercial | 4.00 | 2.00 | 0.00 | 6.00 | 2.00 | 0.00 |
| Industrial | 8.00 | 4.00 | 6.00 | 0.00 | 7.00 | 0.00 |
| Public | 0.00 | 5.00 | 2.00 | 7.00 | 0.00 | 0.00 |
| Road | 2.50 | 0.00 | 0.00 | 0.00 | 0.00 | 0.00 |
Table 2.
Values of different solutions.
| Solutions | |||||||
|---|---|---|---|---|---|---|---|
| 4.21 × 10⁻² | 42,734 | 15,321.03 | 2.70 × 10¹⁰ | 1677 | 17,059.00 | 6.26 × 10⁷ | |
| ⁝ | ⁝ | ⁝ | ⁝ | ⁝ | ⁝ | ⁝ | ⁝ |
| ⁝ | ⁝ | ⁝ | ⁝ | ⁝ | ⁝ | ⁝ | ⁝ |
| 9.81 × 10⁻² | 53,271 | 19,084.11 | 1.51 × 10¹¹ | 1318 | 21,524.00 | 7.50 × 10⁷ | |
| 6.08 × 10⁻² | 33,962 | 12,180.62 | 1.04 × 10¹⁰ | 1461 | 20,986.50 | 5.19 × 10⁷ | |
| 6.84 × 10⁻² | 36,651 | 13,336.74 | 9.24 × 10⁹ | 1282 | 22,775.50 | 5.10 × 10⁷ | |
| 4.51 × 10⁻² | 41,454 | 15,038.94 | 3.24 × 10¹⁰ | 1824 | 18,889.50 | 6.24 × 10⁷ | |
| 4.65 × 10⁻² | 42,740 | 15,586.92 | 1.86 × 10¹⁰ | 1667 | 16,821.00 | 6.27 × 10⁷ | |
| 6.65 × 10⁻² | 36,498 | 13,300.68 | 1.39 × 10¹⁰ | 1288 | 22,795.50 | 5.07 × 10⁷ |
Footer: The minimum Euclidean distance and the optimal values of different objectives.
Publisher’s Note: MDPI stays neutral with regard to jurisdictional claims in published maps and institutional affiliations. |
© 2021 by the authors. Licensee MDPI, Basel, Switzerland. This article is an open access article distributed under the terms and conditions of the Creative Commons Attribution (CC BY) license (https://creativecommons.org/licenses/by/4.0/).
Share and Cite
MDPI and ACS Style
Feng, X.; Tao, Z.; Niu, X.; Ruan, Z. Multi-Objective Land Use Allocation Optimization in View of Overlapped Influences of Rail Transit Stations. Sustainability 2021, 13, 13219. https://0-doi-org.brum.beds.ac.uk/10.3390/su132313219
AMA Style
Feng X, Tao Z, Niu X, Ruan Z. Multi-Objective Land Use Allocation Optimization in View of Overlapped Influences of Rail Transit Stations. Sustainability. 2021; 13(23):13219. https://0-doi-org.brum.beds.ac.uk/10.3390/su132313219
Chicago/Turabian StyleFeng, Xuesong, Zhibin Tao, Xuejun Niu, and Zejing Ruan. 2021. "Multi-Objective Land Use Allocation Optimization in View of Overlapped Influences of Rail Transit Stations" Sustainability 13, no. 23: 13219. https://0-doi-org.brum.beds.ac.uk/10.3390/su132313219
Note that from the first issue of 2016, this journal uses article numbers instead of page numbers. See further details here.