Article

Efficacy, Energy Budgeting, and Carbon Footprints of Weed Management in Blackgram (Vigna mungo L.)

by
Gurdeep Singh Malhi
1,*,
M. C. Rana
2,
Suresh Kumar
2,
Muhammad Ishaq Asif Rehmani
3,*,
Abeer Hashem
4 and
Elsayed Fathi Abd_Allah
5
1
Department of Agronomy, Punjab Agricultural University, Ludhiana 141004, Punjab, India
2
Department of Agronomy, Forages and Grassland Management, CSK Himachal Pradesh Krishi Vishvavidyalaya, Palampur 176062, Himachal Pradesh, India
3
Department of Agronomy, Ghazi University, Dera Ghazi Khan 32200, Pakistan
4
Botany and Microbiology Department, College of Science, King Saud University, P.O. Box. 2460, Riyadh 11451, Saudi Arabia
5
Plant Production Department, College of Food and Agricultural Sciences, King Saud University, P.O. Box. 2460, Riyadh 11451, Saudi Arabia
*
Authors to whom correspondence should be addressed.
Sustainability 2021, 13(23), 13239; https://0-doi-org.brum.beds.ac.uk/10.3390/su132313239
Submission received: 2 September 2021 / Revised: 8 November 2021 / Accepted: 13 November 2021 / Published: 29 November 2021
(This article belongs to the Special Issue Sustainable Weed Control in the Agroecosystems)

Abstract

:
Weed management in blackgram is one of the most efficient ways to improve its yield, as uncontrolled weed growth causes a significant decrease in crop yield. A field experiment was performed at Berthin, Himachal Pradesh, India, to investigate the efficacy, energy use efficiency (EUE), and carbon footprints of weed management tactics. Twelve weed control treatments were tested applied alone or in combination at pre and post emergence stages. The most prominent weeds were Cyperus iria, Dactyloctenium aegyptium, and Echinochloa colona, which caused a 68.1% loss in unweeded conditions. The application of weed control treatments reduced the weed count at 60 DAS from around 50% to 90%. The most efficient weed control treatment was pre-emergence (PRE) use of ready mix imazethapyr 35% + imazamox 35% WG @ 80 g ha−1, which resulted in a minimum weed infestation (i.e., weed count and weed biomass) and consequently highest yield. Its efficacy in weed control treatment was on par with PRE use of ready mix imazethapyr (35%) + imazamox (35% WG @ 70 g ha−1. Maximum energy use efficiency was also obtained upon PRE use of imazethapyr (35%) + imazamox (35% WG) @ 80 g ha−1 (8.27), trailed by PRE use of imazethapyr + imazamox @ 70 g ha−1 (7.84), mainly because of the higher yield obtained in these treatments which shows their efficiency in energy conversion. The carbon footprints were observed to be the lowest in ready mix combination of imazethapyr (35%) + imazamox (35% WG) applied at 80 g ha−1 (0.11 kg CE kg−1 yield), followed by imazethapyr (35%) + imazamox (35% WG) applied at 70 g ha−1 (0.12 kg CE kg−1 yield), as it resulted in the lowest emission per unit output production.

1. Introduction

Weeds are a major factor in the yield reduction of crops as they cause more economic losses than insects, fungi, and other pests. However, there is a significant difference in economic losses by weeds between various crops, locations, and soil types [1]. The management or control of weed infestation in pulses crop has the potential to increase their yields and N fixation yields [2]. In India, blackgram (Vigna mungo L. Hepper) is the fourth most valuable pulse crop, followed by chickpea, pigeonpea, and greengram [3]. It is cultivated in an area of 9000 ha in Himachal Pradesh, India, and produces around seven thousand tonnes with a mean production of 733 kg ha−1 [4,5]. The major weeds of blackgram crop observed in Himachal Pradesh are Echinochloa sp., Dactyloctenium aegyptium, and Cyperus iria, causing huge crop yield losses [6]. Blackgram is a relatively poor competitor against weeds, especially during its early growth stages (3–6 weeks after sowing), therefore weed infestation during this sensitive phase results in increased crop−weed competition, leading to higher yield losses [7,8]. Massive weed infestation is the leading factor responsible for inadequate production, particularly in kharif season (July–September). There is a dire need for suitable weed control method, as weeds cause more harm to agricultural crops than the accumulated damage caused by all other pests and diseases. Weeds mainly compete with crops for nutrition, space, and water, thereby causing yield losses up to 45% if grown uncontrolled [9]. Therefore, weed elimination at a suitable time using adequate means becomes very important to attain a high crop yield. However, continuous rainfall and labor scarcity during the season make manual weeding impracticable. Therefore, chemical weed control is the only viable option.
The close relationship and interdependence of agriculture, economics, and energy make energy budgeting important [10,11]. Energy optimization at the farm level is of utmost importance, as with the injudicious use of agricultural inputs viz. fertilizers, pesticides, seeds, irrigation water, and electricity, a huge portion of the energy is consumed in the agricultural sector, which also generates large quantities of agricultural waste and greenhouse gas emissions [12]. The energy assessment is very important for determining the vulnerability and sustainability of agricultural production [13]. Moreover, the energy and carbon-intensive nature of modern agricultural systems are leading to climate change. Global warming is the major issue in the modern world caused by the emission of greenhouse gases (GHGs), and therefore it is necessary to improve the efficiency of energy use and reduce the carbon footprint in order to bring sustainability to the agriculture sector [14,15,16,17,18]. With the application of chemical herbicides and synthetic fertilizers, weed management costs are a major part of energy costs and, therefore, the judicious application of herbicides has the potential to be more efficient in energy conversion. Weed management has a significant influence on the energy relations of the crops, and a maximum energy output is achieved in treatments where weeds are effectively controlled [19,20]. So, the identification of the most suitable and energy-efficient weed management method in blackgram is very important. Apart from high energy usage, agriculture is also a major contributor to the emissions of atmospheric greenhouse gases (GHGs) [21]. The carbon emission of herbicide application is estimated to be 6.3 kg CE kg−1 of active ingredient (a.i.) and for spraying chemicals it is 1–1.4 kg CE kg−1 [22]. The use of agricultural inputs viz. pesticides, fertilizers, feed, farm power, fodder, and electricity at farm level has increased to 281.2 Tg CE yr−1 in 2008–2009 from less than 70 Tg CE yr−1 in 1960–1961. The corresponding agricultural output has also increased from 578.6 Tg CE yr−1 in 1960–1961 to 1239.1 Tg CE yr−1 in 2008–2009 as the linear relation between carbon inputs and carbon outputs ensured increased agricultural productivity. In addition, 1 Tg CE yr−1 of C input increased the C output around 21 Tg CE yr−1 [23]. This shows a lowered carbon sustainability index over the years after green revolution [24]. Climate change mainly caused by huge emissions of greenhouse gases is acting as a global threat and is projected to further worsen conditions in terms of food security and availability. This creates a huge issue regarding carbon emissions through the injudicious use of chemicals in agriculture and necessitates an approach for formulating a suitable plan for weed control to reduce its carbon footprints. The risk of climate change and awareness regarding the significance of environmental regulations is, however, gradually increasing, even in developing countries like India [25]. The reduction of energy usage and carbon output, along with increasing their use efficiency, are precursors to ensure energy security and sustainability [26,27,28].
The pre-emergence (PRE) use of pendimethalin for weed management is widely practiced, however, its efficiency in controlling all kinds of weeds is poor and it has a limited period of application with less persistent effects, which can be defined as the duration that a herbicide remains active in the soil. Moreover, it cannot be applied in the post-emergence (POST) period if it is failed to be applied as PRE. Imazethapyr is a broad-spectrum herbicide [29,30] with potential for the management of both broad leaves and grass weeds in pulses, and it can be used as pre-sowing incorporation and during PRE or POST periods. Moreover, it has a long-term persistence effect [31] which makes it a better choice for weed control in pulses compared with pendimethalin. However, the use of a single herbicide may not be able to manage all the weeds of a crop efficiently; therefore, the sequential application of different selective herbicides is being done generally, which is not environmentally and economically feasible. The combined application of two herbicides has the potential to impact a wide spectrum of weeds, along with reducing the application cost and time. It further reduces the environmental impact of herbicide application [32]. As there are several available options of herbicide combinations with imazethapyr, their relative and critical evaluation are needed in order to assess their efficacy in weed management in the low hill zone of Himachal Pradesh. Apart from this, the energy budgeting and carbon budgeting of various weed management treatments need to be computed to find out the most energy-efficient weed control treatment with a high carbon sustainability index. The foremost aim is to assess the available options and to identify the most suitable weed control treatment in terms of efficacy and economics, along with the budgeting of treatments in terms of energy and carbon emission.

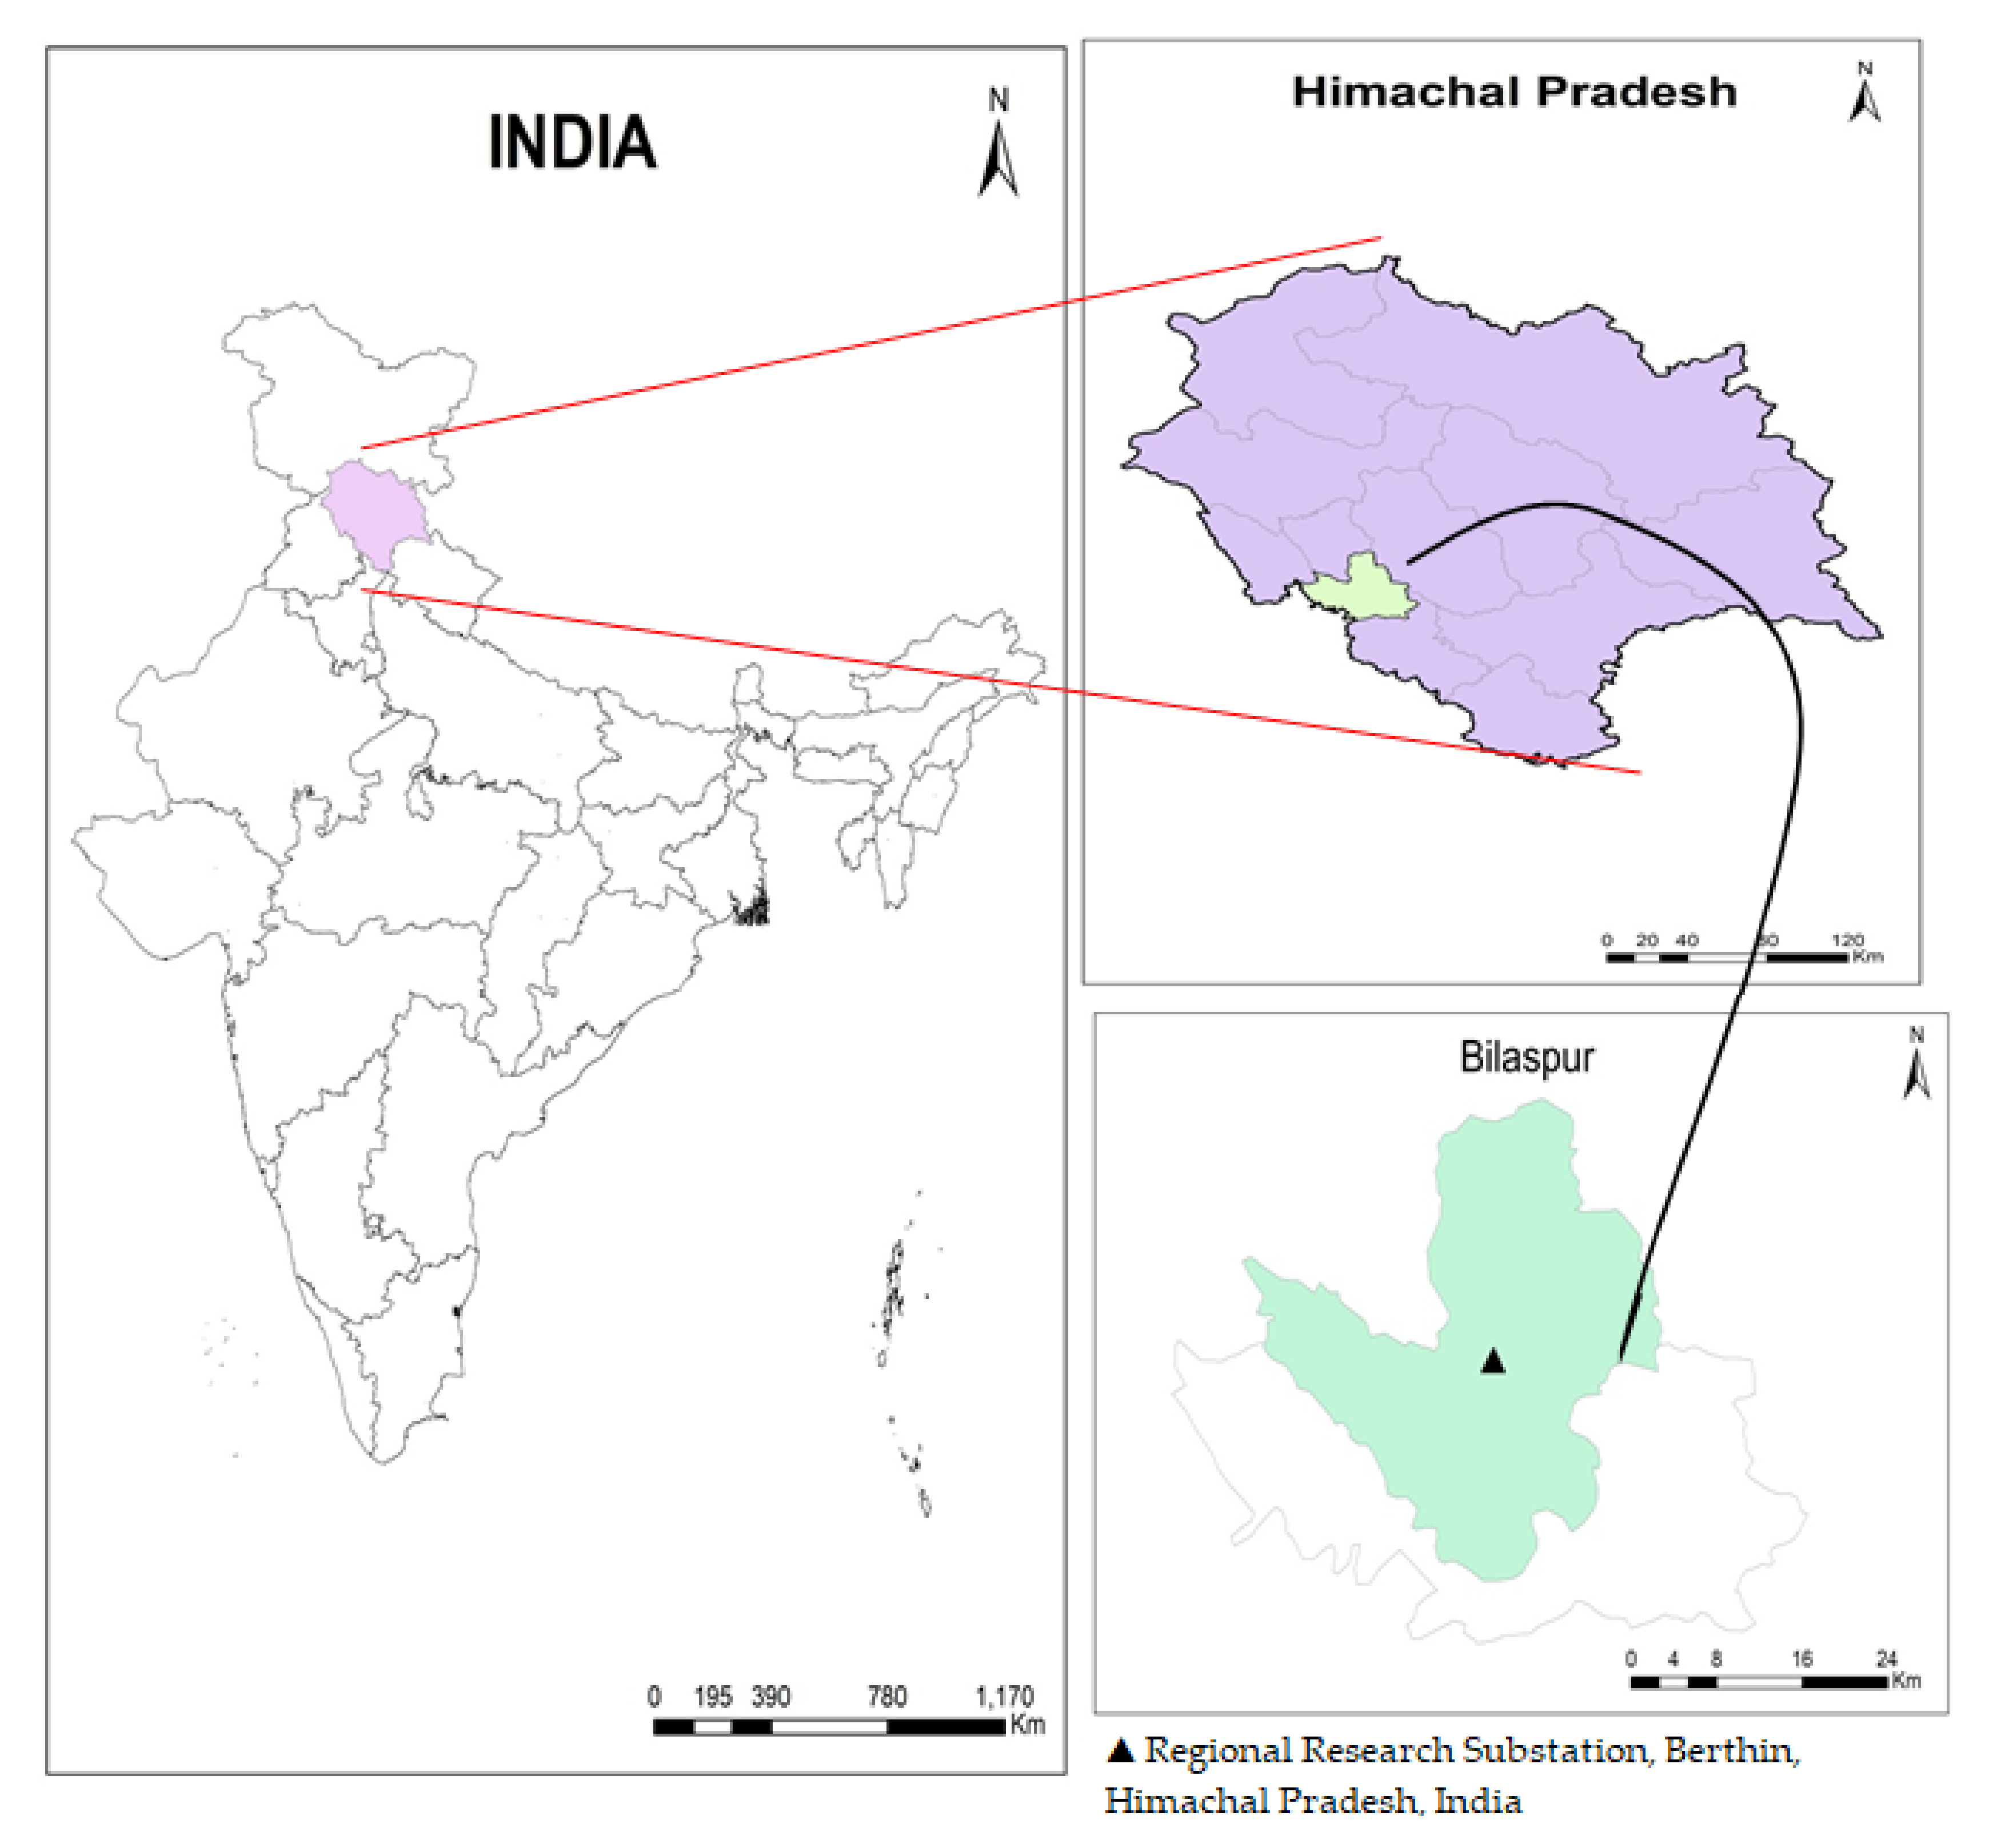
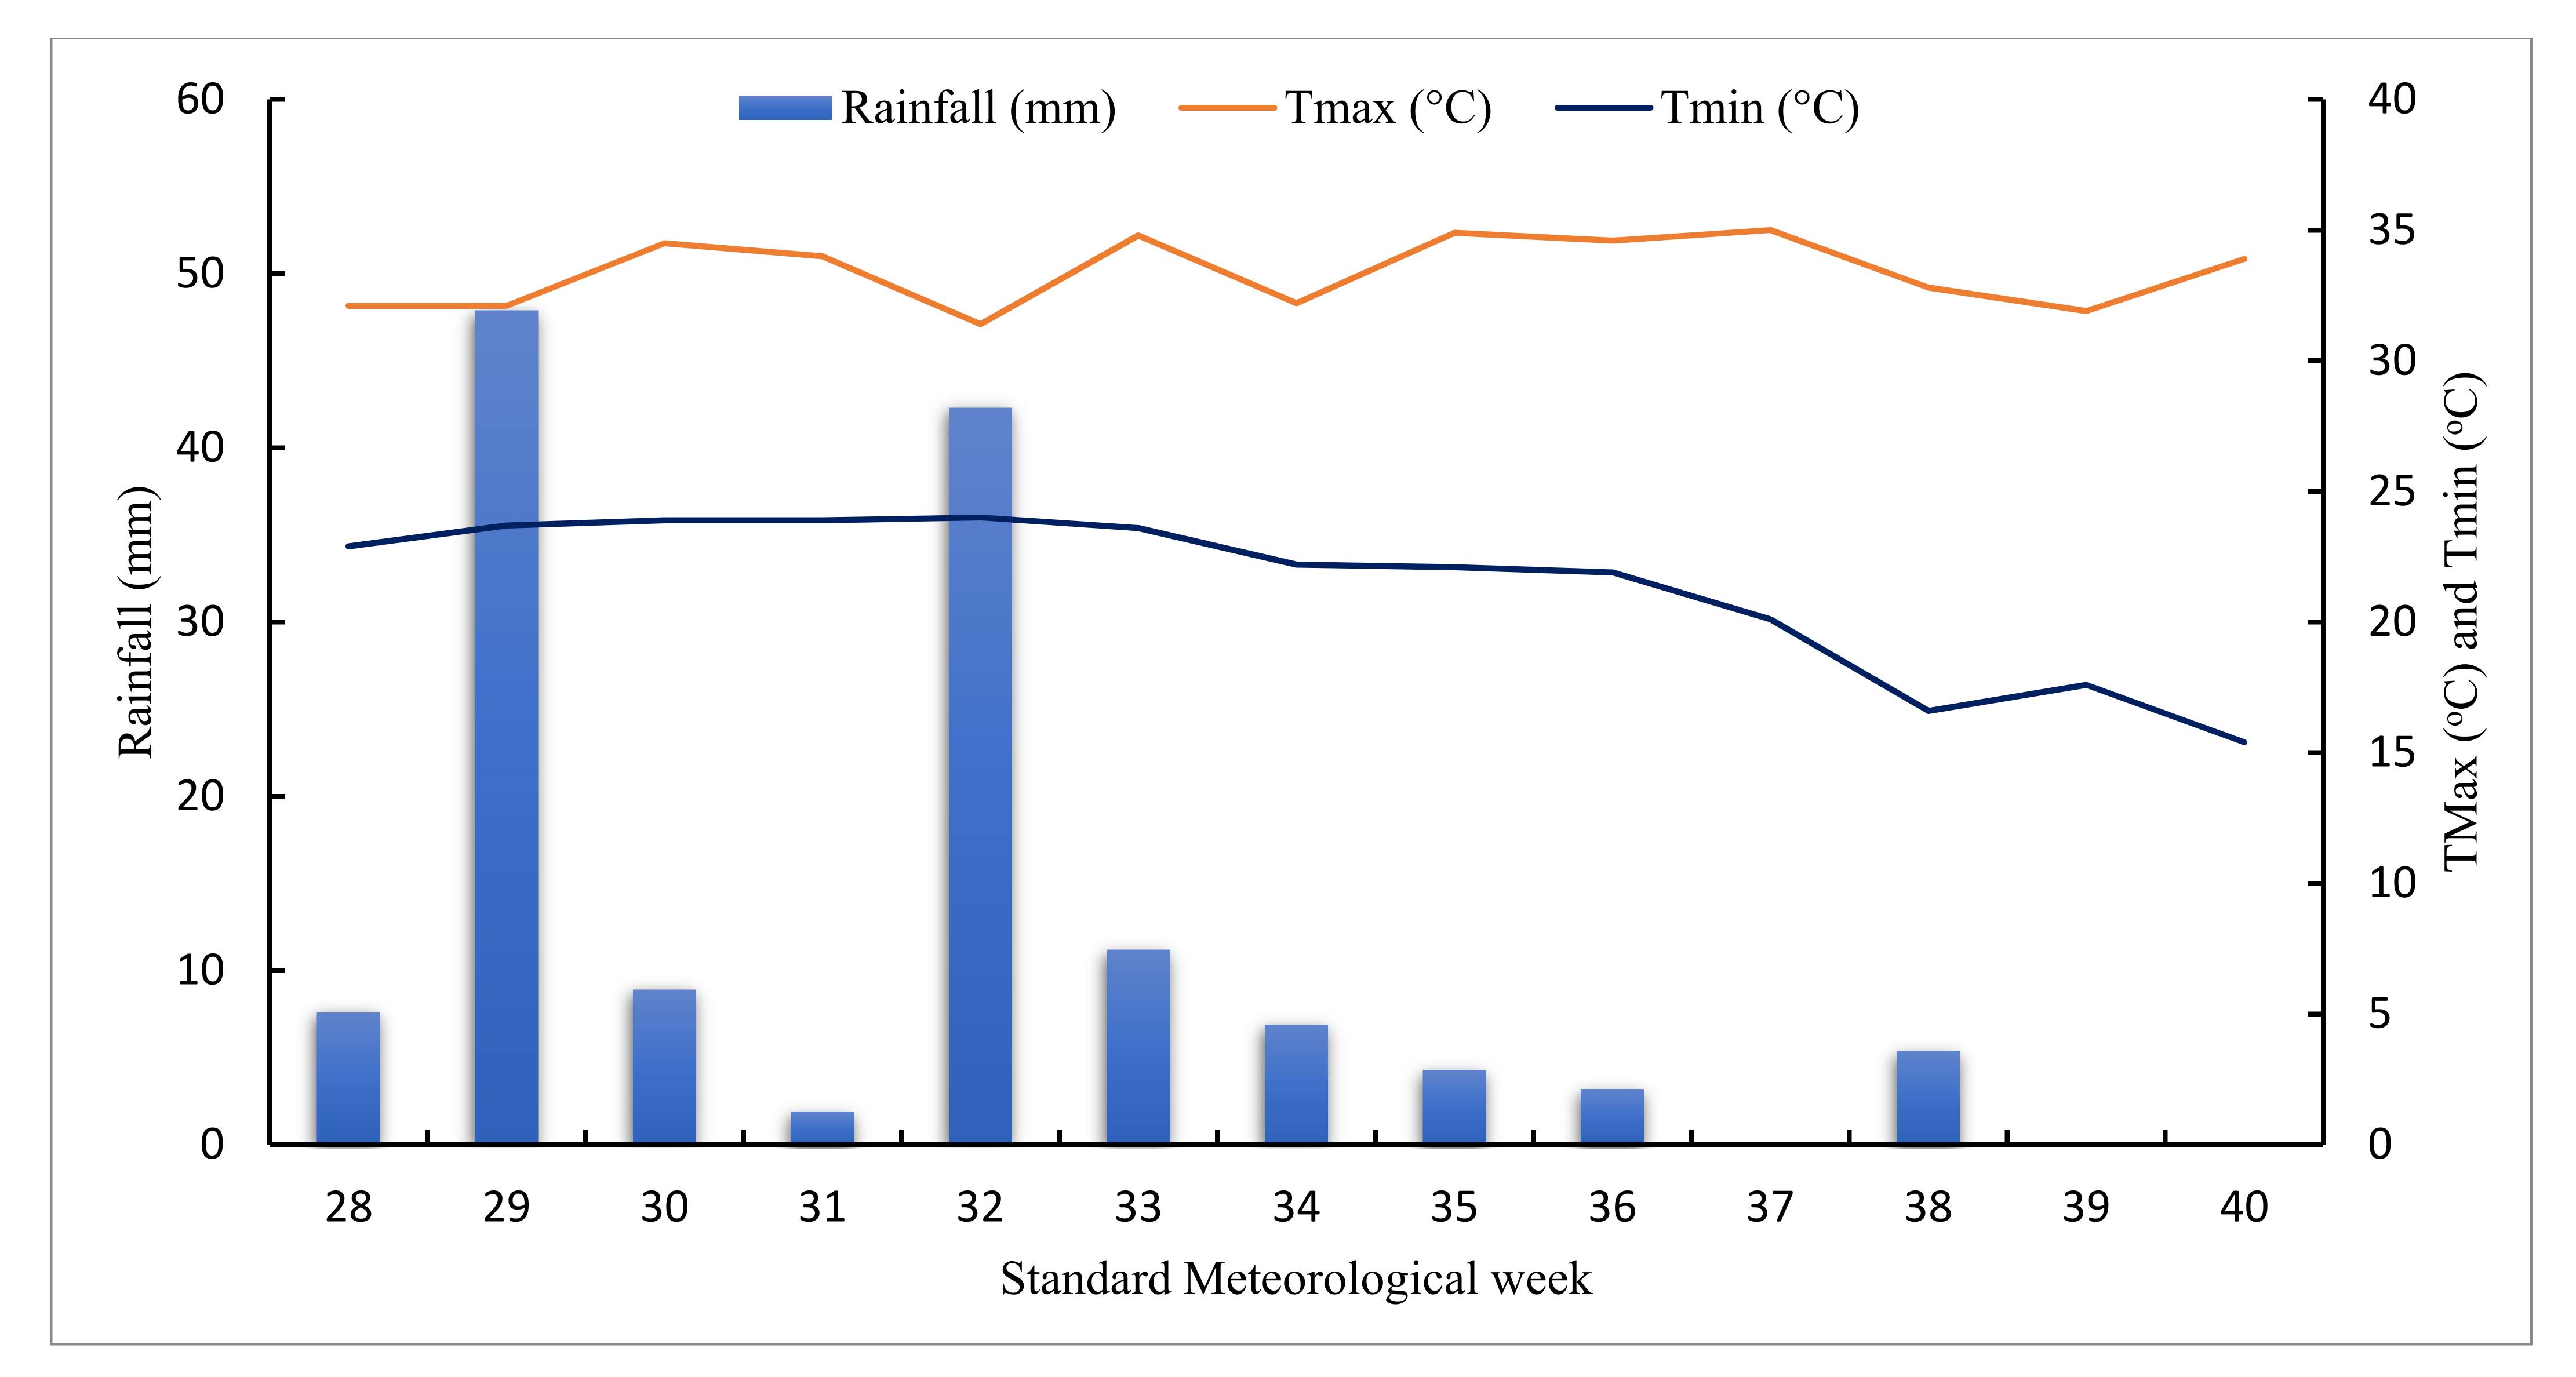
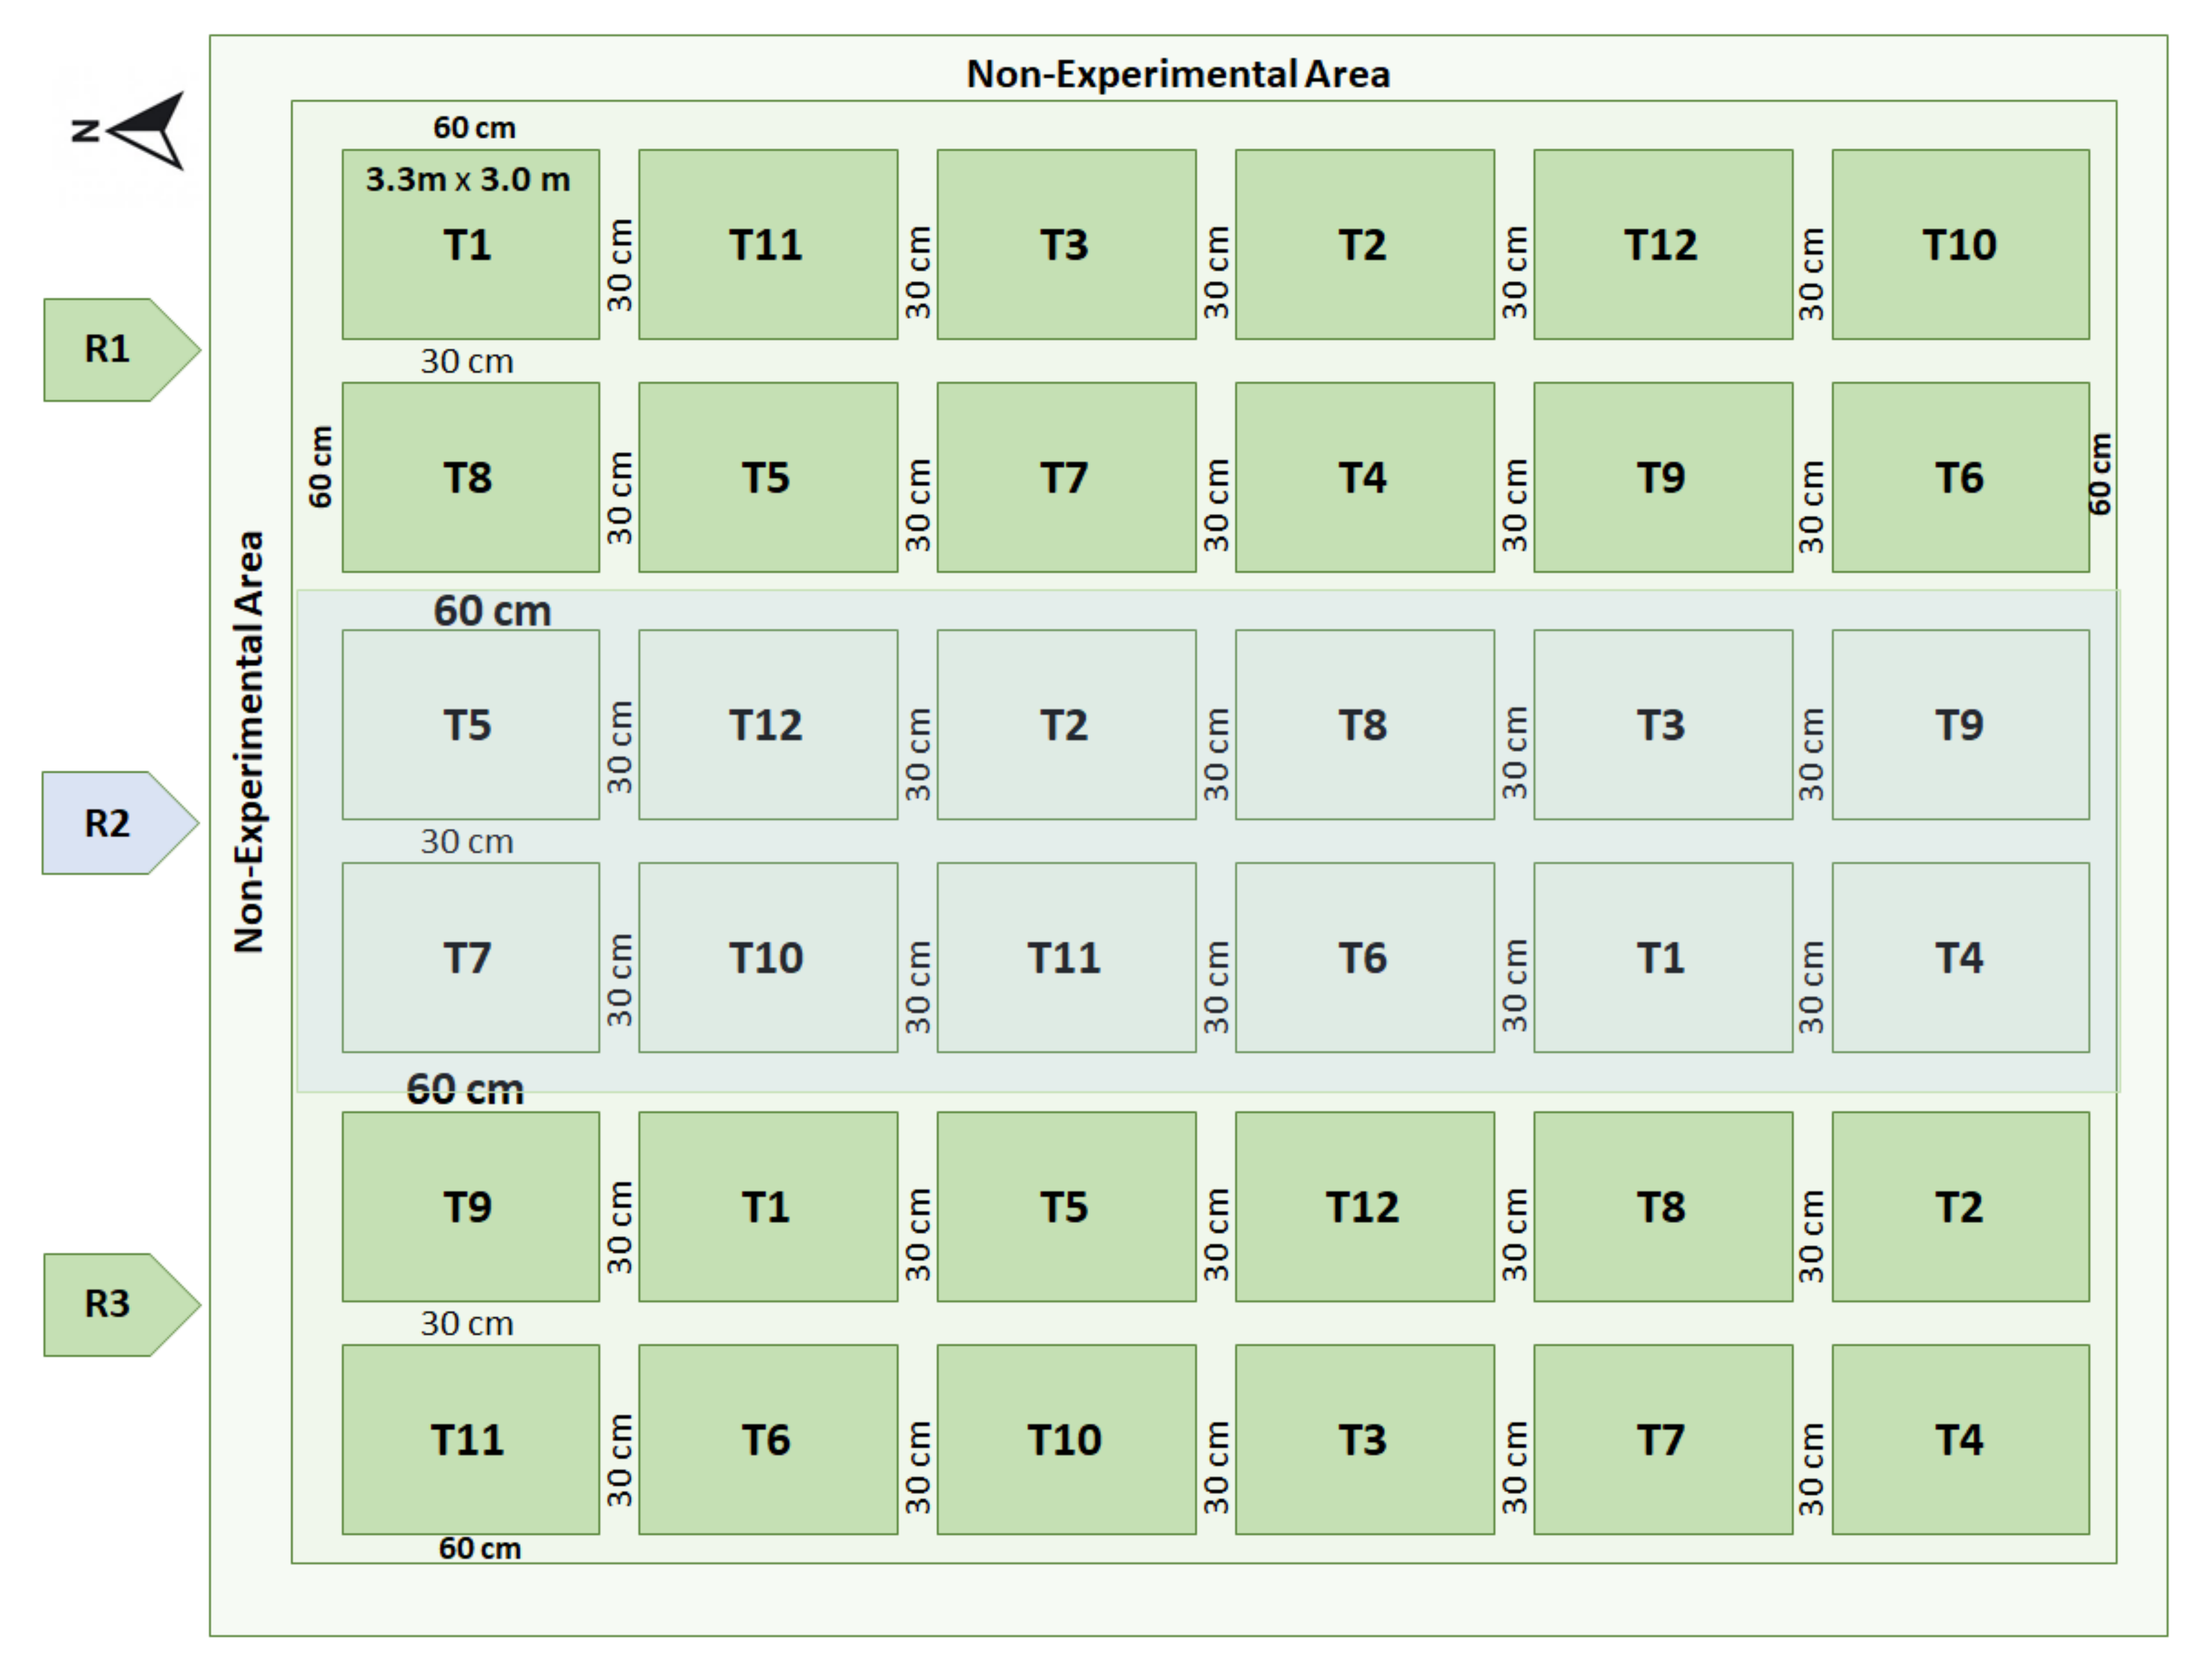
2. Materials and Methods

The field trial was held at a farm in the Regional Research Substation, Berthin (Bilaspur), Himachal Pradesh, India, during 2015. The farm is situated at 31°41′ N latitude and 76°62′ E longitude, and has an elevation of 661 m above sea level in the western part of the Himalayas. The location of the farm is presented in Figure 1.
The experimental area is a part of a sub mountainous low hill zone of Himachal. The region is subtropical warm and sub-humid. The maximum temperature observed ranged from 31.4 °C to 34.9 °C and the minimum temperature range of 15.4 °C to 23.9 °C was observed throughout the growing period. The weather was warm and had inconsistent rainfall of 139.6 mm during cropping. The weekly averages of weather data during the crop season showcasing maximum temperature, minimum temperature, and rainfall, are shown in Figure 2. The texture of the experimental soil was sandy loam and marginally alkaline. The proportion of sand, silt, and clay was observed through the pipette method and was reported to be 67.40, 24.30, and 7.4%. The pH of the experimental site was 7.6, as observed through a 1:2.5 soil water suspension. The organic matter (OM) content was 9 g kg−1 soil. The available N was 305 kg ha−1, whereas the available phosphorus (P2O5) and potassium (K2O) was 24.3 kg ha−1 and 249 kg ha−1, respectively, in the upper soil layer (0–15 cm). The cropping system of blackgram−chickpea was followed for the past 3 years at the experimental site.
The experiment was designed with twelve weed management treatments, including the T1 pre-emergence (PRE) application of imazethapyr (10 SL) @ 70 g ha−1(IM70); T2 (PRE application of imazethapyr (10 SL) @ 80 g ha−1(IM80)); T3 (post-emergence (POST), 3–4 leaf stage) application of IM @ 70 g ha−1(IM70); T4 POST application 80 g (ha−1) of IM (IM80); T5 PRE application of ready mix blend of IM (35%) + imazamox (IMM, 35% WG) @ 70 g ha−1(IM/IMM 70); T6 PRE application of ready mix blend of IM/IMM @ 80 g ha−1(IM/IMM 80); T7 POST application of IM/IMM 70; T8 POST application of ready mix blend IM/IMM80; T9PRE application of pendimethalin 30 EC (PENDI) @ 1000 g ha−1; T10 PRE application of imazethapyr 2 EC + pendimethalin 30 EC (IM/PENDI) @ 1000 g ha−1; T11 hand weeding (HW) at 25 and 45 days after sowing (DAS); and T12 unweeded check (CK) (without weed control). Weed management treatments were arranged using randomized block design (RBD) with three replications. The size of the experimental units was 9.9 m2 (3.3 m × 3 m) each, separated by the bunds with a 30 cm width. Using a knapsack sprayer, treatments were applied with 600 L of water ha−1. The layout of the farm plan is presented in Figure 3.
Crop establishment and management: blackgram cultivar, UG-218, was sown at a plant spacing of 30 cm × 10 cm, on 10 July 2015, and it was harvested on 5 October 2015. Per hectare nutrient use of 20 kg N, 40 kg P2O5, and 20 kg K2O was done. Basal nutrients were applied as IFFCO (12:32:16) and urea (46%). Observations on the weed count were recorded after 1 month (30 DAS, days after sowing), 2 months (60 DAS), and at harvest through a quadrant (25 cm × 25 cm) in two randomly selected spots of each plot, which were then transformed into a one square meter area. The weeds were subjected to drying with the oven at a temperature of 70 °C until the attainment of a constant weight, and were then transformed into g m−2 using a suitable formula. The Kjeldahl’s method (A.O.A.C) was used for the assessment of the nitrogen content of seeds, which was then multiplied by 6.25 to compute the protein content of the grains.
Energy budgeting: the energy equivalents of inputs used (seeds, fertilizers, labor, machinery, insecticides, herbicides, etc.) and outputs are calculated (MJ ha−1) (Table 1). Both input and output data were used to calculate energy balance, energy productivity, net energy returns, energy use efficiency, and specific energy, as given by [16,19,33]:
Net   energy   ( MJ   ha 1 ) = Energy   output Energy   input
Energy   use   efficiency = Energy   output Energy   input
Energy   productivity   ( kg   MJ 1 ) = Economic   yield Energy   input
Energy   intensiveness = Energy   input Cos t   of   cultivation ( MJ   INR 1 )
Energy   profitability = Net   energy Energy   input
Specific   energy   ( MJ   kg 1 ) = Energy   input Grain   yield
Energy   intensity   in   physical   terms   ( MJ   kg 1 ) =   Total   energy   input Total   biological   yield
Energy   intensity   in   economic   terms   ( MJ   INR 1 ) = Total   energy   output Cos t   of   cultivation
Carbon budgeting: the inputs and outputs were multiplied by the carbon emission coefficients to calculate the carbon equivalents as given in Table 2. The total value of the carbon inputs and outputs were calculated by adding the carbon equivalents of all the inputs and outputs of the crop.
Carbon output (kg CE ha−1) = Total biomass (grain yield + by-product yield)* 0.44
Carbon   efficiency = Total   carbon   output Total   carbon   input
Carbon   sustainability   index = Total   carbon   output Total   carbon   input Total   carbon   input
Carbon   footprints = Total   Carbon   emission   or   input Total   yield   of   crop
Economic analysis: Both fixed and variable costs were taken for the cost calculation. The land depreciation component of the fixed cost was taken, however, and the variable costs included inputs costs, use of machinery, manual labor, harvesting, and threshing, etc. Gross returns were calculated by multiplying the value of the per unit yield in rupees (INR) and the yield obtained. Gross returns as a result of weed control were computed by deducting the gross returns obtained in the unweeded check from the gross returns obtained in the weed management treatment.
Net returns = Gross returns due to weed control − Cost of weed control
Marginal   Benefit Cos t   ratio   ( MBCR ) = Net   returns   due   to   weed   control Cos t   of   weed   control
Statistical analysis: The data on weed density and dry matter were analyzed after being subjected to square root transformation ( x + 0.5 ) in a way that transformed the data, following the assumption of ANOVA analysis [48,49]. The transformed data were analyzed statistically using SPSS version 23.0 software for ANOVA assessment with the randomized block design to check the significance of the differences among different treatments via “F” test, and concluding the result at a 95% probability level with the help of the least significant difference post hoc test.

3. Results and Discussion

The data on weed count were discussed at 2 months (60 DAS), where the maximum weed population was recorded, while the maximum weed dry matter was discussed at harvest. The dominant weed species associated with blackgram were Echinochloa. colona (51%), Dactyloctenium aegyptium (32%), and Cyperus iria (17%), as observed in the unweeded check at 60 DAS. However, other weed flora consisted of Physalis minima, Medicago denticulata, Convolvulus arvensis, Commelina benghalensis, and Sorghum halepense, which were observed during other growth stages in weed control treatments other than the unweeded check.

3.1. Effect on Weed

3.1.1. Weed Density (No. m−2)

The PRE herbicide application yielded better results than the POST herbicide application to control of all types of weed flora, as presented in Table 3. Similarly, the pre-mix herbicide blend had an advantage over the sole use of herbicides. Among all of the herbicidal treatments, the PRE application of ready mix use of IM/IMM @ 80 g ha−1 ensured the lowest population of least E. colona, followed by treatment with PRE application of IM/IMM @ 70 g ha−1. These results are in agreement with the findings of Kundu et al. [50]. Hand weedings at 25 and 45 DAS eliminated E. colona, but there was a flush of D. aegyptium at 60 DAS, which lasted until harvest. The next best treatment for the control of D. aegyptium was PRE application of IM/IMM @ 80 g ha−1. These results were comparable with to findings of Singh et al. [51]. C. iria was completely eradicated in the treatment with two hand weedings at 25 and 45 DAS and PRE application of a higher rate of ready mix blend of IM/IMM @ 80 g. The next best alternative for C. iria management was the PRE use of a lower rate of ready mix blend of IM/IMM (70 g ha−1). Similar findings were reported by Panda et al. and Mishra et al. [52,53]. The appearance of other weeds was not significant and their presence was prevalent in the treatments with the PRE application of herbicides only and absent in the treatment with POST application of herbicides and unweeded check (except at harvest) (Table 3). Their absence can be attributed to the smothering potentially caused by the increasing competition as a result of the higher population of weed flora, i.e., E. colona, C. iria, and D. aegyptium. For PRE application of lower doses (70 g ha−1) of herbicides (IM/IMM, IM/PENDI), the weed count of other weeds was reduced, while in treatments with PRE application of higher doses (80 g ha−1) of these herbicides (IM/IMM, IM/PENDI), they were completely absent because of their long persistent effect and higher efficiency [5].

3.1.2. Weed Biomass

The weed biomass of the observed weeds in the blackgram crop at 30 DAS, 60 DAS, and at harvest is presented in Table 4. The results were discussed at harvest during, where the maximum weed biomass was observed. Hand weeding was the most efficient at reducing the biomass of E. colona. Among the herbicidal treatments, the use of PRE application of IM/IMM @ 80 g ha−1 significantly lowered the dry matter of E. colona at harvesting. The results are statistically similar to the pre-emergence application of IM/IMM @ 70 g ha−1. The next best treatment was the PRE application of IM/PENDI @ 1000 g ha−1, which was statistically comparable to the PRE application of IM @ 80 g ha−1. These results were marginally followed by IM application @ 70 g ha−1. These consequences were comparable with the findings of Singh et al. and Panda et al. [51,54]. The absorption of imazamox occurs through the roots and foliage of the weeds, and then translocates in the vascular bundles (xylem and phloem) after which it accumulates in the growing points [54]. Weed management with two hand weedings (25 and 45 DAS) significantly controlled the population of D. aegyptium, and its results are statistically comparable with the PRE application of both rates (70 g ha−1 and 80 g ha−1) IM/IMM. The use of pre-mix blend of IM/IMM @ 70 g ha−1 during the PRE period was the following finest treatment, whose results are statistically comparable to the PRE use of IM/PENDI @ 1000 g ha−1. Dry matter (DM) accumulation was enhanced up to 60 DAS in C. iria, after which it gradually declined because of withering. A significant decline in the accumulation of dry matter of C. iria was observed in all of the weed control treatments in comparison with the unweeded check. Hand weeding (25 and 45 DAS), ready mix combination of IM/IMM @ 80 g ha−1 (PRE), and ready mix combination of IM/IMM @ 80 g ha−1 (POST) resulted in complete elimination of C. iria, and was found to be superior among the treatments used for weed management. These results were statistically comparable to the application of IM @ 80 g ha−1 (PRE), IM @ 80 g ha−1 (POST), IM @ 70 g ha−1 (POST), mix application of IM/IMM @ 70 g ha−1 (PRE and POST), and ready mix combination of IM/PENDI @ 1000 g ha−1 (PRE). These results were in line with the findings of Kundu et al. [50]. There was not any difference in the weed dry matter of other weeds among the weed management treatments.

3.2. Effect on Crop

3.2.1. Growth Parameters

The treatments used for weed control did not have a considerable effect on the emergence of blackgram (Table 5), which indicates the selectivity of tested herbicides at a normal rate. The maximum number of leaves was recorded in the treatment where hand weeding was used, followed by PRE application of ready mix combination of imazethapyr + imazamox @ 80 g. These results were to be found statistically comparable to the lower rate of PRE application of mix blend of IM/IMM (70 g ha−1). days to 50% flowering and maturity were not influenced by the weed control treatments (Table 5).
Likewise, hand weeding resulted in a maximum number and dry weight of nodules (Table 5), which was mainly because of the enhanced aeration in the rhizosphere zone and the improved growth of roots [55]. The higher rate (80 g ha−1) of IM/IMM applied as PRE was the second most effective weed control treatment, on the contrary, the lower rate (70 g ha−1) of pre-mix blend of IM/IMM applied as PRE increased the count and dry weight of nodules in plants in the pre-flowering and post-flowering stage. However, in both pre and post flowering stages, the unweeded check yielded the lowest number and dry weight of nodules and the POST application of IM @ 70 g ha−1 did not increase the number of nodules in the plants over the unweeded check at the post-flowering stage. This could be attributed to the increased dry matter of weeds in the unweeded check leading to intensified crop weed competition, ultimately leading to decreased crop growth [56].

3.2.2. Yield and Yield Attributes

Treatments used for weed control have a significant impact on the plant growth, yield parameters, and yield of blackgram. Weed management treatments had a significant influence on reducing the dry matter (DM) content of weeds and their density, thereby providing favorable conditions for the proliferated growth of blackgram, which resulted in higher yield and yield parameters compared with the weedy check (Table 6). The plant density (number of crop plants m−2) was not markedly influenced by weed control treatments. However, branching in crop plants is significantly influenced and the highest number of branches was observed in treatments with the PRE application of pre-mix blend of IM/IMM @ 80 g ha−1. PRE application of IM/IMM blend @ 70 g ha−1 was the second best treatment, statistically similar to hand weedings twice at 25 and 45 DAS and PRE application of IM/PENDI @ 1000 g ha−1. The pod counts in the plants were significantly affected by the weed control treatments. The higher dose (80 g ha−1) of IM/IMM applied as PRE application resulted in a maximum number of pods per plant, narrowly followed by PRE application of its lower dose (IM/IMM, @ 70 g ha−1). The next best plan yielding the maximum number of pods in a plant was hand weeding. However, POST application IM @ 70 g ha−1 had no significant effect on increasing the pods of the crop plant over the unweeded check. Crop yield attributes were significantly improved with the PRE use of ready mix herbicides, mainly because of the reduced competition for crop growth, which in turn leads to the improved translocation of photosynthates to developing seeds [57]. The maximum seed count per pod and test weight (1000 seed weight) also had a similar trend as the pod counts per plant. The highest seed yield and straw yield were observed in the treatment with PRE application of a higher dose (80 g ha−1) of IM/IMM, which was on par with the use of PRE application of a lower dose (70 g ha−1) of IM/IMM blend. The higher yield in weed control treatments could be credited to the efficient management of weeds in early growth stages providing a congenial environment for better crop growth. Moreover, the nutrient uptake of the crop plants is also increased with weed control treatments [4,8,44,45,55,58].

3.2.3. Quality Parameters

The increased percentage of nitrogen in the seeds of blackgram was observed with the PRE use of a ready mix blend of IM/IMM (80 g ha−1 and 70 g ha−1). The considerably higher protein content (%) in seeds was observed in treatment with the PRE use of blend of IM/IMM @ 80 g ha−1, whose results were statistically found to be on par with the PRE use of IM/IMM (70 g ha−1), two hand weedings, and PRE application of IM/PENDI @ 1000 g ha−1 (Table 6). The lower weed competition allowed the plants to proliferate well, resulting in higher nutrient uptake and consequently leading to higher photosynthates accumulation [55].

3.3. Energy Utilization Pattern

The energy use pattern was computed for each treatment. The common input energy of 6625.02 MJ ha−1 was used for the cultivation of blackgram. Of all the common inputs, the maximum energy input was for diesel used for field preparation, i.e., 30.60%, followed by nitrogen fertilizers (23.65%), human power (19.41%), and machinery use (7.82%). The phosphorus and potassic fertilizers constituted 6.70% and 6.31%, respectively, of the energy inputs in crop production. The minimum energy inputs were for electricity, insecticides, and seeds, i.e., 0.18%, 1.12% and 4.21%, respectively.
Energy inputs in different weed treatments are shown in Table 7. Unweeded check did not require input energy as neither weedicide nor human labor, was used for weed removal, and the weeds were allowed to grow in the treatment. Maximum energy input was required in the treatment where hand weeding was done twice (784 MJ ha−1). Among the different herbicidal treatments, the maximum energy was consumed in PENDI (PRE) @ 1000 g ha−1 and IM/PENDI (PRE) @ 1000 g ha−1 i.e., 322.69 MJ ha−1. A similar amount of input energy in PRE and POST application of IM@ 70 g ha−1, PRE and POST application of IM/IMM @ 70 g ha−1 was required (54.85 MJ ha−1). However, 54.85 MJ ha−1 of input energy was required for herbicide application of IM @ 80 g ha−1 (PRE), IM @ 80 g ha−1 (POST), IM/IMM @ 80 g ha−1 (PRE), and IM/IMM @ 80 g ha−1 (POST). The similar energy requirement was mainly due to the similar dose of herbicide applied [10,11,13,16].
The total input energy required in various herbicide treatments is shown in Table 8. The maximum input energy was recorded in hand weeding twice (7409.02 MJ ha−1), followed by PENDI @ 1000 g ha−1 (PRE) and IM/PENDI @ 1000 g ha−1 (PRE) (6947.71 MJ ha−1). The minimum input energy was observed in the unweeded check (6625.02 MJ ha−1), followed by IM/IMM @ 70 g ha−1 (PRE and POST) and IM @ 70 g ha−1 (PRE and POST) with input energy of 6679.87 MJ ha−1. The input energy of 6682.75 MJ ha−1 was reported in treatment with the PRE application of IM @ 80 g ha−1, IM @ 80 g ha−1 (POST), and IM/IMM @ 80 g ha−1 (PRE and POST). Similar findings were reported earlier by [10,11,13,16,42].

3.4. Energy Input−Output Relationship and Energy Indices

The total energy output and energy input are shown in Table 8. The output energy was computed based on the seeds and straw yield. The maximum total energy was observed in the plot with a herbicidal treatment of IM/IMM @80 g ha−1 (PRE) (55,274.72 MJ ha−1), followed by IM/IMM @ 70 g ha−1 (PRE) (52,395.58 MJ ha−1) and hand weeding twice (50,319.12 MJ ha−1), while the minimum energy output was recorded in unweeded check (20,369.96 MJ ha−1), followed by lower (70 g ha−1, 27,461.12 MJ ha−1) and higher (80 g ha−1, 35,359.25 MJ ha−1) rates of POST application of IM
Net energy, energy intensiveness, specific energy, energy use efficiency, energy profitability, energy intensity, and specific energy in physical terms and economic terms were calculated for each treatment, as shown in Table 9. This helped in the identification of the most energy-efficient weed management treatment. Among the different weed control treatments, the highest net energy returns of 48,592 MJ ha−1 were observed in IM/IMM @ 80 g ha−1 (PRE), followed by experimental units that received PRE application of a lower rate of IM/IMM (70 g ha−1) (45,715.7 MJ ha−1), hand weeding twice (42,910.1 MJ ha−1), and IM/PENDI (PRE) (42,571.4 MJ ha−1) due to the high output energies in these treatments obtained with the highest crop and straw yield, while the minimum energy returns were observed in unweeded check (13,744.9 MJ ha−1), which is attributed to the low seed and straw yield [41]. Consequently, energy use efficiency was also recorded to be the highest in IM/IMM @ 80 g ha−1 (PE) (8.27), followed by IM/IMM @ 70 g ha−1 (PRE) (7.84) and IM/PENDI @ 1000 g ha−1 (PRE) (7.13). On the contrary, the maximum specific energy was observed in the unweeded check (13.92 MJ ha−1) due to uncontrolled weed growth leading to the lowest yield. The minimum specific energy was observed in IM/IMM @ 80 g ha−1 (PRE) (4.78 MJ ha−1), which is comparable with IM/IMM @ 70 g ha−1 (4.48 MJ ha−1). The energy intensity in both physical and economic terms was also in line with the energy use efficiency and net energy returns. The herbicidal treatment of IM/IMM @ 80 g ha−1 (PRE) was the most energy-efficient herbicidal treatment because of its consequent higher blackgram and straw production. The higher biological yield showed the higher output energy, which raised the energy use efficiency (EUE), energy intensity (EI), and net energy (NE). Whereas, the lower energy indexes in the unweeded check were because of lower outputs [11,13,22,42,45].

3.5. Carbon Budgeting

The carbon budgeting of herbicidal treatments in blackgram is shown in Table 10. Among the various weed management practices, the highest total carbon inputs were recorded in PENDI @ 1000 g ha−1 (pre), where herbicidal treatment added 20.99 kg CE ha−1 to the total carbon inputs of 189.18 kg CE ha−1. On the contrary, minimum carbon inputs were recorded in the herbicidal treatment of IM/IMM @ 70 g ha−1 (0.63 kg CE ha−1), which had total carbon inputs of 168.81 kg CE ha−1. The difference in carbon inputs among various treatments was mainly attributed to the difference in the herbicide doses and active ingredients in the herbicides [22]. The carbon outputs on the other hand were recorded to be maximum in IM/IMM @ 80 g ha−1 (PRE) (1689.94 kg CE ha−1), as the highest yield was observed in this treatment because of the higher efficacy in the weed control. The minimum carbon outputs were observed in the unweeded check (635.44 kg CE ha−1) because of the uncontrolled weed growth, leading to the lowest yield. Consequently, the carbon efficiency and carbon sustainability index were also observed to be maximum in IM/IMM @ 80 g ha−1 (PRE), which also yielded the lowest carbon footprint. The higher output per unit of input ensured a higher carbon sustainability index (CSI) and lower carbon footprints [23,44].

3.6. Economics

As the application of ready mix combination of IM/IMM @ 80 g ha−1 ensured the most efficient weed control, the highest gross returns and net returns were observed in this particular treatment. The higher output was observed in the most efficient weed control, leading to higher returns. PRE use of IM/IMM @ 70 g ha−1 was the second-best treatment in attaining higher gross returns and net returns (Table 11). However, marginal benefit cost−ratio (MBCR) was found to be maximum with PRE use of IM @ 80 g ha−1 followed by use of IM @ 70 g ha−1 during PRE period, use of pre-mix blend of IM/IMM @ 70 g ha−1, and 80 g ha−1 during PRE period. The returns obtained by the various weed control treatments were directly related to the crop yield, as a higher output ensures higher returns [6,11].

4. Conclusions

Weeds, in blackgram crop, are a major factor responsible for yield reduction as they reduce the crop yield by 68.1%. Here, the use of herbicides controlled the weed infestation and raised the crop yield by more than double when compared with the unweeded check. The pre-emergence (PRE) application of pre-mix combination of imazethapyr + imazamox @ 80 g ha−1 was found to be the found most efficient in controlling weeds, as it reduced the weed count by 91% and weed dry weight by 92%. The economics, energy, and efficacy were closely related. The application of the above treatment also yielded the highest net returns of INR 122478. The maximum energy use efficiency (EUE) and energy productivity were also witnessed in the above-said treatment. The carbon sustainability index and carbon footprints were also calculated to be lowest in the PRE application of imazethapyr + imazamox @ 80 g ha−1, while being lowest in the unweeded check. Therefore, the first-mentioned treatment is the most efficient treatment than sole application of herbicides or manual weeding. The PRE use of ready mix blend of imazethapyr + imazamox @ 70 g ha−1 is the second best treatment in terms of efficacy, energy use efficiency, carbon sustainability index, and economic returns, which is also on par with the best treatment.

Author Contributions

Conceptualization, M.C.R. and S.K.; methodology, G.S.M., M.C.R. and S.K.; formal analysis, G.S.M. and M.C.R.; investigation, G.S.M.; resources, M.C.R.; data curation, G.S.M. and M.I.A.R.; writing—G.S.M. and M.I.A.R.; writing—review and editing, G.S.M., M.I.A.R., A.H. and E.F.A.; visualization, G.S.M.; supervision, M.C.R.; funding acquisition, M.I.A.R., M.C.R., A.H. and E.F.A. All authors have read and agreed to the published version of the manuscript.

Funding

The authors would like to extend their sincere appreciation to the Researcher Supporting Project (RSP-2021/134), King Saud University, Riyadh, Saudi Arabia.

Institutional Review Board Statement

Not applicable.

Informed Consent Statement

Not applicable.

Data Availability Statement

Data is available on request.

Acknowledgments

The authors are thankful to the regional research sub-station Berthin, Bilaspur, India for providing facilities for conducting these studies. The authors would like to extend their sincere appreciation to the Researcher Supporting Project (RSP-2021/134), King Saud University, Riyadh, Saudi Arabia. The help rendered by Pradeep Kumar Dalal (Technical Assistant, CCSHAU Hisar, India) in analyzing the data is highly acknowledged.

Conflicts of Interest

The authors declare no conflict of interest.

References

  1. Gharde, Y.; Singh, P.K.; Dubey, R.P.; Gupta, P.K. Assessment of yield and economic losses in agriculture due to weeds in India. Crop. Prot. 2018, 107, 12–18. [Google Scholar] [CrossRef]
  2. Strydhorst, S.M.; King, J.R.; Lopetinsky, K.J.; Harker, K.N. Weed Interference, Pulse Species, and Plant Density Effects on Rotational Benefits. Weed Sci. 2008, 56, 249–258. [Google Scholar] [CrossRef]
  3. Kaur, R.; Shivay, Y.; Singh, G.; Virk, H.K.; Sen, S.; Rajni. Increasing area under pulses and soil quality enhancement in pulse-based cropping systems–Retrospect and prospects. Indian J. Agric. Sci. 2018, 88, 10–21. [Google Scholar]
  4. Dhanushkodi, V.; Amuthaselvi, G.; Easwaran, S. Black gram (Vigna mungo) seed production: An approach towards food security and income generation. Int. J. Farm Sci. 2018, 8, 55–58. [Google Scholar] [CrossRef]
  5. Tiwari, A.K.; Shivhare, A.K. Pulses in India: Retrospect and Prospects; Directorate of Pulses Development, Department of Agriculture, Cooperation and Farmer Welfare, Ministry of Agriculture and Farmers Welfare, Government of India, Vindhyachal Bhawan: Bhopal, MP, India, Publication No: DPD 2016, 1, 221; 2016. [Google Scholar]
  6. Rana, S.; Singh, G.; Rana, M.; Sharma, N.; Kumar, S.; Singh, G.; Badiyala, D. Impact of imazethapyr and its ready-mix combination with imazamoxto control weeds in blackgram. Indian J. Weed Sci. 2019, 51, 151–157. [Google Scholar] [CrossRef]
  7. Choudhary, V.; Kumar, P.S.; Bhagawati, R. Integrated weed management in blackgram (Vigna mungo) under mid hills of Arunachal Pradesh. Indian J. Agron. 2012, 57, 382–385. [Google Scholar]
  8. Shaktawat, R. Integrated weed management in blackgram. Indian J. Weed Sci. 2020, 52, 290–291. [Google Scholar]
  9. Sanbagavalli, S.; Chinnusamy, C.; Marimuthu, S.; Sivamurugan, A.P. Weed management strategies in Blackgram (Phaseolus mungo L.): A review. Int. J. Agric. Sci. 2016, 8, 3481–3486. [Google Scholar]
  10. Lal, S.; Dubey, R.; Das, G.; Suryavanshi, T. Energy budgeting of weed management in soybean. Indian J. Weed Sci. 2016, 48, 394–399. [Google Scholar] [CrossRef]
  11. Nagarjun, P.; Dhanapal, G.; Sanjay, M.; Yogananda, S.; Muthuraju, R. Energy budgeting andeconomics of weed management in dry direct-seededrice. Indian J. Weed Sci. 2019, 51, 1–5. [Google Scholar] [CrossRef]
  12. Pal, A.; Nandy, A.; Dey, S.; Singh, P.K. Optimizing Energy Use Efficiency for Agricultural Sustainability. In Energy and Environmental Security in Developing Countries; Asif, M., Ed.; Springer International Publishing: Cham, Switherland, 2021; pp. 609–632. [Google Scholar] [CrossRef]
  13. Ghosh, D.; Brahmachari, K.; Das, A.; Hassan, M.M.; Mukherjee, P.K.; Sarkar, S.; Dinda, N.K.; Pramanick, B.; Moulick, D.; Maitra, S.; et al. Assessment of Energy Budgeting and Its Indicator for Sustainable Nutrient and Weed Management in a Rice-Maize-Green Gram Cropping System. Agronomy 2021, 11, 166. [Google Scholar] [CrossRef]
  14. Jat, S.L.; Parihar, C.M.; Singh, A.K.; Kumar, B.; Choudhary, M.; Nayak, H.S.; Parihar, M.D.; Parihar, N.; Meena, B.R. Energy auditing and carbon footprint under long-term conservation agriculture-based intensive maize systems with diverse inorganic nitrogen management options. Sci. Total Environ. 2019, 664, 659–668. [Google Scholar] [CrossRef]
  15. Jaiswal, B.; Agrawal, M. Carbon Footprints of Agriculture Sector. In Carbon Footprints: Case Studies from the Building, Household, and Agricultural Sectors; Muthu, S.S., Ed.; Springer: Singapore, 2020; pp. 81–99. [Google Scholar] [CrossRef]
  16. Choudhary, M.; Rana, K.S.; Bana, R.S.; Ghasal, P.C.; Choudhary, G.L.; Jakhar, P.; Verma, R.K. Energy budgeting and carbon footprint of pearl millet–mustard cropping system under conventional and conservation agriculture in rainfed semi-arid agro-ecosystem. Energy 2017, 141, 1052–1058. [Google Scholar] [CrossRef]
  17. Rehmani, M.I.A.; Ding, C.; Li, G.; Ata-Ul-Karim, S.T.; Hadifa, A.; Bashir, M.A.; Hashem, M.; Alamri, S.; Al-Zubair, F.; Ding, Y. Vulnerability of rice production to temperature extremes during rice reproductive stage in Yangtze River Valley, China. J. King Saud Univ.-Sci. 2021, 33, 101599. [Google Scholar] [CrossRef]
  18. Rehmani, M.I.A.; Wei, G.; Hussain, N.; Ding, C.; Li, G.; Liu, Z.; Wang, S.; Ding, Y. Yield and quality responses of two indica rice hybrids to post-anthesis asymmetric day and night open-field warming in lower reaches of Yangtze River delta. Field Crop. Res. 2014, 156, 231–241. [Google Scholar] [CrossRef]
  19. Ali, M.; Behera, U. Effect of tillage and weed-management options on productivity, energy-use efficiency and economics of soybean (Glycine max). Indian J. Agron. 2014, 59, 481–484. [Google Scholar]
  20. Araniti, F.; Landi, M.; Laudicina, V.A.; Abenavoli, M.R. Secondary Metabolites and Eco-Friendly Techniques for Agricultural Weed/Pest Management. Plants 2021, 10, 1418. [Google Scholar] [CrossRef] [PubMed]
  21. Gan, Y.; Liang, C.; Hamel, C.; Cutforth, H.; Wang, H. Strategies for reducing the carbon footprint of field crops for semiarid areas. A review. Agron. Sustain. Dev. 2011, 31, 643–656. [Google Scholar] [CrossRef] [Green Version]
  22. Lal, R. Carbon emission from farm operations. Environ. Int. 2004, 30, 981–990. [Google Scholar] [CrossRef]
  23. Maheswarappa, H.P.; Srinivasan, V.; Lal, R. Carbon Footprint and Sustainability of Agricultural Production Systems in India. J. Crop Improv. 2011, 25, 303–322. [Google Scholar] [CrossRef]
  24. Sah, D.; Devakumar, A.S. The carbon footprint of agricultural crop cultivation in India. Carbon Manag. 2018, 9, 213–225. [Google Scholar] [CrossRef]
  25. Sadik-Zada, E.R.; Ferrari, M. Environmental policy stringency, technical progress and pollution haven hypothesis. Sustainability 2020, 12, 3880. [Google Scholar] [CrossRef]
  26. Meena, R.S.; Kumar, S.; Datta, R.; Lal, R.; Vijayakumar, V.; Brtnicky, M.; Sharma, M.P.; Yadav, G.S.; Jhariya, M.K.; Jangir, C.K.; et al. Impact of Agrochemicals on Soil Microbiota and Management: A Review. Land 2020, 9, 34. [Google Scholar] [CrossRef] [Green Version]
  27. Iqbal, J.; Rehmani, M.; Sagheer, S.; Kaleem, N.; Muneer, J. Herbicidal Potential of Some Dry Land Plants Against Lathyrus aphaca (L.), Winter Season Weed. Planta Daninha 2020, 38, e020171297. [Google Scholar] [CrossRef]
  28. Iqbal, J.; Ditommaso, A.; Rehmani, M.I.A.; Jabran, K.; Hussain, S.; Nasim, W.; Fahad, S.; Shehzad, M.A.; Ali, A. Purple nutsedge (Cyperus rotundus) control through interference by summer crops. Int. J. Agric. Biol. 2019, 21, 1083–1088. [Google Scholar]
  29. Rao, A.; Rao, G.S.; Ratnama, M. Bio-efficacy of sand mix application of pre-emergence herbicides alone and in sequence with imazethapyr on weed control in relay crop of black gram. Pak. J. Weed Sci. Res. 2010, 16, 279–285. [Google Scholar]
  30. Singh, V.P.; Singh, T.P.; Singh, S.; Kumar, A.; Satyawali, K.; Banga, A.; Bisht, N.; Singh, R. Weed management in blackgram with pre-mix herbicides. Indian J. Weed Sci. 2016, 52, 340–345. [Google Scholar] [CrossRef]
  31. Singh, K.; Kumari, A.; Rinwa, R.S.; Singh, S. Effect of Different Temperature Regimes on Persistence of Imazethapyr and Trifluralin. Indian J. Weed Sci. 2010, 42, 88–94. [Google Scholar]
  32. Underwood, M.G.; Soltan, N.; Hooker, D.C.; Robinson, D.E.; Vink, J.P.; Swanton, C.J.; Sikkema, P.H. Weed control, environmental impact, and net-profit of two-pass Weed Management strategies in dicamba-resistant soybean (Glycine max) using conventional tillage. Am. J. Plant Sci. 2017, 8, 3414–3428. [Google Scholar] [CrossRef] [Green Version]
  33. Alipour, A.; Veisi, H.; Darijani, F.; Mirbagheri, B.; Behbahani, A. Study and determination of energy consumption to produce conventional rice in the Guilan province. Res. Agric. Eng. 2012, 58, 99–106. [Google Scholar] [CrossRef] [Green Version]
  34. Singh, J. On Farm Energy Use Pattern in Different Cropping Systems in Haryana, India. Master’s Thesis, International Institute of Management, University of Flensburg, Flensburg, Germany, 2002. [Google Scholar]
  35. Ozkan, B.; Kurklu, A.; Akcaoz, H. An input–output energy analysis in greenhouse vegetable production: A case study for Antalya region of Turkey. Biomass Bioenergy 2004, 26, 89–95. [Google Scholar] [CrossRef]
  36. Elsoragaby, S.; Yahya, A.; Mahadi, M.R.; Nawi, N.M.; Mairghany, M. Energy utilization in major crop cultivation. Energy 2019, 173, 1285–1303. [Google Scholar] [CrossRef]
  37. Devasenapathy, P.; Senthilkumar, G.; Shanmugam, P. Energy management in crop production. Indian J. Agron. 2009, 54, 80–90. [Google Scholar]
  38. Mittal, J.P.; Dhawan, K.C. Research Manual on Energy Requirements in Agricultural Sector; ICAR: New Delhi, India, 1988. [Google Scholar]
  39. Gopalan, C.; Rama Sastri, B.; Balasubramanian, B. Nutritive Value of Indian Foods; National Institute of Nutrition, Indian Council of Medical Research: Hyderabad, India, 2006. [Google Scholar]
  40. Suri, S.K.; Dwivedi, M.; Puniya, R.; Sharma, A.; Kumar, R.; Kumar, J.; Rai, A.; Singh, V. Production potential and economic feasibility of blackgram (Vigna mungo L.)+ sesame (Sesamum indicum L.) intercropping under rainfed ecosystems of Jammu. Legume Res.-Int. J. 2020, 43, 370–377. [Google Scholar] [CrossRef]
  41. Singh, M.; Pal, S.; Thakur, R.; Verma, U. Energy input-output relationship of cropping systems. Indian J. Agric. Sci. 1997, 67, 262–264. [Google Scholar]
  42. Kumar, A.; Rana, K.S.; Choudhary, A.K.; Bana, R.S.; Sharma, V.K.; Prasad, S.; Gupta, G.; Choudhary, M.; Pradhan, A.; Rajpoot, S.K.; et al. Energy budgeting and carbon footprints of zero-tilled pigeonpea–wheat cropping system under sole or dual crop basis residue mulching and Zn-fertilization in a semi-arid agro-ecology. Energy 2021, 231, 120862. [Google Scholar] [CrossRef]
  43. West, T.O.; Marland, G. A synthesis of carbon sequestration, carbon emissions, and net carbon flux in agriculture: Comparing tillage practices in the United States. Agric. Ecosyst. Environ. 2002, 91, 217–232. [Google Scholar] [CrossRef]
  44. Wang, H.; Yang, Y.; Zhang, X.; Tian, G. Carbon Footprint Analysis for Mechanization of Maize Production Based on Life Cycle Assessment: A Case Study in Jilin Province, China. Sustainability 2015, 7, 15772–15784. [Google Scholar] [CrossRef] [Green Version]
  45. Lal, B.; Gautam, P.; Nayak, A.K.; Panda, B.B.; Bihari, P.; Tripathi, R.; Shahid, M.; Guru, P.K.; Chatterjee, D.; Kumar, U.; et al. Energy and carbon budgeting of tillage for environmentally clean and resilient soil health of rice-maize cropping system. J. Clean. Prod. 2019, 226, 815–830. [Google Scholar] [CrossRef]
  46. Choodonwai, A. Carbon and Water Footprint Analysis of Super Absorbent Polymer. Master’s Thesis, Kasetsart University, Bangkok, Thailand, 2018. [Google Scholar]
  47. Liu, J.; Chen, S.; Wang, H.; Chen, X. Calculation of Carbon Footprints for Water Diversion and Desalination Projects. Energy Procedia 2015, 75, 2483–2494. [Google Scholar] [CrossRef] [Green Version]
  48. Rangaswamy, R. A Textbook of Agricultural Statistics, 2nd ed.; New Age International Publishers: Delhi, India, 1995. [Google Scholar]
  49. Chandel, S.R.S. A Handbook of Agricultural Distribution; Achal Singh Chandel Publishers: Kanpur, India, 2016. [Google Scholar]
  50. Kundu, R.; Brahmachari, K.; Bera, P.; Kundu, C.; Roychoudhary, S. Bioefficacy of imazethapyr on the predominant weeds in soybean. J. Crop Weed 2011, 7, 173–178. [Google Scholar]
  51. Singh, R.; Verma, S.; Singh, R. Weed management in groundnut with imazethapyr+ surfactant. Indian J. Weed Sci. 2014, 46, 302–304. [Google Scholar]
  52. Tamang, D.; Nath, R.; Sengupta, K. Effect of herbicide application on weed management in green gram [Vigna radiata (L.) Wilczek]. Adv. Crop Sci. Technol. 2015, 3, 163. [Google Scholar]
  53. Panda, S.; Lal, S.; Kewat, M.; Sharma, J.; Saini, M.K. Weed control in soybean with propaquizafop alone and in mixture with imazethapyr. Indian J. Weed Sci. 2015, 47, 31–33. [Google Scholar]
  54. Mishra, P.; Singh, H.; Babu, S.; Pal, S. Bio-efficacy of some early post-emergence herbicides in soybean (Glycine max L.). Ann. Agric. Res. 2013, 34, 81–87. [Google Scholar]
  55. Mishra, P.; Samaiya, R.; Khandait, V. Herbicidal effect of Propaquizafop, imazethapyr and pendimethalin on seed quality parameters of black gram (Vigna mungo L.). J. Pharmacogn. Phytochem. 2019, SP2, 117–119. [Google Scholar]
  56. Tilgam, M.; Shyam, M. Effect of imezathyper and its combination with imezamox on nodulation and economic yield of blackgram. J. Pharmacogn. Phytochem. 2019, SP5, 103–106. [Google Scholar]
  57. Reddy, N.R.M.; Subramanyam, D.; Sumathi, V.; Umamahesh, V.; Sagar, G.K. Performance of ready-mix herbicides for weed control in blackgram. Indian J. Weed Sci. 2021, 53, 104–106. [Google Scholar] [CrossRef]
  58. Malhi, G.S.; Rana, M.C.; Rana, S.S.; Kaushik, P. Effect of individual or combined application of herbicide imazethapyr on nutrient uptake by Blackgram (Vigna mungo L.). J. Exp. Biol. Agric. Sci. 2020, 8, 441–446. [Google Scholar] [CrossRef]
Figure 1. Location map of the experimental site.
Sustainability 13 13239 g001
Figure 2. Mean weekly weather data during the crop season at the experimental site.
Sustainability 13 13239 g002
Figure 3. Experimental layout at site.
Sustainability 13 13239 g003
Table 1. Energy equivalents of the agricultural inputs and outputs used.
S.no.InputsUnitsUnit Energy Equivalent
(MJ unit−1)
References
1.Machinery (tractor)H64.8[16,34,35,36,37]
2.DieselL56.31[38]
3.Seedskg13.96[39,40]
4.Human powerMan-hour1.96[16,38]
5.Nitrogenkg60.6[16,37,41]
6.Phosphoruskg11.1[16,37,41]
7.Potassiumkg20.9[16,37,41]
8.Herbicideskg0.288[10,42]
9.InsecticideL118.5[42,43]
10.ElectricityKWh11.93[10,38]
11.Waterm31.02[10]
Output
1.Grainskg13.96[39,40]
2.Strawkg12.5[37,41]
Table 2. Carbon emission equivalents of the inputs and outputs used in the present study.
InputsUnitsCarbon Emission CoefficientReference
Seedskg0.32[44]
Human laborMan-day0.23[45]
MachineryH0.89[45]
DieselL0.94[22,45]
Water applicationm30.17[46]
Nitrogenkg1.3[22,47]
Phosphoruskg0.2[16,45]
Potassiumkg0.15[16,45]
Insecticidekg a.i.5.1[22]
Herbicidekg a.i.6.3[22]
Strawkg0.44[16,22]
Table 3. Influence of weed control treatments on weed count in blackgram.
Echinochloa colonaDactyloctenium aegyptiumCyperus iriaOther Weeds
Weed Management TreatmentsCount (No. m−2)Count (No. m−2)Count (No. m−2)Count (No. m−2)
30 DAS60 DASHarvest30 DAS60 DASHarvest30 DAS60 DASHarvest30 DAS60 DASHarvest
T18.9 c
(80.0)
9.7 cd
(96.0)
9.5 de
(90.7)
7.3 c
(53.3)
8.6 c
(74.7)
8.3 c
(69.3)
4.6 bc
(21.3)
5.2 c
(26.7)
4.1 b
(16.0)
3.5 a
(16.0)
1.8 a
(5.3)
2.8 b
(16.0)
T27.3 c
(53.3)
8.9 c
(80.0)
8.0 c
(64.0)
6.5 bc
(42.7)
8.0 c
(64.0)
6.5 b
(42.7)
4.1 bc
(16.0)
4.6 b
(21.3)
1.8 a
(5.3)
2.4 a
(10.7)
0.7 a
(0.0)
0.7 a
(0.0)
T314.0 e
(197.3)
13.4 e
(181.3)
12.2 e
(149.3)
10.3 d
(106.7)
9.8 c
(96.0)
8.7 c
(74.7)
5.7 c
(32.0)
4.6 b
(21.3)
2.9 a
(10.7)
0.7 a
(0.0)
0.7 a
(0.0)
0.7 a
(0.0)
T413.4 e
(181.3)
12.4 e
(154.7)
11.1 e
(122.7)
9.8 d
(96.0)
8.9 c
(80.0)
8.3 c
(69.3)
5.2 c
(26.7)
4.6 b
(21.3)
2.9 a
(10.7)
0.7 a
(0.0)
0.7 a
(0.0)
0.7 a
(0.0)
T56.1 bc
(37.3)
7.3 b
(53.3)
6.5 b
(42.7)
5.2 b
(26.7)
6.5 bc
(42.7)
5.2 c
(26.7)
0.7 a
(0.0)
1.8 a
(5.3)
1.8 a
(5.3)
3.5 a
(16.0)
1.8 a
(5.3)
0.7 a
(0.0)
T64.6 b
(21.3)
5.6 b
(32.0)
5.0 b
(26.7)
3.5 b
(16.0)
5.2 b
(26.7)
4.6 a
(21.3)
0.7 a
(0.0)
0.7 a
(0.0)
0.7 a
(0.0)
1.8 a
(5.3)
0.7 a
(0.0)
0.7 a
(0.0)
T711.3 d
(128.0)
10.8 de
(117.3)
10.1 de
(101.3)
9.5 d
(90.7)
8.7 c
(74.7)
8.0 bc
(64.0)
4.6 bc
(21.3)
4.6 b
(21.3)
1.8 a
(5.3)
0.7 a
(0.0)
0.7 a
(0.0)
0.7 a
(0.0)
T810.8 d
(117.3)
10.4 d
(106.7)
9.3 d
(85.3)
8.6 c
(74.7)
8.0 c
(64.0)
7.3 b
(53.3)
4.6 bc
(21.3)
4.1 b
(16.0)
0.7 a
(0.0)
0.7 a
(0.0)
0.7 a
(0.0)
0.7 a
(0.0)
T98.6 c
(74.6)
10.0 c
(101.3)
8.3 c
(69.3)
8.0 c
(64.0)
9.5 c
(90.7)
8.9 c
(80.0)
4.6 bc
(21.3)
5.2 c
(26.7)
4.0 b
(16.0)
1.8 a
(5.3)
1.8 a
(5.3)
4.6 b
(21.3)
T106.9 c
(48.0)
8.3 c
(69.3)
7.2 c
(53.3)
6.1 bc
(37.3)
6.9 bc
(48.0)
5.6 a
(32.0)
2.9 b
(10.6)
2.9 b
(10.7)
1.8 a
(5.3)
1.8 a
(5.3)
0.7 a
(0.0)
0.7 a
(0.0)
T110.7 a
(0.0)
0.7 a
(0.0)
0.7 a
(0.0)
0.7 a
(0.0)
2.9 a
(10.7)
4.1 a
(16.0)
0.7 a
(0.0)
0.7 a
(0.0)
0.7 a
(0.0)
0.7 a
(0.0)
0.7 a
(0.0)
0.7 a
(0.0)
T1214.8 e
(218.7)
18.6 f
(346.7)
16.8 f
(282.7)
11.1 d
(122.7)
14.2 d
(202.7)
13.0 d
(170.7)
7.5 d
(58.7)
10.5 d
(112.0)
6.9 c
(48.0)
0.7 a
(0.0)
0.7 a
(0.0)
2.8 b
(16.0)
Value in parentheses indicate the means of original values. Data transformed to square root transformations ( x + 0.5 ). T1 pre-emergence (PRE) application of imazethapyr (10 SL) @ 70 g ha−1(IM70); T2 (ΩPRE application of IM @ 80 g ha−1(IM80)); T3 (post-emergence (POST), 3–4 leaf stage) application of IM70; T4 POST application of IM80; T5 PRE application of ready mix blend IM + imazamox (35% WG) @ 70 g ha−1(IM/IMM 70); T6 PRE application of ready mix blend IM/IMM 80; T7 POST application of ready mix blend of IM/IMM 70; T8 POST application of ready mix blend IM/IMM80; T9 PRE application of pendimethalin 30 EC (PENDI) @ 1000 g ha−1; T10 PRE application of IM/PENDI @ 1000 g ha−1; T11, two hand weedings (HW) at 25 and 45 days after sowing (DAS); T12, unweeded check (CK) (without weed control). Means followed by different alphabets are statistically different as per LSD post hoc test (p < 0.05).
Table 4. Influence of weed control treatments on dry matter accumulation of weeds in blackgram.
EchinochloacolonaDactyloctenium aegyptiumCyperus iriaOther Weeds
Weed Management TreatmentsDry Matter (g m−2)Dry Matter (g m−2)Dry Matter (g m−2)Dry Matter (g m−2)
30 DAS60 DASHarvest30 DAS60 DASHarvest30 DAS60 DASHarvest30 DAS60 DASHarvest
T14.2 c
(17.3)
5.6 d
(31.1)
6.5 c
(42.2)
2.2 cd
(4.4)
4.5 cd
(20.2)
5.6 c
(31.6)
2.0 b
(3.5)
2.9 c
(8.2)
2.8 b
(7.4)
1.2 a
(1.1)
1.0 a
(0.8)
1.1 a
(1.2)
T23.6 c
(12.8)
5.1 c
(25.5)
5.4 c
(28.7)
2.1 c
(3.7)
4.0 c
(15.3)
4.6 b
(20.6)
1.8 b
(2.8)
2.6 b
(6.6)
1.4 a
(2.4)
0.8 a
(0.1)
0.7 a
(0.0)
0.7 a
(0.0)
T37.3 ef
(53.6)
8.1 e
(65.1)
8.9 e
(79.6)
3.5 e
(11.9)
5.5 d
(29.5)
6.2 c
(37.9)
2.5 c
(5.8)
2.7 b
(6.9)
2.2 a
(5.1)
0.7 a
(0.0)
0.7 a
(0.0)
0.7 a
(0.0)
T47.0 e
(48.5)
7.5 e
(56.3)
8.1 de
(66.1)
3.3 e
(10.4)
5.1 d
(25.6)
6.0 c
(35.7)
2.3 c
(4.9)
2.7 b
(7.0)
2.1 a
(5.1)
0.7 a
(0.0)
0.7 a
(0.0)
0.7 a
(0.0)
T53.0 b
(8.7)
4.1 b
(16.0)
4.6 bc
(20.5)
1.6 b
(1.2)
3.3 b
(10.6)
3.6 a
(12.9)
0.7 a
(0.0)
1.2 a
(1.5)
1.4 a
(2.4)
1.1 a
(0.9)
1.1 a
(0.8)
0.7 a
(0.0)
T62.4 b
(5.2)
3.2 b
(9.9)
3.5 b
(12.7)
1.3 b
(1.4)
3.1 b
(9.2)
3.3 a
(10.6)
0.7 a
(0.0)
0.7 a
(0.0)
0.7 a
(0.0)
0.8 a
(0.2)
0.7 a
(0.0)
0.7 a
(0.0)
T76.0 d
(36.2)
6.5 d
(42.0)
7.6 d
(56.8)
3.3 e
(10.2)
5.0 d
(24.3)
5.8 c
(33.2)
2.1 b
(4.0)
2.7 b
(7.0)
1.4 a
(2.6)
0.7 a
(0.0)
0.7 a
(0.0)
0.7 a
(0.0)
T85.7 d
(32.1)
6.4 d
(40.3)
6.9 d
(47.1)
3.2 e
(9.6)
4.7 cd
(21.4)
5.2 c
(26.5)
2.1 b
(3.9)
2.4 b
(5.2)
0.7 a
(0.0)
0.7 a
(0.0)
0.7 a
(0.0)
0.7 a
(0.0)
T94.4 c
(18.9)
5.7 d
(31.7)
5.8 c
(33.7)
2.4 d
(5.1)
4.6 cd
(20.9)
6.1 c
(36.9)
2.0 b
(3.7)
2.9 c
(8.3)
2.8 b
(7.5)
0.8 a
(0.2)
2.2 a
(9.2)
1.9 b
(3.3)
T103.3 b
(10.6)
4.6 c
(20.6)
5.2 c
(28.1)
1.9 c
(3.2)
3.4 b
(10.9)
3.7 b
(13.5)
1.5 b
(1.9)
1.8 b
(3.3)
1.4 a
(2.5)
0.8 a
(0.1)
0.7 a
(0.0)
0.7 a
(0.0)
T110.7 a
(0.0)
0.7 a
(0.0)
0.7 a
(0.0)
0.7 a
(0.0)
1.5 a
(1.9)
2.3 a
(4.9)
0.7 a
(0.0)
0.7 a
(0.0)
0.7 a
(0.0)
0.7 a
(0.0)
0.7 a
(0.0)
0.7 a
(0.0)
T128.1 f
(64.8)
11.7 f
(136.7)
12.4 f
(153)
4.3 f
(18.0)
8.4 e
(69.6)
10.7 d
(116.1)
3.3 d
(10.8)
6.2 d
(38.5)
4.8 c
(23.2)
0.7 a
(0.0)
0.7 a
(0.0)
1.2 a
(1.5)
Value in parentheses indicate the means of original values. Data transformed to square root transformations ( x + 0.5 ). DAS, days after sowing; T1 pre-emergence (PRE) application of imazethapyr (10 SL) @ 70 g ha−1(IM70); T2 (PRE application of IM @ 80 g ha−1(IM80)); T3 (post-emergence (POST), 3–4 leaf stage) application of IM70; T4 POST application of IM80; T5 PRE application of ready mix blend IM + imazamox (35% WG) @ 70 g ha−1(IM/IMM 70); T6 PRE application of ready mix blend IM/IMM 80; T7 POST application of ready mix blend of IM/IMM 70; T8 POST application of ready mix blend IM/IMM80; T9 PRE application of pendimethalin 30 EC (PENDI) @ 1000 g ha−1; T10 PRE application of IM/PENDI @ 1000 g ha−1; T11, two hand weedings (HW) at 25 and 45 days after sowing (DAS); T12, unweeded check (CK) (without weed control). Means followed by different alphabets are statistically different as per LSD post hoc test (p < 0.05).
Table 5. Impact of weed control treatments on the growth and development parameters of blackgram.
Weed Management TreatmentsEmergence Count (No. m−2)No. of Leaves Plant−1 (60 DAS)Days to 50% FloweringDays to MaturityRoot Nodules
Nodule Count Plant−1Dry Weight (mg)
Pre-FloweringPost-FloweringPre-FloweringPost-Flowering
T187.7 a18.3 e44 a77 a19.6 d11.7 c146.7 d95.4 c
T282.1 a18.8 e44 a76 a20.8 e12.6 c163.3 e103.4 d
T381.6 a11.6 b44 a76 a14.8 b8.7 ab118.1 b74.9 b
T487.1 a12.9 bc44 a77 a15.2 b9.3 b129.5 c79.3 b
T583.8 a21.4 f45 a76 a24.4 g16.7 e171.0 e137.5 f
T680.5 a21.8 f45 a78 a27.2 h18.5 f205.0 f150.0 g
T788.2 a14.2 c45 a77 a16.8 c9.6 b148.7 d88.0 c
T889.4 a15.8 d45 a77 a17.1 c10.2 b163.3 e92.3 c
T981.0 a18.8 e45 a77 a18.2 d11.5 c164.5 e94.5 c
T1086.0 a19.4 e46 a77 a22.6 f14.1 d166.1 e121.2 e
T1186.0 a23.9 g47 a77 a30.0 i21.4 g217.5 f171.7 h
T1280.5 a9.0 a42 a76 a11.7 a7.7 a103.5 a61.8 a
Means followed by different alphabets are significantly different as per LSD post hoc test (p < 0.05). DAS, days after sowing; T1 pre-emergence (PRE) application of imazethapyr (10 SL) @ 70 g ha−1(IM70); T2 (PRE application of IM @ 80 g ha−1(IM80)); T3 (post-emergence (POST), 3–4 leaf stage) application of IM70; T4 POST application of IM80; T5 PRE application of ready mix blend IM + imazamox (35% WG) @ 70 g ha−1(IM/IMM 70); T6 PRE application of ready mix blend IM/IMM 80; T7 POST application of ready mix blend of IM/IMM 70; T8 POST application of ready mix blend IM/IMM80; T9 PRE application of pendimethalin 30 EC (PENDI) @ 1000 g ha−1; T10 PRE application of IM/PENDI @ 1000 g ha−1; T11, two hand weedings (HW) at 25 and 45 days after sowing (DAS); T12, unweeded check (CK) (without weed control).
Table 6. Impact of weed control treatments on growth, yield attributes and yield of blackgram.
TreatmentPlant Population
(No. m−2)
No. of Branches Plant−1Pods Per Plant
(No. Plant−1)
Seeds Per Pod
(No. Pod−1)
1000- Seed Weight (g)Nitrogen Content in Seeds (%)Protein Content in Seeds (%)Seed Yield (kg ha−1)Straw Yield (kg ha−1)
T130.0 a4.6 d18.1 d6.3 d39.5 c3.6 b22.5 bc1174.6 de2193.7 d
T231.1 a5.2 e19.5 d6.5 e40.2 c3.6 bc22.7 c1269.8 e2247.6 d
T331.1 a3.3 b13.1 a5.3 b37.9 b3.3 ab20.8 ab761.9 b1346.0 b
T430.5 a3.4 b14.0 b5.7 c38.4 b3.4 ab21.1 ab952.4 c1765.1 c
T529.4 a5.7 f26.4 g6.9 f41.4 d3.8 c23.5 cd1396.8 f2631.7 ef
T630.0 a6.2 g29.3 h7.4 g42.9 e3.8 c23.9 d1492.1 f2755.6 f
T731.6 a3.5 b14.1 b5.8 c38.5 b3.4 ab21.5 b984.1 c1904.8 cd
T831.6 a3.8 c14.2 b5.9 c38.9 b3.5 b21.9 bc1047.6 cd2076.2 d
T931.1 a4.1 c16.0 c6.1 d39.7 cd3.6 bc22.4 bc1142.9 d2066.7 d
T1030.1 a5.5 f21.5 e6.6 e40.4 cd3.7 bc23.3 cd1301.6 e2507.9 e
T1128.9 a5.6 f23.3 f6.7 ef40.6 d3.7 bc23.4 cd1333.3 e2536.5 e
T1227.8 a2.9 a11.7 a4.6 a34.6 a3.2 a20.1 a476.2 a1098.4 a
Means followed by different alphabets are significantly different as per LSD post hoc test (p < 0.05). T1 pre-emergence (PRE) application of imazethapyr (10 SL) @ 70 g ha−1(IM70); T2 (PRE application of IM @ 80 g ha−1(IM80)); T3 (post-emergence (POST), 3–4 leaf stage) application of IM70; T4 POST application of IM80; T5 PRE application of ready mix blend IM + imazamox (35% WG) @ 70 g ha−1(IM/IMM 70); T6 PRE application of ready mix blend IM/IMM 80; T7 POST application of ready mix blend of IM/IMM 70; T8 POST application of ready mix blend IM/IMM80; T9 PRE application of pendimethalin 30 EC (PENDI) @ 1000 g ha−1; T10 PRE application of IM/PENDI @ 1000 g ha−1; T11, two hand weedings (HW) at 25 and 45 days after sowing (DAS); T12, unweeded check (CK) (without weed control).
Table 7. Energy inputs used in various weed management treatments in blackgram.
TreatmentsTotal Energy Used in Herbicide (MJ ha−1)Labour Used in Hand Weeding/Spraying (MD ha−1)Energy Used in Hand Weeding/Spraying (MJ ha−1)Knapsack Sprayer Used (h ha−1)Energy Used by Knapsack Sprayer (MJ ha−1)Water Used (m3 ha−1)Energy Used by Water (MJ ha−1)Total Energy (MJ ha−1)
T120.161631.36162.720.60.61254.85
T223.041631.36162.720.60.61257.73
T320.161631.36162.720.60.61254.85
T423.041631.36162.720.60.61257.73
T520.161631.36162.720.60.61254.85
T623.041631.36162.720.60.61257.73
T720.161631.36162.720.60.61254.85
T823.041631.36162.720.60.61257.73
T9288.001631.36162.720.60.612322.69
T10288.001631.36162.720.60.612322.69
T11-400784.00----784.00
T12--------
T1 pre-emergence (PRE) application of imazethapyr (10 SL) @ 70 g ha−1(IM70); T2 (PRE application of IM @ 80 g ha−1(IM80)); T3 (post-emergence (POST), 3–4 leaf stage) application of IM70; T4 POST application of IM80; T5 PRE application of ready mix blend IM + imazamox (35% WG) @ 70 g ha−1(IM/IMM 70); T6 PRE application of ready mix blend IM/IMM 80; T7 POST application of ready mix blend of IM/IMM 70; T8 POST application of ready mix blend IM/IMM80; T9 PRE application of pendimethalin 30 EC (PENDI) @ 1000 g ha−1; T10 PRE application of IM/PENDI @ 1000 g ha−1; T11, two hand weedings (HW) at 25 and 45 days after sowing (DAS); T12, unweeded check (CK) (without weed control). Means followed by different alphabets are statistically different as per LSD post hoc test (p < 0.05).
Table 8. Total input and output energy of weed management in blackgram.
TreatmentSeed Yield (kg ha−1)Output Energy by Seed
(MJ ha−1)
Straw Yield
(kg ha−1)
Output Energy by Straw
(MJ ha−1)
Total Output Energy
(MJ ha−1)
Total Input Energy
(MJ ha−1)
Net Energy (MJ ha−1)
T11174.616,397.422193.727,421.243,818.676679.77337,138.89
T21269.817,726.412247.628,095.045,821.416682.65339,138.76
T3761.910,636.121346.016,825.027,461.126679.77320,781.35
T4952.413,295.501765.122,063.835,359.256682.65328,676.60
T51396.819,499.332631.732,896.252,395.586679.77345,715.81
T61492.120,829.722755.634,445.055,274.726682.65348,592.06
T7984.113,738.041904.823,810.037,548.046679.77330,868.26
T81047.614,624.502076.225,952.540,577.006682.65333,894.34
T91142.915,954.882066.725,833.841,788.636947.61334,841.02
T101301.618,170.342507.931,348.849,519.096947.61342,571.47
T111333.318,612.812536.531,706.250,319.127409.02342,910.10
T12476.06644.961098.013,725.020,369.966625.02013,744.94
T1 pre-emergence (PRE) application of imazethapyr (10 SL) @ 70 g ha−1(IM70); T2 (PRE application of IM @ 80 g ha−1(IM80)); T3 (post-emergence (POST), 3–4 leaf stage) application of IM70; T4 POST application of IM80; T5 PRE application of ready mix blend IM + imazamox (35% WG) @ 70 g ha−1(IM/IMM 70); T6 PRE application of ready mix blend IM/IMM 80; T7 POST application of ready mix blend of IM/IMM 70; T8 POST application of ready mix blend IM/IMM80; T9 PRE application of pendimethalin 30 EC (PENDI) @ 1000 g ha−1; T10 PRE application of IM/PENDI @ 1000 g ha−1; T11, two hand weedings (HW) at 25 and 45 days after sowing (DAS); T12, unweeded check (CK) (without weed control).
Table 9. Effect of weed management treatments on energy indices.
TreatmentEnergy Use EfficiencyEnergy Productivity (kg MJ−1)Energy Intensiveness (MJ INR−1)Energy ProfitabilitySpecific Energy (MJ kg−1)Energy Intensity in Physical Term (MJ kg−1)Energy Intensity in Economic Term (MJ INR−1)
T16.560.180.255.565.691.981.64
T26.860.190.255.865.261.901.71
T34.110.110.253.118.773.171.03
T45.290.140.254.297.022.461.32
T57.840.210.256.844.781.661.92
T68.270.220.247.274.481.572.01
T75.620.150.254.626.792.311.38
T86.070.160.245.076.382.141.47
T96.010.160.265.016.082.161.56
T107.130.190.256.135.341.821.80
T116.790.180.235.795.561.911.54
T123.070.070.272.0713.924.210.82
T1 pre-emergence (PRE) application of imazethapyr (10 SL) @ 70 g ha−1(IM70); T2 [PRE application of IM @ 80 g ha−1(IM80)]; T3 [post-emergence (POST, 3–4 leaf stage) application of IM70]; T4 POST application of IM80; T5 PRE application of ready mix blend IM + imazamox (35% WG) @ 70 g ha−1(IM/IMM 70); T6 PRE application of ready mix blend IM/IMM 80; T7 POST application of ready mix blend of IM/IMM 70; T8 POST application of ready mix blend IM/IMM80; T9 PRE application of pendimethalin 30 EC (PENDI) @ 1000 g ha−1; T10 PRE application of IM/PENDI @ 1000 g ha−1; T11, two hand weedings (HW) at 25 and 45 days after sowing (DAS); T12, unweeded check (CK) (without weed control).
Table 10. Effect of weed management treatments on carbon consumption, carbon output and carbon footprints in blackgram crop.
TreatmentHerbicide (a.i.)/
Labor (Man Days)
C Inputs of Weed Management
(kg CE ha−1)
Common C Inputs of Other Inputs
(kg CE ha−1)
Total C Input
(kg CE ha−1)
Carbon Output by Grains
(kg CE ha−1)
Carbon Output by Straw
(kg CE ha−1)
Total Carbon Output
(kg CE ha−1)
Carbon EfficiencyCarbon Sustainability Index (CSI)Carbon Footprint (kg CE kg−1 Yield)
T10.74.41168.18172.59375.872965.231341.107.776.770.15
T20.85.04168.18173.22406.336988.941395.288.057.050.14
T30.74.41168.18172.59243.808592.24836.054.843.840.23
T40.85.04168.18173.22304.768776.641081.416.245.240.18
T50.10.63168.18168.81446.9761157.951604.929.518.510.12
T60.10.72168.18168.90477.4721212.461689.9410.019.010.11
T70.10.63168.18168.81314.912838.111153.026.835.830.17
T80.10.72168.18168.90335.232913.531248.767.396.390.16
T93.321.00168.18189.18365.728909.351275.086.745.740.17
T103.119.69168.18187.87416.5121103.481519.998.097.090.14
T1150.011.50168.18179.68426.6561116.061542.728.597.590.13
T12--168.18168.18152.320483.12635.443.782.780.35
T1 pre-emergence (PRE) application of imazethapyr (10 SL) @ 70 g ha−1(IM70); T2 [PRE application of IM @ 80 g ha−1(IM80)]; T3 [post-emergence (POST, 3–4 leaf stage) application of IM70]; T4 POST application of IM80; T5 PRE application of ready mix blend IM + imazamox (35% WG) @ 70 g ha−1(IM/IMM 70); T6 PRE application of ready mix blend IM/IMM 80; T7 POST application of ready mix blend of IM/IMM 70; T8 POST application of ready mix blend IM/IMM80; T9 PRE application of pendimethalin 30 EC (PENDI) @ 1000 g ha−1; T10 PRE application of IM/PENDI @ 1000 g ha−1; T11, two hand weedings (HW) at 25 and 45 days after sowing (DAS); T12, unweeded check (CK) (without weed control).
Table 11. Economic analysis of weed control treatments.
TreatmentGross Returns (INR ha−1)Cost of Cultivation
(INR ha−1)
Gross Return Due to Weed Control (INR ha−1)Cost of Weed Control
(INR ha−1)
Net Returns (INR ha−1)MBCR
T1159,53226,65593,947167992,26855.0
T2172,51426,846106,9291869105,06056.2
T3103,49926,65537,914167936,23521.6
T4129,66226,84664,077186962,20833.3
T5190,32127,234124,7362258122,47854.2
T6203,10427,511137,5192544134,97553.1
T7134,26727,23468,682225866,42429.4
T8143,09927,51177,514254474,97029.5
T9155,85926,82190,274184588,42947.9
T10177,63927,484112,0542508109,54643.7
T11181,65632,631116,0718500107,57112.7
T1265,58524,977000-
T1 pre-emergence (PRE) application of imazethapyr (10 SL) @ 70 g ha−1(IM70); T2 [PRE application of IM @ 80 g ha−1(IM80)]; T3 [post-emergence (POST, 3–4 leaf stage) application of IM70]; T4 POST application of IM80; T5 PRE application of ready mix blend IM + imazamox (35% WG) @ 70 g ha−1(IM/IMM 70); T6 PRE application of ready mix blend IM/IMM 80; T7 POST application of ready mix blend of IM/IMM 70; T8 POST application of ready mix blend IM/IMM80; T9 PRE application of pendimethalin 30 EC (PENDI) @ 1000 g ha−1; T10 PRE application of IM/PENDI @ 1000 g ha−1; T11, two hand weedings (HW) at 25 and 45 days after sowing (DAS); T12, unweeded check (CK) (without weed control); INR, Indian Rupee; MBCR, marginal benefit cost-ratio.
Publisher’s Note: MDPI stays neutral with regard to jurisdictional claims in published maps and institutional affiliations.

