Article

Sustainable Circular Micro Index for Evaluating Virtual Substitution Using Machine Learning with the Path Planning Problem as a Case Study

by
Javier Maldonado-Romo
* and
Mario Aldape-Pérez
Postgraduate Department, Instituto Politécnico Nacional, CIDETEC, Mexico City 07700, Mexico
*
Author to whom correspondence should be addressed.
Sustainability 2021, 13(23), 13436; https://0-doi-org.brum.beds.ac.uk/10.3390/su132313436
Submission received: 15 November 2021 / Revised: 29 November 2021 / Accepted: 29 November 2021 / Published: 4 December 2021
(This article belongs to the Special Issue Application of Artificial Intelligence in Sustainable Manufacturing)

Abstract

:
Due to the problems resulting from the COVID-19 pandemic, for example, semiconductor supply shortages impacting the technology industry, micro-, small-, and medium-sized enterprises have been affected because the profitability of their business models depends on market stability. Therefore, it is essential to propose alternatives to mitigate the various consequences, such as the high costs. One attractive alternative is to replace the physical elements using resource-limited devices powered by machine learning. Novel features can improve the embedded devices’ (such as old smartphones) ability to perceive an environment and be incorporated in a circular model. However, it is essential to measure the impact of substituting the physical elements employing an approach of a sustainable circular economy. For this reason, this paper proposes a sustainable circular index to measure the impact of the substitution of a physical element by virtualization. The index is composed of five dimensions: economic, social, environmental, circular, and performance. In order to describe this index, a case study was employed to measure the path-planning generator for micro aerial vehicles developed using virtual simulation using machine-learning methods. The proposed index allows considering virtualization to extend the life cycle of devices with limited resources based on suggested criteria. Thus, a smartphone and the Jetson nano board were analyzed as replacements of specialized sensors in controlled environments.

1. Introduction

Economic development is fundamental for the progress and quality of life of the population. Likewise, it has a relationship with society, the effects of which are immediately reflected in the environment [1]. For this reason, in 1983, the United Nations (UN) established the World Commission on Development and Environment, whose objective is principally to analyze issues related to the development and the environment and to promote the commitment of organizations, companies, and governments. This commission, in the report entitled Our Common Future in 1987, likewise known as the Brundtland report, the term sustainable development appeared for the first time, defined as meeting the needs of the present without compromising the ability of future generations to meet their own needs [2]. Furthermore, members of the UN provided a shared blueprint for peace and prosperity for people and the planet in 2015. At its heart are the 17 Sustainable Development Goals (SDGs), which represent an urgent call for action by all developed and developing countries in a global partnership [3].
Although the SDGs were meant to be obtained by 2030, the COVID-19 pandemic has had impacts that could delay their aims [4]. Likewise, this situation has caused decreased supply and increased demand for products such as semiconductors [5]. Due to the scarcity of silicon, the prices of raw materials have increased. Therefore, the development of products and services in the technology industry can result in complications in a short time frame.
One of the main keys to achieving sustainable development is changing our perspective regarding goods production. The two main perspectives are the linear economy (Figure 1a) and the circular economy (CE) (Figure 1b). In the first perspective, the production of goods damages the environment by generating waste. Despite involving recycling activities, this perspective is not sufficient because resources are limited. On the other hand, the CE perspective reduces waste and helps restore the environment. Likewise, one of the main advantages of the CE over the linear economy is the control of the scarcity and shortage of resources [6].
Furthermore, the CE has the characteristic of utilizing elements that are considered waste in such a way that an economic value is obtained during the life cycle of a product or service. Therefore, the damage to the environment is reduced. However, it is challenging to measure the impact of the benefits in this economic approach compared to the linear economy.
Different organizations have implemented tools to measure the CE. For example, the Ellen MacArthur Foundation employed a tool to implement a circular economy model called the ReSOLVE framework [7]. The foundation quantifies the impact of the CE model with the Circulytics platform [8]. However, the platform is of limited use as large companies or organizations essentially use it because their actions have a more significant impact on the pillars of sustainability. Furthermore, there are tools such as Higg MSI, which is an index to measure the economic, social, environmental, and technological impacts on the manufacturing of products [9].
Although the CE model is designed to avoid conflicts in the market, some economic sectors have still not implemented circular models. For example, the generation of products based on the Industry 4.0 concept provides significant opportunities to reshape the conventional business operations and effectively cope with unanticipated supply chain breakdowns [10]. Sustainability and CE models have been used to reduce greenhouse gas emissions to the atmosphere. Nevertheless, one of the most critical challenges is that the industry needs to produce innovative goods.
As one of Industry 4.0’s features, the number of devices connected to the Internet has grown exponentially. According to [11], in 2008, there were 500 million connected devices. However, by 2020, it was estimated that at least 50 billion devices would be used. It is important to note that, on average, there are approximately seven devices per person, and this number is increasing.
One cause of the increase in mobile devices is the generation of electronic waste (e-waste) [12]. Around 50 million tons of e-waste were generated worldwide, 10% of which is due to smartphones [13]. In 2017, about 700 million devices were hibernating, meaning they were not being used, and it was estimated that about 5–10% were recycled. Likewise, factors such as embedded batteries, broken screens, and difficulty repairing the devices are some determinants that result in a user using a device only for 21.6 months [14]. In this way, smartphones have an end of life, and four alternatives can be highlighted. Figure 2 illustrates the life cycle of a smartphone.
On the other hand, based on the artificial intelligence (AI) definition: it is the field of science that helps machines in the ability to improve their functions; in areas of logic, reasoning, planning, learning, and perception [15]. A system with limited features can get advanced features through analysis of the environment to low costs. Consequently, the AI techniques can replace limited elements for potentializing their characteristics from using data to solve tasks and not affect the behavior in technological development activities.
According to [16], one of the strategies proposed to achieve a CE is through virtualization, which creates a simulated, or virtual, computing environment as opposed to a physical environment. Virtualization often includes computer-generated versions of hardware, operating systems, storage devices, and more [17]. Therefore, virtualization can replace specific tasks with limited devices employing enhanced features using artificial intelligence methods.
A proposal for adding innovative functionality to devices with limited features is presented in [18]. This previous work describes a methodology to use machine learning (ML) methods to reduce a complex architecture to reuse smartphones. In this case, the path planning problem was solved through embedded devices, whose principal goal is obstacle avoidance achieving close to 90%. In this way, virtualization of simulated tasks using smartphones can be an alternative to extend their life cycle, as shown in Figure 3a. Likewise, virtual substitution can be part of the CE model ([19]) to establish a service or replace a physical element in a manufacturing procedure, as is shown in Figure 3b. Nevertheless, it is necessary to measure the impact generated by this solution to evaluate the replacement of physical devices and a criterion to determine whether the virtual substitution is adequate to be implemented based on the benefit in the proposed five dimensions: economic, social, environmental, circular, and performance.
For this reason, the current proposal describes a methodology to build a circular micro sustainable index to measure the impact of the substitution, optimization, virtualization of physical elements by ML methods. Thus, the main contribution of this work is to measure the impact of the substitution of specialized devices by elements with limited features that try to imitate advanced functions through data analysis, assessing in five dimensions: economic, social, environmental, circularity, and performance. Likewise, a tool and a graphical representation of positive benefits are proposed, and a couple of criteria are used to determine the virtualization feasibility.
The remainder of the paper is organized as follows. The background and research gaps are detailed in Section 2. The proposed work is presented in Section 3. Moreover, a case of study is analyzed for describing the proposed index in Section 4. In the end, the conclusions are presented in Section 5.

2. Background and Research Gaps

Given the importance of controlling waste generation and the deterioration of the environment, interest in implementing alternatives has increased. According to [20], the Triple Bottom Line (TBL) of People, Planet, and Profit have become a practical approach all over the world. This model set up the vital long-term strategies for companies executing the transition to sustainability, based on three essential dimensions of sustainable development: environmental quality, social equity, and economic benefits. Therefore, sustainability is the place where the three dimensions overlap.
Nevertheless, it is not very easy to measure the implementation of sustainable approach perspectives. The following contributions offer contributions to sustainable indexes. For example, a framework for small and medium-sized enterprises is proposed in [21]; a conceptual framework for measuring the suitability of a manufacturing process is described in [22]; a green manufacturing index is introduced in [23]; a tool for measuring the sustainability based on human development is detailed in [24], and an instrument for assessing the progress towards sustainability according to [25].
It should be emphasized that the contributions that measure the factors of sustainability status consider the environment as the priority instead of economic benefits [26]. The previous works share the characteristics of describing the level of impact of sustainability at the macro level, which means that factors are determined at model businesses, enterprise, local, national, and international levels.
On the other hand, Ref [27] recommends that the processes involve a circular economy approach, obtaining a higher profit to generate goods. Ref [28] describes the importance of the CE and the theories and practices to the development of implementation tools. Likewise, there have been developments of indexes that unite the sustainable approach and the circular economy perspective [29]. The indexes are composed of elements that are measurable and related to the same objective. In this way, tools are developed to measure the impact [30]. In addition, [31] establishes a circular model for detecting the benefices for enterprises.
Virtualization is required as a strategy for minimizing resources. Therefore, The following contributions describe the contributions in this field. Due to the digital age, a proposal for achieving a digital circular economy in [32]. A comprehensive study on digital technologies beneficial for a digital circular economy is presented at [33]. Through the approach of connecting devices to the internet, proposals are developed based on data tracking for decision making for the recruitment and use of products shown in the works [34,35].
Likewise, virtual objects can be used to replace some physical elements in order to reduce costs. For example, in the edition of videos to make movies, physical elements have been replaced mainly to develop scenery and costumes, helping to reduce development and economic times for all the physical resources required to provide a good experience [36].
In recent years, terms such as ML have enabled machines to acquire novel features. In this way, devices with limited characteristics can perform specific tasks through the virtual representation of physical elements. In the same way, [37] has implemented the substitution of physical elements by a virtual representation such as the camera with specialized elements for improving images with depth effects self-portrait mode.
Despite the economic impacts of these contributions in cost reduction, they have a very particular objective. Therefore, virtualization strategy has been used to simulate, predict, optimize and improve functions. However, it has not been used extensively to replace physical elements with virtual elements to perform complex tasks.
As virtualization being a current field of research, the tools to estimate a sustainable impact are limited. For this reason, we propose an indicator that allows describing the benefit of five dimensions involved in the substitution of physical elements: economic, social, environmental, circular, and performance. Furthermore, a case study based on path planning is evaluated to determine the relationship between the five proposed dimensions.

3. Procedure to Create the Proposed Micro Index

Due to the features of virtual substitution, complex architectures can be reduced and replace physical elements. Therefore, the index has a limited scope. Since the sustainable index in previous works measures on a macro level, some indicators are inadequate to consider relevant factors because this approach focuses on performing a particular task. In this way, it is proposed a micro index. The following phases compose the procedure.
  • Phase 1—Selection of sustainability, circularity and performance indicators
  • Phase 2—Tool to measure the impact for each dimension
  • Phase 3—Micro index and graphical representation
  • Phase 4—Criterion to evaluate decision

3.1. Phase 1—Selection of Sustainability, Circularity and Performance Indicators

A large number of contributions have identified factors that impact the analysis of sustainability and circular economy. For example, papers [38,39] have identified factors focused on the three dimensions of sustainability. Due to the scope of the factors that have a macro level, a methodology was proposed based on TOPIS-Fuzzy (TF) [40,41] to select the relevant elements for the scope of the micro index, considering the benefit and the distance to order the relevant factors.
The proposed methodology analyzes a linguistic value from different approaches for developing projects focused on the three dimensions that make up sustainability. In this approach, experts are required to determine the impact of each of the sustainability factors. One of the principal challenges for this development is the collaboration with experts related to the relationship of sustainable products. For this reason, the evaluation was made based on the frequency of words to assign a value. For example, Figure 4 presents the distribution of words for the Eco-design approach. The frequency of words offers a level of consideration to assess each factor represented by the linguistic value. Thus, the experts are the following approaches: Life Cycle Assessment (LCA) [42], Eco design [43], Eco-innovation [44], Eco-QFD [45] and Eco-efficiency [46].
The following procedure describes the analysis performed to identify and rank the factors considered to contribute to the evaluation of the proposed index.
Step 1: To define the fuzzy decision matrix, which is represented as described in (1) through a linguistic value (Table 1 [47,48]) to each of the sustainability factors based on the experts approaches.
x i j = ( a i j , b i j , c i j )
Step 2: for each factor, based on the rates of experts, the range and the fuzzy average are determined.
a i j = min k a i j k , b i j = 1 k k = 1 k b i j k , c i j = max k c i j k
Step 3: the fuzzy decision matrix is normalized. In addition, a criterion must be identified to perform the normalization where a benefit criterion is maximized, as is described in (3).
r i j = a i j c j + , b i j c j + c i j c j + a n d c j + = max i c i j ( b e n e f i t )
Step 4: detection of the most similar solutions, as the Fuzzy Negative Ideal Solution (FNIS) through of (4).
A = ( v 1 , v 2 , . . . , v n ) , w h e r e v j = max i v i j 1
Step 5: for ordering the sustainability factors related to the experts is compute the distance from each alternative to the FNIS using (5).
d ( x , y ) = 1 3 [ ( a 1 a 2 ) 2 + ( b 1 b 2 ) 2 + ( c 1 c 2 ) 2 ]
Once the distance has been calculated, the alternatives with the best results are ordered with a distance greater than 0.5. Thus, the factors are considered the most relevant for establishing the micro index. Table 2 describes the results of the selection of sustainability factors.
The factors that determine the CE based on [29] are shown in Table 3. These factors determine the impact of the circularity of an element that stores the virtual representation. In this case, the element to measure the circularity is the embedded system as a smartphone with limited features. Likewise, these factors are evaluated to identify the importance within this dimension using the methodology TF.
Although virtualization is a CE strategy, it is an independent dimension of the micro index called performance. The factors of this dimension are based on the requirements of the computer systems. The management of local resources such as CPU performance, memory performance, and use of space memory [49] are essential parameters to consider. Moreover, the user interface must be helpful for the operator, easy to learn and use. Consequently, the operation must be transparent to the operator. Besides, the system must respond quickly and be unobtrusive. Currently, embedded systems have the excellent computational power to perform operations in a portable way due to their small dimensions compared to personal computers [50]. The time of response is essential [51] when a system achieves at least ten evaluations per second is considered a real-time system. Due to different challenges about using virtual elements with the physical world [52], the accuracy level is essential for validating whether the virtual representation is efficient to replace the physical element. The factors for performance dimension are listed and ordered in Table 4.

3.2. Phase 2—Tool to Measure the Impact for Each Dimension

In order to assign a numerical value to each of the factors of the proposed index, the following sentences in Table 5 are associated by a Likert scale [53] with ten levels based on [54]. Since the dimensions are normalized, indexes can have similar values. Therefore, the weights avoid this issue because of factor receives a value according to the grade of importance.

3.3. Phase 3—Micro Index and Graphical Representation

Once factors are identified, the five dimensions determine a value that describes the state of the benefit obtained. For each dimension the average is calculated environmental (6), social (7), economic (8), circular (9), and performance (10). Subsequently, the averages are calculated to determine the value of the micro index described in (11). In this way, the five dimensions are related by a radar chart shown in Figure 5.
e n v i r o n m e n t a l = e n v i r o n m e n t a l f a c t o r s N u m b e r e n v i r o n m e n t a l f a c t o r s
s o c i a l = s o c i a l f a c t o r s N u m b e r s o c i a l f a c t o r s
e c o n o m i c = e c o n o m i c f a c t o r s N u m b e r e c o n o m i c f a c t o r s
c i r c u l a r = c i r c u l a r f a c t o r s N u m b e r c i r c u l a r f a c t o r s
p e r f o r m a n c e = p e r f o r m a n c e f a c t o r s N u m b e r p e r f o r m a n c e f a c t o r s
m i c r o _ i n d e x = e n v i r o n m e n t a l + s o c i a l + e c o n o m i c + c i r c u l a r + p e r f o r m a n c e 5

3.4. Phase 4—Criterion to Evaluate a Decision

The following scale is proposed in Table 6 to measure the impact of the index. Since the value of the micro index increases when the factors tend to have a better evaluation, the index is divided into quartiles. Accordingly, the quartile with the best evaluation (76–100%), described by the green color, recommends virtualization as a successful substitution alternative. The subsequent quartile (51–75%), represented by the yellow color, describes virtualization as an option of a possible improvement. Nevertheless, virtualization is not advisable as a replacement alternative in the last two quartiles (0–50%), represented by red.
Furthermore, another criterion is proposed to ensure a better decision. The criterion is based on the following condition (12) between a current system and a possible virtual replacement. The dimension regards the value of 1 when the difference is positive and greater than 0.5. In the other cases, the dimension takes the value of zero. Subsequently, the values of the diagnostics are summed. Thus, it is determined that virtualization must be considered when at least three dimensions obtain a significant change. This criterion employs a diagonal to evaluate the virtualization, as is described in Table 7.
x i = if x v i r t u a l x c u r r e n t > 0.5 then 1 else 0

4. Case of Study: Path Planning Generator

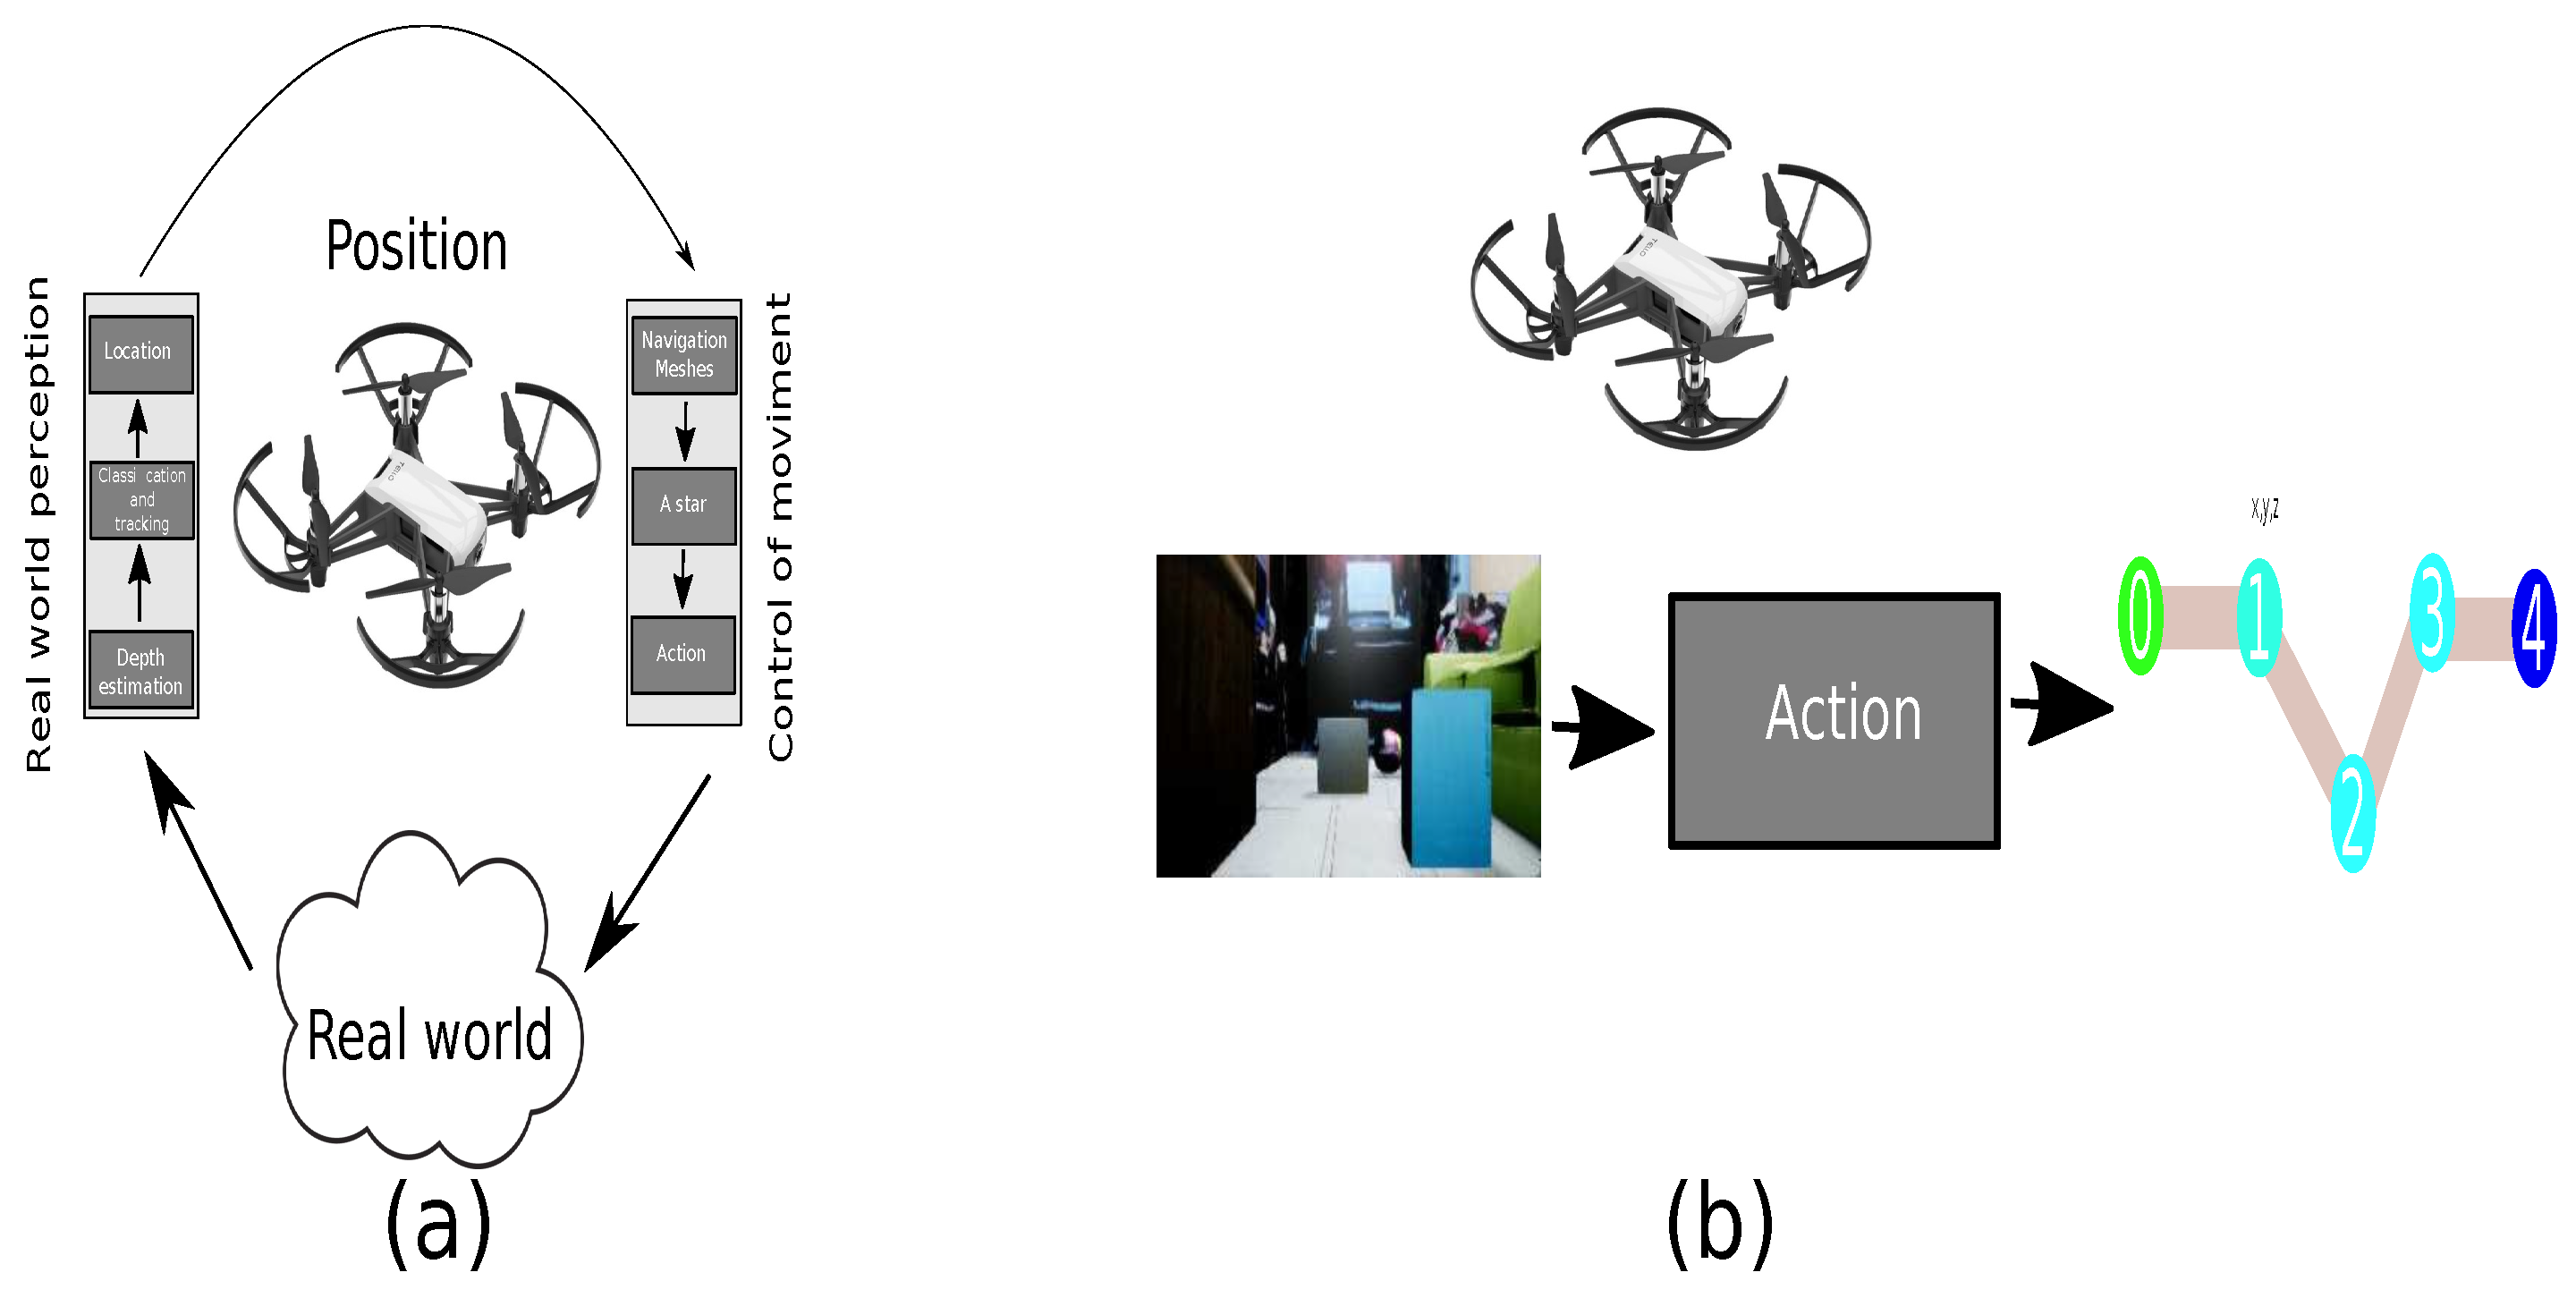
4.1. Path Planning Problem

Path planning problem requires coordination between the environment and the agent. Consequently, it is essential to define rules for the transition between states to achieve an objective. The path planning problem has mainly two modules based on the definition of AI. The first is the planner, while the second module is the perception of the environment, it is illustrated in Figure 6 [55]. The problem is complex according to the robotic system’s characteristics, such as the battery, dimensions, and technologies to perform the environment’s perception, including obstacles, illumination, and other agents in motion.
One of the principal features to describe a path is the level of safety for avoiding obstacles. Therefore, path planning is the shortest distance (13) between the m number of obstacles O and the best value with the high level of safety in a sequence of points p of length n (14). After adding a negative sign to the value, the maximum optimization safety problem is transformed into the minimum optimization problem defined in (15) [56].
d i s t a n c e ( p i , p i + 1 ) = ( x i x i + 1 ) 2 + ( y i y i + 1 ) 2
l e n g t h ( p ) = i = 0 n d i s t a n c e ( p i , p i + 1 )
s a f e t y ( p ) = min min m i n D i s t a n c e ( p i p i + 1 , O j )

4.2. Domain Connection by Generative Adversarial Networks Approach

A novel approach using Generative Adversarial Networks (GANs) is described in [57]. This approach proposes a connection between the real world with the generation of a dataset in the virtual world by a GAN defined in (16) where an authentic sample has associated a virtual representation.
D : R V
Domain R defines the real-world samples, and domain V defines the virtual world samples. Therefore, a connection between a real-world sample and the virtual world must generate a one-to-one connection, as is shown in Figure 7a. In other words, this connection must have the same number of samples in both domains, being impractical. On the other hand, GAN is used for a domain change. Consequently, it is possible to change domain from a subdomain r with limited samples to virtual domain V (17), reducing the samples of domain R shown in Figure 7b.
D : r V

4.3. Virtual Substitution on Physical Elements Performance

The following architecture illustrated in Figure 8 describes the steps implemented in a complex system on limited devices such as embedded devices. As the first step, each virtual sample associates a virtual path generated by the A* algorithm into the simulator, as is shown in Figure 8a. Besides, three deep learning solutions are proposed to estimate a path, and a deep convolutional network estimates a characteristic vector which is shared for them, as is represented in Figure 8b. The third step describes the connection between both domains through a GAN. This network changes from the physical domain to the virtual domain. Hence, the samples in real domains are reduced to avoid a one-to-one connection, as it is shown in Figure 8c. Since the GAN requires considerable time, the transfer learning reduces this issue [58]. The fourth step replaces the GAN and characteristic vector called Domain changes with the transfer learning approach. Therefore, a new model with fewer layers is trained to determinate the characteristic vector, but with fewer operations, as described the Figure 8d. Nevertheless, it is necessary to consider that the Domain changes system estimated 50 samples for implementing transfer learning. Subsequently, the last step, instead of employing the GAN, and characteristic vector as separate systems, both are included and placed for estimates of the virtual path with the three deep learning approaches from authentic samples displayed in Figure 8e. In this way, the architecture is optimized, and its performance is improved for embedded devices achieving a 90% for avoiding obstacles in a controlled environment, and with at least 10 FPS considered a real-time system, as is presented in Figure 8f.

4.4. Evaluation of Micro Index

Virtualization as a strategy is considered a way to replace a complex element achieving a benefit. In this analysis, the complex system uses a Kinect [59] sensor, a battery with large dimensions, and an external computer executes the process. Due to the characteristics of the complex system, it is necessary to substitute the current system with a system with fewer resources. In order to evaluate the micro index and its graphical representation, two devices with limited resources are proposed, which are an android device as Moto X4 and a Jetson nano 2G. Each of the devices implemented a path generator with a reduced architecture using virtual substitution of specialized sensors. Table 8 describes the weights for each sentence to evaluate all dimensions for different systems. Likewise, each of the dimensions and the micro index is calculated and presented in Table 9.
According to the data, the smartphone had an excellent evaluation for the environmental dimension because it is a reused device to employ a circular economy. Nevertheless, it is difficult to find devices that are not too damaged to be used. The social dimension requires adequate tools to develop substitution, but it needs capable equipment to analyze the data. In the economic dimension, it is appropriately qualified because it helps to reduce the use of specialized sensors, but it requires maintenance because the battery is embedded. Although the smartphone is not the best in specifications, it complies with good performance. Conclusively, the performance dimension offers an adequate score because it performs well in replacing the route generator. In addition, the handling of the interface provides more significant interaction with the user.
Alternatively, the Jetson nano 2G is not considered a reusable device because the manufacturer still supports it, but it is designed to use low energy and performs better than a smartphone. In the social aspect, it shares the same features as the smartphone. However, it has a lower rating in the economic dimension because external accessories such as a camera, battery, and screen have to be purchased. The CE dimension does not show a significant impact because the device is not considered obsolete. Furthermore, performance is satisfactory because it has the technology to employ tasks efficiently. One crucial point, the current devices have efficient performance. Therefore, five years could be reused to replace physical elements with a significant impact because they are designed to employ advanced algorithms with low energy.
The scale facilitates the impact to determine the feasibility of implementing virtualization as a substitution strategy shown in Table 10. It is observed that both devices are considered as an alternative to implementing virtual substitution. Furthermore, Figure 9 describes the efficiency of each device to substitute a physical element.
According to the distribution of each dimension, the complex system has limitations in the environmental and economic dimensions principally. In order to make a better decision, the diagonal evaluation is employed. Table 11 shows the level of the benefited dimensions, which for both cases, a value of +3 was obtained, meaning that three dimensions have a positive benefit. Consequently, virtualization is widely considered to replace a physical element to perform a particular task.
This study used two devices with limited resources to perform a virtual substitution to implement a path planning generator without specialized equipment. According to the behaviors, the smartphone has a higher sustainability and performance magnitude behavior because it has been a reused device from 2017 that was not developed to perform specialized tasks. However, the Jetson nano scores better because it was designed to perform data analysis approaching a good performance in terms of circularity. We contemplate that in 5 years, smartphones will have technology that is currently used. Consequently, many devices may replace physical elements obtaining better results in all dimensions.

5. Conclusions

Due to shortage problems in some economic sectors, virtual elements can replace physical resources. In order to measure the behavior of virtual representations, tools are needed to determine the level of benefit using a virtual substitution. Therefore, this proposal focused on creating an instrument to describe the behavior of a virtual substitution of physical elements. In this work, we investigate the impact of virtualization by evaluating the following dimensions: economic, social, environmental, and circularity. However, related works measure the impact of the dimensions at a macro level. Therefore, not all macro-level factors can be covered. Thus, we limited the scope to a micro-level through a procedure based on linguistic criteria to determine the most relevant factors for each dimension. Besides, we proposed performance as the fifth dimension based on requirements for virtualizing tasks, and a graphical representation was presented to visually perceive the benefit of virtualization.
In order to measure the benefits, a micro index helps evaluate the virtualization of a solution for a complex system, such as the path planning problem using limited devices to reuse them in circular models. Likewise, a tool determines the level of each factor given by a priority weight for generating more variation among the devices to be evolved. Similarly, the graphical representation describes more representative information compared to the ideal state. Although the graphs bring a visual representation of virtual performance, we contemplate determining some criteria that will allow us to decide. The proposed criteria are a scale and an evaluation diagonal. Likewise, we analyze to achieve at least a benefit on three dimensions. In this way, this work helps to consider virtualization as a strategy to reuse devices with limited characteristics to replace virtual elements. According to the problem and the results, we determine that it is feasible to implement a virtual substitution in a controlled scenario. In future work, we explore applying this methodology in other problems to evaluate the criteria to adjust the weights better because other problems may require special needs.

Author Contributions

Conceptualization, J.M.-R. and M.A.-P.; validation, M.A.-P.; formal analysis, J.M.-R. and M.A.-P.; investigation, J.M.-R.; resources, M.A.-P.; data, J.M.-R.; writing—original draft preparation, J.M.-R. and M.A.-P.; writing—review and editing, J.M.-R. and M.A.-P.; visualization, J.M.-R. and M.A.-P.; supervision, J.M.-R. and M.A.-P.; project administration, J.M.-R. and M.A.-P. All authors have read and agreed to the published version of the manuscript.

Funding

This research received no external funding.

Institutional Review Board Statement

Not applicable.

Informed Consent Statement

Informed consent was obtained from all key informants involved in the study.

Data Availability Statement

Data sharing is not applicable to this article as no new data were created or analyzed in this study.

Acknowledgments

This work was supported in part by the Secretaría de Investigación y Posgrado (SIP) and in part by the Comisión de Operación y Fomento de Actividades Académicas (COFAA) of the Instituto Politécnico Nacional (IPN).

Conflicts of Interest

The authors declare no conflict of interest.

References

  1. OECD. Building Jobs and Prosperity in Developing Countries. Department for International Development. 2007. Available online: https://www.oecd.org/derec/unitedkingdom/40700982.pdf (accessed on 2 November 2021).
  2. Brundtland, G.H. Our Common Future: Report of the World Commission on Environment and Development. Geneva, UN-Dokument A/42/427. 1987. Available online: https://digitallibrary.un.org/record/139811?ln=es (accessed on 2 November 2021).
  3. UN. Sustainable Development Goals. Sustainable Development. 2015. Available online: https://sdgs.un.org/ (accessed on 2 November 2021).
  4. Henson, S.; Kambhampati, U.; Mogues, T.; Olsen, W.; Prowse, M.; Ramos, R.; Rand, J.; Rasiah, R.; Roelen, K.; Tiessen, R.; et al. The Development Impacts of COVID-19 at Home and Abroad: Politics and Implications of Government Action. Eur. J. Dev. Res. 2020, 32, 1339–1352. [Google Scholar] [CrossRef] [PubMed]
  5. Voas, J.; Kshetri, N.; DeFranco, J.F. Scarcity and Global Insecurity: The Semiconductor Shortage. IT Prof. 2021, 23, 78–82. [Google Scholar] [CrossRef]
  6. Garcés-Ayerbe, C.; Rivera-Torres, P.; Suárez-Perales, I.; Leyva-De La Hiz, D.I. Is It Possible to Change from a Linear to a Circular Economy? An Overview of Opportunities and Barriers for European Small and Medium-Sized Enterprise Companies. Int. J. Environ. Res. Public Health 2019, 16, 851. [Google Scholar] [CrossRef] [Green Version]
  7. Ellen MacArthur Foundation. Growth Within: A Circular Economy Vision for a Competitive Europe; Ellen MacArthur Foundation: Cowes, UK, 2015. [Google Scholar]
  8. Ellen MacArthur Foundation. Circulytics. 2021. Available online: https://ellenmacarthurfoundation.org/resources/circulytics/overview (accessed on 2 November 2021).
  9. Higg. Higg Materials Sustainability Index (Higg MSI). User Resources: How to Higg. 2021. Available online: https://howtohigg.org/higg-msi/ (accessed on 2 November 2021).
  10. Raut, R.D.; Gotmare, A.; Narkhede, B.E.; Govindarajan, U.H.; Bokade, S.U. Enabling Technologies for Industry 4.0 Manufacturing and Supply Chain: Concepts, Current Status, and Adoption Challenges. IEEE Eng. Manag. Rev. 2020, 48, 83–102. [Google Scholar] [CrossRef]
  11. Evans, D. How the Next Evolution of the Internet Is Changing Everything—Networking, Cloud, and Cybersecurity Solutions. 2011. Available online: https://www.cisco.com/c/dam/en_us/about/ac79/docs/innov/IoT_IBSG_0411FINAL.pdf (accessed on 2 November 2021).
  12. Vasileios, R.; Julie, B.; Monica, A.; Alexandra, C.; Antonella, Z. Identifying the Impact of the Circular Economy on the Fast-Moving Consumer Goods Industry: Opportunities and Challenges for Businesses, Workers and Consumers—Mobile Phones as an Example. Available online: https://circulareconomy.europa.eu/platform/sites/default/files/impact_of_ce_on_fmcg_-_mobile_phones_case_study.pdf (accessed on 5 November 2021).
  13. Repairing—Not Recycling—Is the First Step to Tackling Smartphone E-wastE. 19 July 2021. World Economic Forum. Available online: https://www.weforum.org/agenda/2021/07/repair-not-recycle-tackle-ewaste-circular-economy-smartphones/ (accessed on 2 November 2021).
  14. Cordella, M.; Alfieri, F.; Clemm, C.; Berwald, A. Durability of smartphones: A technical analysis of reliability and repairability aspects. J. Clean. Prod. 2021, 286, 125388. [Google Scholar] [CrossRef] [PubMed]
  15. Lighthill, I. Artificial Intelligence: A General Survey. In Artificial Intelligence: A Paper Symposium; Science Research Council: London, UK, 1973. [Google Scholar]
  16. Ellen MacArthur Foundation. Towards the Circular Economy. Economic and Business Rationale for an Accelerated Transition. 2013; Volume 1. Available online: https://ellenmacarthurfoundation.org/towards-the-circular-economy-vol-1-an-economic-and-business-rationale-for-an (accessed on 5 November 2021).
  17. Microsoft Azure. What Is Virtualization—Definition. 2020. Available online: https://azure.microsoft.com/en-us/overview/what-is-virtualization/ (accessed on 25 September 2021).
  18. Maldonado-Romo, J.; Aldape-Pérez, M. Interoperability between Real and Virtual Environments Connected by a GAN for the Path-Planning Problem. Appl. Sci. 2021, 11, 10445. [Google Scholar] [CrossRef]
  19. Ellen MacArthur Foundation. Cradle to Cradle in a Circular Economy—Products and Systems 2017. Available online: https://www.ellenmacarthurfoundation.org/circular-economy/schools-of-thought/cradle2cradle (accessed on 2 November 2021).
  20. Correia, M. Sustainability: An Overview of the Triple Bottom Line and Sustainability Implementation. Int. J. Strateg. Eng. 2019, 2, 29–38. [Google Scholar] [CrossRef]
  21. Burlea-Schiopoiu, A.; Mihai, L.S. An Integrated Framework on the Sustainability of SMEs. Sustainability 2019, 11, 6026. [Google Scholar] [CrossRef] [Green Version]
  22. Lucato, W.C.; Santos, J.C.d.S.; Pacchini, A.P.T. Measuring the Sustainability of a Manufacturing Process: A Conceptual Framework. Sustainability 2018, 10, 81. [Google Scholar] [CrossRef] [Green Version]
  23. Nukman, Y.; Farooqi, A.; Al-Sultan, O.; Alnasser, A.R.A.; Bhuiyan, M.S.H. A Strategic Development of Green Manufacturing Index (GMI) Topology Concerning the Environmental Impacts. Procedia Eng. 2017, 184, 370–380. [Google Scholar] [CrossRef]
  24. Hickel, J. The sustainable development index: Measuring the ecological efficiency of human development in the anthropocene. Ecol. Econ. 2020, 167, 106331. [Google Scholar] [CrossRef]
  25. Grecu, Valentin. The Global Sustainability Index: An Instrument For Assessing The Progress Towards The Sustainable Organization. Available online: https://www.sciendo.com/article/10.1515/aucts-2015-0093 (accessed on 2 November 2021).
  26. Hristov, I.; Chirico, A. The Role of Sustainability Key Performance Indicators (KPIs) in Implementing Sustainable Strategies. Sustainability 2019, 11, 5742. [Google Scholar] [CrossRef] [Green Version]
  27. Geissdoerfer, M.; Vladimirov, D.; Evans, S. Sustainable business model innovation: A review. J. Clean. Prod. 2018, 198, 401–416. [Google Scholar] [CrossRef]
  28. Kalmykova, Y.; Sadagopan, M.; Rosado, L. Circular economy—From review of theories and practices to development of implementation tools. Resour. Conserv. Recycl. 2018, 135, 190–201. [Google Scholar] [CrossRef]
  29. Azevedo, S.G.; Godina, R.; Matias, J.C.d.O. Proposal of a Sustainable Circular Index for Manufacturing Companies. Resources 2017, 6, 63. [Google Scholar] [CrossRef] [Green Version]
  30. Sacco, P.; Vinante, C.; Borgianni, Y.; Orzes, G. Circular Economy at the Firm Level: A New Tool for Assessing Maturity and Circularity. Sustainability 2021, 13, 5288. [Google Scholar] [CrossRef]
  31. Tu, J.-C.; Chan, H.-C.; Chen, C.-H. Establishing Circular Model and Management Benefits of Enterprise from the Circular Economy Standpoint: A Case Study of Chyhjiun Jewelry in Taiwan. Sustainability 2020, 12, 4146. [Google Scholar] [CrossRef]
  32. De Felice, F.; Petrillo, A. Green Transition: The Frontier of the Digicircular Economy Evidenced from a Systematic Literature Review. Sustainability 2021, 13, 11068. [Google Scholar] [CrossRef]
  33. Çetin, S.; De Wolf, C.; Bocken, N. Circular Digital Built Environment: An Emerging Framework. Sustainability 2021, 13, 6348. [Google Scholar] [CrossRef]
  34. Magrini, C.; Nicolas, J.; Berg, H.; Bellini, A.; Paolini, E.; Vincenti, N.; Campadello, L.; Bonoli, A. Using Internet of Things and Distributed Ledger Technology for Digital Circular Economy Enablement: The Case of Electronic Equipment. Sustainability 2021, 13, 4982. [Google Scholar] [CrossRef]
  35. Andersen, T.; Jæger, B. Circularity for Electric and Electronic Equipment (EEE), the Edge and Distributed Ledger (Edge & DL) Model. Sustainability 2021, 13, 9924. [Google Scholar] [CrossRef]
  36. Zhi, J. An Alternative Green Screen Keying Method for Film Visual Effects. Int. J. Multimed. Its Appl. 2015, 7, 1–12. [Google Scholar] [CrossRef]
  37. Wadhwa, N.; Garg, R.; Jacobs, D.E.; Feldman, B.E.; Kanazawa, N.; Carroll, R.; Movshovitz-Attias, Y.; Barron, J.T.; Pritch, Y.; Levoy, M. Synthetic depth-of-field with a single-camera mobile phone. ACM Trans. Graph. 2018, 37, 64. [Google Scholar] [CrossRef] [Green Version]
  38. Romli, A.; Prickett, P.; Setchi, R.; Soe, S. Integrated eco-design decision-making for sustainable product development. Int. J. Prod. Res. 2015, 53, 549–571. [Google Scholar] [CrossRef]
  39. Chang, A.-Y.; Cheng, Y.-T. Analysis model of the sustainability development of manufacturing small and medium- sized enterprises in Taiwan. J. Clean. Prod. 2019, 207, 458–473. [Google Scholar] [CrossRef]
  40. Wang, Y.-J. Fuzzy multi-criteria decision-making based on positive and negative extreme solutions. Appl. Math. Model. 2011, 35, 1994–2004. [Google Scholar] [CrossRef] [Green Version]
  41. Rihab, K.; Khaoula, E.-M.; Bernard, G.; Belhassen, Z. A fuzzy multi-criteria decision making approach for managing performance and risk in integrated procurement-production planning. Int. J. Prod. Res. 2017, 55, 5305–5329. [Google Scholar]
  42. Risch, E.; Jaumaux, L.; Maeseele, C.; Choubert, J.-M. Comparative Life Cycle Assessment of two advanced treatment steps for wastewater micropollutants: How to determine whole-system environmental benefits? Sci. Total. Environ. 2022, 805, 150300. [Google Scholar] [CrossRef]
  43. Knight, P.; Jenkins, J.O. Adopting and applying eco-design techniques: A practitioners perspective. J. Clean. Prod. 2009, 17, 549–558. [Google Scholar] [CrossRef] [Green Version]
  44. Hellström, T. Dimensions of Environmentally Sustainable Innovation: The Structure of Eco-Innovation Concepts. Sustain. Dev. 2007, 15, 148–159. [Google Scholar] [CrossRef]
  45. Puglieri, F.N.; Ometto, A.R.; Salvador, R.; Barros, M.V.; Piekarski, C.M.; Rodrigues, I.M.; Diegoli Netto, O. An Environmental and Operational Analysis of Quality Function Deployment-Based Methods. Sustainability 2020, 12, 3486. [Google Scholar] [CrossRef] [Green Version]
  46. Caiado, R.G.G.; Dias, R.d.; Mattos, L.V.; Quelhas, O.L.G.; Filho, W.L. Towards sustainable development through the perspective of eco-efficiency—A systematic literature review. J. Clean. Prod. 2017, 165, 890–904. [Google Scholar] [CrossRef] [Green Version]
  47. Delgado, M.; Verdegay, J.L.; Vila, M.A. Linguistic decision-making models. Int. J. Intell. Syst. 1992, 7, 479–492. [Google Scholar] [CrossRef]
  48. Herrera, F.; Herrera-Viedma, E.; Verdegay, J.L. A model of consensus in group decision decision making under linguistic assessments. Fuzzy Sets Syst. 1996, 78, 73–87. [Google Scholar] [CrossRef]
  49. Xavier, M.G.; Neves, M.V.; Rossi, F.D.; Ferreto, T.C.; Lange, T.; Rose, C.A.F.D. Performance Evaluation of Container-Based Virtualization for High Performance Computing Environments. In Proceedings of the 2013 21st Euromicro International Conference on Parallel, Distributed, and Network-Based Processing, Belfast, UK, 27 February–1 March 2013; pp. 233–240. [Google Scholar] [CrossRef]
  50. Dillon, R.F. Human factors in user-computer interaction: An introduction. Behav. Res. Methods Instrum. 1983, 15, 195–199. [Google Scholar] [CrossRef] [Green Version]
  51. Handa, A. Real-Time Camera Tracking: When is High Frame-Rate Best? In Computer Vision—ECCV 2012; Springer: Berlin/Heidelberg, Germany, 2012; pp. 222–235. [Google Scholar]
  52. Fuller, A.; Fan, Z.; Day, C.; Barlow, C. Digital Twin: Enabling Technologies, Challenges and Open Research. IEEE Access 2020, 8, 108952–108971. [Google Scholar] [CrossRef]
  53. Sullivan, G.M.; Artino, A.R., Jr. Analyzing and interpreting data from likert-type scales. J. Grad. Med. Educ. 2013, 5, 541–542. [Google Scholar] [CrossRef] [Green Version]
  54. Zenya, A.; Nystad, Ø. Assessing Corporate Sustainability with the Enterprise Sustainability Evaluation Tool (E-SET). Sustainability 2018, 10, 4661. [Google Scholar] [CrossRef] [Green Version]
  55. Schwartz, J.T.; Sharir, M. On the piano movers’ problem: II. General techniques for computing topological properties of real algebraic manifolds. Adv. Appl. Math. 1983, 4, 298351. [Google Scholar] [CrossRef] [Green Version]
  56. Xue, Y.; Sun, J.-Q. Solving the Path Planning Problem in Mobile Robotics with the Multi-Objective Evolutionary Algorithm. Appl. Sci. 2018, 8, 1425. [Google Scholar] [CrossRef] [Green Version]
  57. Maldonado-Romo, J.; Aldape-Pérez, M.; Rodríguez-Molina, A. Path Planning Generator with Metadata through a Domain Change by GAN between Physical and Virtual Environments. Sensors 2021, 21, 7667. [Google Scholar] [CrossRef] [PubMed]
  58. Weiss, K.; Khoshgoftaar, T.M.; Wang, D. A survey of transfer learning. J. Big Data 2016, 3, 9. [Google Scholar] [CrossRef] [Green Version]
  59. Zainuddin, N.A.; Mustafah, Y.M.; Shawgi, Y.A.M.; Rashid, N.K.A.M. Autonomous Navigation of Mobile Robot Using Kinect Sensor. In Proceedings of the 2014 International Conference on Computer and Communication Engineering, Kuala Lumpur, Malaysia, 23–25 September 2014; pp. 28–31. [Google Scholar] [CrossRef]
Figure 1. Perspectives about economic development. (a) Linear economy. (b) Circular economy.
Sustainability 13 13436 g001
Figure 2. Life cycle of a smartphone. Based on the data: Rizos, Vasileios & Bryhn, Julie & Alessi, Monica & Campmas, Alexandra & Zarra, Antonella. (2019). Identifying the impact of the circular economy on the Fast-Moving Consumer Goods Industry: opportunities and challenges for businesses, workers and consumers—mobile phones as an example. https://0-doi-org.brum.beds.ac.uk/10.2864/775626. Repairing—not recycling—is the first step to tackling smartphone E-wastE. (19 July 2021). World Economic Forum. https://www.weforum.org/agenda/2021/07/repair-not-recycle-tackle-ewaste-circular-economy-smartphones/, (accessed on 2 November 2021). Cordella, M.; Alfieri, F.; Clemm, C.; Berwald, A. Durability of smartphones: A technical analysis of reliability and repairability aspects. J. Clean. Prod. 2021, 286, 125388. from https://0-doi-org.brum.beds.ac.uk/10.1016/j.jclepro.2020.125388, (accessed on 2 November 2021).
Sustainability 13 13436 g002
Figure 3. Virtualization one opportunity to extend the life cycle of smartphone. (a) Virtualization to extend smartphone’s end of life. (b) Virtualization approach into circular economy model.
Sustainability 13 13436 g003
Figure 4. Word frequency description for Eco-design perspective.
Sustainability 13 13436 g004
Figure 5. Micro index graphical representation.
Sustainability 13 13436 g005
Figure 6. Architecture for path planning generator. (a) Standard architecture. (b) Optimized architecture. Maldonado-Romo, J.; Aldape-Pérez, M. Interoperability between Real and Virtual Environments Connected by a GAN for the Path-Planning Problem. Appl. Sci. 2021, 11, 10445. from https://0-doi-org.brum.beds.ac.uk/10.3390/app112110445, (accessed on 2 November 2021).
Sustainability 13 13436 g006
Figure 7. Domain connection approach. (a) Connection one-to-one. (b) Connected domains by a GAN. Maldonado-Romo, J.; Aldape-Pérez, M.; Rodríguez-Molina, A. Path Planning Generator with Metadata through a Domain Change by GAN between Physical and Virtual Environments. Sensors 2021, 21, 7667. from https://0-doi-org.brum.beds.ac.uk/10.3390/s21227667, (accessed on 2 November 2021).
Sustainability 13 13436 g007
Figure 8. Interoperability between real and virtual environments by a GAN. (a) Each virtual sample has associated a virtual path based on A*. (b) Three deep learning solutions for estimating the virtual path. (c) GAN for connecting real with the virtual domain. (d) Transfer learning approach to reduce the domain changes generated by a GAN. (e) The transfer learning model replaces each deep learning solution with a few operations for estimating characteristic vectors, connecting real samples with virtual paths. (f) Virtual substitution of a complex problem on an embedded device. Based on Maldonado-Romo, J.; Aldape-Pérez, M. Interoperability between Real and Virtual Environments Connected by a GAN for the Path-Planning Problem. Appl. Sci. 2021, 11, 10445. from https://0-doi-org.brum.beds.ac.uk/10.3390/app112110445, (accessed on 2 November 2021).
Sustainability 13 13436 g008
Figure 9. Micro index graphical representation.
Sustainability 13 13436 g009
Table 1. The linguistic terms and related fuzzy numbers of evaluation ratings.
Linguistic ValueFuzzy Number
Very low (L)(0,0,3)
Low (LM)(0,3,5)
Medium (M)(3,5,7)
High (MH)(5,7,10)
Very high (H)(7,10,10)
Table 2. Analysis of sustainable factors.
DimensionFactorLCAEco DesignEco InnovationEco QFD 4Eco Efficiency 5DistanceRank
EnvironmentReduce the use of harmful raw materialsMHHHMHH0.71041
Reduce energy useLMHHMH0.59654
Reduce greenhouse gas emissionsHMMHMHH0.62932
Green product designMHHMHMH0.62933
Noise interferenceLLLLL08
Validity of reverse logistics systemLLLLL09
Supplier monitoring effectivenessHMLMMH0.55545
Increase the use of green energyLMLMLMLMM0.30306
Use of green buildingsMLMLLM0.27547
SocialIncrease local community employment opportunitiesLLLMLL0.12056
Green imageLLMLMLM0.26354
Managers’ commitment to green supply chain managementMHMHMHLH0.53982
Employee environmental trainingLLLLL07
Employment practicesLLLLL08
Local community feedbackLMLMLLM0.26355
Personnel turnover rateLLLLL09
The effectiveness of discipline managementMHHHLMH0.61371
Zero customer complaints or returnsLMMHLM0.48353
EconomicProduct costLMMLMHMH0.51755
Ordering costs and logistics costsLLLMMH0.42726
On time deliveryLLLLL08
Quality assuranceMHHHH068061
Rejection rateLHMHMH0.54764
Technology levelMHHMH0.63773
Research and design capabilityMHHMHMHMH0.66272
Governance of the companyLLLMLL0.12057
Corporate transparency and accountabilityLLLLL09
The number of shareholdersLLLLL010
InvestmentLLLLL011
Table 3. Analysis of circular factors.
DimensionFactorLCAEco
Design
Eco
Innovation
Eco
QFD
Eco
Efficiency
DistanceRank
CircularEfficiency of recyclingHHMHMHH0.16321
Utility during use phaseMMHHMMH0.03
Recycled materials and
reused components
MHMHMH0.03462
Table 4. Analysis of performance factors.
DimensionFactorLCA 1Eco Design 2Eco Innovation 3Eco QFD 4Eco Efficiency 5DistanceRank
PerformanceEfficiency of local resourcesHMHHHH0.55062
User interfaceLMLMLMLMLM0.04
Response timeHMHMHMHH0.50673
Level of similarity to the physical systemHHHHH0.64031
Table 5. Proposed sentences for a virtual substitution assessment.
DimensionWeightFactorSentence
Environment0.40Reduce the use of harmful raw materialsVirtual substitution helps to reduce the use of raw materials
0.30Reduce greenhouse gas emissionsVirtual substitution reduces greenhouse gases
0.15Green product designVirtual substitution has a green design
0.10Reduce energy useVirtual substitution reduces energy use
0.05Supplier monitoring effectivenessThe implementation of the device is affordable
Social0.60The effectiveness of discipline managementThe personnel have the necessary tools
0.40Managers’ commitment to green supply chain managementThe importance of using green supplies is indispensable
Economic0.50Quality assuranceThe cost-benefit is adequate
0.30Research and design capabilityThe team can design and conduct a research
0.20Technology levelThe team has the appropriate technology to develop a virtual substitution
Circular0.50Efficiency of recyclingThe device performs adequately to virtualize a physical element
0.30Recycled materials and reused componentsThe elements are recycled
0.20Utility during use phaseVirtual substitution provides a positive benefit
Performance0.40Level of similarity to the physical systemHow is the similarity of the virtual system compared to the physical element?
0.30Efficiency of local resourcesVirtualization makes efficient use of device resources
0.20Response timeThe response time is adequate to replace a physical element
0.10User interfaceThe user interface is valuable and functional
Table 6. Micro index scale. Green color:successful substitution alternative. Yellow color:virtualization as an option of a possible improvement. Red color:virtualization is not advisable.
LevelRangeDescription
A0.76–1.00Successfully: virtualization is recommended
B0.51–0.75Middle: It is recommended to consider virtualization
C0.00–0.50Low: Virtualization is not suitable with these characteristics
Table 7. Diagonal to evaluate the virtualization as a strategy.
Env v i r t u a l Social v i r t u a l Eco v i r t u a l Circular v i r t u a l Perfor v i r t u a l
Env c u r r e n t x 1
Social c u r r e n t x 2
Eco c u r r e n t x 3
Circular c u r r e n t x 4
Perfor c u r r e n t x 5
Result i n x i
Table 8. Case of study: Path planning generator by embedded devices.
SentenceMoto X4Jetson NanoComplex
System
Virtual substitution helps to reduce
the use of raw materials
10101
Virtual substitution reduces greenhouse
gases
10101
Virtual substitution has a green design10101
Virtual substitution reduces energy use10101
The implementation of the device is
affordable
861
The personnel have the necessary tools768
The importance of using green supplies is
indispensable
551
The cost-benefit is adequate971
The team can design and conduct a
research
999
The team has the appropriate technology
to develop a virtual substitution
982
The device performs adequately
to virtualize a physical element
7101
The elements are recycled851
Virtual substitution provides a positive
benefit
10101
How is the similarity of the virtual
system compared to the physical element?
9910
Virtualization makes efficient use of
device resources
91010
The response time is adequate to replace
a physical element
81010
The user interface is valuable and
functional
8510
Table 9. Values to determine the micro index of each device.
DimensionSmartphoneJetson NanoComplex System
Enviromental0.990.980.10
Social0.620.560.52
Economic0.900.780.36
Circular0.790.850.10
Performance0.870.911.00
Micro index0.8340.8160.416
Table 10. Level for each system by the micro index scale. Green color:successful substitution alternative. Yellow color:virtualization as an option of a possible improvement. Red color:virtualization is not advisable.
DeviceValueLevel
Moto X40.834A
Jetson nano0.816A
Complex0.416C
Table 11. Diagonal evaluation for mobile and Jetson devices.
Env v i r t u a l Social v i r t u a l Eco v i r t u a l Circular v i r t u a l Perfor v i r t u a l
Env c u r r e n t 1
Social c u r r e n t 0
Eco c u r r e n t 1
Circular c u r r e n t 1
Perfor c u r r e n t 0
Result 3
Publisher’s Note: MDPI stays neutral with regard to jurisdictional claims in published maps and institutional affiliations.

