
Multiple Correspondence Analysis of Factors Influencing Student Acceptance of Massive Open Online Courses


1
College of Education, University of South Africa, Pretoria 0002, South Africa
2
Department of Information Technology, Durban University of Technology, Durban 4000, South Africa
*
Author to whom correspondence should be addressed.
Sustainability 2021, 13(23), 13451; https://0-doi-org.brum.beds.ac.uk/10.3390/su132313451
Submission received: 16 November 2021
/
Revised: 28 November 2021
/
Accepted: 2 December 2021
/
Published: 5 December 2021
(This article belongs to the Special Issue Knowledge Management and Digital Transformation in the Sharing Economy)
Abstract
:There have been manifold thrilling studies strikingly conducted in recent years to explore factors influencing student acceptance of massive open online courses (MOOCs). The principal goal was to determine future prediction and sustainable use of MOOCs for providing pervasive quality education services. This has led to the examination of different theoretical models tested on varying sample sizes for factor exploration. However, existing studies have reflected heterogeneous results caused by divergent sources not observed in the literature using the multiple correspondence analysis (MCA). This study aimed to apply the data science method of MCA to explore hidden associations amongst factors influencing student acceptance of MOOCs and heterogeneity sources of theoretical models and sample sizes to blur the literature hiatus. Results based on data extracted from 54 primary studies published from 2015 to 2021 with a total of 19,638 valid student responses generally conclude the existence of four main levels of associations. The four associations were respectively composed of single, blended, extended and complex theories and each level is associated with distinct categories and a combination cloud of similar categories. Moreover, results indicated that very small sample size is the most unusual under the basic assumption that none of the variables are correlated. It is practically germane to confirm hidden associations in a dataset of influencing factors to help reach a much greater understanding of the application and performance of MOOCs for sustainable education services.
1. Introduction
The technology of massive open online courses (MOOCs) has become a recent educational innovation for sustainable online education services that have gained widespread popularity across the world [1]. MOOCs have been described as online distance-learning courses that provide free educational resources to registered students in various disciplines [2]. MOOC is generally recognized as one of the most recent developmental phases of open educational resources that have tremendously transformed higher education institutions and significantly minimized the spiraling costs of learning. It is reshaping the quality of teaching and learning experiences for students and it provides a wide diversity of high-quality courses and valuable learning materials for the diverse needs of students [3]. It can motivate students for learning [4], allow for free sharing of learning materials [5], support interactivity with the aid of various communication tools and provide numerous opportunities for students to seamlessly collaborate [6]. The use of MOOCs can provide students with pervasive access to a diverse spectrum of learning resources, thereby promoting student-centered instructions [7]. MOOC can improve the quality of learning pedagogy, help accelerate collaboration, ensure social cohesion and promote sustainable development growth [8,9].
However, it comes naturally with some inherent challenges despite its rapid development and numerous intrinsic benefits. The challenges include lack of standardization and flexibility [10], incapacity to provide real-time feedback to students [5], inability to obtain sustainable financial revenue [6] and inadequate learning time for students [11]. In addition, it is difficult to implement a teaching process affording the specific characters of students using MOOCs because of a huge number of participants and the teacher cannot identify the characters of individual students through face-to-face interaction [12]. These challenges have contributed to a low degree of student participation after enrolment in MOOCs [1,13,14] and acceptance rates by students are universally low [15,16]. The average completion rate of MOOCs is less than ten percent and the dropout rate is generally very high [6]. The situation can lead to uncertainty regarding the efficacy, sustainability and performance of MOOC as a learning platform [7]. Moreover, scholars have ascribed the dropout rates of MOOCs to inadequate control of a learning environment, lack of background knowledge and skills, conflict in a discussion forum among students and the feeling of complete isolation [11,17]. However, there has been a contention that the success of MOOCs should not be solely evaluated by course completion and drop-out rates because students enroll for various motives. They may, for instance, enroll to satisfy their curiosity, advance their careers, plan for the future, acquire skills and connect with people to improve knowledge without intending to finish the entire course [3,5,18]. Moreover, scholars have espoused that the success of MOOCs should rather be based on the learning behaviors of students such as their acceptance [3,19,20]. This proposition makes it propitious to investigate factors influencing student acceptance of MOOCs.
Different studies have used diverse theoretical models, sample sizes and analysis methods to expose numerous significant factors influencing student acceptance of MOOCs [1,21]. MOOC was proposed as a form of sustainable higher education by exploring the theory of task-technology fit (TTF) and technology acceptance model (TAM) to create a novel paradigm of education [22]. However, no consensus has been generally reached as to which factors best influence student acceptance of MOOCs. The one reason for the lack of consensus may be the curb of the existing studies in examining other salient determinants through the exploration of associations that remains a gap in the literature. It has been demonstrated through meta-analysis research that theoretical models and sample sizes are the significant sources of heterogeneity in factors influencing student acceptance of MOOCs [23]. The practical implications of utilizing an appropriate sample size [24] and relevant theory [25] in research are widely appreciated. The cardinal objective of this study was to apply multiple correspondence analysis (MCA) to examine associations among factors influencing student acceptance of MOOCs and heterogeneity sources of theoretical models and sample sizes. The unique contributions of this study to the body of knowledge and practice are three-fold as explicated below.
- A comprehensive review of the related studies on factors influencing student acceptance of MOOCs.
- The extraction of useful qualitative data from the reviewed studies in a format suitable for advanced statistical analysis.
- The application of MCA to expose hidden associations in the extracted qualitative data to help improve the understanding of student acceptance of MOOCs.
2. Materials and Methods
MCA is an exploratory data science method for discovering geometrical representations of categorical data in multiple dimensional spaces [26]. The present study uses the method to explore the geometrical representation of the data associated with factors influencing student acceptance of MOOCs and sources of heterogeneity. The study methods present three phases based on literature review, data codification and data analysis.
2.1. Literature Review
A literature search was executed with the support of the widely used scholastic databases of Scopus, Web of Science and Google Scholar to retrieve pertinent quantitative studies. The search parameters were based on simple keywords of the form “MOOC acceptance” and “Factors of MOOC acceptance” to focus the searching within each database. The studies should intrinsically contain useful information to be declared pertinent to this study. The useful information includes the authors of a study, year of publication, country of study, student sample, a most significant factor, path coefficient analysis, the acceptance behavior of students, method of data analysis and the theoretical model of factor exploration. Different studies have tested the strengths of numerous theoretical models on various sample sizes to expose factors influencing student acceptance of MOOCs. The theoretical models so far reported in the literature for this purpose can be categorized into four groups of single, blended, extended and complex theories. The category of single models is made up of studies that have used the basic information system theories for factor exploration. The blended model agglutinates two or more basic theories to explain factors influencing student acceptance of MOOCs. The extended model incorporates other useful factors into a single model while the complex model integrates other factors into a blended model. The basic theories include student online learning readiness (SOLR) [27], unified theory of acceptance and use of technology (UTAUT) [28], uses and gratification theory (UGT) [29], expectation-confirmation model (ECM) [30], theory of consumption value (TCV) [31], theory of task-technology fit (TTF) [32], distance learning theory (DLT) [33], technology user environment (TUE) [34], self-efficacy theory (SET) [35], stimulus organism response model (SORM) [36], Triandis model (TRAM) [37], technology acceptance model (TAM) [38], attachment theory (ATT) [39], social technical system theory (STST) [40], self-regulation theory (SRT) [41], self-determination theory (SDT) [42,43], social cognitive theory (SCT) [44], theory of planned behavior (TPB) [45], theory of information systems success (ISS) [46], subjective task value theory (STVT) [47] and service quality (SERVQUAL) [48].
Different authors have used single theories to investigate factors influencing student acceptance of MOOCs. SOLR was used to predict communication competency, self-management of learning, social competency and technological competency as factors influencing student readiness to accept MOOCs [4]. The same theory was used to identify computer self-efficacy as the most significant factor predicting student readiness for MOOCs [49]. UTAUT was used to show that performance expectancy, effort expectancy, social influence and facilitating conditions are significant factors influencing the behavioral intention of students to use MOOCs [50]. The same theory was applied to report that behavioral intention has a significant effect on student usage of MOOCs [51]. UGT was applied to show that openness, subjective norms, student satisfaction and performance expectancy are significant factors influencing the continuance intention of students to use MOOCs [7]. ECM was used to identify perceived usefulness and student satisfaction as the significant factors influencing the continuance intention of students to use MOOCs [52]. The same theory was used to reveal student satisfaction as the most significant factor of continuance intention to use MOOCs [53]. TCV was tested to discover perceived functional value as the most significant factor influencing the continuance intention of students to use MOOCs [54]. TTF was applied to discover vividness of course content, teacher knowledge and interactivity as significant factors influencing the behavioral intention of students to use MOOCs [55]. DLT was applied to show that intellectual capital is the strongest determinant of the behavioral intention of students to use MOOCs [20]. TUE was developed to show that self-regulation, perceived usefulness, performance-to-cost value, lack of accessibility, tradition and social norms and lack of information significantly influenced the intention of students to adopt MOOCs [34]. SET was adapted to show that perceived usefulness and perceived enjoyment are significant factors influencing the continuance intention of students to use MOOCs [56]. The authors in [14] drew upon the SORM to demonstrate that engagement on platform significantly influenced the continuance intention of students to use MOOCs. TRAM was used to show that behavioral intention and facilitating conditions are significant factors influencing the actual usage of MOOCs by students [6].
Many extant studies have mainly blended TAM, ECM, TPB, ISS and SDT with other theories for factor exploration. They include the blending of TAM and IDT to discover student attitude as the most significant factor of MOOC usage intention [10]. TAM and UTAUT exposed performance expectancy, effort expectancy, social influence, computer self-efficacy, student attitude and facilitating conditions as significant factors of student acceptance of MOOCs [15]. TAM and SST unveiled student attitude, perceived convenience and perceived gain as significant factors of MOOC usage intention [57]. TAM and ISS revealed course quality and perceived usefulness as significant factors of continuance intention of students to use MOOCs [58]. TAM and TPB divulged behavioral intention, perceived behavioral control and subjective norms as significant factors of MOOC usage by students [59]. TAM and SCT disclosed perceived ease of use and perceived usefulness as significant factors influencing continuance intention of students to use MOOCs [1]. TAM, ECM and SDT unveiled student satisfaction as the most significant factor influencing continuance intention to use MOOCs [19]. TAM, SDT and SERVQUAL exposed student satisfaction and autonomous motivation as significant factors influencing the behavioral intention to use MOOCs [60]. ECM and TTF revealed perceived usefulness and student satisfaction as significant factors influencing continuance intention to use MOOCs [61]. ECM and STV unveiled intrinsic value, utility value, anxiety and risk of arbitrary learning as significant factors influencing the continuance intention of students to use MOOCs [62]. ECM and SET were used to demonstrate that continuous learning willingness was significantly influenced by self-efficacy and student satisfaction with MOOCs [63]. SDT and TPB revealed student attitude and perceived behavioral control as significant factors of behavioral intention to use MOOCs [64]. SDT and SRT unveiled intrinsic motivation and conscientiousness as significant factors influencing the continuance intention of students to use MOOCs [65]. SDT and TUE disclosed intrinsic motivation, social recognition, perceived value and perceived usefulness as significant factors of the behavioral intention of students to adopt MOOCs [3]. ATT and STST unveiled functional attachment and emotional attachment as significant factors of continuance intention of students to use MOOCs [66].
The widely used TAM, UTAUT and ECM theories among others have been extended with the incorporation of supplementary factors by different authors. TAM was tested with computer self-efficacy, perceived convenience, learning tradition and self-regulated learning to predict the behavioral intention of students to adopt MOOCs [2]. It was used with knowledge access, knowledge storage, knowledge application and knowledge sharing to predict student acceptance of MOOCs [5]. It was applied with coercive pressures, mimetic pressures and normative pressures to examine the adoption of MOOCs by students [67]. It was validated with social influence, course quality, collaboration and perceived enjoyment to predict the behavioral intention of students to use MOOCs [68]. It was applied with perceived quality, perceived enjoyment and usability to investigate factors influencing the effective use of MOOCs by students [13]. It was tested with the perception of time to explore factors influencing student acceptance of MOOCs [11]. It was used with reputation, student habit, subjective norm and conformity tendency to examine factors influencing behavioral intention to use MOOCs [69]. It was corroborated with perceived learner control, electronic learning self-efficacy and personal innovativeness to examine factors influencing the behavioral intention of students to adopt MOOCs [70].
UTAUT was used with student attitude and computer self-efficacy to identify factors influencing student usage of MOOCs [16]. It was tested with instructional quality, computer self-efficacy and service quality to investigate factors influencing student usage of MOOCs [18]. It was applied with web quality and self-efficacy to examine factors influencing the behavioral intention of students to use MOOCs [71]. It was corroborated with motivation, course design, interest, course delivery, media, interactivity and assessment to investigate factors influencing student usage of MOOCs [72]. It was used with perceived value to examine factors influencing student adoption of MOOCs [73]. It was validated with perceived course quality and perceived satisfaction to predict student usage of MOOCs in the regime of coronavirus pandemic [74].
ECM was used with curriculum organization, video quality, learning evaluation, learning analysis and socialized interaction to explore factors influencing the continuance intention of students to use MOOCs [75]. It was applied with knowledge outcome, performance proficiency and social influence to investigate factors influencing the continuance intention of students to use MOOCs [76]. It was tested with perceived reputation, perceived openness and perceived enjoyment to discover factors influencing the continuance intention of students to use MOOCs [77]. It was validated with task technology fit to explore factors influencing the continuance intention of students to use MOOCs [78]. It was extended with attitude and curiosity to discover that the continuance intention of students to use MOOCs was significantly influenced by attitude and curiosity [79]. SORM was extended with the features of technological and environmental to discover that flow experience is a significant factor influencing the continuance intention of students to use MOOCs [80].
The complex model has recorded a few studies that have investigated the extension of blended theories for factor exploration. ECM and TAM with the factors of MOOC performance and student habit were used to understand the psychological processes underlying the continuance intention of students to participate in MOOCs [81]. TTF and SDT with social motivation were used to examine factors influencing student adoption of MOOCs [21]. UTAUT and TTF with student satisfaction were used to explore factors influencing the continuance intention of students to use MOOCs [82]. TAM and TTF with social motivation and MOOC features were used to investigate the continuance intention of students to use MOOCs [83]. In a study of MOOC performance, the modified ISS and ECM with gamification perception were combined to indicate that perceived usefulness, student satisfaction and gamification perception significantly influenced the continuance intention of students to use MOOCs [84].
The comprehensive review of literature has shown the dearth of research on the application of MCA to explore associations among factors influencing student acceptance of MOOCs and heterogeneity sources. Table 1 summarizes the characteristics of data extracted from the 54 reviewed articles based on the variables of authors of an article (author), year of article publication (year), country of study (country), sample size (sample), most significantly influencing factors (factor), path coefficient (path), type of MOOC acceptance behavior (accept), data analysis method (method) and theoretical model applied for factor exploration (theory). An inclusive review of 54 studies on factors influencing student acceptance of MOOCs across 14 different countries of the world has been conducted to harvest pertinent data. This approach of soliciting research data from the published articles has been judged to be novel for obtaining reliable and validated scientific evidence in a format that is readily amenable to MCA [85].
The data in Table 1 show that about 40.74% of the studies were conducted in China, followed by Malaysia (14.81%) and Taiwan (7.41%). The same volume of works was recorded by South Korea, Australia and India (5.56%), Spain, Jordan and Saudi Arabia (3.70%) while the same volume of works was recorded by Turkey, Brazil, Ghana, Pakistan and Iran (1.85%). The sample size of respondents across studies ranged from 101 to 1344 with a mean of 360.70, a standard deviation of 243.33 and a total of 19,638 students. There are 28 significant factors identified across the 54 studies with the most significant one selected per study. The most significant factor has the highest path coefficient [23] and path coefficient (path) scores vary from 0.222 to 0.861. Structural analysis tools allow for the estimate of complex causal relationships among factors to test the path coefficients for statistical significance [86]. Four categories of MOOC acceptance behaviors (accept) were identified from the literature review as continual, intention, readiness and usage. The data analysis methods were mainly structural equation modeling (SEM), multiple regression analysis (MRA) and hierarchical regression analysis (HRA) as indicated by the method variable. The theoretical models are indicated by the theory variable as previously delineated.
2.2. Data Codification
The data for this study were extracted from 54 reviewed articles on factors influencing student acceptance of MOOCs (Table 1). The qualitative data for the MCA was coded as a subset of the characteristics of the extracted data. The variables used in the MCA are theory, sample and factor. The theory variable presents 4 categories coded as 1, 2, 3 and 4 for single, blended, extended and complex theories respectively. The sample variable presents 4 categories that were coded as 1, 2, 3 and 4 for a study with 101 to 411, 412 to 722, 723 to 1033 and 1034 to 1344 student participants to denote very small, small, large and very large samples respectively. The factor variable has 28 categories coded as 1, 2, …, 28. The variables of theory and sample were found in a meta-analysis study to be the significant sources of heterogeneity effects, but year, country and type were not [23]. Heterogeneity refers to the variation in the outcome of a research and it can determine the difficulty in drawing valid conclusions [87]. Moreover, it can help reach a much greater understanding of factors influencing student acceptance of MOOCs. Table 2 shows the labels, categories and definitions of variable categories of influencing factors and heterogeneity sources.
2.3. Data Analysis
The variables of theory, sample and factor pertinent to this study were captured in a dataset of influencing factors and heterogeneity sources (Table 1) to focus on a meaningful analysis that is consistent with MCA. The analysis of the subset of the dataset of influencing factors and heterogeneity sources was performed using the MCA to explore hidden associations. In more detail, MCA is an extension of the correspondence analysis (CA) to multiple variables, a generalization of the principal component analysis (PCA) to analyze manifold categorical variables and display hidden associations among categorical variables, or observations. It applies to qualitative variables in a similar way that PCA is amenable to quantitative variables. It finds the eigenvalue decomposition of the normalized covariance matrix of observations with the associated variables [91]. The method works by performing a series of mathematical transformations to compute the principal coordinates of the variable categories and observations in an optimal representation space based on inertia or eigenvalue criterion. The inertia in MCA is related to the eigenvalue in the parlance of PCA that measures how much categorical information is accounted for by each principal dimension. The higher the eigenvalue, the larger the amount of the total variance amongst categorical variables on that principal dimension [92].
MCA is a correspondence analysis performed on an indicator matrix or a Burt matrix with both matrices central to the analysis. The indicator matrix displays all observations in the form of a disjunctive map of variables. Each indicator variable along the matrix column represents one level of a categorical variable. Each observation along with the matrix takes a binary score of 1 or 0 depending on whether it does or does not belong to the category. The Burt matrix is a square symmetric map consisting of all cross-tabulations for all combinations of variables. It is more efficient than the indicator matrix for eigenvalue decomposition because its dimensions depend on the number of variable categories and not on the number of observations as in the case of the indicator matrix. It is a useful device for visualizing and analyzing the associations among categorical variables because it contains the counts of co-occurrences for all combinations of categories. The solutions computed by the method can be described by a bi-dimensional or biplot that plots most of the variable categories close together with unassociated ones plotted far apart [92].
The biplot graphical representation makes it easy to perceive, summarize, visualize and interpret a large complex dataset of categorical variables. It simplifies the structure of the inherent associations amongst variable categories and observations. The variable categories are data points on the graph such that categories close to the mean value are plotted near the graph origin and those that are more distant are plotted farther away from the origin. The variable categories with a similar distribution are close to each other through the formation of combination clouds of points [92,93]. The categories with different distributions are plotted at some distance apart and the resulting dimensions are interpreted by the locations of the points on the graph. The loadings of the points over the dimensions are important indicators. However, in general, a biplot is insufficient to explain most of the variances, but the first two dimensions usually contain higher eigenvalues than others [92,94].
MCA can be interpreted using two strategies which are factor analytical and cluster analytical [26]. In factor analytical strategy, one tries to label the principal dimensions, while clusters of categories are found using the cluster analytical strategy. This study follows the direction of factor analytical strategy using the materials provided by the MultipleCar toolbox [91] and the MCORRAN2 Matlab code [95]. The MCORRAN2 was used to generate the discrimination measures of the variable categories, while the MultipleCar toolbox was applied for other computations. A toolbox is a general software suitable for computing correspondence analysis with the aid of a graphical user interface [91]. The rotation of principal coordinates was performed using the widely known varimax orthogonal transformation to maximize the simplicity of interpretations of principal dimensions. The weighted scheme with default parameter was used to give an impressive Bentler simplicity index after rotation [96]. The simplicity indices of the principal coordinates of variables and principal coordinates of observations before rotation were 0.021 and 0.011 respectively. These simplicity indices of principal coordinates of variables and observations were increased to 0.901 and 0.874 respectively after rotation. This result implies that simplified principal coordinates of variables and observations were obtained using the varimax rotation algorithm with default parameter setting.
3. Results
MCA locates the variable categories in Euclidean space and the principal inertia is usually expressed as a percentage of the total inertia. The inertia values quantify the amount of variation that is accounted for by the corresponding principal dimensions. The higher the inertia, the larger the amount of the total variance among the variables on that principal dimension. Table 3 shows the result of the adjusted principal inertias based on the eigenvalues of the Burt matrix of non-trivial inertias, and cumulative inertia. The total inertia is 0.924, total principal inertia is 81.800% and cumulative inertia is 81.800%. The core bottleneck of inertias of dimensions is that they depend on the degree of associations among variable categories and can be seriously inflated. The previous study has suggested an adjusted version of inertia that was inspired by the joint correspondence analysis (JCA) to allow for higher and more meaningful percentages for the maps [97]. The average adjusted explained variance is 4.3%, which suggests that dimensions explaining less variance should be excluded from the map. This rule is equivalent to the criterion of one-eigenvalue of Kaiser’s rule in exploratory factor analysis [91]. This study, therefore, found 5 dimensions or axes that explained 81.800% of the total inertia based on the adjusted inertia.
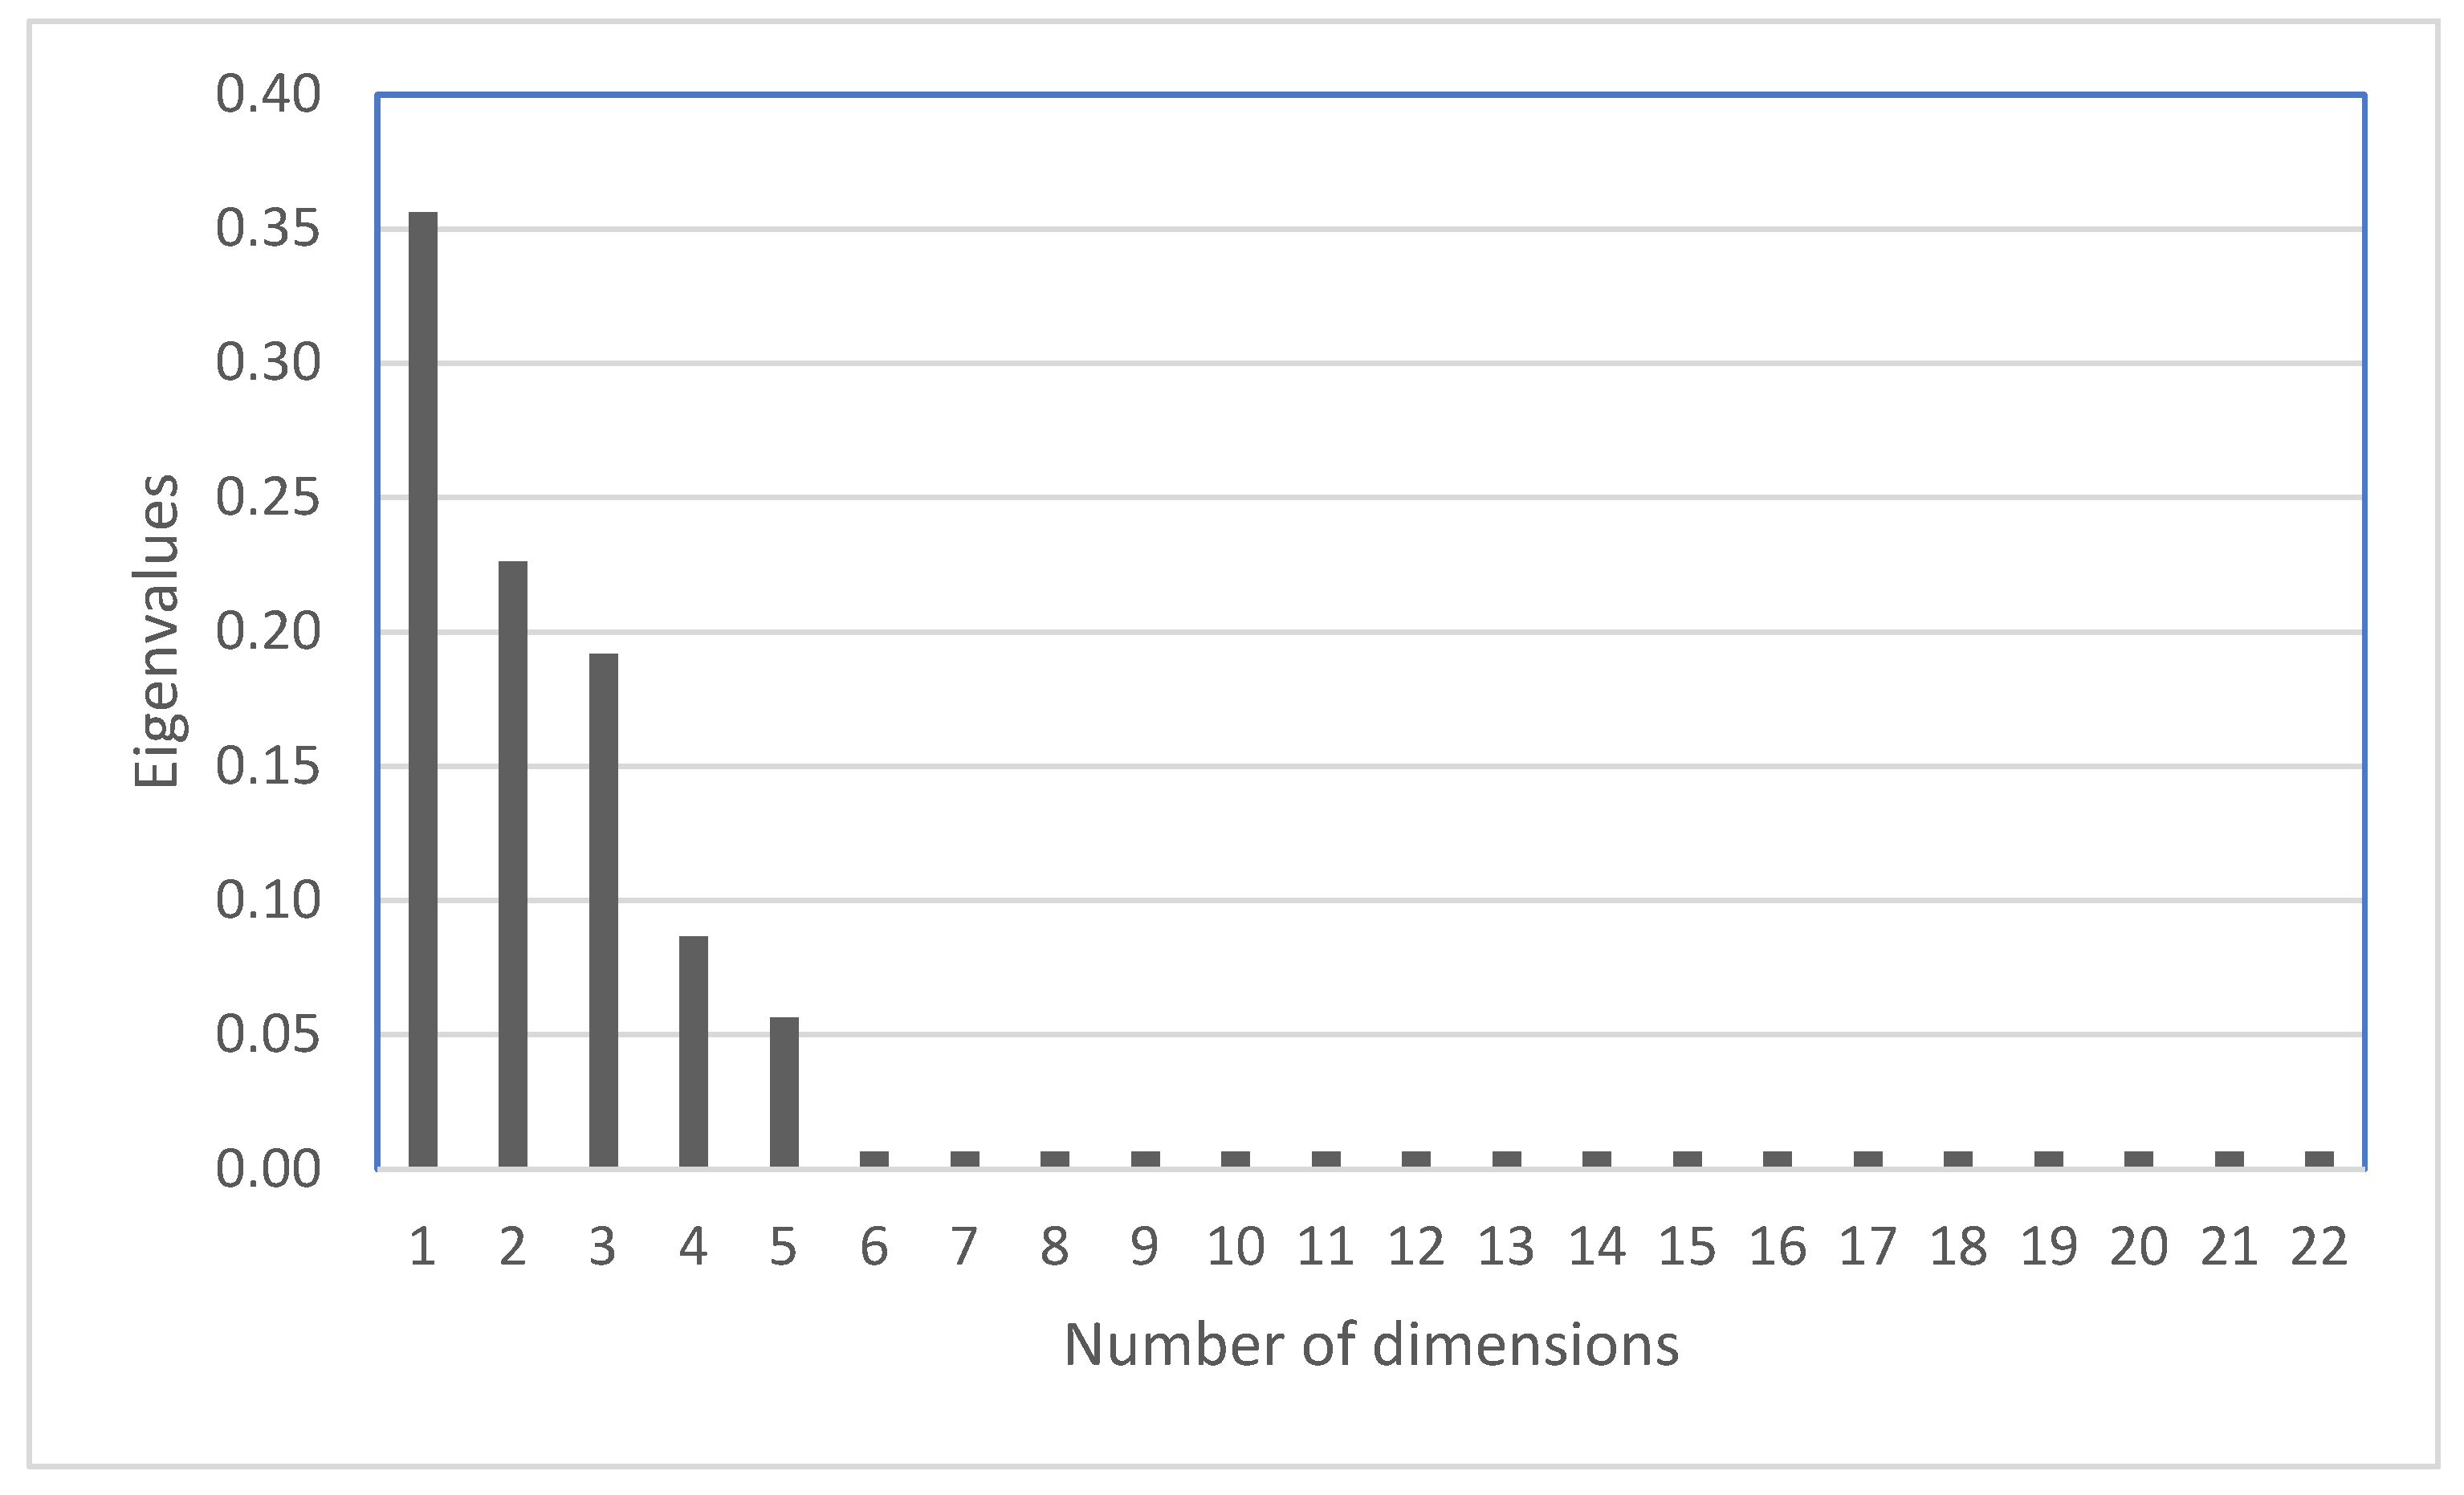
The scree plot of eigenvalues against the number of principal dimensions is shown in Figure 1. The plot is generally used to visually determine the number of dimensions to retain in the MCA. The elbow of the plot, according to the scree test is where the eigenvalues tend to level off, which is 6 in this scenario. The significant number of dimensions to retain is therefore 5 to the left of the elbow to further confirm visually that 5 dimensions should be retained for the subsequent MCA analysis.
The MCA faithfully analyzed a total of 3 variables, 36 corresponding variable categories and 54 observations to give an overall solution with 22 dimensions (Table 3). The indices of associations are total inertia of 11.000 and Cramer’s V statistic of 0.561 to indicate that 5 dimensions provide a satisfactory model fit with large association effects [98]. Moreover, the result shows the decomposition of total inertia into 22 axes to explain the total inertia of 0.924. The first, second, third, fourth and fifth dimensions accounted for 31.600%, 20.000%, 17.000%, 7.700%, 5.000%, respectively and together they accounted for 81.800% of the total inertia. The specification of the 5 dimensions is therefore sufficient for the MCA analysis because they account for a high proportion of the total inertia.
Table 4 shows the descriptive statistical result of variable categories by frequency, percentage and mass. The extended theory (C03) reflected the highest frequency of 37.04% within the theory variable, followed by the blended theory (C02) (27.78%), single theory (C01) (25.93%) while the complex theory (C04) reflected the least frequency (9.25%). This result indicates that blended theories are commonly used, but complex theories are least applied among the studies that investigated factors influencing student acceptance of MOOCs. Similarly, a very small sample (C05) reflected the highest frequency of 75.93% within the variable of the sample, followed by the small sample (C06) (14.81%), large sample (C07) (5.56%) while very large sample (C08) reflected the least frequency (3.70%). This result indicates that very small samples have been widely used, but very large samples are rarely used by researchers to explore factors influencing student acceptance of MOOCs. The factor of student satisfaction (C31) reflected the highest frequency of 14.81% within the factor variable, followed by student attitude (C26) (11.11%), behavioral intention (C09) (9.26%), perceived usefulness (C25) (9.26%), computer self-efficacy (C11) (7.41%), facilitating conditions (C15) (5.56%), intrinsic motivation (C18) (3.70%) while the other factors reflected the least frequency (1.85%). This result indicates that student satisfaction, student attitude, behavioral intention and perceived usefulness are widely used factors for exploring student acceptance of MOOCs.
The mass of a variable category is the total of the Burt matrix of relative frequencies or probability. The very small sample category has the highest mass of 0.2531 to account for the 25.31% of the study data, while several factor categories have the lowest mass of 0.0062 to account for 0.62% of the study data. Previous studies that have used very small samples and extended theories are common, while those that recorded a low mass of 0.0062 are sporadic according to the study data.
Table 5 shows the contributions of the rotated coordinates based on the diagnostic indices of correlation (Corr) and contribution (Cont). Correlation represents the contributions of axes to points by squared correlations of points with the axes. The contribution represents the influence of points on the axes. The highest correlation values for the dimensions are 0.660, 0.482, 0.440, 0.234 and 0.318 respectively. This result means that dimension one accounts for most of the inertia of theory for complex theory and contributes to the inertia of sample for a very small sample, small sample, very large sample and factor for student habit and gamification perception. Dimension two accounts for most of the inertia of theory for single theory and contributes to the inertia of extended theory, sample for very small sample, large sample and factor for self-regulation. Dimension three accounts for most of the inertia of theory for blended theory and contributes to the inertia of extended theory, sample for small sample, very large sample and factor for intrinsic motivation and student habit. Dimension four accounts for most of the inertia of theory for blended theory and contributes to the inertia of single theory, sample for a very small sample, small sample, very large sample and factor for intrinsic motivation and student habit. Dimension five accounts for most of the inertia of sample for large sample and contributes to the inertia of theory for extended theory and factor for self-regulation. In terms of the contributions, the complex theory, large sample and blended theory contribute the most to the inertia of dimensions.
Table 6 shows the inertia, quality and rotated principal coordinates of the study data. The inertia of a category is the proportion of the total inertia that the category contributes and quality is the dimensionality of the solution. The very small sample category was found to deviate from its expected value and contributed 0.70% to the total inertia. This result indicates that a very small sample is the most unusual under the basic assumption that none of the variables are correlated. The highest quality value of 0.885 was recorded for the single theory category, while the lowest quality value of 0.039 was recorded for the student satisfaction category. This result indicates that single theory was best represented by the five dimensions, while student satisfaction has the poorest representation. The interpretation of the rotated principal coordinates has been suggested instead of the unrotated principal coordinates because they give straightforward explanations for dimensions greater than two [91,99]. The result of the rotated principal coordinates of variables with salient values in the asterisk mark is shown in Table 6. Salient coordinates are those with squared values larger than the mean [91,99].
Dimension one contrasts the factors identified from single theories to be perceived enjoyment, engagement on platform, intellectual capital, perceived functional value, social competence, social influence and teacher knowledge from the theories that identified intrinsic motivation and knowledge outcome as significant factors influencing student acceptance of MOOCs. Dimension two contrasts the factors identified from blended theories to be course quality, functional attachment, intrinsic motivation, perceived behavioral control, utility value, from the theories that identified facilitating conditions, flow experience, knowledge outcome, perceived ease of use, performance expectancy, perceived reputation, subjective norm and task technology fit as significant factors influencing student acceptance of MOOCs. Dimension three describes the factors identified using complex theories tested on a small sample to be knowledge outcome, social competence and gamification perception as significant factors influencing student acceptance of MOOCs. Dimension four describes the factors tested on a large sample to be intrinsic motivation and self-regulation as significant factors influencing student acceptance of MOOCs. Dimension five describes the factors identified using complex theories tested on a very large sample to be student habit as a significant factor influencing student acceptance of MOOCs. The five dimensions could be labeled respectively as single theory factors, blended theory factors, complex theory with small sample factors, large sample factors and complex theory with very large sample factors.
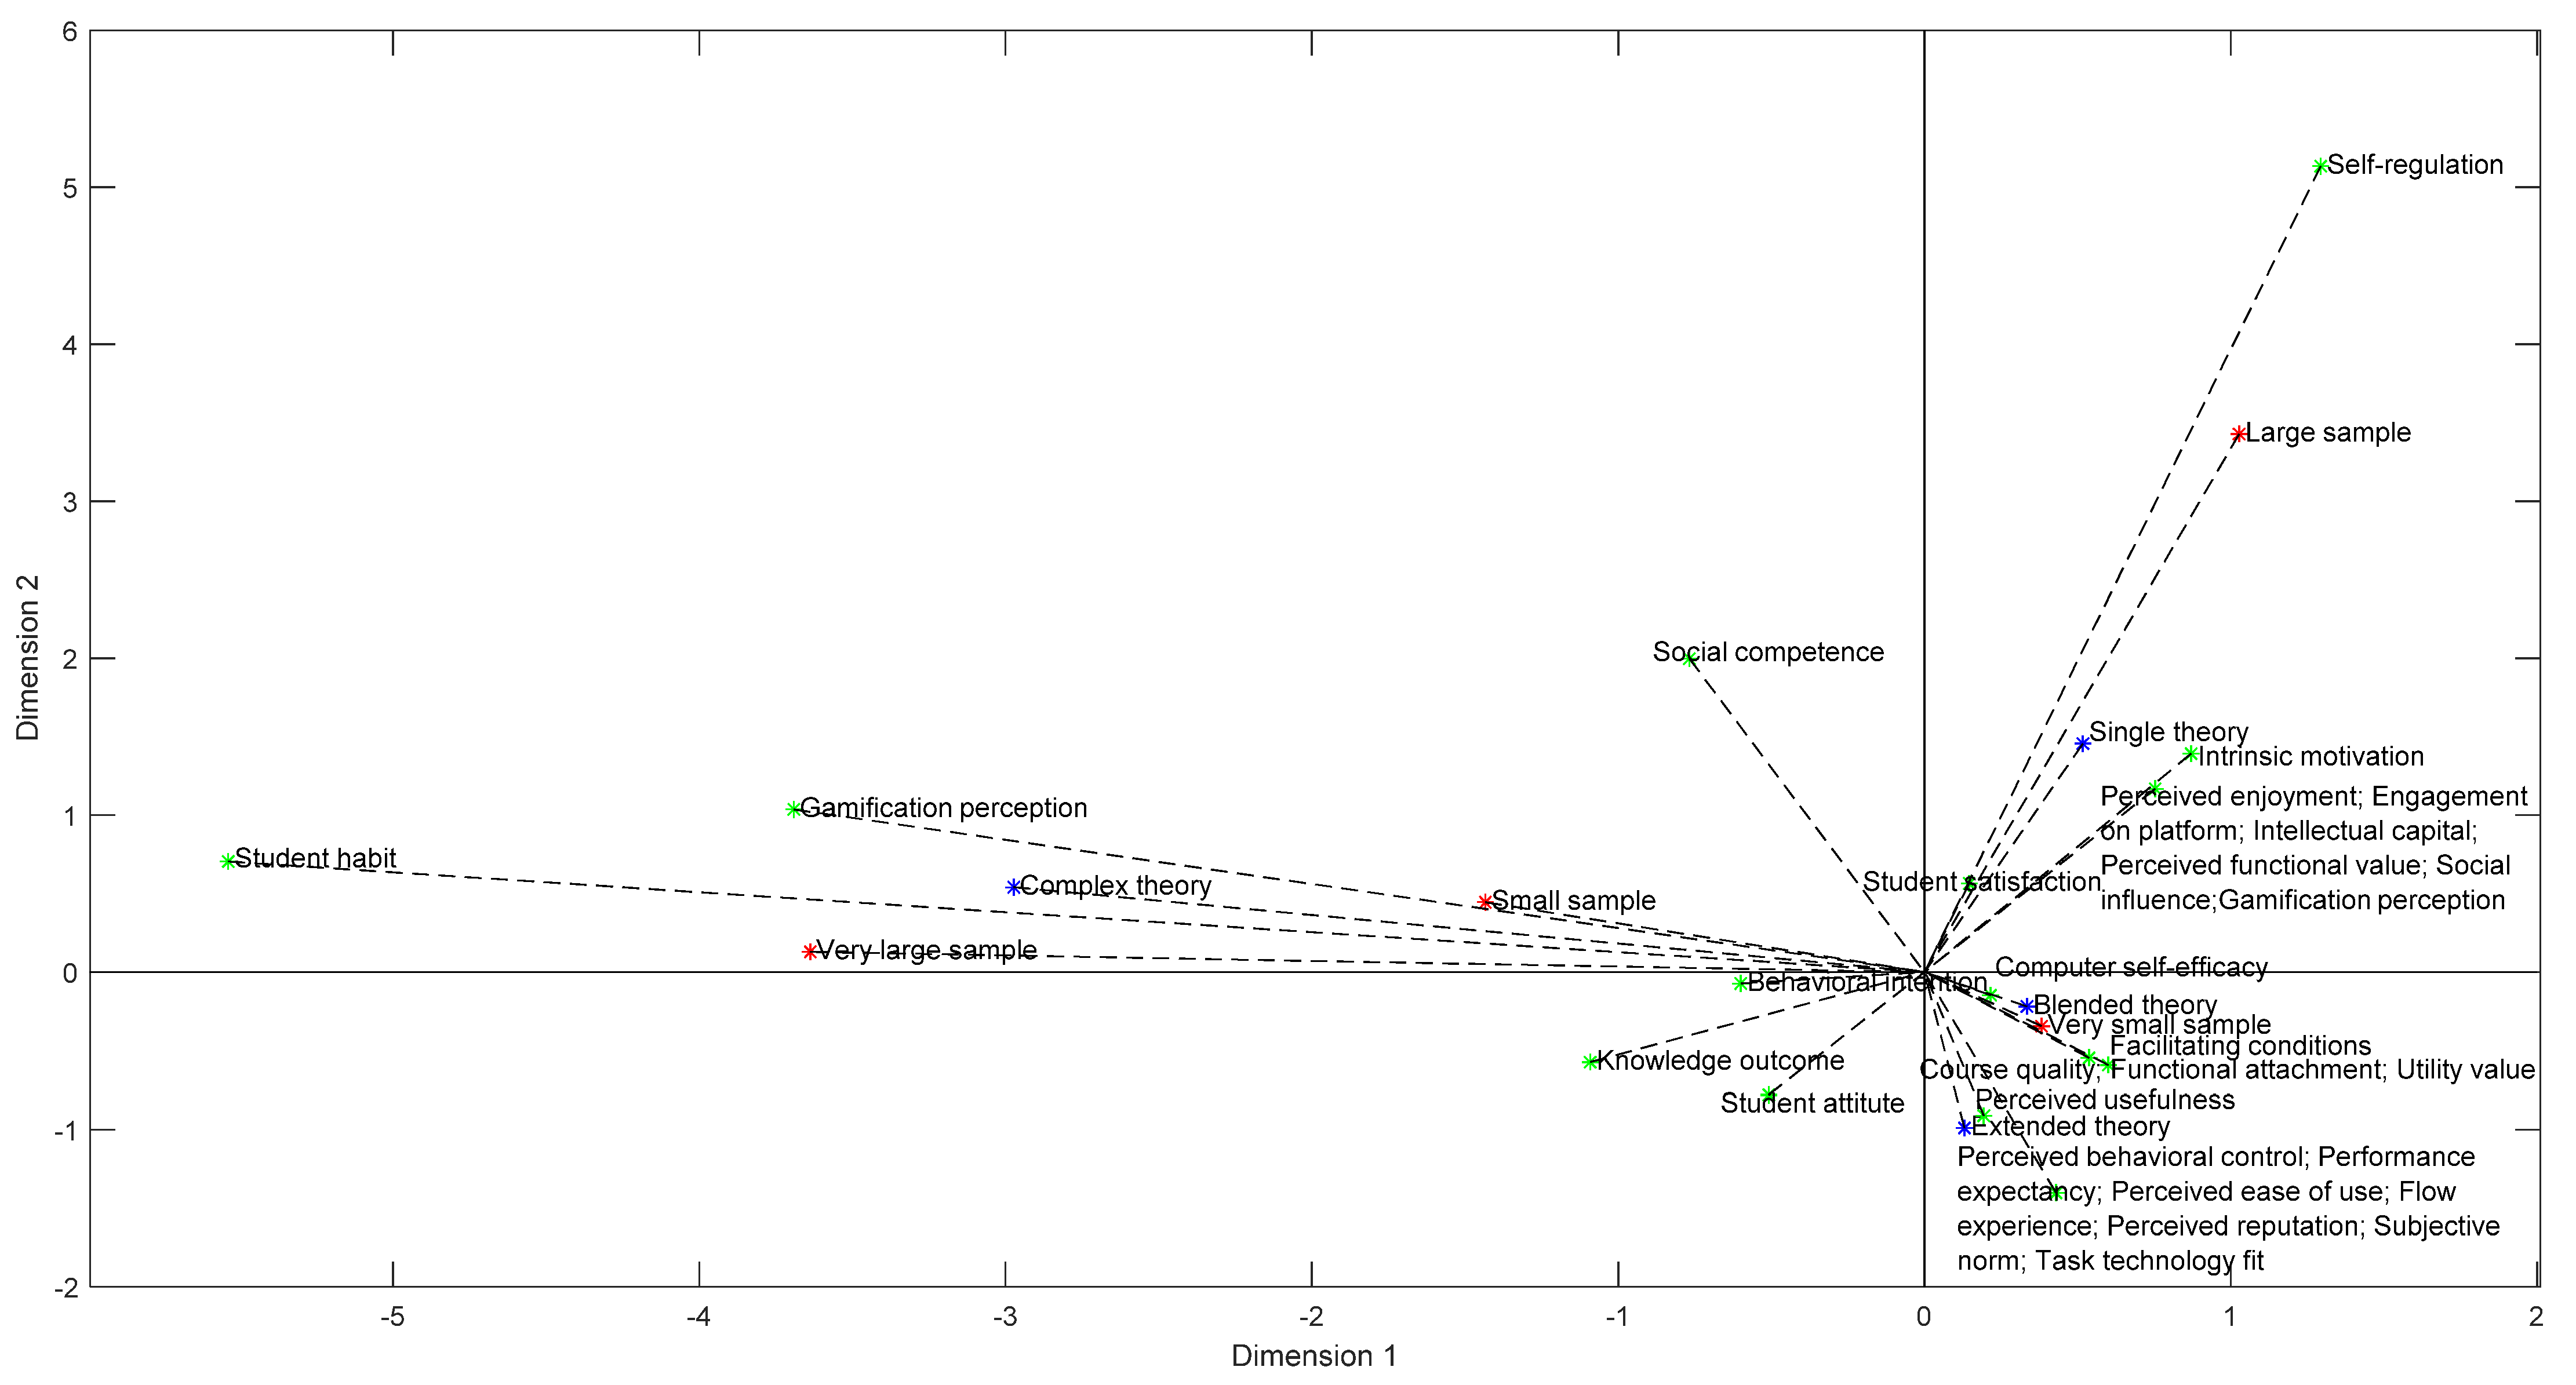
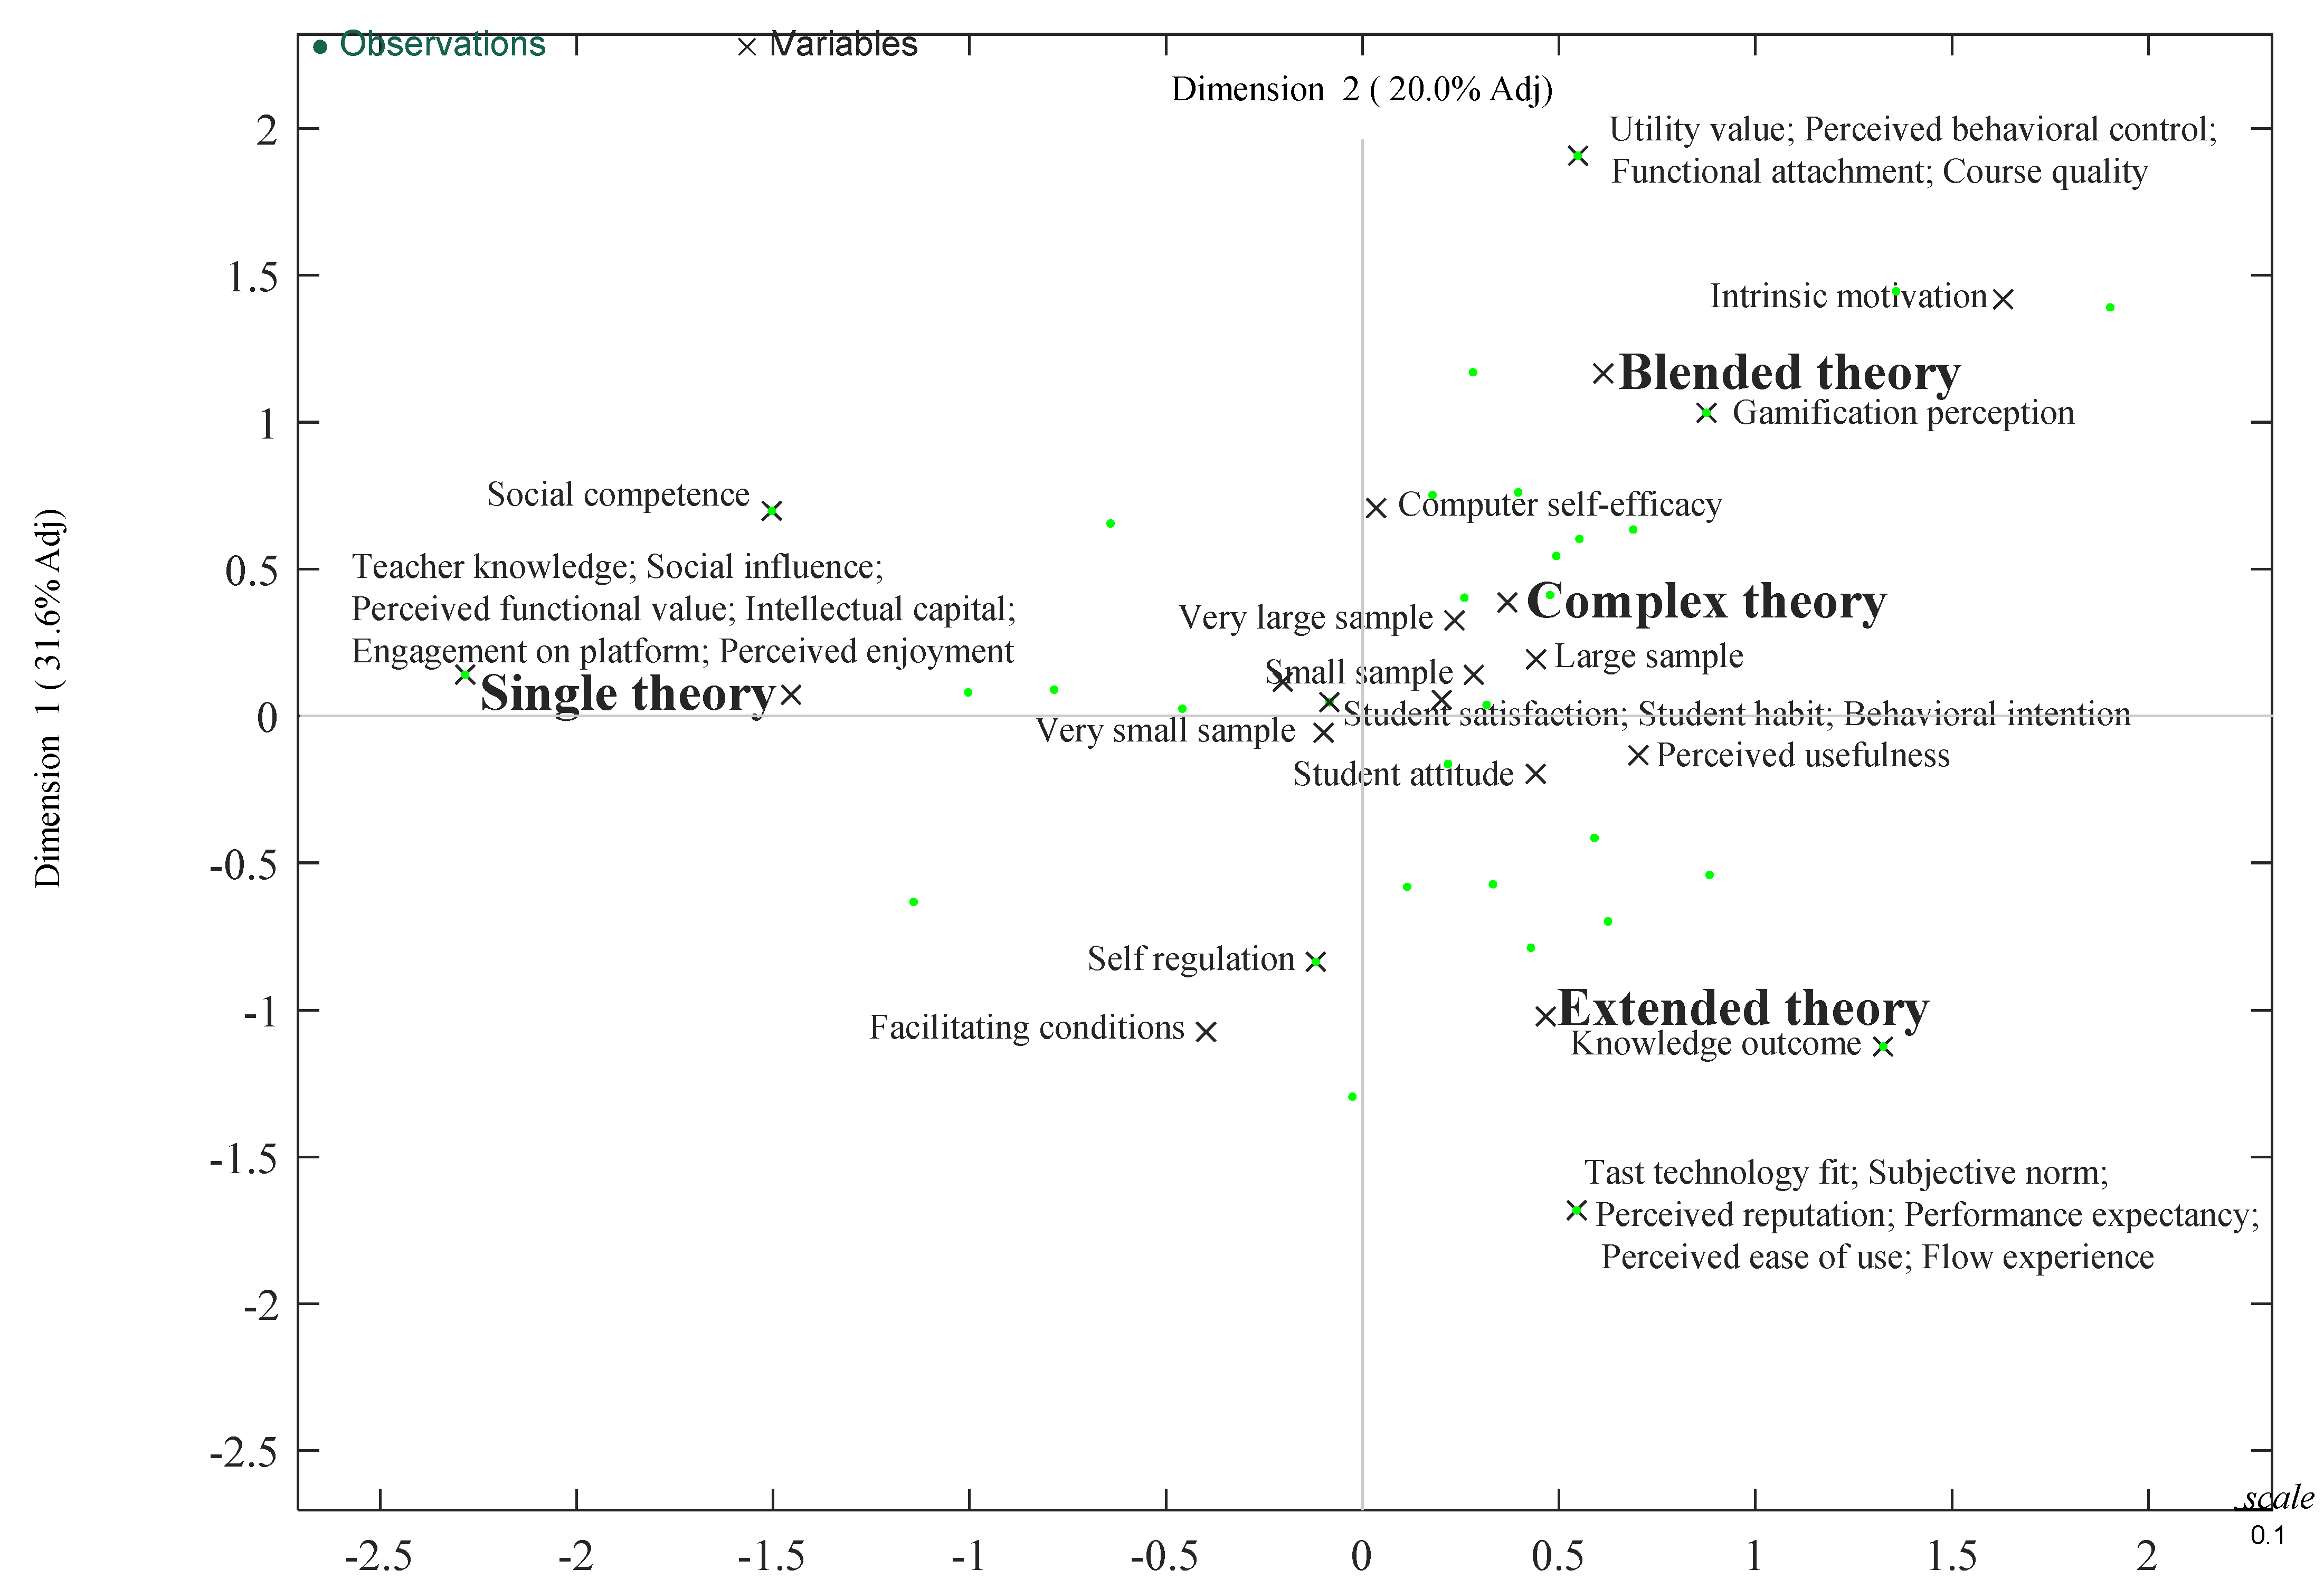
The focus of MCA is to provide an insight into a dataset through information visualization and it presents a useful application for visualizing associations amongst variable categories [92]. The first and second dimensions are usually plotted to examine the associations amongst variable categories [94]. The categories that are farther from the origin of the biplot are more discriminating, but the closer they are to the origin, the less distinct they are in general. That is unassociated variable categories are plotted far apart on the biplot and categories that are relatively closer from a combination cloud [93]. The present study has achieved a significant result about the discrimination measures obtained for the variables included in the MCA (Figure 2). It is highlighted as observed in the figure that the variable category of student habit becomes the most discriminating element of dimension one (x = −5.538; y = 0.704). Similarly, this can be said for the variable category of self-regulation (x = 1.294; y = 5.134) with regards to dimension two. The points farther away from the plot origin are more influential and those at the opposite sides of the plot indicate that a component contrasts these variable categories. The variable categories of student habit and self-regulation are more influential while dimension two highly contrasts the variable category of student habit from the category of self-regulation.
The biplot correspondence graph for the different contemplated variable categories of dimensions 1 and 2 accounts for approximately 51.60% of the explained inertia (Figure 3). The categories of different variables are associated when they are closed to each other, but categories of the same variable that are closed to each other are said to be similar. The biplot constructs the coordinates of the variable categories to visually observe the associations in data and interpret the principal components of the categories [92]. This result generally indicates the existence of associations through closeness and similarities by a combination cloud of variable categories. The biplot of the points that form the three variables of this study permits an organized structure to be drawn around four main levels of associations. The first is composed of single theories. It is associated with factors of social competence and a combination cloud of factors of teacher knowledge, social influence, perceived functional value, intellectual capital, engagement on platform and perceived enjoyment. The second is fulfilled by blended theories. It is more associated with factors of computer self-efficacy, gamification perception, intrinsic motivation and a combination cloud of factors of utility value, perceived behavioral control, functional attachment and course quality. The third is formed by extended theories. It is associated with factors of facilitating conditions, self-regulation, knowledge outcome and a combination cloud of factors of task technology fit, subjective norm, perceived reputation, performance expectancy, perceived ease of use and flow experience. It can be observed that student sample, that is very small sample, small sample, large sample, or very large sample does not play a discriminating role in these three associations. The last is formed by complex theories. It is more associated with very small sample, small sample, large sample, very large sample, factors of perceived usefulness, student attitude and a combination cloud of factors of student satisfaction, student habit and behavioral intention.
4. Discussions
The overarching objective of this study was to use the data science method of MCA to explore hidden associations among factors influencing student acceptance of MOOCs and heterogeneity sources. This has led to the development of an appropriate dataset based on a comprehensive review of related studies. The dataset was processed using the MultipleCar toolbox [91] and MCORRAN2 Matlab code [95], which are general software suitable for implementing correspondence analysis. The theory, sample and factor are the core variables of the dataset that were considered for the MCA to detect hidden associations. The number of observations in a study often refers to as sample size is an important research consideration. Sample size influences the precision, robustness and validity of the findings from research. The larger the sample size, the more robust is likely to be the study result, but it should not be either too small or too large. On one hand, very small samples can undermine the validity and prevent the generalization of findings. On the other hand, very large samples tend to amplify small differences into statistically significant differences and emphasize insignificant statistical differences [24]. Theoretical models in research offer the footing to establish credibility and application of a wrong theory can lead to erroneous interpretations, judgments and weedy conclusions. However, the selection of the right theory for research can enhance robustness, relevance and impactful findings [25].
This study has used MCA for the first time to investigate hidden associations among the variables of theory, sample and factor. The MCA enables the exploration of hidden associations among variable categories and observations not observed in the literature. It has helped in this study, to detect useful insights about hidden associations among the factors influencing student acceptance of MOOCs, theoretical models applied in the previous studies for factor exploration and sample sizes of students who participated in the different studies. The work reported in this paper is an important assignment that has been overlooked in the literature as evidence from the comprehensive review of the existing studies. Previous studies have improved the understanding of the application of MCA for factor exploration. Meta-regression analysis was used to show that “theoretical model” and “sample size” were statistically significant sources of heterogeneity in factors influencing student acceptance of MOOCs [23]. However, the investigation of associations among influencing factors and sources of heterogeneity that could have yielded significant insights was not previously found.
The MCA has helped this study address the literature chasm and further enrich the existing studies on MOOCs in the niche area of technology acceptance. There are some important findings from this study as elucidated as follows. Complex theories that combine two or more supplementary factors are rarely applied, but blended theories are commonly used for exploring factors influencing student acceptance of MOOCs. This study has found five previous studies in the literature that have used complex theories for exploring significant factors influencing student acceptance of MOOCs [21,53,81,82,84]. Very small samples usually between 101 and 411 are widely used, but very large samples are rarely used for exploring factors influencing student acceptance of MOOCs. The studies that have used very small samples constitute about 75.93% and the examples of such studies with less than 200 samples include [15,16,19,71,79,84]. Student satisfaction [7,19,52,53,60,74,75,82], student attitude [10,11,57,68,79,83], behavioral intention [5,21,51,59,72] and perceived usefulness [1,2,13,61,70] are the widely used factors for exploring student acceptance of MOOCs. The student satisfaction factor was shown in meta-analysis research to be the main significant factor influencing student acceptance of MOOCs [23]. A very small sample of students is the most unusual under the basic assumption that none of the variables are correlated. The single theory was best represented by the five dimensions, whilst student satisfaction has the poorest representation. The five dimensions found for dimension reduction were easily interpreted and labeled as single theory factors, blended theory factors, complex theory with small sample factors, large sample factors and complex theory with very large sample factors. The salient coordinates in the first and second dimensions suggest that these two dimensions are bipolar and the other three are unipolar. The bipolar dimensions contrast the influencing factors that are on the opposite sides of the dimensions [91]. The simplified principal coordinates of variables and observations were obtained using the widely known varimax rotation algorithm as recommended by the previous authors [91,99].
The results of this study generally conclude the existence of four main levels of associations. The first is formed by factors identified by single theories. It is associated with social competence and a combination cloud of factors of teacher knowledge, social influence, perceived functional value, intellectual capital, engagement on platform and perceived enjoyment. The second describes the factors identified by blended theories. It is more associated with computer self-efficacy, gamification perception, intrinsic motivation and a combination cloud of factors of utility value, perceived behavioral control, functional attachment and course quality. The third is composed of factors identified by extended theories. It is associated with facilitating conditions, self-regulation, knowledge outcome and a combination cloud of factors of task technology fit, subjective norm, perceived reputation, performance expectancy, perceived ease of use and flow experience. The last is formed by factors identified by complex theories. It is associated with very small sample, small sample, large sample, very large sample, factors of perceived usefulness, student attitude and a combination cloud of factors of student satisfaction, student habit and behavioral intention that explain student behaviors toward MOOC acceptance.
5. Conclusions
Different studies on the applications of MCA have been conducted in multitudinous fields over the past few decades. However, no one has focused on its unique application for exploring factors influencing student acceptance of MOOCs, which is the overarching objective of the research reported in this paper. It is pragmatic to explore hidden associations in a database of influencing factors to increase the understanding of multifarious heterogeneously conflicting factors of MOOC acceptance. The understanding of student acceptance of MOOCs will lead to better prediction of the use of the innovative education model and its associated information resources. In addition, it can lead to increased personal control of knowledge and better productivity of the education system.
The one discernible limitation of the present study is that reviewed articles were limited to 54 studies because of the criteria used to initiate the literature search. The search parameters might have excluded a significant number of studies that could have enriched the study findings. This intrinsic limitation could be addressed in future research by using other methodological techniques with less limiting article selection criteria to accommodate for expansion of information and generate more suitable data for analysis. Second, this study has focused mainly on student acceptance of MOOCs but extending the study to capture the perceptions of teachers could have yielded more perceptive findings. Future studies may examine the acceptance of MOOCs by teachers for a more comprehensive understanding of their usage. Moreover, future research can compare the acceptance of MOOCs by students with acceptance by teachers to discover more useful insights. This kind of research would be able to depict whether hidden associations exist in the perceptions of students and teachers on their acceptance of MOOCs. Nonetheless, this correspondence analysis study has provided valuable information regarding hidden associations amongst the factors influencing student acceptance of MOOCs.
More specifically, this study has found some important outcomes through the unique application of MCA. These outcomes include the following. A very small sample is the most unusual under the basic assumption that none of the variables are correlated. The simplified principal coordinates of variables and observations were obtained using the widely known varimax rotation algorithm. Five principal dimensions were found in this study that explained 81.800% of the total inertia based on the adjusted inertia. A single theory was best represented by the five dimensions, while student satisfaction has the poorest representation. The variable categories of student habit and self-regulation are more influential while dimension two highly contrasts the variable category of student habit from the category of self-regulation. The study has found the existence of four main levels of associations composed of single, blended, extended and complex theories respectively. Each level is associated with distinct variable categories and a combination cloud of similar variable categories.
Future work will investigate the behavior and performance of the cluster analytical strategy on the same data of this study for further insights that are not exposed by the factor analytical strategy.
Author Contributions
Conceptualization, C.T.O. and M.L.; methodology, O.O.O.; software, O.O.O.; validation, C.T.O., M.L. and O.O.O.; investigation, C.T.O.; data curation, C.T.O.; writing—original draft preparation, C.T.O. and M.L.; writing—review and editing, O.O.O. supervision, M.L. All authors have read and agreed to the published version of the manuscript.
Funding
This research received no external funding.
Institutional Review Board Statement
Not applicable.
Informed Consent Statement
Not applicable.
Data Availability Statement
Data available in the manuscript.
Conflicts of Interest
The authors declare no conflict of interest.
References
- Shao, Z. Examining the impact mechanism of social psychological motivations on individuals’ continuance intention of MOOCs. Internet Res. 2018, 28, 232–250. [Google Scholar] [CrossRef]
- Al-Adwan, A.S. Investigating the drivers and barriers to MOOCs adoption: The perspective of TAM. Educ. Inf. Technol. 2020, 25, 5771–5795. [Google Scholar] [CrossRef]
- Gupta, K.P. Investigating the adoption of MOOCs in a developing country application of technology-user-environment framework and self-determination theory. Inter. Technol. Smart Educ. 2020, 17, 355–375. [Google Scholar] [CrossRef]
- Al-Adwan, A.S.; Khdour, N. Exploring student readiness to MOOCs in Jordan: A structural equation modelling approach. J. Inf. Technol. Educ. 2020, 19, 223–242. [Google Scholar]
- Arpaci, I.; Al-Emran, M.; Al-Sharafi, M.A. The impact of knowledge management practices on the acceptance of massive open online courses (MOOCs) by engineering students: A cross-cultural comparison. Telem. Inform. 2020, 54, 101468. [Google Scholar] [CrossRef]
- Tamjidyamcholo, A.; Gholipour, R.; Kazemi, M.A. Examining the perceived consequences and usage of MOOCs on learning effectiveness. Iran. J. Manag. Stud. 2020, 13, 495–525. [Google Scholar]
- Chen, C.C.; Lee, C.H.; Hsiao, K.L. Comparing the determinants of non-MOOC and MOOC continuance intention in Taiwan: Effects of interactivity and openness. Libr. Hi Technol. 2018, 36, 705–719. [Google Scholar] [CrossRef]
- Nisha, F.; Senthil, V. MOOCs: Changing trend towards open distance learning with special reference to India. DESIDOC J. Libr. Inf. Technol. 2015, 35, 82–89. [Google Scholar] [CrossRef] [Green Version]
- Olugbara, C.T.; Letseka, M. Factors predicting integration of e-learning by preservice science teachers: Structural model development and testing. Elect. J. E-Learn 2020, 18, 421–435. [Google Scholar] [CrossRef]
- Alraimi, K.M.; Zo, H.; Ciganek, A.P. Understanding the MOOCs continuance: The role of openness and reputation. Comp. Educ. 2015, 80, 28–38. [Google Scholar] [CrossRef]
- Teo, T.; Dai, H.M. The role of time in the acceptance of MOOCs among Chinese university students. Interac. Learn Environ. 2019. [Google Scholar] [CrossRef]
- Chao, L.; Zhou, H. Enhancing the efficiency of massive online learning by integrating intelligent analysis into MOOCs with an application to education of sustainability. Sustainability 2018, 10, 468. [Google Scholar]
- Tao, D.; Fu, P.; Wang, Y.; Zhang, T.; Qu, X. Key characteristics in designing massive open online courses (MOOCs) for user acceptance: An application of the extended technology acceptance model. Interac. Learn Environ. 2019. [Google Scholar] [CrossRef]
- Shao, Z.; Chen, K. Understanding individuals’ engagement and continuance intention of MOOCs: The effect of interactivity and the role of gender. Internet Res. 2021, 31(4), 1262–1289. [Google Scholar] [CrossRef]
- Altalhi, M. Toward a model for acceptance of MOOCs in higher education: The modified UTAUT model for Saudi Arabia. Educ. Inf. Technol. 2021, 26, 1589–1605. [Google Scholar] [CrossRef]
- Altalhi, M. Towards understanding the students’ acceptance of MOOCs: A unified theory of acceptance and use of technology (UTAUT). Inter. J. Emerg. Technol. Learn 2021, 16, 237–253. [Google Scholar] [CrossRef]
- Shapiro, H.B.; Lee, C.H.; Wyman Roth, N.E.; Li, K.; Çetinkaya-Rundel, M.; Canelas, D.A. Understanding the massive open online course (MOOC) student experience: An examination of attitudes, motivations, and barriers. Comp. Educ. 2017, 110, 35–50. [Google Scholar] [CrossRef]
- Fianu, E.; Blewett, C.; Ampong, G.O. Toward the development of a model of student usage of MOOCs. Educ. Train. 2020, 62, 521–541. [Google Scholar] [CrossRef]
- Joo, Y.J.; So, H.J.; Kim, N.H. Examination of relationships among students’ self-determination, technology acceptance, satisfaction, and continuance intention to use K-MOOCs. Comp. Educ. 2018, 122, 260–272. [Google Scholar] [CrossRef]
- Lu, H.P.; Dzikria, I. The role of intellectual capital and social capital on the intention to use MOOC. Know. Manag. Res. Pract. 2020. [Google Scholar] [CrossRef]
- Khan, I.U.; Hameed, Z.; Yu, Y.; Islam, T.; Sheikh, Z.; Khan, S.U. Predicting the acceptance of MOOCs in a developing country: Application of task-technology fit model, social motivation, and self-determination theory. Telem. Inform. 2018, 35, 964–978. [Google Scholar] [CrossRef]
- Youssef, A.I. Massive open online course (MOOCs) acceptance: The role of task-technology fit (TTF) for higher education sustainability. Sustainability 2021, 13, 7374. [Google Scholar] [CrossRef]
- Olugbara, C.T.; Letseka, M.; Ogunsakin, R.E.; Olugbara, O.O. Meta-analysis of factors influencing student acceptance of massive open online courses for open distance learning. Afr. J. Inf. Syst. 2021, 13, 5. [Google Scholar]
- Faber, J.; Fonseca, L.M. How sample size influences research outcomes. Dent. Press J. Orthod. 2014, 19, 27–29. [Google Scholar] [CrossRef]
- Stewart, D.; Klein, S. The use of theory in research. Intern. J. Clin. Pharm. 2016, 38, 615–619. [Google Scholar] [CrossRef] [PubMed] [Green Version]
- Bacher, J. Goodness-of-fit measures for multiple correspondence analysis. Qual. Quan. 1995, 29, 1–16. [Google Scholar] [CrossRef]
- Yu, T.; Richardson, J. An exploratory factor analysis and reliability analysis of the student online learning readiness (SOLR) instrument. Online Learn 2015, 19, 120–141. [Google Scholar] [CrossRef] [Green Version]
- Venkatesh, V.; Morris, M.G.; Davis, F.D.; Davis, G.B. User acceptance of information technology: Toward a unified view. MIS Quart. 2003, 27, 425–478. [Google Scholar] [CrossRef] [Green Version]
- Katz, E.; Blumler, J.G.; Gurevitch, M. Uses and gratifications research. Publ. Opin. Quart. 1973, 37, 509–523. [Google Scholar] [CrossRef]
- Bhattacherjee, A. Understanding information systems continuance: An expectation-confirmation model. MIS Quart. 2001, 25, 351–370. [Google Scholar] [CrossRef]
- Sheth, J.N.; Newman, B.I.; Gross, B.L. Why we buy what we buy: A theory of consumption values. J. Bus. Res. 1991, 22, 159–171. [Google Scholar] [CrossRef]
- Goodhue, D.L.; Thompson, R.L. Task-technology fit and individual performance. MIS Quart. 1995, 19, 213–236. [Google Scholar] [CrossRef]
- Anderson, T.; Dron, J. Three generations of distance education pedagogy. Inter. Rev. Rese. Open Distrib. Learn 2011, 12, 80–97. [Google Scholar] [CrossRef] [Green Version]
- Ma, L.; Lee, C.S. Investigating the adoption of MOOCs: A technology–user–environment perspective. J. Comp. Assist. Learn 2019, 35, 89–98. [Google Scholar] [CrossRef] [Green Version]
- Bandura, A. Self-efficacy: Toward a unifying theory of behavioral change. Psyc. Rev. 1977, 84, 191–215. [Google Scholar] [CrossRef]
- Mehrabian, A.; Russell, J.A. An Approach to Environment Psychology; MIT Press: Cambridge, MA, USA, 1974. [Google Scholar]
- Triandis, H.C. Values, attitudes, and interpersonal behavior. Nebraska Symp. Motiv. 1979, 27, 195–259. [Google Scholar]
- Davis, F.D.; Bagozzi, R.P.; Warshaw, P.R. User acceptance of computer technology: A comparison of two theoretical models. Manag. Sci. 1989, 35, 982–1003. [Google Scholar] [CrossRef] [Green Version]
- Bowlby, J. Attachment and Loss; Basic Books: New York, NY, USA, 1973; pp. 297–305. [Google Scholar]
- Baxter, G.; Sommerville, I. Socio-technical systems: From design methods to systems engineering. Interac. Comp. 2011, 23, 4–17. [Google Scholar] [CrossRef] [Green Version]
- Zimmerman, B.J. Self-regulation involves more than metacognition: A social cognitive perspective. Educ. Psyc. 1995, 30, 217–221. [Google Scholar] [CrossRef]
- Deci, E.L.; Koestner, R.; Ryan, R.M. A meta-analytic review of experiments examining the effects of extrinsic rewards on intrinsic motivation. Psych. Bul. 1999, 125, 627–668. [Google Scholar] [CrossRef] [PubMed]
- Ryan, R.M.; Deci, E.L. Self-determination theory and the facilitation of intrinsic motivation, social development, and well-being. Amer. Psyc. 2000, 55, 68–78. [Google Scholar] [CrossRef]
- Bandura, A. Social Foundations of Thought and Action: A Social Cognitive Theory; Prentice-Hall: Englewood Cliffs, NJ, USA, 1986. [Google Scholar]
- Ajzen, I. The theory of planned behavior. Org. Behav. Hum. Deci. Pro. 1991, 50, 179–211. [Google Scholar] [CrossRef]
- DeLone, W.H.; McLean, E.R. The DeLone and McLean model of information systems success: A ten-year update. J. Manag. Inf. Syst. 2003, 19, 9–30. [Google Scholar]
- Eccles, J.; Adler, T.F.; Futterman, R.; Goff, S.B.; Kaczala, C.M.; Meece, J.L.; Midgley, C. Expectations, values, and academic behaviors. In Achievement and Achievement Motives: Psychological and Sociological Approaches; Spence, J.T., Ed.; W.H. Freeman: San Francisco, CA, USA, 1983; pp. 75–146. [Google Scholar]
- Parasuraman, A.; Zeithaml, V.A.; Berry, L.L. SERVQUAL: A multiple-item scale for measuring consumer perceptions of service quality. J. Retail. 1988, 64, 12–40. [Google Scholar]
- Subramaniam, T.; Suhaimi, N.; Latif, A.; Abu Kassim, Z.; Fadzil, M. MOOCs readiness: The scenario in Malaysia. Inter. Rev. Res. Open Distr. Learn. 2019, 20, 80–101. [Google Scholar]
- Al-Shami, S.A.; Aziz, H.; Rashid, N. Retracted: The adoption of MOOC utilization among undergraduate students in Universiti Teknikal Malaysia Melaka (UTEM). J. Fund. Appl. Sci. 2018, 10, 2634–2654. [Google Scholar]
- Haron, H.; Hussin, S.; Yusof, A.R.M.; Samad, H.; Yusof, H. Implementation of the UTAUT model to understand the technology adoption of MOOC at public universities. In Proceedings of the IOP Conference Series: Materials Science and Engineering, Proceedings of the International Colloquium on Computational & Experimental Mechanics (ICCEM 2020), Selangor, Malaysia, 25–26 June 2020; IOP Publishing: Bristol, UK, 2021. [Google Scholar]
- Daneji, A.A.; Ayub, A.F.M.; Khambari, M.N.M. The effects of perceived usefulness, confirmation and satisfaction on continuance intention in using massive open online course (MOOC). Knowl. Manag. E-Learn 2019, 11, 201–214. [Google Scholar]
- Lu, Y.; Wang, B.; Lu, Y. Understanding key drivers of MOOC satisfaction and continuance intention to use. J. Elect. Comm. Res. 2019, 20, 105–117. [Google Scholar]
- de Moura, V.F.; de Souza, C.A.; Viana, A.B.N. The use of massive open online courses (MOOCs) in blended learning courses and the functional value perceived by students. Comp. Educ. 2021, 161, 104077. [Google Scholar] [CrossRef]
- Huang, L.; Zhang, J.; Liu, Y. Antecedents of student MOOC revisit intention: Moderation effect of course difficulty. Inter. J. Inf. Manag. 2017, 37, 84–91. [Google Scholar] [CrossRef]
- Mohamad, M.; Abdul Rahim, M.K.I. MOOCs continuance intention in Malaysia: The moderating role of internet self-efficacy. Inter. J. Supp. Chain Manag. 2018, 7, 132–139. [Google Scholar]
- Hsu, J.Y.; Chen, C.C.; Ting, P.F. Understanding MOOC continuance: An empirical examination of social support theory. Inter. Learn Environ. 2018, 26, 1100–1118. [Google Scholar] [CrossRef]
- Yang, M.; Shao, Z.; Liu, Q.; Liu, C. Understanding the quality factors that influence the continuance intention of students toward participation in MOOCs. Educ. Technol. Res. Develop. 2017, 65, 1195–1214. [Google Scholar] [CrossRef]
- Yang, H.H.; Su, C.H. Learner behaviour in a MOOC practice-oriented course: In empirical study integrating AM and TPB. Inter. Rev. Res. Open Distr. Learn 2017, 18, 35–63. [Google Scholar] [CrossRef] [Green Version]
- Pozón-López, I.; Higueras-Castillo, E.; Muñoz-Leiva, F.; Liébana-Cabanillas, F.J. Perceived user satisfaction and intention to use massive open online courses (MOOCs). J. Comp. High. Educ. 2021, 33, 85–120. [Google Scholar] [CrossRef]
- Jo, D. Exploring the determinants of MOOCs continuance intention. KSII Trans. Internet Infor. Syst. 2018, 12, 3992–4005. [Google Scholar]
- Yang, G. Understanding continuous use intention of MOOCs-a perspective from subjective task value. Advances in Social Science, Education and Humanities Research (ASSEHR). In Proceedings of the 2018 4th International Conference on Social Science and Higher Education (ICSSHE 2018), Sanya, China, 28–30 September 2018; pp. 707–710. [Google Scholar]
- Zi-Jun, C.U.I.; Qian-Wen, Y.U.; Jiang, C.B.; Meng-Ting, C.H.E.N. Exploring factors influencing MOOC continuous learning willingness based on self-efficacy. DEStech Transactions on Social Science, Education and Human Science. In Proceedings of the 2018 4th International Conference on Social Science and Management (ICSSM 2018), Shenzhen, China, 24–25 November 2018; DEStech Publications Inc: Lancaster, PA, USA, 2020. [Google Scholar]
- Zhou, M. Chinese university students’ acceptance of MOOCs: A self-determination perspective. Comp. Educ. 2016, 92, 194–203. [Google Scholar] [CrossRef]
- Abdulatif, H.; Velázquez-Iturbide, J.Á. Relationship between motivations, personality traits and intention to continue using MOOCs. Educ. Inf. Technol. 2020, 25, 4417–4435. [Google Scholar] [CrossRef]
- Zhu, X.; Wang, Y. An empirical study on the users’ continuance intention about MOOC: Based on attachment theory. In Proceedings of the 2018 International Symposium on Educational Technology (ISET), Osaka, Japan, 31 July–2 August 2018; pp. 209–213. [Google Scholar]
- Gao, S.; Yang, Y. Exploring users’ adoption of MOOCs from the perspective of the institutional theory. In Proceedings of the 2015 14th Wuhan International Conference on e-Business (WHICEB), Wuhan, China, 19–21 June 2015; pp. 282–290. [Google Scholar]
- Razami, H.H.; Ibrahim, R. Investigating the factors that influence the acceptance of MOOC as a supplementary learning tool in higher education. J. Adv. Res. Dyn. Control Syst. 2020, 12, 522–530. [Google Scholar]
- Zhang, L.; Rong, W.; Cui, S.; Ouyang, Y.; Xiong, Z. Social factors analysis for understanding MOOCs usage among university students in China. In Proceedings of the 2019 IEEE International Conference on Engineering, Technology and Education (TALE), Royal Ambarrukmo Hotel, Yogyakarta, Indonesia, 10–13 December 2019. [Google Scholar] [CrossRef]
- Zhang, M.; Yin, S.; Luo, M.; Yan, W. Learner control, user characteristics, platform difference, and their role in adoption intention for MOOC learning in China. Austra. J. Educ. Technol. 2017, 33, 114–133. [Google Scholar] [CrossRef] [Green Version]
- Govindarajan, P.B.; Krishnan, A.R. A study on influence of web quality and self-efficacy on massive open online courses (MOOCs) technology adoption by extending the UTAUT model with reference to student MOOC users. Shanlax Inter. J. Manag. 2019, 7, 47–53. [Google Scholar] [CrossRef] [Green Version]
- Haron, H.; Hussin, S.; Yusof, A.R.M.; Samad, H.; Yusof, H.; Juanita, A. Level of technology acceptance and factors that influence the use of MOOC at public universities. Inter. J. Psych. Rehab. 2020, 24(6), 5412–5418. [Google Scholar]
- Mulik, S.; Srivastava, M.; Yajnik, N. Extending UTAUT model to examine MOOC adoption. NMIMS Manag. Rev. 2018, 36, 26–44. [Google Scholar]
- Wang, Q.; Khan, M.S.; Khan, M.K. Predicting user perceived satisfaction and reuse intentions toward massive open online courses (MOOCs) in the Covid-19 pandemic: An application of the UTAUT model and quality factors. Int. J. Res. Bus. Soc. Sci. 2021, 10, 1–11. [Google Scholar] [CrossRef]
- Yang, G.; Sun, Q. Exploring the Factors Affecting MOOCs Continuance Intention: The Role of Design Quality. Advances in Social Science, Education and Humanities Research (ASSEHR). In Proceedings of the 2018 2nd International Conference on Education, Economics and Management Research (ICEEMR 2018), Singapore, 9–10 June 2018; pp. 242–245. [Google Scholar]
- Zhou, J. Exploring the factors affecting learners’ continuance intention of MOOCs for online collaborative learning: An extended ECM perspective. Austra. J. Educ. Technol. 2017, 33, 123–135. [Google Scholar] [CrossRef] [Green Version]
- Al-Rahmi, W.M.; Yahaya, N.; Alamri, M.M.; Alyoussef, I.Y.; Al-Rahmi, A.M.; Kamin, Y.B. Integrating innovation diffusion theory with technology acceptance model: Supporting students’ attitude towards using a massive open online course (MOOCs) systems. Inter. Learn Environ. 2019. [Google Scholar] [CrossRef]
- Ouyang, Y.; Tang, C.; Rong, W.; Zhang, L.; Yin, C.; Xiong, Z. Task-technology fit aware expectation-confirmation model towards understanding of MOOCs continued usage intention. In Proceedings of the 50th Hawaii International Conference on System Sciences, Hawaii, HI, USA, 4–7 January 2017; pp. 174–183. [Google Scholar]
- Dai, H.M.; Teo, T.; Rappa, N.A.; Huang, F. Explaining Chinese university students’ continuance learning intention in the MOOC setting: A modified expectation confirmation model perspective. Comp. Educ. 2020, 150, 103850. [Google Scholar] [CrossRef]
- Zhao, Y.; Wang, A.; Sun, Y. Technological environment, virtual experience, and MOOC continuance: A stimulus–organism–response perspective. Comp. Educ. 2020, 144, 103721. [Google Scholar] [CrossRef]
- Dai, H.M.; Teo, T.; Rappa, N.A. Understanding continuance intention among MOOC participants: The role of habit and MOOC performance. Comp. Human Behav. 2020, 112, 106455. [Google Scholar] [CrossRef]
- Wan, L.; Xie, S.; Shu, A. Toward an understanding of university students’ continued intention to use MOOCs: When UTAUT model meets TTF model. SAGE Open 2020, 10(3), 1–15. [Google Scholar] [CrossRef]
- Wu, B.; Chen, X. Continuance intention to use MOOCs: Integrating the technology acceptance model (TAM) and task technology fit (TTF) model. Comp. Human Behav. 2017, 67, 221–232. [Google Scholar] [CrossRef]
- Yang, Q.; Lee, Y.C. The critical factors of student performance in MOOCs for sustainable education: A case of Chinese universities. Sustainability 2021, 13, 8089. [Google Scholar] [CrossRef]
- Epizitone, A.; Olugbara, O.O. Multiple correspondence analysis of critical success factors for enterprise resource planning system implementation. J. Manag. Inf. Dec. Sci. 2020, 23, 175–186. [Google Scholar]
- Olugbara, C.T.; Imenda, S.N.; Olugbara, O.O.; Khuzwayo, H.B. Moderating effect of innovation consciousness and quality consciousness on intention-behaviour relationship in E-learning integration. Educ. Inf. Technol. 2020, 25, 329–350. [Google Scholar] [CrossRef]
- Higgins, J.P.; Thompson, S.G. Quantifying heterogeneity in a meta-analysis. Stat. Medic. 2002, 21, 1539–1558. [Google Scholar] [CrossRef]
- Teo, T.; Tan, L. The theory of planned behaviour (TPB) and pre-service teachers’ technology acceptance: A validation study using structural equation modeling. J. Technol. Tea. Educ. 2012, 20, 89–104. [Google Scholar]
- Onah, D.F.; Sinclair, J. Exploring learners’ strategies of self-regulated learning abilities in a novel MOOC Platform: eLDa. In Proceedings of the 23rd Annual Conference of the Association for Learning Technology (ALT2016), University of Warwick, Coventry, UK, 6–8 September 2016; University of Warwick Publications service & WRAP: Coventry, UK, 2016. [Google Scholar]
- Teo, T.; Lee, C.B. Explaining the intention to use technology among student teachers: An application of the theory of planned behavior (TPB). Campus-Wide Inf. Syst. 2010, 27, 60–67. [Google Scholar] [CrossRef]
- Lorenzo-Seva, U.; van de Velden, M. Multiplecar: A graphical user interface Matlab toolbox to compute multiple correspondence analysis. J. Stat. Softw. 2019, 90, 1–17. [Google Scholar] [CrossRef] [Green Version]
- Das, S.; Sun, X. Factor association with multiple correspondence analysis in vehicle-pedestrian crashes. Transp. Rese. Rec. 2015, 2519, 95–103. [Google Scholar] [CrossRef]
- Ogunsakin, R.E.; Moyo, S.; Olugbara, O.O.; Israel, C. Relating student engagement indicators to academic performance using multiple correspondence analysis. Cybern. Inf. Technol. 2021, 21, 87–102. [Google Scholar] [CrossRef]
- Ayele, D.; Zewotir, T.; Mwambi, H. Multiple correspondence analysis as a tool for analysis of large health surveys in African settings. Afri. Health Sci. 2014, 14, 1036–1045. [Google Scholar] [CrossRef] [PubMed] [Green Version]
- Trujillo-Ortiz, A. Multiple Correspondence Analysis Based on the Burt Matrix. Available online: https://www.mathworks.com/matlabcentral/fileexchange/22558-multiple-correspondence-analysis-based-on-the-burt-matrix (accessed on 26 November 2021).
- Bentler, P.M. Factor simplicity index and transformation. Psychometrika 1977, 42, 277–295. [Google Scholar] [CrossRef]
- Greenacre, M.J. Biplots in correspondence analysis. J. Appl. Stat. 1993, 20, 251–269. [Google Scholar] [CrossRef]
- Cohen, J. Statistical Power Analysis for the Behavioral Sciences, 2nd ed.; Academic Press: Cambridge, MA, USA, 2013. [Google Scholar]
- Lorenzo-Seva, U.; van de Velden, M.; Kiers, H. Oblique rotation in correspondence analysis a step forward in the search of the simplest interpretation. Br. J. Mathe. Stat. Psyc. 2009, 62, 583–600. [Google Scholar] [CrossRef] [PubMed]
Figure 1.
Scree plot of eigenvalues against the number of dimensions.

Figure 2.
Discrimination measures of the variables.

Figure 3.
Biplot of the first and second dimensions.


Table 1.
Dataset of influencing factors and heterogeneity sources.
| Author | Year | Country | Sample | Factor | Path | Accept | Method | Theory |
|---|---|---|---|---|---|---|---|---|
| [1] | 2018 | China | 247 | Perceived usefulness | 0.739 | Continual | SEM | Blended |
| [2] | 2020 | Jordan | 403 | Perceived usefulness | 0.394 | Intention | SEM | Extended |
| [3] | 2020 | India | 798 | Intrinsic motivation | 0.582 | Intention | SEM | Blended |
| [4] | 2020 | Jordan | 468 | Social competency | 0.340 | Readiness | SEM | Single |
| [5] | 2020 | Turkey | 540 | Behavioral intention | 0.823 | Usage | SEM | Extended |
| [6] | 2020 | Iran | 234 | Facilitating conditions | 0.309 | Usage | SEM | Single |
| [7] | 2018 | Taiwan | 854 | Student satisfaction | 0.561 | Continual | SEM | Single |
| [10] | 2019 | Malaysia | 1148 | Student attitude | 0.709 | Intention | SEM | Blended |
| [11] | 2019 | Australia | 209 | Student attitude | 0.363 | Intention | SEM | Extended |
| [13] | 2019 | China | 668 | Perceived usefulness | 0.290 | Usage | SEM | Extended |
| [14] | 2021 | China | 294 | Engagement on platform | 0.662 | Continual | SEM | Single |
| [15] | 2021 | Saudi Arabia | 169 | Facilitating condition | 0.334 | Usage | SEM | Extended |
| [16] | 2021 | Saudi Arabia | 150 | Computer self-efficacy | 0.263 | Usage | MRA | Blended |
| [18] | 2020 | Ghana | 204 | Facilitating conditions | 0.378 | Usage | SEM | Extended |
| [19] | 2018 | South Korea | 166 | Student satisfaction | 0.861 | Continual | SEM | Blended |
| [20] | 2020 | Taiwan | 203 | Intellectual capital | 0.531 | Intention | SEM | Single |
| [21] | 2018 | Pakistan | 414 | Behavioral intention | 0.222 | Usage | SEM | Complex |
| [34] | 2019 | China | 827 | Self-regulation | 0.366 | Intention | HRA | Single |
| [49] | 2019 | Malaysia | 413 | Computer self-efficacy | 0.314 | Ready | SEM | Single |
| [50] | 2018 | Malaysia | 200 | Social influence | 0.488 | Usage | MRA | Single |
| [51] | 2021 | Malaysia | 400 | Behavioral intention | 0.847 | Usage | SEM | Single |
| [52] | 2019 | Malaysia | 368 | Student satisfaction | 0.600 | Continual | SEM | Single |
| [53] | 2019 | China | 300 | Student satisfaction | 0.662 | Continual | SEM | Single |
| [54] | 2021 | Brazil | 101 | Perceived functional value | 0.801 | Continual | SEM | Single |
| [55] | 2017 | China | 246 | Teacher knowledge | 0.323 | Intention | SEM | Single |
| [56] | 2018 | Malaysia | 251 | Perceived enjoyment | 0.465 | Continual | SEM | Single |
| [57] | 2018 | Taiwan | 357 | Student attitude | 0.498 | Intention | SEM | Blended |
| [58] | 2017 | China | 294 | Course quality | 0.392 | Continual | SEM | Blended |
| [59] | 2017 | Taiwan | 272 | Behavioral intention | 0.455 | Usage | SEM | Blended |
| [60] | 2021 | Spain | 210 | Student satisfaction | 0.540 | Intention | SEM | Blended |
| [61] | 2018 | South Korea | 237 | Perceived usefulness | 0.311 | Continual | SEM | Blended |
| [62] | 2018 | China | 294 | Utility value | 0.341 | Continual | SEM | Blended |
| [63] | 2018 | China | 216 | Computer self-efficacy | 0.551 | Continual | SEM | Blended |
| [64] | 2016 | China | 400 | Perceived behavioral control | 0.742 | Intention | SEM | Blended |
| [65] | 2020 | Spain | 212 | Intrinsic motivation | 0.435 | Continual | SEM | Blended |
| [66] | 2018 | China | 257 | Functional attachment | 0.404 | Continual | SEM | Blended |
| [67] | 2015 | China | 247 | Perceived ease of use | 0.610 | Intention | SEM | Extended |
| [68] | 2020 | Malaysia | 111 | Student attitude | 0.576 | Intention | SEM | Extended |
| [69] | 2019 | China | 285 | Subjective norm | 0.319 | Intention | SEM | Extended |
| [70] | 2017 | China | 214 | Perceived usefulness | 0.440 | Intention | SEM | Extended |
| [71] | 2019 | India | 168 | Computer self-efficacy | 0.265 | Intention | MRA | Extended |
| [72] | 2020 | Malaysia | 400 | Behavioral intention | 0.543 | Usage | SEM | Extended |
| [73] | 2018 | India | 310 | Performance expectancy | 0.273 | Intention | SEM | Extended |
| [74] | 2021 | China | 283 | Student satisfaction | 0.453 | Intention | SEM | Extended |
| [75] | 2018 | China | 271 | Student satisfaction | 0.528 | Continual | SEM | Extended |
| [76] | 2017 | China | 435 | Knowledge outcome | 0.495 | Continual | SEM | Extended |
| [77] | 2015 | South Korea | 316 | Perceived reputation | 0.239 | Continual | SEM | Extended |
| [78] | 2017 | China | 234 | Task technology fit | 0.558 | Continual | SEM | Extended |
| [79] | 2020 | Australia | 160 | Student attitude | 0.695 | Continual | SEM | Extended |
| [80] | 2020 | China | 374 | Flow experience | 0.610 | Continual | SEM | Extended |
| [81] | 2020 | Australia | 1344 | Student habit | 0.571 | Continual | SEM | Complex |
| [82] | 2020 | China | 464 | Student satisfaction | 0.481 | Continual | SEM | Complex |
| [83] | 2017 | China | 252 | Student attitude | 0.509 | Continual | SEM | Complex |
| [84] | 2021 | China | 586 | Gamification perception | 0.365 | Continual | SEM | Complex |
All paths (Path) are significant at probability level < 0.05.
Table 2.
Description of variable categories.
| Label | Category | Definition |
|---|---|---|
| C01 | Single theory | The basic theory that relates two or more factors to explain MOOC acceptance behavior |
| C02 | Blended theory | The theory that agglutinates two or more single theories to explain MOOC acceptance behavior |
| C03 | Extended theory | The theory that incorporates two or more factors to a blended theory to explain MOOC acceptance behavior |
| C04 | Complex theory | The theory that incorporates two or more factors to an extended theory to explain MOOC acceptance behavior |
| C05 | Very small sample | A sample of 101 to 411 students participating in MOOC acceptance research |
| C06 | Small sample | A sample of 412 to 722 students participating in MOOC acceptance research |
| C07 | Large sample | A sample of 723 to 1033 students participating in MOOC acceptance research |
| C08 | Very large sample | A sample of 1034 to 1344 students participating in MOOC acceptance research |
| C09 | Behavioral intention | The subjective probability of an individual to perform a certain behavior [59]. |
| C10 | Course quality | Knowledgeability, the authority of course content and attitude of lecturers toward teaching students with MOOCs [58]. |
| C11 | Computer self-efficacy | A subjective assessment of the skill level of a person to effectively use MOOCs to perform learning tasks [18]. |
| C12 | Perceived enjoyment | Positive affection for interactive functions is provided within MOOCs [56]. |
| C13 | Engagement on platform | The effective involvement of a student with the learning process that results from his/her interactions with other students and professors in MOOCs [14]. |
| C14 | Functional attachment | The ability of MOOC providers to provide the users with online interactive support that is conducive for students to be immersed in MOOCs [66]. |
| C15 | Facilitating conditions | The degree to which an individual believes that technical and non-technical infrastructures exist to support the use of MOOCs [15]. |
| C16 | Flow experience | The state of deep absorption in an intrinsically enjoyable activity while engaging within MOOCs [80]. |
| C17 | Intellectual capital | The degree to which an individual perceives the capability of knowing the knowledge shared by a teacher through exchanging knowledge in MOOCs [20]. |
| C18 | Intrinsic motivation | The performance of an activity for the good of a student without receiving any reward, but mainly for satisfaction and enjoyment of MOOCs [60]. |
| C19 | Knowledge outcome | Perception of students on the subject matter that will be provided to make them feel satisfied with learning using MOOCs [76]. |
| C20 | Perceived behavioral control | The degree to which a student perceives how easy or difficult it would be using MOOCs, based on the resources and opportunities that are available to students [88]. |
| C21 | Perceived functional value | The appreciation is derived from an alternative capacity for functional, utilitarian, or physical performance [31]. |
| C22 | Perceived ease of use | The degree to which a student believes that using MOOCs would be free of superfluous effort [67]. |
| C23 | Performance expectancy | The perception of students that using MOOCs will improve their learning performance [73]. |
| C24 | Perceived reputation | MOOC platforms are associated with highly regarded, influential and trustworthy institutions of higher education [77]. |
| C25 | Perceived usefulness | The degree to which students consider that MOOCs can be an effective device for enhancing academic performance [2]. |
| C26 | Student attitude | The degree to which a student perceives a positive or negative feeling related to the use of MOOCs [83]. |
| C27 | Social competence | Represent skills, capacities and a sense of control that is necessary for managing social situations, developing and sustaining relationships through MOOCs [4]. |
| C28 | Self-regulation | The ability of a student to control goals setting, task strategies, time management and environment structuring help students to succeed in their learning process [89]. |
| C29 | Student habit | The habitual use of MOOCs to lessen cognitive effort in activating the preceding actions in performing a complicated behavior and continuing participation in the environment [81]. |
| C30 | Social influence | The degree to which a student perceives that other people believe he or she should use MOOCs [73]. |
| C31 | Student satisfaction | Perception of students about enjoyment, happiness and accomplishment in learning in MOOCs [27]. |
| C32 | Subjective norm | The degree to which a student perceives that most people who are important to him or her think he should or should not use MOOCs [90]. |
| C33 | Task technology fit | The degree to which the technology of MOOCs helps a student in performing an assignment [78]. |
| C34 | Teacher knowledge | MOOC courses can be evaluated with a higher quality that can lead to further revisit intention of students [55]. |
| C35 | Utility value | The external incentives that learning with MOOCs can help students get job opportunities, job promotions, or salary increases [62]. |
| C36 | Gamification perception | Gamification is a way to increase the motivation and engagement of students to improve their course performance [84]. |
Label is the unique identifier for a category.
Table 3.
The adjusted principal inertias are based on the eigenvalues of the Burt matrix.
| Axis. | Eigenvalue | Percentage Inertia | Cumulative Percentage |
|---|---|---|---|
| 1 | 0.3563 | 31.6 | 31.6 |
| 2 | 0.2262 | 20.0 | 51.6 |
| 3 | 0.1918 | 17.0 | 68.6 |
| 4 | 0.0867 | 7.7 | 76.3 |
| 5 | 0.0565 | 5.0 | 81.3 |
| 6 | 0.0064 | 0.6 | 81.8 |
| 7 | 0.0000 | 0.0 | 81.8 |
| 8 | 0.0000 | 0.0 | 81.8 |
| 9 | 0.0000 | 0.0 | 81.8 |
| 10 | 0.0000 | 0.0 | 81.8 |
| 11 | 0.0000 | 0.0 | 81.8 |
| 12 | 0.0000 | 0.0 | 81.8 |
| 13 | 0.0000 | 0.0 | 81.8 |
| 14 | 0.0000 | 0.0 | 81.8 |
| 15 | 0.0000 | 0.0 | 81.8 |
| 16 | 0.0000 | 0.0 | 81.8 |
| 17 | 0.0000 | 0.0 | 81.8 |
| 18 | 0.0000 | 0.0 | 81.8 |
| 19 | 0.0000 | 0.0 | 81.8 |
| 20 | 0.0000 | 0.0 | 81.8 |
| 21 | 0.0000 | 0.0 | 81.8 |
| 22 | 0.0000 | 0.0 | 81.8 |
Total eigenvalue = 0.924, cumulative percentage = 81.800%.
Table 4.
Descriptive statistics of categories.
| Variable | Label | Frequency | Percentage | Mass |
|---|---|---|---|---|
| Theory | C01 | 14 | 25.93 | 0.0864 |
| C02 | 15 | 27.78 | 0.0926 | |
| C03 | 20 | 37.04 | 0.1235 | |
| C04 | 5 | 9.26 | 0.0309 | |
| Sample | C05 | 41 | 75.93 | 0.2531 |
| C06 | 8 | 14.81 | 0.0494 | |
| C07 | 3 | 5.56 | 0.0185 | |
| C08 | 2 | 3.70 | 0.0123 | |
| Factor | C09 | 5 | 9.26 | 0.0309 |
| C10 | 1 | 1.85 | 0.0062 | |
| C11 | 4 | 7.41 | 0.0247 | |
| C12 | 1 | 1.85 | 0.0062 | |
| C13 | 1 | 1.85 | 0.0062 | |
| C14 | 1 | 1.85 | 0.0062 | |
| C15 | 3 | 5.56 | 0.0185 | |
| C16 | 1 | 1.85 | 0.0062 | |
| C17 | 1 | 1.85 | 0.0062 | |
| C18 | 2 | 3.70 | 0.0123 | |
| C19 | 1 | 1.85 | 0.0062 | |
| C20 | 1 | 1.85 | 0.0062 | |
| C21 | 1 | 1.85 | 0.0062 | |
| C22 | 1 | 1.85 | 0.0062 | |
| C23 | 1 | 1.85 | 0.0062 | |
| C24 | 1 | 1.85 | 0.0062 | |
| C25 | 5 | 9.26 | 0.0309 | |
| C26 | 6 | 11.11 | 0.0370 | |
| C27 | 1 | 1.85 | 0.0062 | |
| C28 | 1 | 1.85 | 0.0062 | |
| C29 | 1 | 1.85 | 0.0062 | |
| C30 | 1 | 1.85 | 0.0062 | |
| C31 | 8 | 14.81 | 0.0494 | |
| C32 | 1 | 1.85 | 0.0062 | |
| C33 | 1 | 1.85 | 0.0062 | |
| C34 | 1 | 1.85 | 0.0062 | |
| C35 | 1 | 1.85 | 0.0062 | |
| C36 | 1 | 1.85 | 0.0062 |
Label is the unique identifier for a category.
Table 5.
Contributions of rotated coordinates.
| Dimension | |||||||||||
|---|---|---|---|---|---|---|---|---|---|---|---|
| 1 | 2 | 3 | 4 | 5 | |||||||
| Variable | Label | Corr | Cont | Corr | Cont | Corr | Cont | Corr | Cont | Corr | Cont |
| Theory | C01 | 0.068 | 0.023 | 0.482 | 0.183 | 0.075 | 0.030 | 0.200 | 0.093 | 0.059 | 0.030 |
| C02 | 0.031 | 0.010 | 0.012 | 0.004 | 0.440 | 0.170 | 0.234 | 0.106 | 0.124 | 0.061 | |
| C03 | 0.007 | 0.002 | 0.375 | 0.121 | 0.124 | 0.042 | 0.006 | 0.002 | 0.318 | 0.136 | |
| C04 | 0.660 | 0.273 | 0.019 | 0.009 | 0.001 | 0.000 | 0.003 | 0.002 | 0.001 | 0.000 | |
| Sample | C05 | 0.337 | 0.037 | 0.243 | 0.030 | 0.021 | 0.003 | 0.107 | 0.016 | 0.049 | 0.008 |
| C06 | 0.261 | 0.101 | 0.022 | 0.010 | 0.360 | 0.163 | 0.173 | 0.093 | 0.011 | 0.006 | |
| C07 | 0.045 | 0.020 | 0.450 | 0.218 | 0.050 | 0.025 | 0.063 | 0.037 | 0.249 | 0.160 | |
| C08 | 0.372 | 0.163 | 0.000 | 0.000 | 0.275 | 0.141 | 0.120 | 0.073 | 0.008 | 0.005 | |
| Factor | C09 | 0.027 | 0.011 | 0.000 | 0.000 | 0.048 | 0.023 | 0.025 | 0.014 | 0.004 | 0.002 |
| C10 | 0.005 | 0.002 | 0.004 | 0.002 | 0.033 | 0.017 | 0.019 | 0.012 | 0.040 | 0.027 | |
| C11 | 0.003 | 0.001 | 0.001 | 0.001 | 0.000 | 0.000 | 0.019 | 0.011 | 0.046 | 0.029 | |
| C12 | 0.008 | 0.004 | 0.017 | 0.008 | 0.004 | 0.002 | 0.048 | 0.030 | 0.024 | 0.016 | |
| C13 | 0.008 | 0.004 | 0.017 | 0.008 | 0.004 | 0.002 | 0.048 | 0.030 | 0.024 | 0.016 | |
| C14 | 0.005 | 0.002 | 0.004 | 0.002 | 0.033 | 0.017 | 0.019 | 0.012 | 0.040 | 0.027 | |
| C15 | 0.012 | 0.005 | 0.011 | 0.006 | 0.011 | 0.006 | 0.043 | 0.026 | 0.014 | 0.009 | |
| C16 | 0.003 | 0.001 | 0.024 | 0.012 | 0.003 | 0.002 | 0.004 | 0.003 | 0.031 | 0.021 | |
| C17 | 0.008 | 0.004 | 0.017 | 0.008 | 0.004 | 0.002 | 0.048 | 0.030 | 0.024 | 0.016 | |
| C18 | 0.021 | 0.009 | 0.048 | 0.024 | 0.124 | 0.064 | 0.161 | 0.097 | 0.027 | 0.018 | |
| C19 | 0.016 | 0.007 | 0.004 | 0.002 | 0.089 | 0.046 | 0.044 | 0.027 | 0.019 | 0.013 | |
| C20 | 0.005 | 0.002 | 0.004 | 0.002 | 0.033 | 0.017 | 0.019 | 0.012 | 0.040 | 0.027 | |
| C21 | 0.008 | 0.004 | 0.017 | 0.008 | 0.004 | 0.002 | 0.048 | 0.030 | 0.024 | 0.016 | |
| C22 | 0.003 | 0.001 | 0.024 | 0.012 | 0.003 | 0.002 | 0.004 | 0.003 | 0.031 | 0.021 | |
| C23 | 0.003 | 0.001 | 0.024 | 0.012 | 0.003 | 0.002 | 0.004 | 0.003 | 0.031 | 0.021 | |
| C24 | 0.003 | 0.001 | 0.024 | 0.012 | 0.003 | 0.002 | 0.004 | 0.003 | 0.031 | 0.021 | |
| C25 | 0.003 | 0.001 | 0.055 | 0.026 | 0.001 | 0.000 | 0.027 | 0.015 | 0.002 | 0.001 | |
| C26 | 0.024 | 0.010 | 0.050 | 0.023 | 0.064 | 0.031 | 0.016 | 0.009 | 0.011 | 0.006 | |
| C27 | 0.008 | 0.004 | 0.049 | 0.025 | 0.089 | 0.047 | 0.003 | 0.002 | 0.037 | 0.024 | |
| C28 | 0.023 | 0.010 | 0.323 | 0.163 | 0.005 | 0.003 | 0.004 | 0.003 | 0.227 | 0.151 | |
| C29 | 0.423 | 0.189 | 0.006 | 0.003 | 0.166 | 0.087 | 0.136 | 0.084 | 0.012 | 0.008 | |
| C30 | 0.008 | 0.004 | 0.017 | 0.008 | 0.004 | 0.002 | 0.048 | 0.030 | 0.024 | 0.016 | |
| C31 | 0.003 | 0.001 | 0.036 | 0.016 | 0.000 | 0.000 | 0.000 | 0.000 | 0.000 | 0.000 | |
| C32 | 0.003 | 0.001 | 0.024 | 0.012 | 0.003 | 0.002 | 0.004 | 0.003 | 0.031 | 0.021 | |
| C33 | 0.003 | 0.001 | 0.024 | 0.012 | 0.003 | 0.002 | 0.004 | 0.003 | 0.031 | 0.021 | |
| C34 | 0.008 | 0.004 | 0.017 | 0.008 | 0.004 | 0.002 | 0.048 | 0.030 | 0.024 | 0.016 | |
| C35 | 0.005 | 0.002 | 0.004 | 0.002 | 0.033 | 0.017 | 0.019 | 0.012 | 0.040 | 0.027 | |
| C36 | 0.188 | 0.084 | 0.013 | 0.007 | 0.056 | 0.029 | 0.076 | 0.047 | 0.009 | 0.006 | |
Label is the unique identifier for a category, corr = correlation and cont = contribution.
Table 6.
Rotated principal coordinates of variables with salient values.
| Contributions | Dimensions | |||||||
|---|---|---|---|---|---|---|---|---|
| Variable | Label | Inertia | Quality | 1 | 2 | 3 | 4 | 5 |
| Theory | C01 | 0.022 | 0.885 | −1.454 * | 0.072 | 0.142 | −0.593 | 0.194 |
| C02 | 0.022 | 0.841 | 0.613 | 1.166 * | −0.652 | 0.097 | 0.130 | |
| C03 | 0.019 | 0.830 | 0.466 | −1.021 | −0.048 | 0.313 | 0.223 | |
| C04 | 0.027 | 0.684 | 0.369 | 0.386 | 1.752 * | 0.115 | −1.826 * | |
| Sample | C05 | 0.007 | 0.756 | −0.099 | −0.057 | −0.366 | 0.253 | 0.170 |
| C06 | 0.026 | 0.827 | 0.283 | 0.140 | 2.148 * | 0.076 | 0.191 | |
| C07 | 0.029 | 0.857 | 0.442 | 0.193 | −0.369 | −3.766 * | 0.131 | |
| C08 | 0.029 | 0.776 | 0.234 | 0.324 | −0.535 | 0.164 | −4.438 * | |
| Factor | C09 | 0.027 | 0.104 | 0.202 | 0.055 | 0.940 | 0.246 | 0.183 |
| C10 | 0.030 | 0.101 | 0.548 | 1.908 * | −0.873 | 0.688 | 0.433 | |
| C11 | 0.028 | 0.068 | 0.034 | 0.708 | 0.080 | 0.370 | 0.458 | |
| C12 | 0.030 | 0.100 | −2.283 * | 0.141 | −0.248 | 0.086 | 0.098 | |
| C13 | 0.030 | 0.100 | −2.283 * | 0.141 | −0.248 | 0.086 | 0.098 | |
| C14 | 0.030 | 0.101 | 0.548 | 1.908 * | −0.873 | 0.688 | 0.433 | |
| C15 | 0.029 | 0.091 | −0.398 | −1.074 | −0.400 | 0.236 | 0.159 | |
| C16 | 0.030 | 0.066 | 0.545 | −1.682 * | −0.476 | 0.311 | 0.190 | |
| C17 | 0.030 | 0.100 | −2.283 * | 0.141 | −0.248 | 0.086 | 0.098 | |
| C18 | 0.029 | 0.382 | 1.630 * | 1.419 * | −0.854 | −2.098 * | 0.353 | |
| C19 | 0.030 | 0.172 | 1.325 * | −1.124 * | 2.314 * | 0.017 | 0.870 | |
| C20 | 0.030 | 0.101 | 0.548 | 1.908 * | −0.873 | 0.688 | 0.433 | |
| C21 | 0.030 | 0.100 | −2.283 * | 0.141 | −0.248 | 0.086 | 0.098 | |
| C22 | 0.030 | 0.066 | 0.545 | −1.682 * | −0.476 | 0.311 | 0.190 | |
| C23 | 0.030 | 0.066 | 0.545 | −1.682 * | −0.476 | 0.311 | 0.190 | |
| C24 | 0.030 | 0.066 | 0.545 | −1.682 * | −0.476 | 0.311 | 0.190 | |
| C25 | 0.027 | 0.088 | 0.702 | −0.134 | −0.077 | 0.403 | 0.423 | |
| C26 | 0.027 | 0.164 | 0.441 | −0.197 | −0.523 | 0.390 | −0.807 | |
| C27 | 0.030 | 0.186 | −1.503 * | 0.698 | 2.542 * | −0.209 | 0.778 | |
| C28 | 0.030 | 0.582 | −0.119 | −0.837 | −0.210 | −5.487 * | −0.061 | |
| C29 | 0.030 | 0.744 | −0.084 | 0.046 | 0.033 | 0.027 | −6.279 * | |
| C30 | 0.030 | 0.100 | −2.283 * | 0.141 | −0.248 | 0.086 | 0.098 | |
| C31 | 0.026 | 0.039 | −0.203 | 0.116 | 0.072 | −0.399 | 0.088 | |
| C32 | 0.030 | 0.066 | 0.545 | −1.682 * | −0.476 | 0.311 | 0.190 | |
| C33 | 0.030 | 0.066 | 0.545 | −1.682 * | −0.476 | 0.311 | 0.190 | |
| C34 | 0.030 | 0.100 | −2.283 * | 0.141 | −0.248 | 0.086 | 0.098 | |
| C35 | 0.030 | 0.101 | 0.548 | 1.908 * | −0.873 | 0.688 | 0.433 | |
| C36 | 0.030 | 0.343 | 0.875 | 1.032 | 3.982 * | 0.126 | −0.674 | |
Table value in asterisk (*) indicates salient value and label is the unique identifier for a category.
Publisher’s Note: MDPI stays neutral with regard to jurisdictional claims in published maps and institutional affiliations. |
© 2021 by the authors. Licensee MDPI, Basel, Switzerland. This article is an open access article distributed under the terms and conditions of the Creative Commons Attribution (CC BY) license (https://creativecommons.org/licenses/by/4.0/).
Share and Cite
MDPI and ACS Style
Olugbara, C.T.; Letseka, M.; Olugbara, O.O. Multiple Correspondence Analysis of Factors Influencing Student Acceptance of Massive Open Online Courses. Sustainability 2021, 13, 13451. https://0-doi-org.brum.beds.ac.uk/10.3390/su132313451
AMA Style
Olugbara CT, Letseka M, Olugbara OO. Multiple Correspondence Analysis of Factors Influencing Student Acceptance of Massive Open Online Courses. Sustainability. 2021; 13(23):13451. https://0-doi-org.brum.beds.ac.uk/10.3390/su132313451
Chicago/Turabian StyleOlugbara, Cecilia Temilola, Moeketsi Letseka, and Oludayo O. Olugbara. 2021. "Multiple Correspondence Analysis of Factors Influencing Student Acceptance of Massive Open Online Courses" Sustainability 13, no. 23: 13451. https://0-doi-org.brum.beds.ac.uk/10.3390/su132313451
Note that from the first issue of 2016, this journal uses article numbers instead of page numbers. See further details here.