Article

Optimization of Chitosan Surface Response Methodology (Natural and Commercial) Used for Chromium Ion Removal from Wastewater across Different Parameters

1
Chemical Engineering Department, Faculty of Engineering, Alexandria University, Alexandria 21544, Egypt
2
Modeling and Simulation research Department, Advanced Technology and New Materials Research Institute, City of Scientific Research and Technological Applications (SRTA-CITY), New Borg El-Arab City 21934, Egypt
*
Authors to whom correspondence should be addressed.
Sustainability 2021, 13(23), 13494; https://0-doi-org.brum.beds.ac.uk/10.3390/su132313494
Submission received: 27 October 2021 / Revised: 20 November 2021 / Accepted: 1 December 2021 / Published: 6 December 2021
(This article belongs to the Special Issue Water, Wastewater Treatment, and Sustainable Development)

Abstract

:
Chromium is one of the most significant metals used in the industry. There are many techniques for treating different types of industrial waste water that include chromium ion. In this study, the authors successfully adsorbed the chromium ion from alkaline aqueous solutions using different prepared types of chitosan as adsorbent materials. For the simultaneous sorption behaviour, the adsorption potential of the produced adsorbent was investigated for Cr+6 in a batch system. Natural chitosan was extracted from shrimp shell as it contains about 8–10% chitin which is used in the production of chitosan. The removal percentage of Cr+6 reached 99% after grafting natural and commercial chitosan at specific conditions. Several isotherm models have been used for mechanistic studies. The results indicated that the adsorption data for commercial chitosan is well-fitted by the Freundlich isotherm, Langmuir for commercial grafted, natural and natural grafted chitosan. Kinetic and equilibrium studies showed that the experimental data of Cr+6 were better described by the pseudo-first-order model for commercial chitosan and fitted the pseudo-second-order model for different types of chitosan used. Significantly, in order to scale this effective strategy on an industrial scale, response surface methodology (RSM) was used as a modelling tool to optimise process parameters such as ion concentrations, utilising Statistica Software.

1. Introduction

Wastewater is a serious public health issue that stems from a variety of industrial operations, including battery manufacturing, metal plating, cosmetics, medicines, plastics, and textiles [1,2,3,4]. Wastewater contains a variety of toxins, both organic and inorganic, that are harmful to humans, animals, and aquatic life [3,5]. Chromium has different oxidation states Cr(III) and Cr(VI), Chromium(VI) is more hazardous than Cr(III) as it can diffuse as CrO4−2 or HCrO−4 through cell membranes and oxidise biological molecules [1]. Increased chromium exposure causes cancer, as well as asthma and diarrhoea. When the concentration level is higher than 0.05 ppm, it causes liver damage, kidney issues, and brain damage, all of which lead to physiological impairment [3,6,7]; thus, Cr(VI) has been placed at the top of the priority list of toxic pollutants by the U.S. EPA [8].
To remove Cr(VI) at low levels from industrially polluted waste waters, various procedures have been used, including reduction, solvent extraction, precipitation, and reverse osmosis [6], and flotation also may be an effective method for the removal of Cr6+ in waste [9]. However, the majority of these systems have significant limitations and downsides, including low efficiency, high cost, toxic byproduct formation, operation delay, inefficiency in targeting specific pollutants, and treatment procedure complexity [4,5]. Therefore, new, innovative, and cost-effective approaches to removing hazardous chemicals from waste waters are urgently needed [5]. Due to the ease of operation control, regeneration potentials, cost efficiency, inertness to materials, absence of sludge formation, and variety of adsorbents, adsorption technology has been identified as one of the most efficient and extensively used treatment methods [3,10,11,12].
Activated carbon, metal oxides, carbon nanotubes, polymers, agricultural wastes, and natural and modified clays have all been successfully employed as adsorbents for the removal of chromium from aqueous solutions [5,6].
Chitosan has good heavy metal ion adsorption characteristics, owing to the presence of amino groups (–NH2) in the polymer matrix, which interact with metal ions in solution through ion exchange and complexation reactions [7]. Chitosan is a linear polysaccharide consisting of -(1–4)-linked D-glucosamine that is randomly distributed. The amine and hydroxyl groups in chitosan are primarily used for metal ion adsorption [8]. One of the most intriguing features of chitosan is its adaptability, since it can be easily physically changed to produce various polymers such as beads [12], membranes [13], and sponges [14] for various uses. Chitosan can also be chemically changed to expand its range of uses. Several critical evaluations on the diverse applications of chitosan as an environmentally acceptable biomaterial have recently been published [13].
A significant amount of chitin, 8–10%, used for chitosan production has been found in shrimp shell, which is an expensive ingredient used in many applications, and exportable frozen products, including large quantities of shrimps, are produced by processing plants, and also from restaurants [14].
Experiments have been conducted to investigate how independent variables (factors) affect the process or the formulation dependent variable (response). The RSM technique, which employs the quadratic polynomial model, is a simple, successful strategy for optimising a variety of processes. It is one of the statistical models used in experiment design. RSM requires fewer experiments, which reduces the cost of expensive analysis methods. This method can be implemented using the central composite design (CCD) or the Box–Behnken Design (BBD).
In this paper, low-cost chitosan from wastes of Egyptian shrimp shells was used as a base material for Cr+6 removal. Commercial and prepared natural chitosan was treated and applied to remove Cr+6 from simulated polluted water, and the effect of different variables was studied. Isotherm and kinetic models of the adsorption process for different types of chitosan used was also studied. Finally, optimised Cr+6 adsorption capacity (g/g) with different factors such as time (h), concentration (%), and temperature (°C) using Box–Behnken Design (BBD) was studied.

2. Materials and Methods

Commercial chitosan (Degree of Deacetylation = 95% and Molecular Weight (100,000–300,000)) was supplied by ACROS ORGANICS CO, Ltd. Hong Kong (Macau), Shrimp’s shells were obtained from a local fish market. Sodium hydroxide, methyl acrylate, and ceric ammonium nitrate were obtained from sigma Aldrich (Schaffhausen, Switzerland).

2.1. Preparation of Chitosan from Shrimp’s Shells

The shrimp shells were washed several times with tap water and then dried at 70 °C. The dried shells were ground into a fine powder. The purified chitin was put into a flask with 70% NaOH solution and stirred at 95 °C for 4 h. Subsequently, chitosan was washed with distilled water and dried at 55 °C overnight [14].

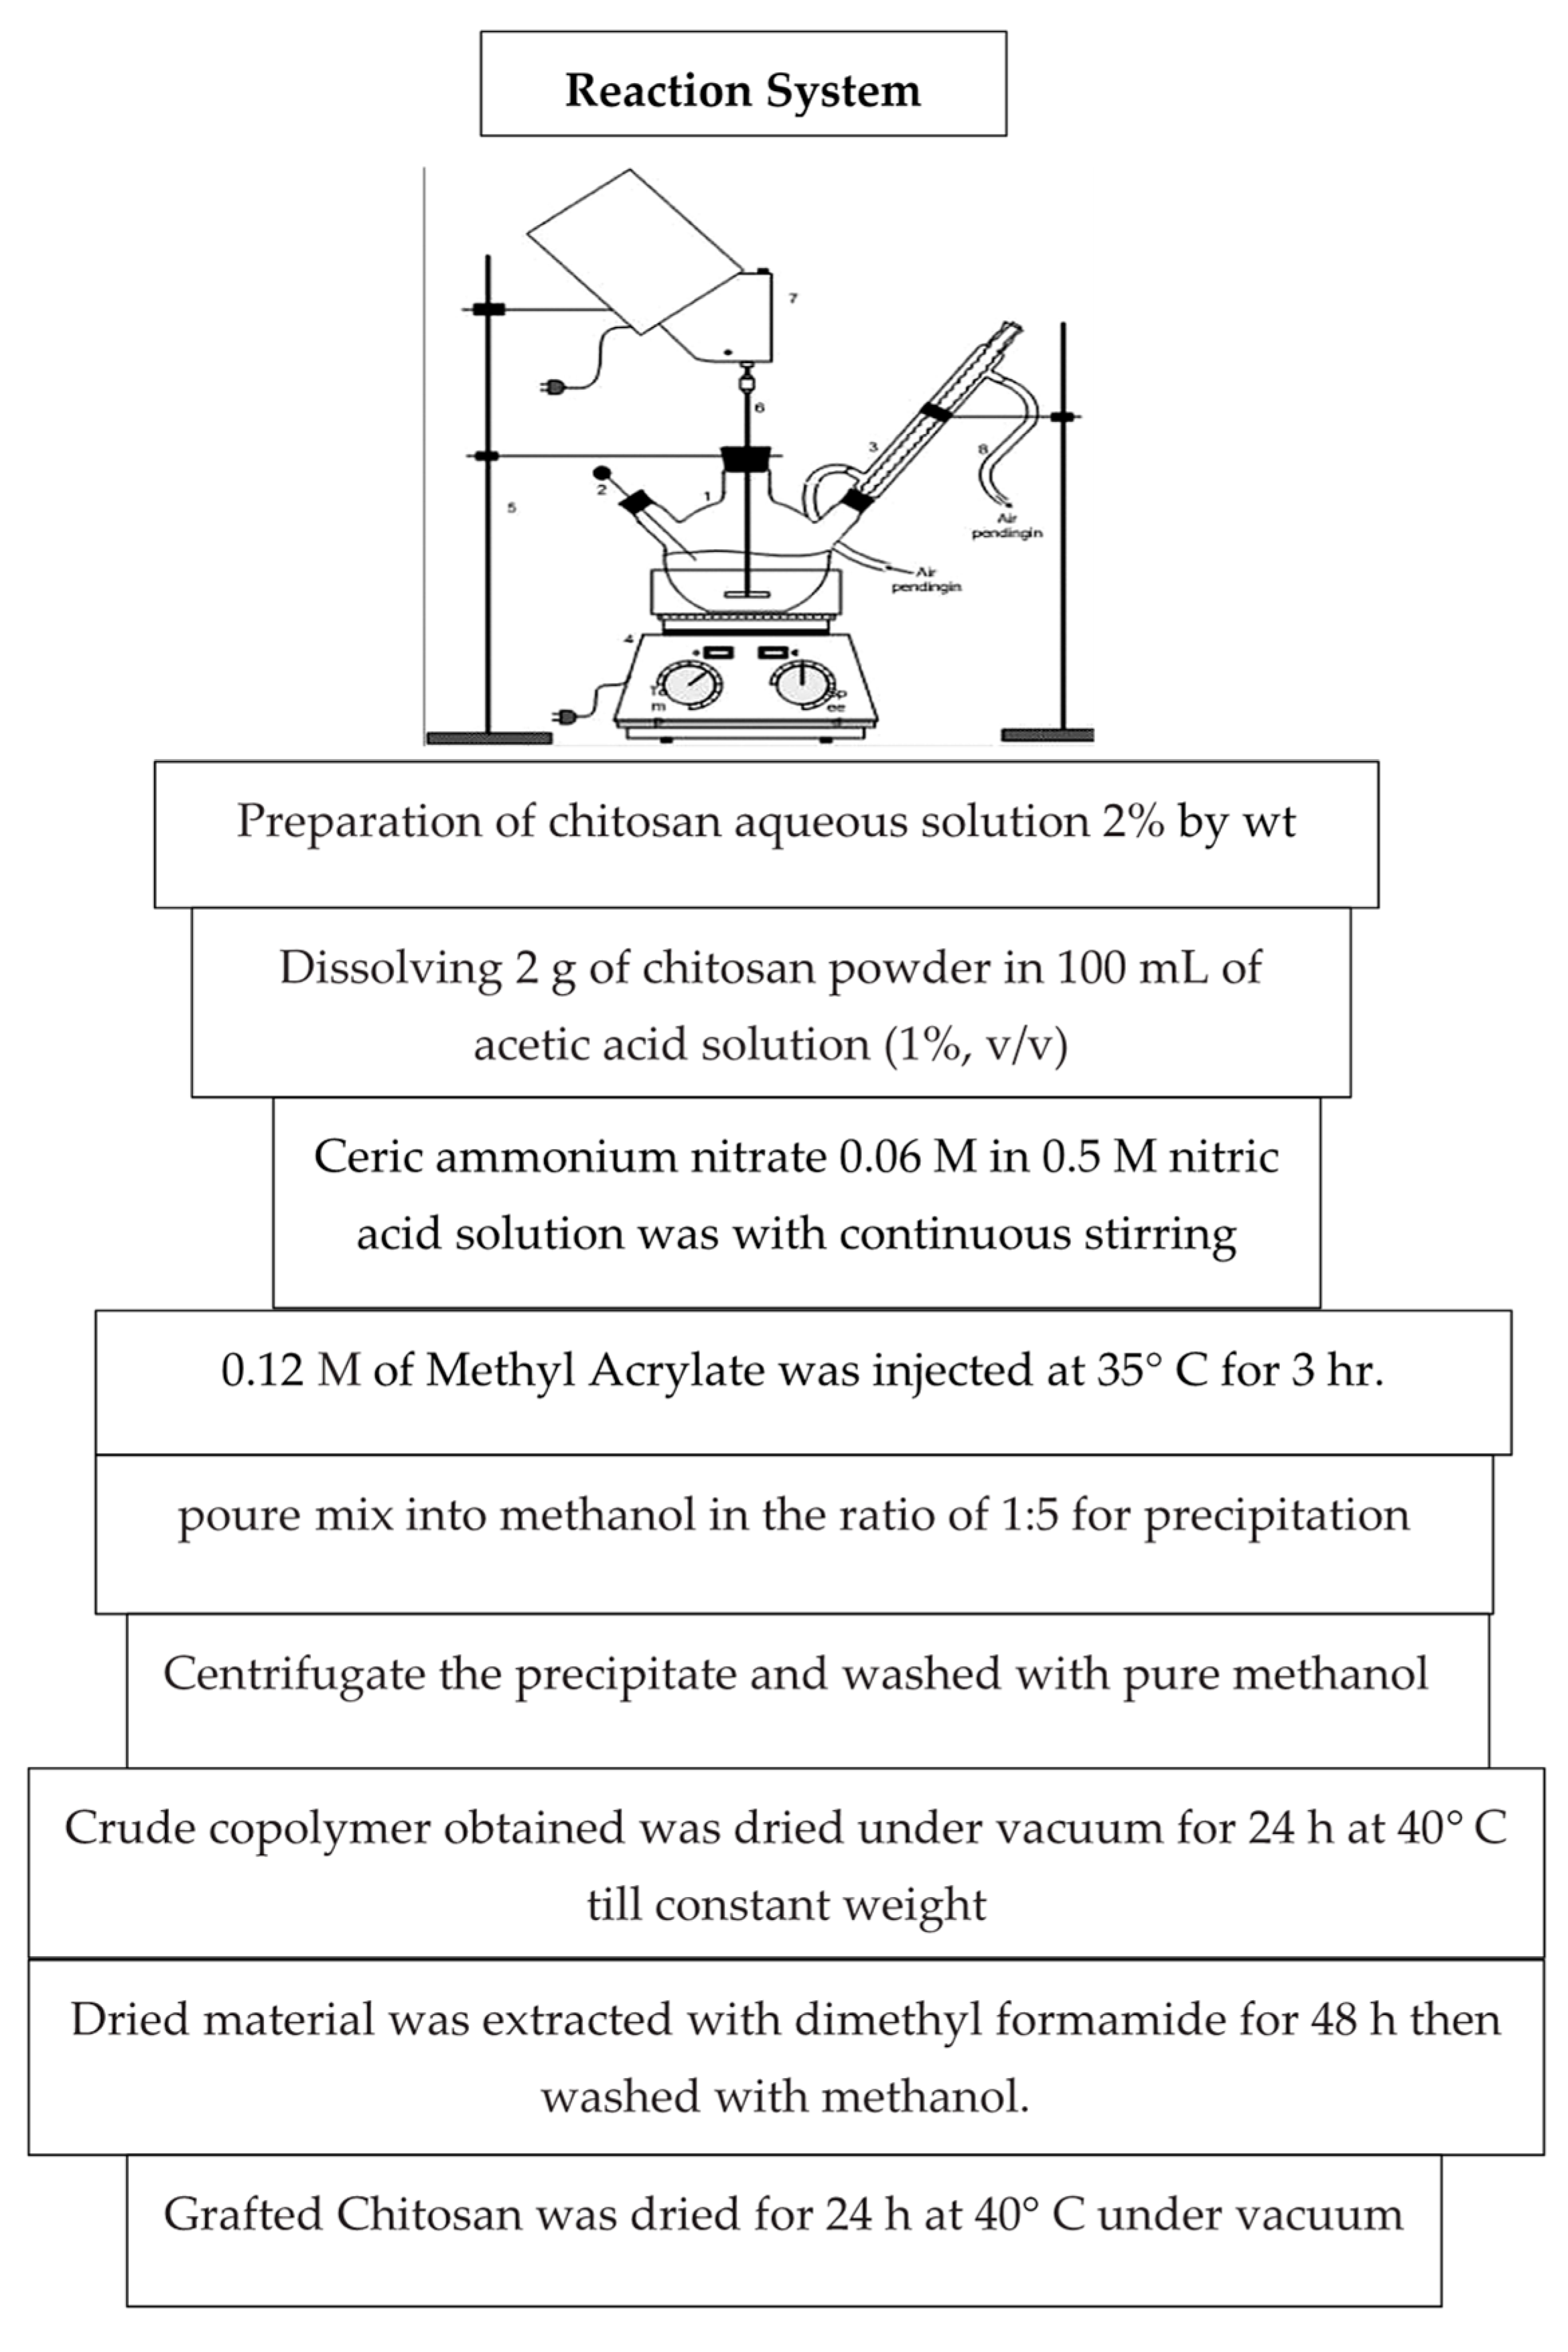
2.2. Preparation of Grafted (Commercial and Natural) Chitosan

Scheme 1 presents the grafting preparation method for the commercial and the prepared natural chitosan [15].

2.3. Preparation of Chromium Solution

A quantity of 1000 mg/L (Stock solution) was prepared using Analytical grade K2Cr2O7, and then diluted to obtain standard solutions with concentrations of 20, 40, 60, 80, 100 mg/L of Cr+6.

2.4. Batch Experiment

Adsorption tests in the batch form were carried out using 100 mL capacity glass bottles at (30 °C) at a fixed speed 160 rpm for various time intervals at different concentrations (20, 40, 60, 80 and 100 mg/L) of Cr+6. The extent of removal of Cr+6 was investigated by changing the adsorbent dose, pH of the solution, initial concentration of Cr+6 solutions.
The adsorbents were separated by field centrifugation and the residual concentration of Cr+6 in solution was determined by UV–DR2010 spectroscopy at 540 nm. The amount of metal ions removed was calculated by the following equation:
% Removal = (Ci − Ce)/Ci × 100
While the Cr+6 amounts were adsorbed using chitosan and grafted chitosan at equilibrium, qe(mg/g) was calculated by the following mass balance relationship:
qe = (Ci − Ce) × V/m
-
Ci is the initial liquid-phase concentration of Cr+6, (mg/L).
-
Ce is the equilibrium liquid-phase concentration of Cr+6,(mg/L).
-
V the volume of the solution (L).
-
m is the weight of the adsorbent used (g).
For experiments on the pH effect, simulated solutions were initially adjusted with aqueous solutions of acid or base to reach pH values ranging from 4 to 9 [13]. The effect of the adsorbent dose was studied by varying the sorbent amounts from 1 to 5 g/L at room temperature, fixing the initial concentration, pH, and contact time [5].

2.5. Optimization of Cr+6 Removal (%) by Response Surface Methodology

In the Box–Behnken design experiment, the response surface methodology was explained [16,17], and used to find the best conditions for removing Cr+6 (%) using c-chitosan, grafted c-chitosan, natural chitosan, and grafted natural chitosan, respectively. A 15-trial design matrix was chosen to simulate the interaction of various operating conditions [18]. The Box–Behnken design with three independent variables at three levels (−1, 0 and 1) was considered with the study of the adsorption process and a total number of 15 experiments. All runs were performed to estimate the effect of three factors (dose (mg), X1(1–5), concentration (ppm), X2 (20–100) and time (h), X3 (1–5)) on Cr+6 removal (%). Response Optimizer further refined the Cr+6 removal (percent) response function to obtain the recommended value.
Table 1 shows the entire experimental design in coded form, with mutable minimum and maximum ranges. The answer regression analysis produced a model, and the efficacy of the model was assessed using ANOVA and F test [19,20,21]. The statistical software “Statistica” was used for data analysis and optimisation, and the interaction effects of the factors were summarised as follows in quadratic Equation (3):
Y = β0 +∑ βixi + ∑ βii xi2 + ∑ βijxixj
where, Y is the predicted response, β0 is the intercept term, βi is the linear effect, βii is the square effect, and βij is the interaction effect.

3. Results and Discussion

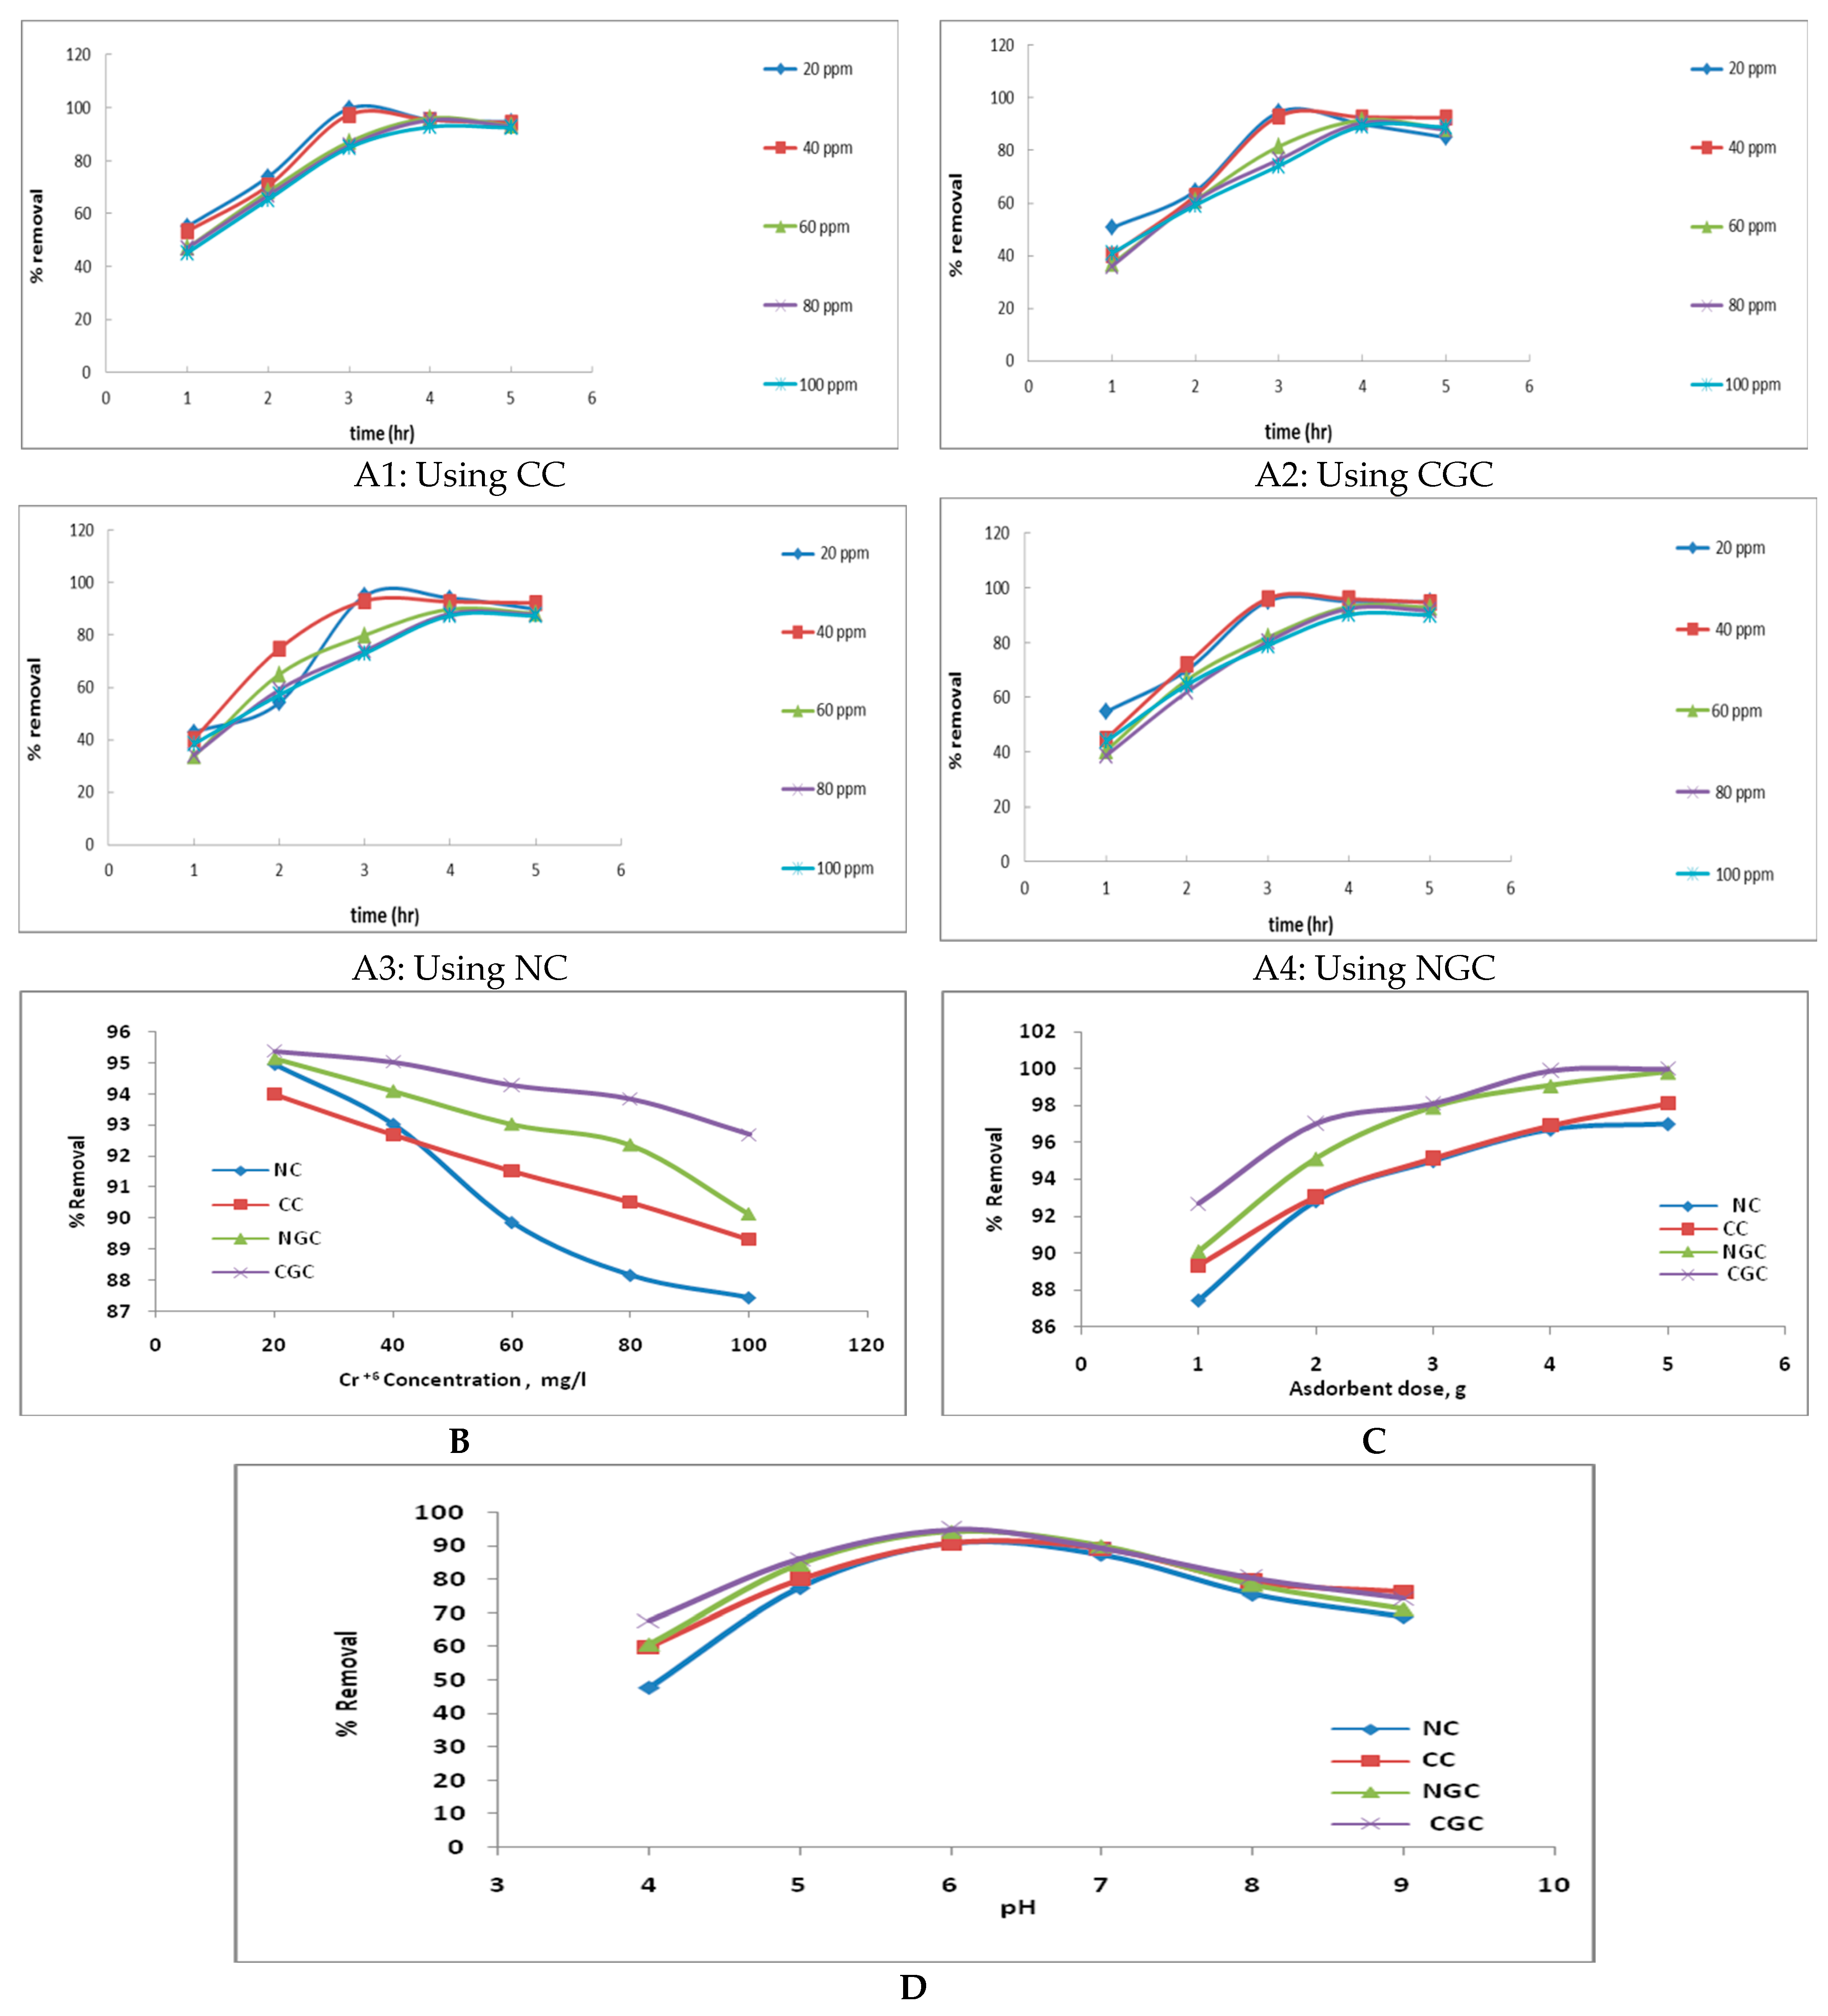
3.1. Effect of Different Parameters on the Removal Ratio of Cr+6

Figure 1A shows the removal ratio of Cr+6 ions for different adsorbent used (Commercial Chitosan (CC), Natural Chitosan (NC), Commercial Grafted Chitosan (CGC), Natural Grafted Chitosan (NGC)) at different concentrations (20, 40, 60, 80 and 100 ppm). All figures demonstrate that the removal ratio increases with increasing time to reach the maximum value after 3 h and it is then fixed. Additionally, the results are similar to that of Ruihua Huang et al. [19]. Figure 1B illustrates the relationship between the percentage of removal and different concentrations used for the four types of sorbent material. The maximum percentage of removal for all types used was at 20, 40 ppm with a value of 92–96%. This is likely due to the increased surface area of the adsorbent when Cr+6 adsorption is initiated. The speed at which the adsorbate is consumed controls the uptake rate when the surface adsorption sites are exhausted. It was transferred from the exterior to the interior sites of the adsorbent particles. Moreover, different quantities of adsorbent were used to study the effect of increasing dose on removal percentage of Cr+6, as shown in Figure 1C. This figure demonstrates that the percentage of removal for grafted chitosan (commercial or natural) is greater than the percentage of untreated adsorbents. Further, by increasing the adsorbent dose, the percentage removal increased from 1 to 4 g and then was fixed. The maximum value of removal was at 4 g with a removal percentage of 96–99% for the four adsorbent types. One of the parameters affecting the removal process was pH, as shown in Figure 1D; the results are similar to that of S. Ramasubramaniam et al. [5]. The removal percentage was increased by increasing pH from 4 to reach the maximum value at pH = 6 and then decreased again. This behavior may be due to that increasing the pH would shift the concentration of HCrO4 to other forms, such as CrO2−2 and Cr2O7−2.
H2Cr2O4 ⇔ H+ + HCrO4
HCrO4 ⇔ H+ + CrO4−2
2HCrO4−2 ⇔ Cr2O7−2 + H2O
At very low pH values, the surface of the adsorbent would also be surrounded by hydronium ions, which would increase the attractive forces of the Cr+6 interaction with the adsorbent’s binding sites. The overall surface charge on the adsorbent becomes negative as the pH rises, and adsorption decreases. Due to the dual completion of the anions, adsorption of Cr+6 was not significant at pH levels greater than 6. CrO4−2, Cr2O7−2, and OH- were adsorbed on the adsorbent’s surface, with OH- dominating [17].

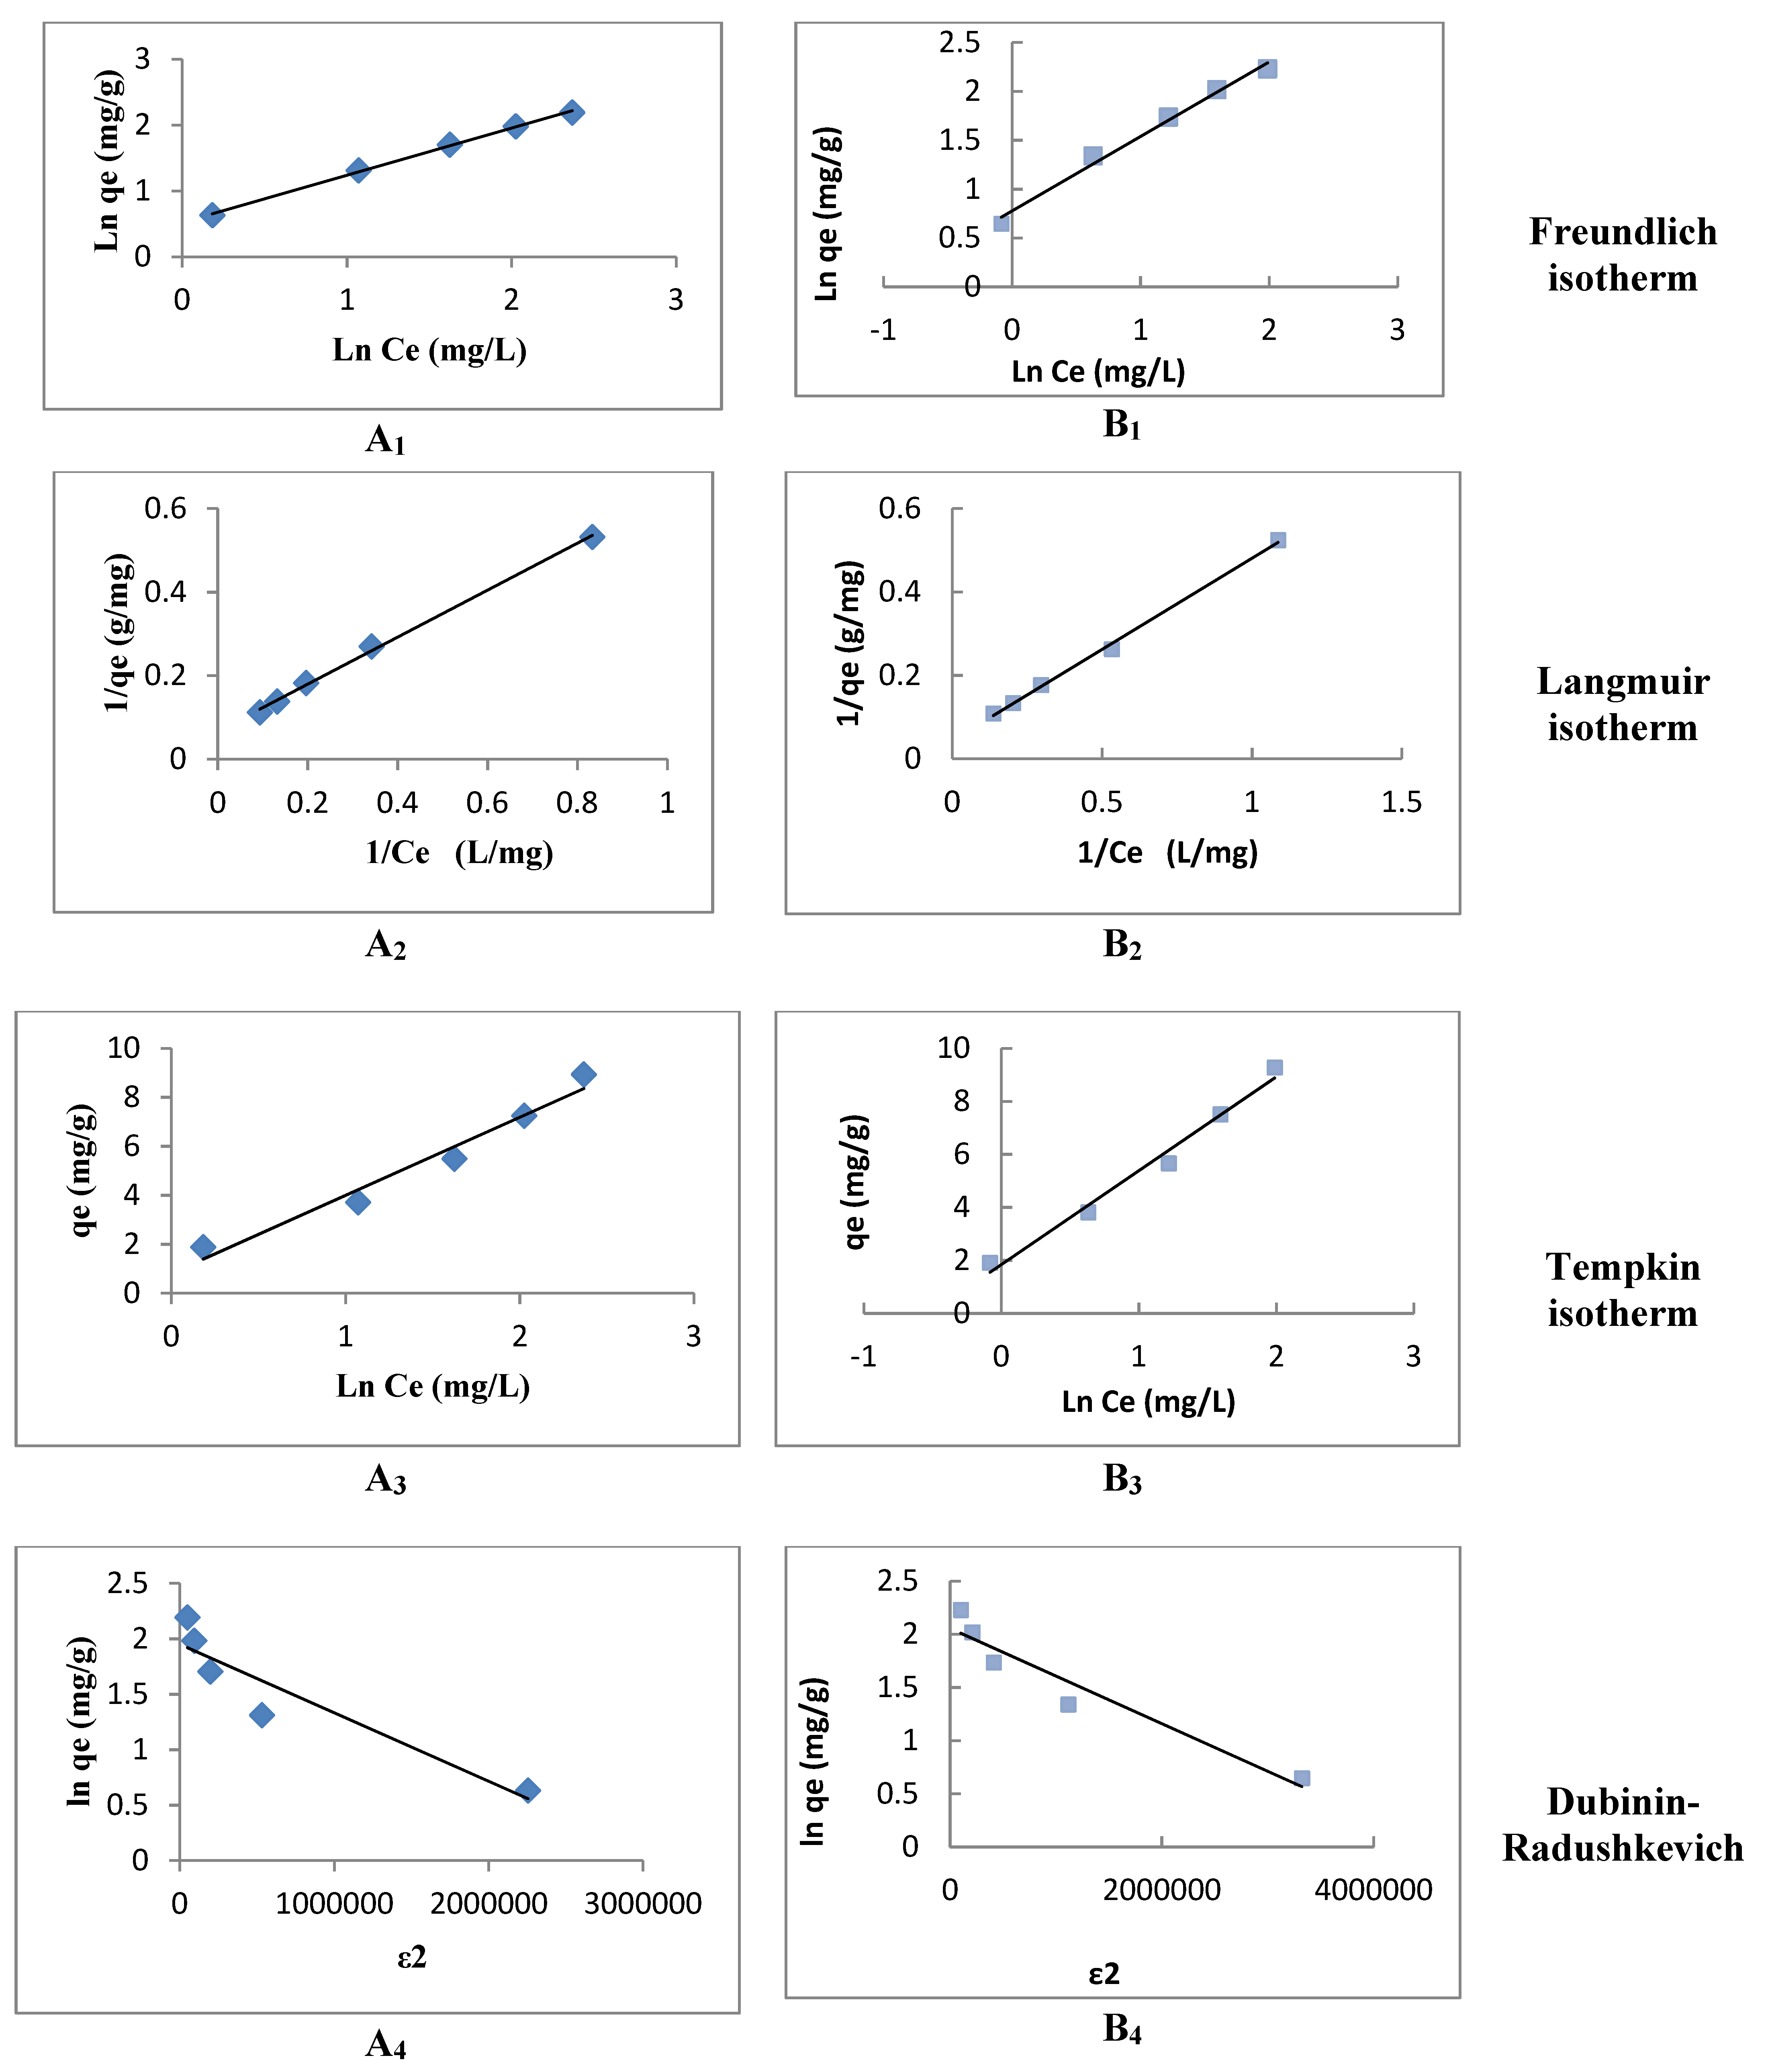
3.2. Adsorption Isotherms

Four adsorption isotherms (Freundlich, Langmiur, Tempkin, and Dubinin–Radushkevich) were studied for the removal of Cr+6 through the four adsorbents used in this study.
Commercial chitosan demonstrated that adsorption of Cr+6 fitted the Freundlich isotherm, so the adsorption of Cr+6 was a multi-layer adsorption as (R2 = 0.9987) compared with the R2 for Langmiur, Tempkin, and Dubinin–Radushkevich which equals 0.9982, 0.9651, 0.8695, respectively, as shown in Table S1. and Figure 2A. For the heterogeneity parameter (1/n), the smaller 1/n, the more variability is expected. When 1/n = 1, this expression reduces to a linear adsorption isotherm. If n is between one and ten, the sorption process is favourable [17]. From the data, that value is 1/n = 0.665, which indicates that the adsorption is favourable. Moreover, Figure 2B for commercial grafted chitosan showed that the adsorption of Cr+6 was monolayer adsorption as the data fitted the Langmuir isotherm with R2 = 0.9978 compared with the R2 for other isotherms, as shown in Table S1. The significance of the separation factor is that the adsorption isotherm is either unfavourable (RL > 1), favourable (0 RL > 1), linear (RL = 1), or irreversible (RL = 0) when RL is used. The values of RL were found to be in the range of 0 to 1, with RL = 0.503 indicating good adsorption Cr+6.
In addition, we studied the adsorption isotherm of natural chitosan, shown in Figure 3A, where adsorption isotherm of Cr+6 fitted the Langmuir isotherm as R2 = 0.9967 compared to the R2 for other isotherms, as shown in Table S2. The values of RL were found to be in the range between 0 and 1, that value of RL = 0.42 for adsorption of chromium indicates the favourable adsorption over natural chitosan. Furthermore, the adsorption isotherm for natural grafted chitosan (Figure 3B) shows that the adsorption of Cr+6 by natural grafted chitosan fitted the Langmuir isotherm as R2 = 0.9566 compared to other isotherms, as shown in Table S2 and Figure 3B. The values of RL were found to be in the range between 0 and 1, and that value of RL = 0.52 indicates the favourable adsorption of chromium onto the natural grafted chitosan.

3.3. Adsorption Kinetics for Different Types of Adsorbent Used

The adsorption rate was studied using three different reaction kinetic models: pseudo-first-order, pseudo-second-order, and Elovich equation models, for different materials (i.e., commercial, commercial grafted chitosan, natural, and natural grafted chitosan) Table 2.
In case of commercial and commercial grafted chitosan, the experimental data fitted pseudo-first-order as the value for R2 was 0.9956. However, the values of R2 for the pseudo-second-order and Elovich were 0.9806 and 0.9756, respectively. While, for commercial grafted chitosan, the experimental results were fitted to the pseudo-second-order kinetics as the R2 value was 0.9829, the values of R2 for the pseudo-first-order and Elovich were 0.9636 and 0.9686, respectively. In addition, the experimental results were fitted to the pseudo-second-order kinetics for chromium adsorption by natural chitosan and natural grafted chitosan, as R2 was 0.9797 and 0.9901, respectively. Meanwhile, R2 for the pseudo-first-order and Elovich were 0.7159, 0.7159 and 0.978, 0.978 for natural chitosan and natural grafted chitosan, respectively, as shown in Table 2.

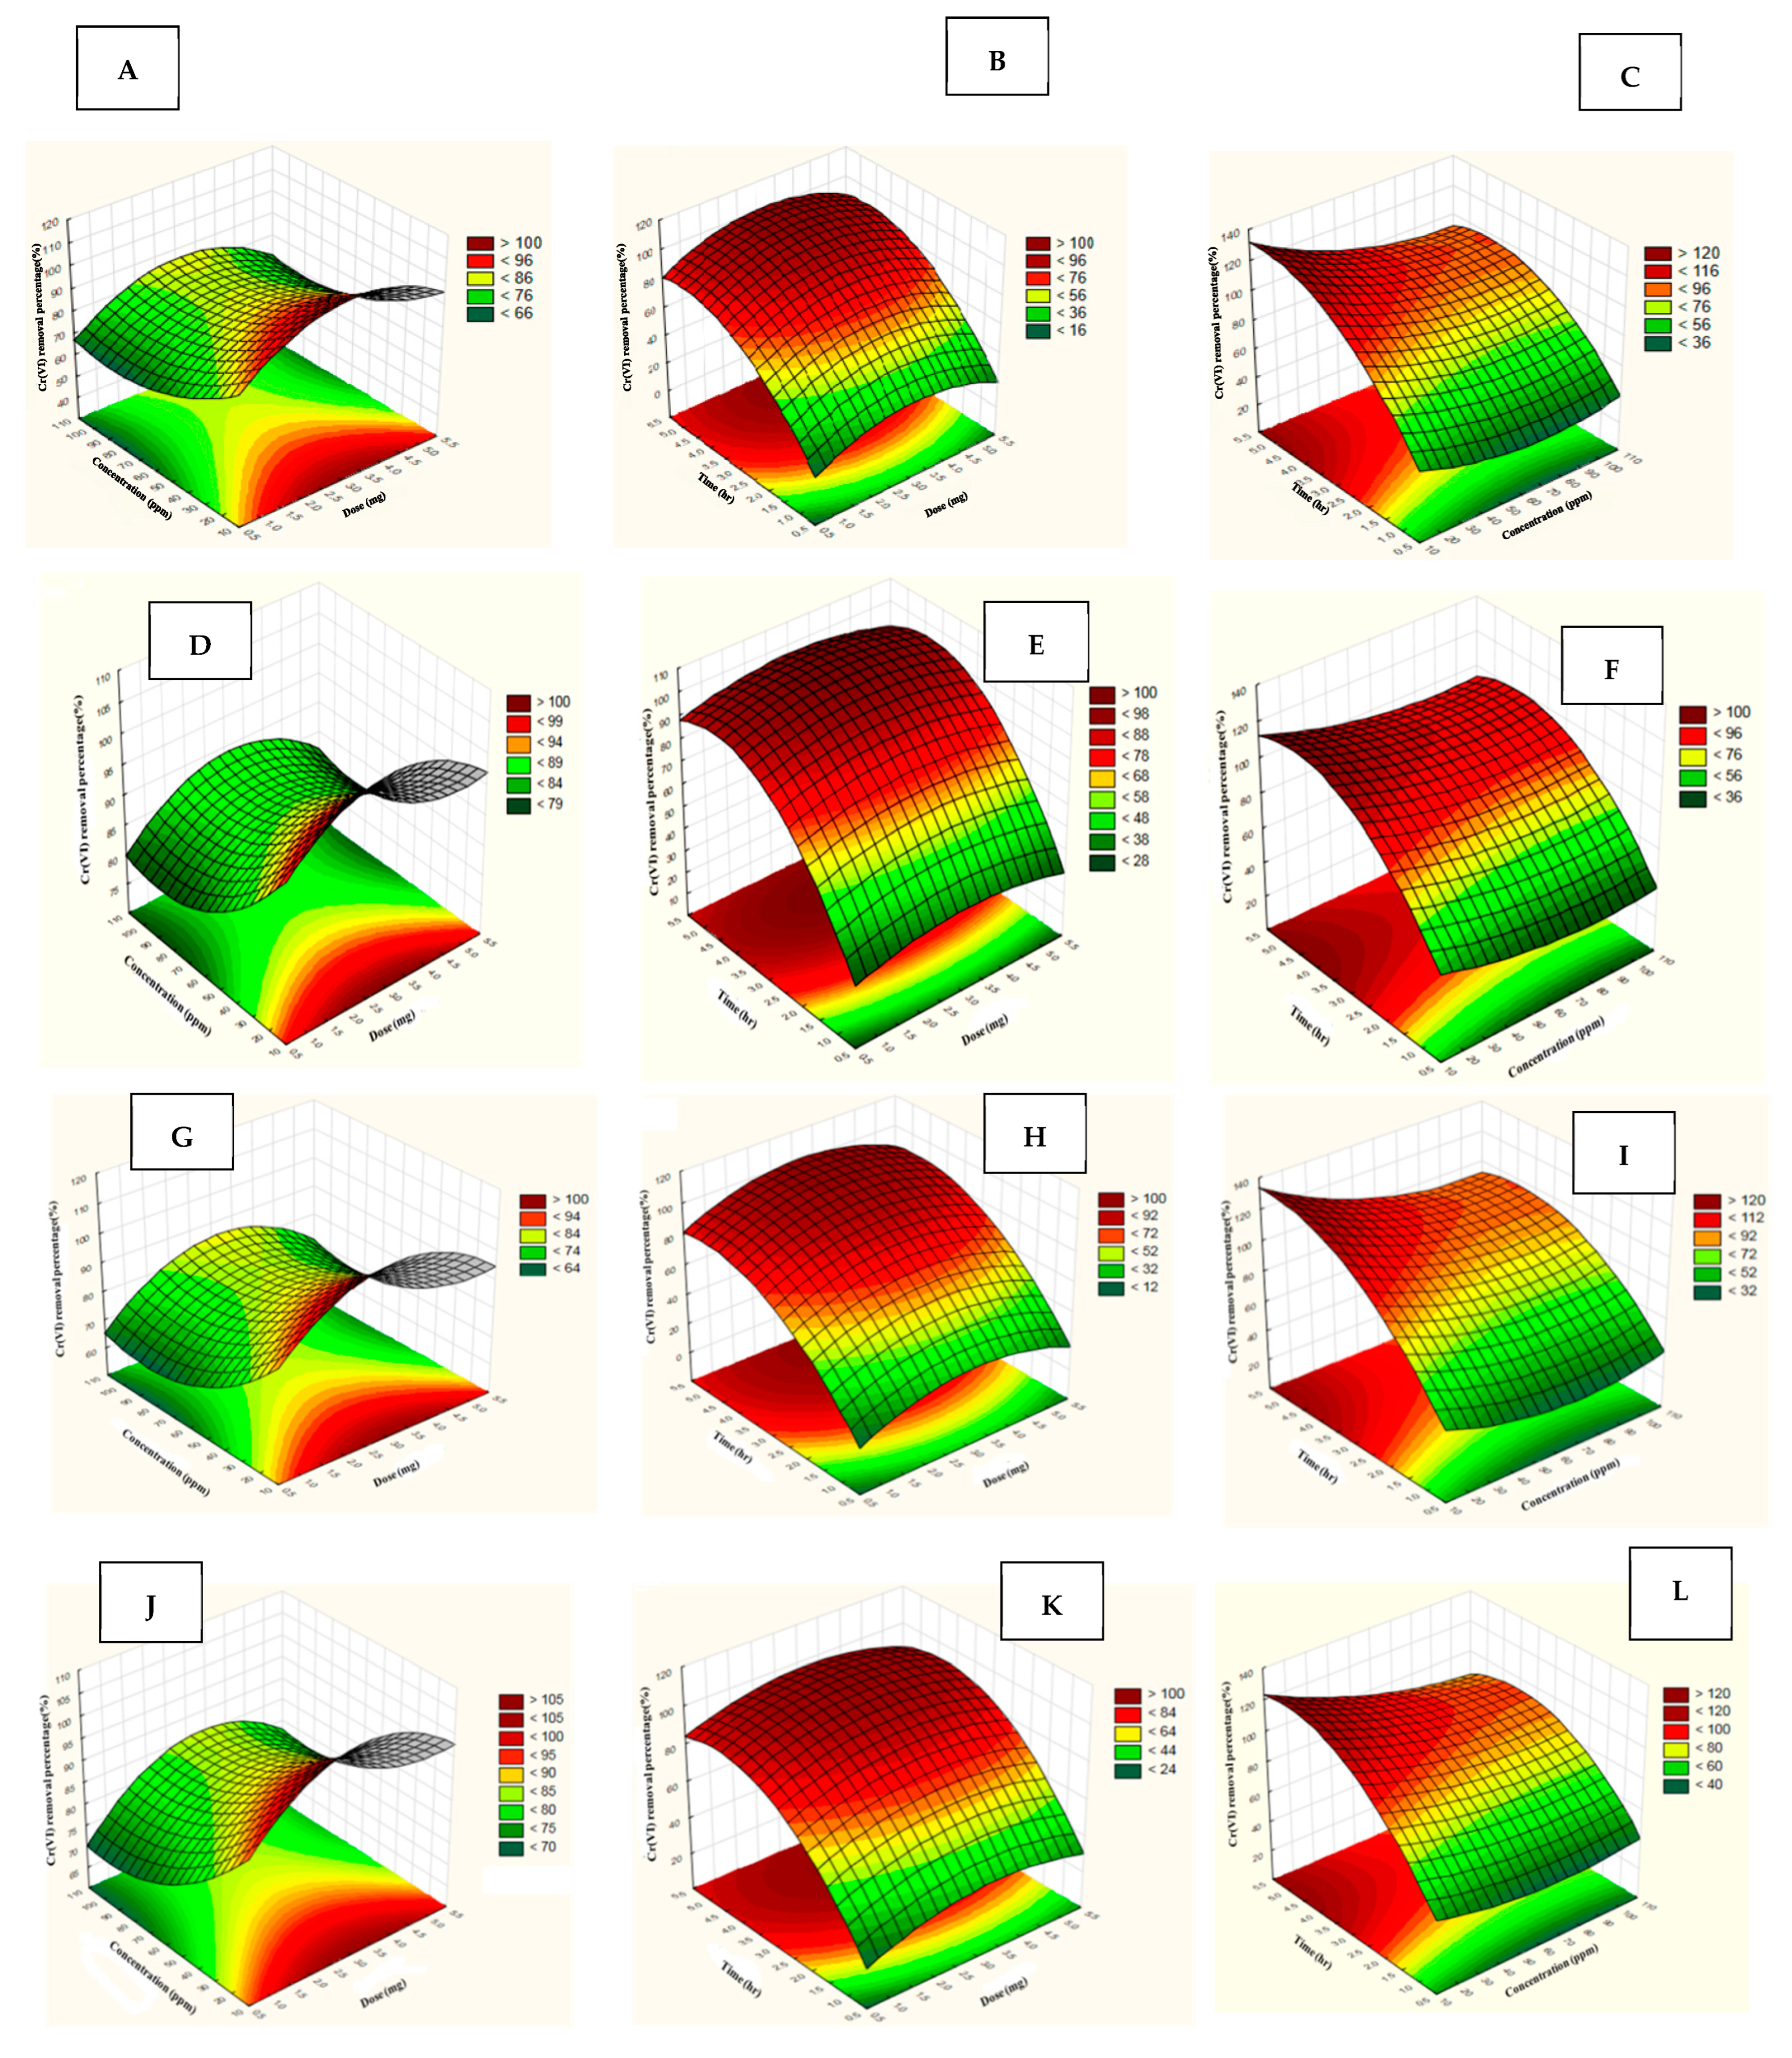
3.4. Optimisation Using Response Surface Methodology (RSM)

The adsorption processes are presented using the Box–Behnken design that determined the superlative levels of the variables as dose (mg), concentration (ppm), and time (h) as illustrated in (Table 3) for Cr+6 removal (%) using CC, GCC, NC, and GNC, respectively. The quadratic model revealed the statistical relationship between the selected variables and the response in terms of coded factors is well fitted with the following equations.
YCC = 7.02871 + 17.85634X1 − 0.56769X2 + 39.50063X3 − 2.76210X12 + 0.00429X22 − 3.76478X32 − 0.00662X1X2 + 0.06688X1X3 − 0.05854X2X3
YGCC = 24.57955 + 7.80089X1 − 0.47381X2 + 38.43375X3 − 1.27973X12 + 0.00282X22 − 4.30527X32 + 0.00294X1X2 − 0.01125X1 X3 − 0.01103X2 X3
YNC = 7.95799 + 17.38277X1 − 0.66003X2 + 39.86812X3 − 2.74379X12 + 0.00486X22 − 3.69808X32 + 0.00084X1X2 + 0.01063X1 X3 − 0.06106X2 X3
YGNC = 12.95018 + 12.33964X1 − 0.41437X2 + 40.30500X3 − 1.82411X12 + 0.00290 X22 − 4.02089X32 + 0.00625X1 X2 − 0.19750X1 X3 − 0.06121X2 X3
where Y is the response (Cr+6 removal (%)) and X1 is dose (mg), X2 is concentration (ppm), and X3 is time (h).
The model was validated using analysis of variance (ANOVA), the results of which are displayed in the tables below (Tables S3–S6). The values of F-value and p-value can be seen in these tables for this model are 11.14, 12.29, 12.62, 10.95 (F-value) and 0.0022, 0.00078, 0.000697, 0.00124 (p-value) for CC, GCC, NC, and GNC, respectively. In general, the model is significant and effectively predicts test results when F-value is very high and the value of “prob > F” is less than 0.05. Values greater than 0.1000 demonstrate that model terms are not significant. Due to the above reasons, all models for different types of adsorbents were completely significant [17]. The Box–Behnken design results can be shown in 3D presentations with contours. The 3D surface plots show the sort of interaction between the factors that can be used to find the best conditions [20]. These plots of the second-order polynomial equation for cc-chitosan, grafted cc-chitosan, natural chitosan, and grafted natural chitosan are shown in Figure 4. The surface plots indicate the maximum anticipated value. Figure 4A,D,G,J illustrate the simultaneous effect of concentration/dose on Cr+6 removal (%) using CC, GCC, NC, and GNC, respectively.
The Cr+6 removal (%) increased with the increase of of the adsorbent dose from 1 to 5 mg, and the maximum Cr+6 removal (%) was obtained with 5 mg dose of adsorbent CC, GCC, NC, and GNC, respectively.
In addition, Cr+6 removal (%) was between 35.4% and 99.067% in the case of CC (Figure 4A,B); between 46.46% and 99.26% in the case of GCC (Figure 4D,E); between 33.03% and 97.92% in the case of NC (Figure 4G,H); and between 41.83% and 99.9% in the case of GNC (Figure 4J,K) [16,17].
On the contrary, Figure 4A,C,D,F,G,I,J,L show the effect of concentration, where Cr+6 removal percentage decreases with increasing concentration and the maximum Cr+6 removal percentage was for 20, 40 ppm for all types of adsorbents. The uptake rate is controlled by the rate at which the adsorbate is transferred from the exterior to the interior sites of the adsorbent particles, which may be due to the larger surface area of the adsorbent available at the beginning for Cr+6 adsorption. However, as Cr+6 concentration increases, the surface adsorption sites become exhausted, and the uptake rate is controlled by the rate at which the adsorbate is transferred from the exterior to the interior sites.
The fitted surface plots of Cr+6 removal (%) versus the combined effect of time and dose is also shown in Figure 4B,E,H,K for CC, GCC, NC, and NGC, respectively. In contrast, by investigating the combined effect of time and dose on Cr+6 removal (%), it was demonstrated that Cr+6 removal (%) became lower when the dose was low and time was low. In addition, the Cr+6 removal (%) increased with increasing time; the maximum value was reached, and after 3 h, the value stayed relatively constant. This result demonstrated that the sorbent materials were first adsorbed externally, with a rapid increase in adsorption rate; however, after a period of time, the sorbent material became saturated, and its affinity for sorbed molecules decreased. Nonetheless, at some point in time, the sorbent material became saturated, and its affinity for sorbed molecules decreased; however, at some point in time, the sorbent material reached a constant value, and no more Cr+6 was adsorbed from the solution. Furthermore, as contact time increased, Cr+6 removal (%) for GCC and GNC were higher than those of CC and NC. This result is expected since GCC and GNC have more active sites than CC and NC, allowing them to attach Cr+6 ions more easily to the adsorbent [18,19]
The solver function of Microsoft Excel tools was used to calculate the best levels of the three components in this case. To obtain these optimal levels, the maximum point of the polynomial model was used. Values of 99.07, 99.26, 97.9 and 99.99 Cr+6 removal (%) were obtained for CC, GCC, NC, and GNC, respectively, in the case of Cr+6 at 3 h contact time, 20 ppm concentration at adsorbent dose 5 mg. Thus, these results stress the necessity and value of the optimisation process.
The agreement between the predicted and measured Cr+6 removal (%) demonstrated that using the response surface method to design the experiments can be considered a successful choice in the optimisation of work parameters, in addition to its uses as an experimental design and statistical analysis, as shown in Table 3 of model validations. From Table 4, we see that the values of R2 and R2adj for all types of adsorbent are close to 1, and they indicate a better correlation between laboratory and calculated results [21]. Moreover, for all types of adsorbents, the predicted R-squared value is in good agreement with the adjusted R-squared, where the difference is less than 0.2 [15]. So, this model can use to navigate the design space [17].

4. Conclusions

Commercial and natural chitosan without and with treatment were prepared and then used as adsorbent material to remove Cr+6 in different concentrations. By studying various parameters such as concentration, adsorbent dose, pH, and contact time, the results concluded that the removal percentage of Cr+6 enhanced using grafted chitosan. Various types of isotherm and kinetic models were applied to the four types of adsorbent used. The response surface methodology (Box–Behnken design) was used to determine the optimum conditions for Cr+6 removal percentage using the different types of chitosan utilised in this study.

Supplementary Materials

The following are available online at https://0-www-mdpi-com.brum.beds.ac.uk/article/10.3390/su132313494/s1, Table S1: Isotherms equations and constants for chromium ions adsorption onto commercial and commercial grafted chitosan, Table S2: Isotherms equations and constants for chromium ions adsorption onto natural and natural grafted chitosan, Table S3: ANOVA results for Cr +6 removal (%) using CC, Table S4: ANOVA results for Cr+6 removal (%) using GCC, Table S5: ANOVA results for Cr+6 removal (%) using NC. Table S6: ANOVA results for Cr+6 removal (%) using GCC.

Author Contributions

M.S. participated in conceptualisation and methods design, performed all experiment work, validation, data collection and analyses. B.Y. participated in data curation, data analyses and interpretation, visualisation, manuscript writing, and manuscript editing. A.Z. participated in methodology revision and refinement, manuscript preparation, and work supervision. N.A.T. participated in conceptualisation, participated in data curation, data analyses and interpretation, visualisation, manuscript writing and original draft preparation, manuscript review and editing. All authors have read and agreed to the published version of the manuscript.

Funding

This research received no external funding.

Institutional Review Board Statement

Not applicable.

Informed Consent Statement

Not applicable.

Data Availability Statement

The data presented in this study are contained within the article and the supplementary material.

Conflicts of Interest

The authors declare no conflict of interest.

References

  1. El-Tawil, R.S.; El-Wakeel, S.T.; Abdel-Ghany, A.E.; Abuzeid, H.A.; Selim, K.A.; Hashem, A.M. Silver/quartz nanocomposite as an adsorbent for removal of mercury (II) ions from aqueous solutions. Heliyon 2019, 5, e02415. [Google Scholar] [CrossRef] [PubMed]
  2. Baby, R.; Saifullah, B.; Hussein, M.Z. Palm Kernel Shell as an effective adsorbent for the treatment of heavy metal contaminated water. Sci. Rep. 2019, 9, 18955. [Google Scholar] [CrossRef] [PubMed] [Green Version]
  3. Egbosiuba, T.C.; Abdulkareem, A.S.; Kovo, A.S.; Afolabi, E.A.; Tijani, J.O.; Bankole, M.T.; Bo, S.; Roos, W.D. Adsorption of Cr(VI), Ni(II), Fe(II) and Cd(II) ions by KIAgNPs decorated MWCNTs in a batch and fixed bed process. Sci. Rep. 2021, 11, 75. [Google Scholar] [CrossRef] [PubMed]
  4. Alim, S.A.; Rao, T.S.; Miditana, S.R.; Lakshmi, K.V.D. Efficient and recyclable visible light-active nickel–phosphorus co-doped TiO2 nanocatalysts for the abatement of methylene blue dye. J. Nanostruct. Chem. 2020, 10, 211–226. [Google Scholar] [CrossRef]
  5. Gomathi, T.; Sudha, P.N. Removal of Chromium (VI) from aqueous solution using chitosan—Starch blend. Der Pharm. Lett. 2012, 4, 240–248. [Google Scholar]
  6. Suleiman, A.K.; Aly, O.I.; Mahdi, E.M.; Mohamed, G.G.; Mohamed, A. Removal of Chromium (VI) from Aqueous Solutions Using Composite Nanofibers. Egypt. J. Chem. 2021, 64, 525–531. [Google Scholar] [CrossRef]
  7. Thinh, N.N.; Hanh, P.T.B.; Ha, L.T.T.; Anh, L.N.; Hoang, T.V.; Hoang, V.D.; Dang, L.H.; Van Khoi, N.; Lam, T.D. Magnetic chitosan nanoparticles for removal of Cr(VI) from aqueous solution. Mater. Sci. Eng. C 2013, 33, 1214–1218. [Google Scholar] [CrossRef] [PubMed]
  8. Parlayıcı, Ş.; Pehlivan, E. Removal of Chromium(VI) from Aqueous Solution Using Chitosan Doped with Carbon Nanotubes. Mater. Today Proc. 2019, 18, 1978–1985. [Google Scholar] [CrossRef]
  9. Han, G.; Wen, S.; Wang, H.; Feng, Q. Surface sulfidization mechanism of cuprite and its response to xanthate adsorption and flotation performance. Miner. Eng. 2021, 169, 106982. [Google Scholar] [CrossRef]
  10. Haghighizadeh, M.; Zare, K.; Aghaie, H.; Monajjemi, M. Preparation and characterization of Chicory leaf powder and its application as a nano-native plant sorbent for removal of Acid Blue 25 from aqueous media: Isotherm, kinetic and thermodynamic study of the adsorption phenomenon. J. Nanostruct. Chem. 2020, 10, 75–86. [Google Scholar] [CrossRef] [Green Version]
  11. Santhosh, C.; Nivetha, R.; Kollu, P.; Srivastava, V.; Sillanpää, M.; Grace, A.N.; Bhatnagar, A. Removal of cationic and anionic heavy metals from water by 1D and 2D-carbon structures decorated with magnetic nanoparticles. Sci. Rep. 2017, 7, 14107. [Google Scholar] [CrossRef] [PubMed]
  12. Zheng, X.; Yu, N.; Wang, X.; Wang, Y.; Wang, L.; Li, X.; Hu, X. Adsorption Properties of Granular Activated Carbon-Supported Titanium Dioxide Particles for Dyes and Copper Ions. Sci. Rep. 2018, 8, 6463. [Google Scholar] [CrossRef]
  13. Pietrelli, L.; Francolini, I.; Piozzi, A.; Sighicelli, M.; Silvestro, I.; Vocciante, M. applied sciences Chromium (III) Removal from Wastewater by Chitosan Flakes. Appl. Sci. 2020, 10, 1925. [Google Scholar] [CrossRef] [Green Version]
  14. Khorrami, M.; Najafpour, G.D.; Younesi, H.; Hosseinpour, M.N. Production of Chitin and Chitosan from Shrimp Shell in Batch Culture of Lactobacillus plantarum. Chem. Biochem. Eng. Q. 2012, 26, 217–223. [Google Scholar]
  15. Tatode, A.A.; Patil, A.T.; Umekar, M.J. Application of response surface methodology in optimization of paclitaxel liposomes prepared by thin film hydration technique. Int. J. Appl. Pharm. 2018, 10, 62–69. [Google Scholar] [CrossRef]
  16. El Essawy, N.A.; Ali, S.M.; Farag, H.A.; Konsowa, A.H.; Elnouby, M.; Hamad, H.A. Green synthesis of graphene from recycled PET bottle wastes for use in the adsorption of dyes in aqueous solution. Ecotoxicol. Environ. Saf. 2017, 145, 57–68. [Google Scholar] [CrossRef] [PubMed]
  17. Eweida, B.Y.; El-Moghazy, A.Y.; Pandey, P.K.; Amaly, N. Fabrication and simulation studies of high-performance anionic sponge alginate beads for lysozyme separation. Colloids Surf. A Physicochem. Eng. Asp. 2021, 619, 126556. [Google Scholar] [CrossRef]
  18. Pajootan, E.; Arami, M.; Rahimdokht, M. Application of Carbon Nanotubes Coated Electrodes and Immobilized TiO2 for Dye Degradation in a Continuous Photocatalytic-Electro-Fenton Process. Ind. Eng. Chem. Res. 2014, 53, 16261–16269. [Google Scholar] [CrossRef]
  19. Huang, R.; Yang, B.; Liu, Q. Removal of chromium(VI) Ions from aqueous solutions with protonated crosslinked chitosan. J. Appl. Polym. Sci. 2013, 129, 908–915. [Google Scholar] [CrossRef]
  20. Box, G.E.P.; Behnken, D.W. Some New Three Level Designs for the Study of Quantitative Variables. Technometrics 1960, 2, 455–475. [Google Scholar] [CrossRef]
  21. Shokoohi, R.; Samadi, M.T.; Amani, M.; Poureshgh, Y. Modeling and optimization of removal of cefalexin from aquatic solutions by enzymatic oxidation using experimental design. Braz. J. Chem. Eng. 2018, 35, 943–956. [Google Scholar] [CrossRef]
Scheme 1. Preparation method of grafting.
Sustainability 13 13494 sch001
Figure 1. Effect of different parameters on Cr+6 removal (%), (A) Effect of contact time at different initial concentration Cr+6, adsorbent dose 1gm chitosan and pH = 7, (B) Effect of Cr+6 concentration at equilibrium time, adsorbent dose 1gm chitosan and pH = 7, (C) Effect of adsorbent dose on Cr+6% removal at contact time 3 h and pH = 7, (D) Effect of pH on Cr+6% removal at 3 h, and adsorbent dose 1 gm chitosan.
Sustainability 13 13494 g001
Figure 2. Isotherm for chromium ions adsorption onto (A) CC, (B) CGC.
Sustainability 13 13494 g002
Figure 3. Isotherm for chromium ions adsorption onto (A) NC, (B) NGC.
Sustainability 13 13494 g003
Figure 4. Response surface plots for Cr+6 removal perecntage using cc-chitosan, grafted cc-chitosan, natural chitosan, and grafted natural chitosan, respectively: Effect of concentration/dose of (A) CC, (D) GCC, (G) NC, (J) NGC (time: 3 h; at 30 °C); effect of time/dose of (B) CC, (E) GCC, (H) NC, (K) NGC (Cr(VI) concentration = 100 ppm; at 30 °C); effect of time/concentration for (C) CC, (F) CGC, (I) NC, (L) GCC (dose: 1 gm; at 30 °C).
Sustainability 13 13494 g004
Table 1. Experimental variables and its levels using Box–Behnken factorial design.
Code of Variable Variables NameLevels
+10−1
X1Dose (mg)531
X2Concentration (ppm)1006020
X3Time (h)531
Table 2. Kinetic data for chromium ions adsorption onto commercial, commercial grafted chitosan, natural, and natural grafted chitosan.
MaterialsPseudo-First Order
qt = qe[1 − exp(−k1pt)]
Pseudo-Second Order
qt = k2pqe2t/(1 + qek2pt)
Elovich
qt = β ln(α β t)
ParametersR2ParametersR2 ParametersR2
CCqe =3.27 mg g−1,
k1p = 0.4561 h−1
0.9956qe = 13.41 mg g−1,
k2p = 0.0318 g mg−1 h−1
0.9806β = 3.2117 g mg−1,
α = 1.072 mg g−1 h−1
0.9756
CGNqe = 2.75 mg g−1,
k1p = 0.3467 h−1
0.9636qe = 13.07 mg g−1,
k2p = 0.0414 g mg−1 h−1
0.9829β = 3.1872 g mg−1,
α = 1.34 mg g−1 h−1
0.9686
NCqe =2.09 mg g−1,
k1p = −0.3828 h−1
0.7159qe = 13.69 mg g−1,
k2p = 0.027 g mg−1 h−1
0.9797β = 3.2759 g mg−1,
α = 0.96 mg g−1 h−1
0.978
NGCqe = 2.531 mg g−1,
k1p = 0.242 h−1
0.9883qe = 12.7 mg g−1,
k2p = 0.042 g mg−1 h−1
0.9908β = 3.0653 g mg−1,
α = 1.38 mg g−1 h−1
0.9833
Table 3. Box–Behnken factorial design of real values along with the experimental and predicted values for Cr+6 removal percentage using CC, GCC, NC, and NGC.
TrialDose(mg) (X1)Conc.(ppm) (X2)Time (h) (X3)Cr+6 Removal (%) Using CCCr+6 Removal (%) Using GCCCr+6 Removal (%) Using NCCr+6 Removal(%) Using GNC
MeasuredPredictedMeasuredPredictedMeasuredPredictedMeasuredPredicted
1320159.760.46961.462.16658.559.18662.961.267
2360390.690.61393.293.18488.988.8892.292.18
3560593.594.14894.695.14292.893.25995.794.200
4360390.690.61393.293.18488.988.88492.292.186
5520399.799.06799.8299.25998.497.92199.15100.63
6320159.760.46961.462.16658.559.18662.961.267
7560140.139.21248.647.60637.936.98246.3648.122
81100374.1874.84984.9185.42472.8873.31378.9577.425
9360390.690.61393.293.18488.988.88492.292.186
10120394.5693.65999.6598.66994.9594.04795.1596.925
115100377.278.13886.0286.95576.677.45784.9583.135
123100149.9349.96651.251.15748.448.35752.652.560
133100596.595.00098.697.01896.294.77987.290.425
14160588.3589.26493.2194.17288.2889.16592.8691.070
15160136.0235.39847.0346.45533.5533.05840.3641.832
Table 4. Parameter of selected quadratic model of Cr+6 removal percentage using different types of adsorbent.
AdsorbentsR-Squared (r2)Adjusted R-SquaredPredicted R-Squared
CC0.9920.980.88
GCC0.9980.9970.88
NC0.9920.990.88
GNC0.980.970.87
Publisher’s Note: MDPI stays neutral with regard to jurisdictional claims in published maps and institutional affiliations.

