Article

Smart City Governance Evaluation in the Era of Internet of Things: An Empirical Analysis of Jiangsu, China

1
School of Urban and Environmental Science, Huaiyin Normal University, Huai’an 223300, China
2
Key Research Base of Philosophy and Social Sciences of Colleges & Universities in Jiangsu Province, Research Institute of Huai River Eco-Economic Belt, Huai’an 223300, China
3
Department of Leisure Management, Minghsin University of Science and Technology, Hsinchu 30401, Taiwan
4
College of Architecture & Design, Chung Hua University, Hsinchu 30012, Taiwan
*
Authors to whom correspondence should be addressed.
Sustainability 2021, 13(24), 13606; https://0-doi-org.brum.beds.ac.uk/10.3390/su132413606
Submission received: 4 November 2021 / Revised: 7 December 2021 / Accepted: 7 December 2021 / Published: 9 December 2021
(This article belongs to the Special Issue Smart Sustainable Cities in the Era of Big Data)

Abstract

:
With the rapid development of smart cities all over the world, the evaluation of the smart city has become a new research hotspot in the academic circles. Nevertheless, there still exist a series of common problems in current smart city evaluation, including the cognitive deprivation, lack of experience in planning, low coordination level, etc. Therefore, it is critical to establish a new hierarchy for smart city evaluation indicators, especially in the 5G era. Based on literature review, expert consensus, and the fuzzy analytic hierarchy process, this study developed an innovative smart city evaluation framework. In the framework, an index comprising three dimensions, i.e., smart economy, smart society, and smart environmental protection, as well as several attributes for these dimensions for smart city evaluation were established. Then, taking Jiangsu Province, the fastest-growing province in China, as the research area, the development level of smart city for the cities in Jiangsu was calculated. The results have verified the effectiveness of the framework, which can provide suggestions for sustainable urbanization, and help urban decision-makers to promote the efficient development of smart cities.

Graphical Abstract

1. Introduction

The size of a city is an important urban attribute that affects population growth [1,2]. Due to the growing role of urban areas in the global economy [3,4], large cities are expected to increase in size more quickly than small cities [5]. This growth may result in various new urban challenges; the development of smart city evaluation is one notable example. The smart city, a concept currently under development, results from the development of urban informatization. In accordance with the improvement in technology, economy, and society, the use of new-generation information technology such as big data, cloud computing, the Internet of Things (IoT), geographic information, and the mobile internet to develop smart cities and facilitate sustainable urban development is an area deserving further study. In July 2005, the European Union implemented the i2010 strategy and proposed a European smart city evaluation framework for facilitating the rapid development of European smart cities [6]. In 2009, IBM proposed the Smarter Planet initiative and launched a smart city concept and an action plan, creating 11 strategic smarter planet themes for worldwide implementation [7]. The development of smart cities has received increasing attention globally, and has become a crucial choice for the innovative development of cities in numerous countries and regions [8].
The Ministry of Housing and Urban–Rural Development of the People’s Republic of China issued a Notice on the Work of National Smart City Pilots [9] in 2012. Furthermore, in the National New-Type Urbanization Plan issued in 2014 (2014–2020), the ministry clearly stated the demand to accelerate and upgrade the evaluation of smart cities, making it a national strategic project [10]. The 13th Five-Year Plan for the National Economic and Social Development [11] promulgated by the State Council of the People’s Republic of China in March 2016 marked the first inclusion of smart cities into the national strategic project, and proposed to establish a number of new demonstrative smart cities. In 2020, new smart cities had successfully been established with transparent and efficient online government, precise urban governance, safe and reliable operating systems, an integrated and innovative information economy, and ubiquitous services for the people [12]. According to the 2019 China Smart City Development Report, as of February 2019, a total of more than 700 cities including 100% of the sub-provincial cities and 93% of prefectural level cities in China have proposed or been implementing smart city plans. These plans include 290 smart city pilot programs and account for 70% of all smart city plans globally over the same period, making China have evolved from learning and understanding to the world’s primary testing ground for smart city innovation [11].
The development of smart city is a crucial strategy for China’s new urbanization. Starting from the interpretation of smart city, this study first introduced the definition of smart city based on previous research, and explored four characteristics of smart cities, i.e., the interconnection, fusion, cooperation, and application of urban information system. The increasing maturity of technologies such as 5G and IoT has facilitated the development of smart cities. However, evaluation frameworks for smart cities require updating and innovation. Thus, a comprehensive smart city evaluation framework was established based on the current requirements for smart city development. The goals of the framework are to evaluate the effects of smart city in different regions, improve the deficiencies in smart city research, and provide support for the future city development and planning. In this study, the cities in Jiangsu Province, China, were assessed using the developed innovative index framework for smart city evaluation in the 5G era. A fuzzy analytic hierarchy process (AHP) was employed to integrate expert opinions to select the evaluation criteria [13]. In the discussion of results, some suggestions for smart economy, smart society, and smart environmental protection policies were proposed to promote the efficient development of smart cities in Jiangsu Province.

2. Overview and Theoretical Basis

2.1. Overview of Smart City

The inconsistent understanding of the meaning of the term “smart city” and differences in the development models and goals of cities in different countries inhibit the evaluation of smart city development. Therefore, an evaluation method for smart cities must be developed. In the 1990s, Graham and Mitchell proposed some theories and laid the foundation for smart city theory [14,15]. Previous studies have typically considered urban infrastructures to be the most crucial factor in smart city development. In addition to buildings, transportation, and other tangible facilities, information technology is also a major factor of improving the basic functions of cities [16]. The aforementioned study explained the effects of information and communications technology (ICT) on urban development. The inclusion of information technology in smart city evaluation is a requirement for technological development, as well as a crucial turning point for city evaluation. Allwinkle conducted a comparative study on the theory by Graham and Mitchell [17]. Although IBM [18], Forrester Research, the Natural Resources Defense Council, and the Council of Europe Intelligence defined the smart city from different perspectives [19], their definitions were highly consistent; that is, smart cities rely on the city’s social, public, information, and commercial infrastructure as well as the circulation of resources [20].
Hollands [21] discussed the difficulty of establishing the concept of smart city by explaining the hidden factors involved in the smart city label. First, since 2000, the definition of smart city has not been refined, and no new elements have been added. Second, various studies have been conducted on ICT, but the link between smart technologies and quality of life has yet to be clearly established. Giffinger [22] believed that the smart city is a smart society in which various elements such as people, environment, mobility, governance, and economy are built on smart infrastructure. On the other hand, smart cities must include citizens, who are a key element of smart cities because they form a city through constant interaction. For this reason, a smart public is considered to be a key driving force of smart cities; thus education, learning, and knowledge are essential for the strategy of smart city development [23]. Moreover, social infrastructure such as knowledge capital and social capital can be regarded as the basic elements of a smart city because they connect the relationship between people and form [24]. Yigitcanlar et al. [25] discovered, through literature review, six themes that determine smart city quality: productivity, sustainability, accessibility, happiness, livability, and governance. All of these are considered to be qualities of ideal smart cities. Therefore, the concept of smart city implies a complex mixture of education, culture, art, economy, and commerce. Despite varied opinions on the definition of smart cities, the consensus is that smart cities adopt new technologies to improve the efficiency of urban infrastructure functions. Currently, smart city is extensively applied for urban management and civil service rather than a new concept, with the purpose of utilizing various information technologies or innovations to connect and integrate urban systems and services, enhance the efficiency of resources utilization, optimize urban management and services, and improve citizens’ quality of life. Owing to rapid development of a new generation of 5G IoT technology, urban development is closely connected with intelligent infrastructures.

2.2. Current Development of Smart Cities

Some evaluation index frameworks for smart city development have been proposed, such as the ICF evaluation index introduced by the US Intelligent Community Forum, the smart city evaluation index for European Union medium-sized cities launched by research institutions such as the Vienna University of Technology, and the national standard Evaluation Indicators Framework of New-Type Smart City introduced by the Chinese government agencies such as the National Development and Reform Commission of the People’s Republic of China (2016) [26,27]. The Intelligent Community Forum, headquartered in New York, has been evaluating the Smart City of the Year worldwide since 1999 [28,29]. A study by the SRF Center of Regional Science, Vienna University of Technology, identified six dimensions that cover the ranking of 70 medium-sized European cities: smart economy, smart people (social and human capital), smart governance (participation), smart mobility (transport and ICT), smart environment (natural resources), and smart living (quality of life). The six dimensions are connected to the traditional regional theories and neoclassical theories of urban growth and urban development, and are based on the theories related to competitiveness, social and human capital, participation, transport and ICT, natural resource, and quality of life, respectively [30,31]. Paris is the largest city in France. In order to improve metropolitan governance in Paris, France, launched the Greater Paris plan to promote the green, low-carbon, and sustainable development in Paris, which realized the reorganization of the Paris transportation network and the integration of urban and suburban development [32,33].
The Japanese government began to accelerate the country’s ICT projects in 2000 and formulated a stepwise strategy from E-Japan, E-JapanⅡ, U-Japan, and finally to I-Japan, with the goal of building a secure and lively digital society [34,35]. New York is the largest city in the United States and one of the world’s economic centers. In 2009, New York launched the Urban Interconnection Initiative to promote the optimization of urban information infrastructure by establishing smart cities and improving the level of urban public services [36,37]. Research on evaluation frameworks for smart cities in China just began in recent years but has developed quickly [38,39]. Current overall goals for Chinese smart city development are the ubiquitous services for citizens, transparent and efficient online government, integrated and innovative digital economy, precise and sophisticated urban governance, and safe and reliable operating systems [40,41].

2.3. Establishment of Evaluation Index

Establishing a comprehensive model for evaluating the effectiveness of smart city measures is an arduous task. This is because the smart city evaluation is a method covering multiple aspects and technologies, which also covers numerous cities and needs multiple initiatives [42]. In this section, we invited a total of 15 expert decision-makers including 5 doctors and professions, 5 senior engineers in urban planning, and 5 senior government managers, to make a plural expert decision integrating academics, planning technologies, and official opinions. The in-depth interview and investigations were conducted on the members of planning committees who are familiar with the advantages and disadvantages of the research object or who have the professional background knowledge. Based on integrated evaluation, scholars have studied the characteristics of smart cities by assessing eight main domains, including the economy, environment, society, governance, energy, infrastructure, transportation, and pandemic resiliency [43]. For example, Vinod Kumar and Dahiya held the opinion that smart city system comprises six key building blocks, i.e., smart people, smart city economy, smart mobility, smart environment, smart living, and smart governance [44]. Anand et al. adopted an input–output dimension for measurement, in which the input criteria includes the mobility, economy, environment, society, and energy, while the output criteria includes the quality of life, self-sustenance, and economic prosperity [45]. To sum up, the research hotspots include the following three dimensions, i.e., smart economy, smart society, and smart environmental protection. The detailed academic research is described below:
  • Smart economy: Smart city shows outstanding performance in productivity [31]; to be specific, the labor market shows high flexibility and welcomes human resources that can increase wealth [35,41]. Smart city attaches great importance to creativity and favorably receives new ideas [19,44,46,47,48], which can contribute to the growth of GDP [49].
  • Smart society: The establishment of smart cities should be started from constructing an intelligent government featured by information open [49,50]. The intelligent infrastructures, as the supporting systems for a city, are just like human hones that support the urban development. Therefore, it is necessary to perfect the infrastructures such as transportation, information and IoT, thereby maintaining the stability of smart city system [26,51,52,53].
  • Smart environmental protection: From the perspective of environmental protection, new intelligent technologies can be more embodied in urban management. Improving urban greening rate is the most important index of citizen life [17,54]. The recycling and reutilization of garbage made by human can also be implemented based on the novel smart management [1,12]. In terms of the discharge of domestic and industrial wastewater, it is the optimal tool for IoT application [39,54,55,56,57,58].
Next, the exchange of views on the detailed indexes was performed via brainstorming. Using consensus ranking method, the indexes were classified and the systematic evaluation hierarchical structure was established [59]. By referencing different smart city evaluation indexes, three evaluation dimensions for assessing the developmental status of smart cities were identified, i.e., smart economy, smart society, and smart environmental protection. Based on previous research, the 5G coverage and the state of IoT development were added into the present evaluation framework. In order for the administrative units to effectively evaluate the intelligent degree of the evaluation regions, we simplified the evaluation framework into a feasible one. It should be noted that, the indicators have been varied due to dynamic changes with the development of intelligent Internet of Things in the new era. Therefore, after referencing the evaluation indexes from previous research, some new intelligent technologies were added in the framework, which are the infrastructures established by the rapid development of information and communications technology (ICT). Table 1 displays the hierarchical structure and detailed indexes of the present evaluation framework.
The evaluation framework in this study was divided into three levels: the target layer (first level), dimension level (second level), and index layer (third level), as presented in Table 2.

2.4. Overview of Smart City Development in Jiangsu

Jiangsu province, the empirical research area in this study, is located in the middle of the eastern coastal area of China at the lower reaches of Yangtze River and Huai River. It is a crucial part of the Yangtze River Delta, facing the Yellow Sea to the east, Shandong to the north, Anhui to the west, and Shanghai and Zhejiang to the southeast [60,61] (Figure 1). It has 13 prefecture-level cities, i.e., Nanjing, Wuxi, Xuzhou, Changzhou, Suzhou, Nantong, Lianyungang, Huai’an, Yancheng, Yangzhou, Zhenjiang, Taizhou, and Suqian, and covers an area of 107,200 square kilometers.
Jiangsu province has a well-developed economy and is the leading province in terms of informatization and smart city development. By actively promoting the in-depth integration of informatization and industrialization, reinforcing the application of e-government, strengthening information services for the people, promoting the upgrading of information facilities, improving the information industry, and strengthening information security, Jiangsu has achieved the comprehensive reinforcement of the informatization development [46,60]. In 2016, the informatization development index in Jiangsu reached 89.17%, and the size of the information economy reached RMB 2 trillion, accounting for 32.15% of GDP. The development index of regional informatization and industrial integration reached 97.37% [62]. In order to improve the top-level design and planning guidance of smart cities, more than 20 cities have become pilot smart cities through building smart city infrastructure and platforms, promoting the rapid development of smart industries, and actively expanding smart applications and services related to people’s livelihood. These efforts have substantially improved the smart city development [63].

3. Methods

3.1. Literature Review

Literature review is the process of systematic investigation and analysis of relevant literature in social research to understanding the state of research in a particular field. In the context of 5G IoT development, this study investigated the current state of smart city evaluation through literature review and established a novel evaluation index framework.
In the evaluation of urban development, decision making is meaningful when making choices with multi-targets, multi-criterion, or multi-attributes. Over the past two decades, the multi-criteria decision-making method has witnessed rapid development, which now has been used by many scholars in design, selection, and evaluation. On the basis of multi-criteria evaluation, the decision-maker first expresses the preference structure; then, non-inferior solutions are obtained or the order of alternative solutions is ranked. Generally, multi-criteria decision-making methods can be classified into the multi-objective decision-making (MODM) and the multi-criteria decision-making (MCDM) methods [64,65]. Using MCDM, the optimal one among various alternative solutions can be determined by evaluating the relative importance degrees of various attributions. Therefore, MCDM can be regarded as selection problem analysis, and is generally applied for the selection of evaluation dimensions.
In this study, the evaluation was conducted using the MCDM method. In the MCDM method, scholars mainly adopted the delphi method [66,67], the nominal group technique [68], the consensus ranking method [59], and the data envelopment analysis (DEA) model used to evaluate the input/output efficiency [50,69]. Analytic hierarchy process (AHP) is appropriate to the evaluation of urban development in this study since it can calculate the weights of various indexes in multi-attribute decision making.

3.2. Analytic Hierarchy Process

AHP is a system analysis method proposed by Saaty [70]. The major function of AHP is to determine the relative importance degrees (i.e., the weights) of multiple criterion and check the consistency of the results in addition to calculating the weights of various criteria at the same level [71]. AHP now has been extensively applied in many domains for decision making in the cases with uncertainty and multiple evaluation criterion, which is particularly suitable for qualitative information evaluation [45,72]. Using AHP, decision-makers can establish the hierarchical architecture for intricate and complex evaluation problems with system structure method, make hierarchical decomposition at different dimensions, and provide decision-makers with in-depth understanding via quantitative judgment, thereby reducing the risk in making wrong decisions. The applications of AHP in urban development mainly include the evaluation of transportation [73], the selection of suitable sites [74], and the analysis of disaster risks [75].
The fuzzy AHP (FAHP) combines the AHP and fuzzy comprehensive evaluation by using AHP to determine the weight of each index in the evaluation index framework and the fuzzy comprehensive evaluation approach to evaluate the fuzzy indexes [76,77]. FAHP is based on AHP and uses expert judgments to perform a pairwise comparison of the factors in the evaluation framework. The weighted scores of factors at each level are calculated using FAHP and personal fuzzy linguistics [70,78,79]. AHP can simplify the problem into the evaluation factors with quantitative and qualitative attributes and provide the experts with quantitative data. Therefore, AHP relies on the individual knowledge, experiences, and judgments. However, individual thinking and judgment are always of fuzziness and uncertainties, thus the quantitative data from experts may differ due to their different standards. On that basis, the true judgments by expert group can be more appropriately described at a fuzzy linguistic level. The calculation method of FAHP is described in the following subsections.

3.2.1. Problem Analysis and Establishment of a Hierarchical Structure

The steps of establishing an evaluation framework include: (1) determine the problems to be solved, (2) analyze the objective problem, and (3) determine the evaluation factors. In this study, the problem to be addressed is the evaluation framework of smart cities in the 5G era. Subsequently, an evaluation framework was established through a questionnaire survey, expert interviews, and literature review. Finally, the hierarchical structure was established. The smart city evaluation was divided into three levels: target layer, dimension layer, and index layer.

3.2.2. Pairwise Comparison and Establishment of a Fuzzy Judgment Matrix

The weight of each factor in the previous level was obtained through pairwise comparison of the evaluation factors. According to the study by Saaty (1980), a comparison scale between 1 and 9 is recommended [71,76] (Table 3). Figure 2 presents the membership function of the fuzzy linguistic variables.
A pairwise comparison between two factors is a comparison matrix. If an index system contains n factors to be compared, the factors must be compared n(n − 1)/2 times. If the ratio of factor i to factor j is a ˜ i j , the ratio of factor j to factor i is the reciprocal of the original ratio; that is, 1/ a ˜ i j . Similarly, the lower triangle of the pairwise comparison matrix is the reciprocal of the triangle, as presented in Equation (1):
A = [ a ˜ i j ] = [ 1 a ˜ 12 a ˜ 1 n 1 a ˜ 12 1 a ˜ 2 n 1 a ˜ 1 n 1 a ˜ 2 n 1 ]
According to the evaluation of the expert questionnaires and evaluation standards, the geometric equation integrates comparative values of multiple experts for the same dimension or standard, as presented in Equation (2):
a ˜ i j = ( a ˜ i j 1 a ˜ i j 2 a ˜ i j k ) 1 k
where a ˜ i j k is the fuzzy number in the i-th row and j-th column of the k-th expert’s fuzzy matrix, and a ˜ i j is the fuzzy number in the i-th row and j-th column of the fuzzy matrix after expert group decision making.

3.2.3. Calculating the Fuzzy Weight

The weight value of a factor is known as its eigenvector. In the research method, the normalized column vector geometric mean was used to determine the calculation weight of the triangular fuzzy positive reciprocal matrix, as presented in Equations (3) and (4):
r ˜ i = ( a ˜ i 1 a ˜ i 2 a ˜ i 1 n ) 1 n
w ˜ = r ˜ ( r ˜ r ˜ r ˜ r ˜ ) 1
where
a ˜ i j is the fuzzy number of the i-th row and j-th column of the fuzzy matrix;
r ˜ i is the mean of the column vector of fuzzy numbers;
w ˜ i is the fuzzy weight of the i-th factor.

3.2.4. Fuzzy Consistency Inspection

Calculating the Consistency Index

For two judgment matrices that differ, larger n indicates a larger consistency index (CI). To determine whether the matrix satisfies the consistency test, the random index (RI) of the judgment matrix must be introduced. The RI value involves generating a matrix with n = 1–9 using the average random method, after which the CI value is calculated, and the RI value is acquired by calculating the mean [76] (Table 4).

Calculating the Consistency Ratio

The consistency ratio (CR) for each level is calculated. If CR < 0.1, the judgment matrix satisfies the consistency test; otherwise, the matrix should be readjusted.

3.2.5. Defuzzification Value

The triangular fuzzy matrix for each evaluation standard can be obtained in accordance with the calculated fuzzy number. However, because the fuzzy number is inaccurate, defuzzification should be performed using fuzzy sorting [80]. The center of gravity method was used to solve this problem. The key of the center of gravity method is to identify the center point of the triangular area, and the representative value is the center point of the area for the fuzzy matrix (Equation (5)):
B N P = [ ( U w i ˜ L w i ˜ ) + ( M w i ˜ L w i ˜ ) ] ÷ 3 + L w i ˜ ,   i
where
i is the criteria code;
L w i ˜ is the mean of the low score given by the expert group to the weight of the scheme criterion i;
M w i ˜ is the mean of the medium score given by the expert group to the weight of the scheme criterion i;
U w i ˜ is the mean of the high score given by the expert group to the weight of the scheme criterion i.

3.2.6. Hierarchy Construction and Weight Determination

The value obtained from the structure selection value E is multiplied by the calculated weight W to acquire the total evaluation value R of each structure, as shown in Equation (6):
R = W × E

3.3. Data Sources and Standardization

In the process of smart city development in China, the access to open data is an essential task for the government to make public the information. The data used for smart city evaluation in Jiangsu primarily originated from two sources. The city-level data were from the Jiangsu Statistical Yearbook 2019 and the 2019 Statistical Yearbook of Prefecture-Level Cities in Jiangsu [62], and the evaluation criterion were from the questionnaires answered by experts and satisfaction surveys of residents.
Each index had different measurement units; thus, the indexes were first standardized and converted into a unified standard evaluation score for comprehensive comparisons.
The maximum value standardization method was used to standardize the raw data. The maximum value of the new data after standardization was 1, and the other values were between 0 and 1. With the maximum value of 1 as the reference frame, the values of similar indexes could be determined. Equation (7) presents the calculation for the maximum value standardization:
N i = N i N m a x
where
N i is the new index value after standardization;
N i is the original index value before standardization;
N m a x is the maximum value among indexes of the same category.
The standardization results for each index layer are presented in Table 5.

4. Results and Discussions

4.1. Analysis of Index Weights

First, the indexes were literately reviewed and summarized at an in-depth interview phase of same expert groups. After the experts reached a consensus, the key indexes were determined and the hierarchical structure was established. Then, the hierarchical levels of the systematical structure were ascertained with the information provided by AHP, and the weights of different criteria at the same level with great differences but correlations were calculated, thereby providing the basis for decision-makers in selection and decision making. All of these can help decision-makers to make the best decision. In this study, the weight of each factor in the hierarchical structure was obtained, and the schemes were sorted to judge their pros and cons.
In order to solve the transitivity problem in pairwise comparison during expert opinion survey, the confidence degree of the consistency test with AHP was determined via one-to-one in-depth interview. The smart city evaluation framework was divided into target, dimension, and index layers, and the evaluation factors were subjected to pairwise comparisons to obtain the importance weighting of each factor in the previous level, and a judgment matrix was established. Subsequently, the results of the personal linguistic scale survey were fuzzified, and the final weight values of each evaluation factor were acquired.
Table 6 presents the weighting results for evaluation index factors for smart cities.
According to the results in Table 5, smart economy had the largest weight (0.427), followed by smart society (0.339) and smart environmental protection (0.234); thus, smart economy was more important than either smart society or smart environmental protection. Therefore, a better smart economy in a city indicates that the smart city has a higher level. For smart economy, smart society, and smart environmental protection, the factors of GDP per capita, opening and sharing of government information and resources, and green coverage in built-up areas had the largest weights of 0.229, 0.187, and 0.098, respectively.
By comparing the various factors and indexes, the overall weight ranking was: GDP per capita (0.229) > opening and sharing of government information and resources (0.187) > state of technological innovation (0.109) > green coverage in built-up areas (0.098) > science and technology expenditures (0.090) > state of IoT development (0.087) > environmental protection (0.078) > 5G coverage (0.066) > harmless treatment rate of domestic refuse (0.058).
The linear weighted summation method was used in this study to calculate the comprehensive index values of the standardized results and the weights obtained by the FAHP. Finally, the comprehensive values for the evaluation of smart city in each prefecture-level city of Jiangsu were obtained.
Table 7 presents the obtained comprehensive values in a descending order. According to Table 7, Suzhou had the highest comprehensive index for the state of smart city development (0.986), indicating that Suzhou’s smart city development is relatively high in Jiangsu. Nanjing was second (0.884), and Lianyungang had the lowest comprehensive index value (0.549). Overall, the smart cities in Jiangsu were assessed as an upper-middle level. The cities have developed economies, stable social development, substantial environmental protections, and relatively stable development speeds. By using the geographic information system software ArcGIS [81], the evaluation results can be displayed as a spatial distribution.
Figure 3 reveals that Nanjing, Wuxi, and Suzhou had the highest scores; Yangzhou, Zhenjiang, Changzhou, and Nantong had slightly lower scores; and Xuzhou, Lianyungang, Suqian, Huai’an, Yancheng, and Taizhou had the lowest scores. Overall, the state of smart city development in Jiangsu’s prefecture-level cities is directly proportional to the level of regional economic development. Clear regional divisions are present between southern, central, and northern Jiangsu, and the government should speed the construction in central and northern Jiangsu while developing southern Jiangsu to promote the balanced development of smart cities in the province.
According to the comprehensive ranking obtained by FAHP, Suzhou, Nanjing, Wuxi, and Changzhou are at the forefront of smart city development in Jiangsu.

4.1.1. Suzhou, Nanjing, Wuxi, and Changzhou

Suzhou is a national high-tech industrial base and is one of the crucial central cities in the Yangtze River Delta city cluster. Adjacent to Shanghai, it performs industrial transfer from Shanghai and connects to its industries. Additionally, transportation, government policy, and tourism industry have facilitated the development of Suzhou. Nanjing, as the provincial capital, has undergone rapid development due to its advantageous geographical location, scientific educational resources, and policy support. The swift development of the high-tech industry and economy has accelerated the development of Nanjing. Furthermore, the cultural atmosphere due to Nanjing’s numerous universities is also unique to the city. Wuxi, adjacent to Suzhou, is located at the center of the Suzhou–Wuxi–Changzhou metropolitan area. It has substantial natural resources, transportation facilities, high-tech companies, and cultural and educational resources. Finally, Changzhou, which is bordered by Wuxi in the east and Nanjing in the west, enables industrial transfer and connections between the Yangtze River Delta cluster, the Suzhou–Wuxi–Changzhou metropolitan area, and Nanjing, further promoting the rapid development of Changzhou.

4.1.2. Nantong, Yangzhou, Zhenjiang, and Taizhou

Nantong, Yangzhou, Zhenjiang, and Taizhou, the four central regions of Jiangsu, scored lower than the four cities in southern Jiangsu in the smart city evaluation. Nantong, also known as “northern Shanghai”, has excellent developmental potential as a national pilot smart city. Yangzhou is part of the Nanjing metropolitan circle and the Yangtze River Delta city cluster, and has stable economic development driven by the economies of Shanghai and Nanjing. Zhenjiang is located in south-central Jiangsu with Nanjing in the west, Changzhou to its south, and Yangzhou in the north; thus, it is a crucial transportation hub in east China. However, the domestic refuse treatment in Zhenjiang is poor, and its level of smart city development requires improvement. Located in central Jiangsu, Taizhou is an essential part of the Yangtze River city cluster and is the gateway to central Jiangsu. Due to its distance from Shanghai and Nanjing, the development and construction speed in Taizhou is slower than that in southern Jiangsu, and its smart city development could be improved substantially.

4.1.3. Xuzhou, Yancheng, Huai’an, Suqian, and Lianyungang

Smart city development in Xuzhou, Yancheng, Huai’an, Suqian, and Lianyungang clearly lags southern Jiangsu. Following the implementation of government informatization, numerous departments of Xuzhou have achieved efficient internal management; however, their information systems are independent, leading to difficulties optimizing the use of its information resources. In the 5G era, Yancheng should focus on improving connectivity through 5G construction projects and accelerating smart city development by applying these networks. The smart city development in Huai’an also lags among the cities in Jiangsu. Huai’an’s green coverage in built-up areas is the lowest among the cities in Jiangsu, highlighting the necessity of efforts to improve smart environmental protection. The key to building a smart city is the economy because economic improvements lead to improved material wealth and living standards. The economic development of Suqian is also relatively low in Jiangsu. Smart city development in Suqian could be enhanced by promoting economic development and GDP per capita growth. The informatization level of Lianyungang is relatively low. In the process of building a smart city, applying modern information technology and informatization in ports to improve their operational efficiency is necessary. Moreover, Lianyungang should improve its technological innovation and increase its investment in science and technology.

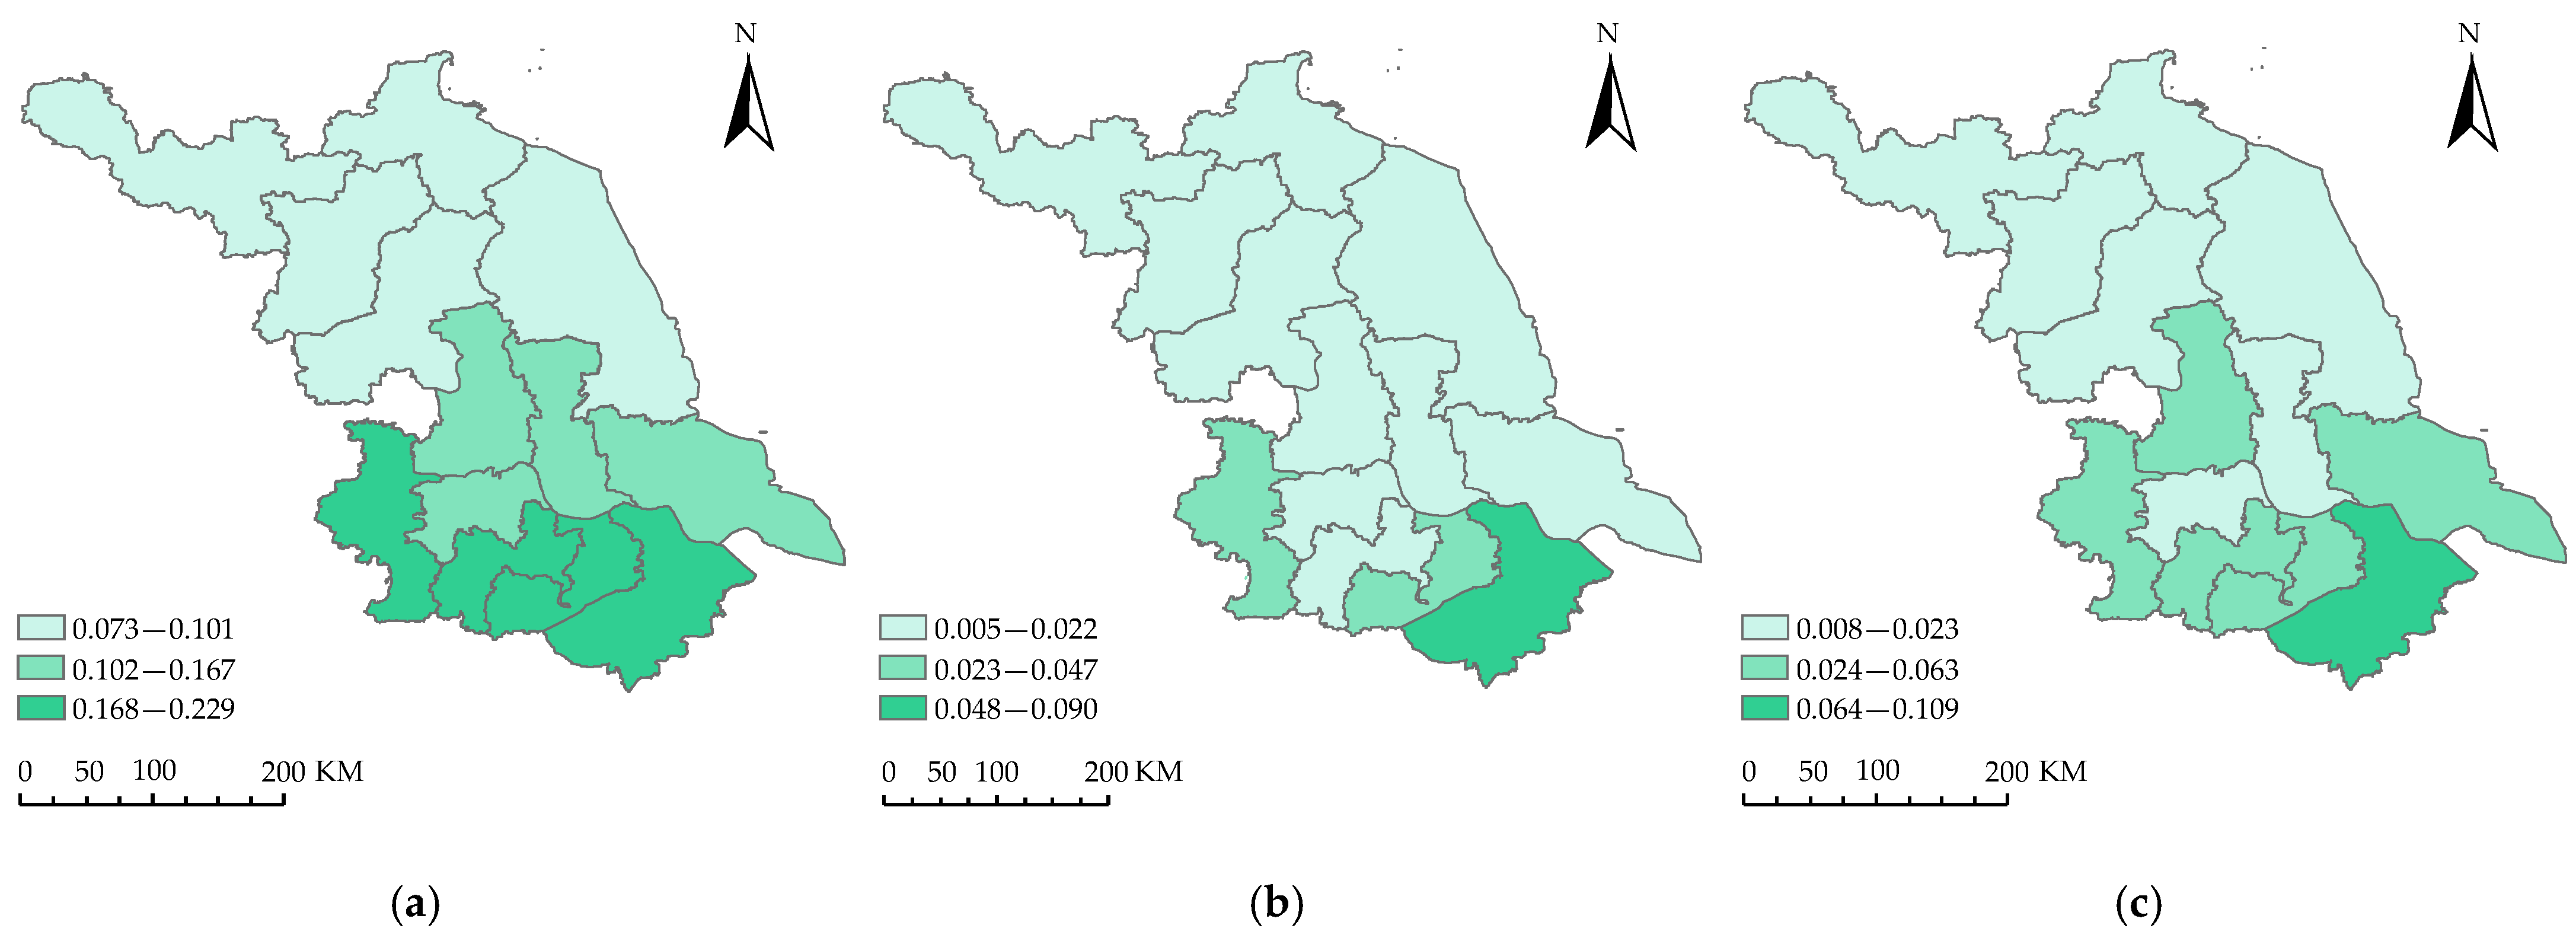
4.2. Subitem Analysis of Smart Economy Indexes

4.2.1. GDP per Capita

The southern Jiangsu region is located at the core area of the Yangtze River Delta. It is geographically close to Shanghai and its cities are advantaged by their proximity to this major city. The central Jiangsu region is located in the subcentral region of the Yangtze River Delta Economic Zone along the northern bank of the lower reaches of the Yangtze River; southern Jiangsu and Shanghai are immediately across the river. The northern Jiangsu region is located at the edge of the Yangtze River Delta Economic Zone, and is thus less affected by Shanghai, the core city of the economic zone (Figure 4a).

4.2.2. Science and Technology Expenditures

Science and technology expenditures reflect the expenditures for all scientific and technological activities of enterprises, such as applications of scientific research and experimental results, scientific and technological education and training, and other related services. Suzhou had the highest science and technology expenditures, followed by Wuxi and Nanjing; other regions had inadequate expenditures. Overall, science and technology expenditures are directly proportional to regional economic development (Figure 4b).

4.2.3. State of Technological Innovation

Technological innovation requires a favorable cultural environment. The southern Jiangsu region has a strong cultural atmosphere and high technological innovation; the northern region has relatively lower innovation. Moreover, the education system also affects the state of technological innovation. Nantong, the prefecture-level city with the strongest education programs in Jiangsu, also has higher technological innovation. Due to the economic development, cultural atmosphere, and educational support in northern Jiangsu, its technological innovation is inferior to that of southern Jiangsu (Figure 4c).

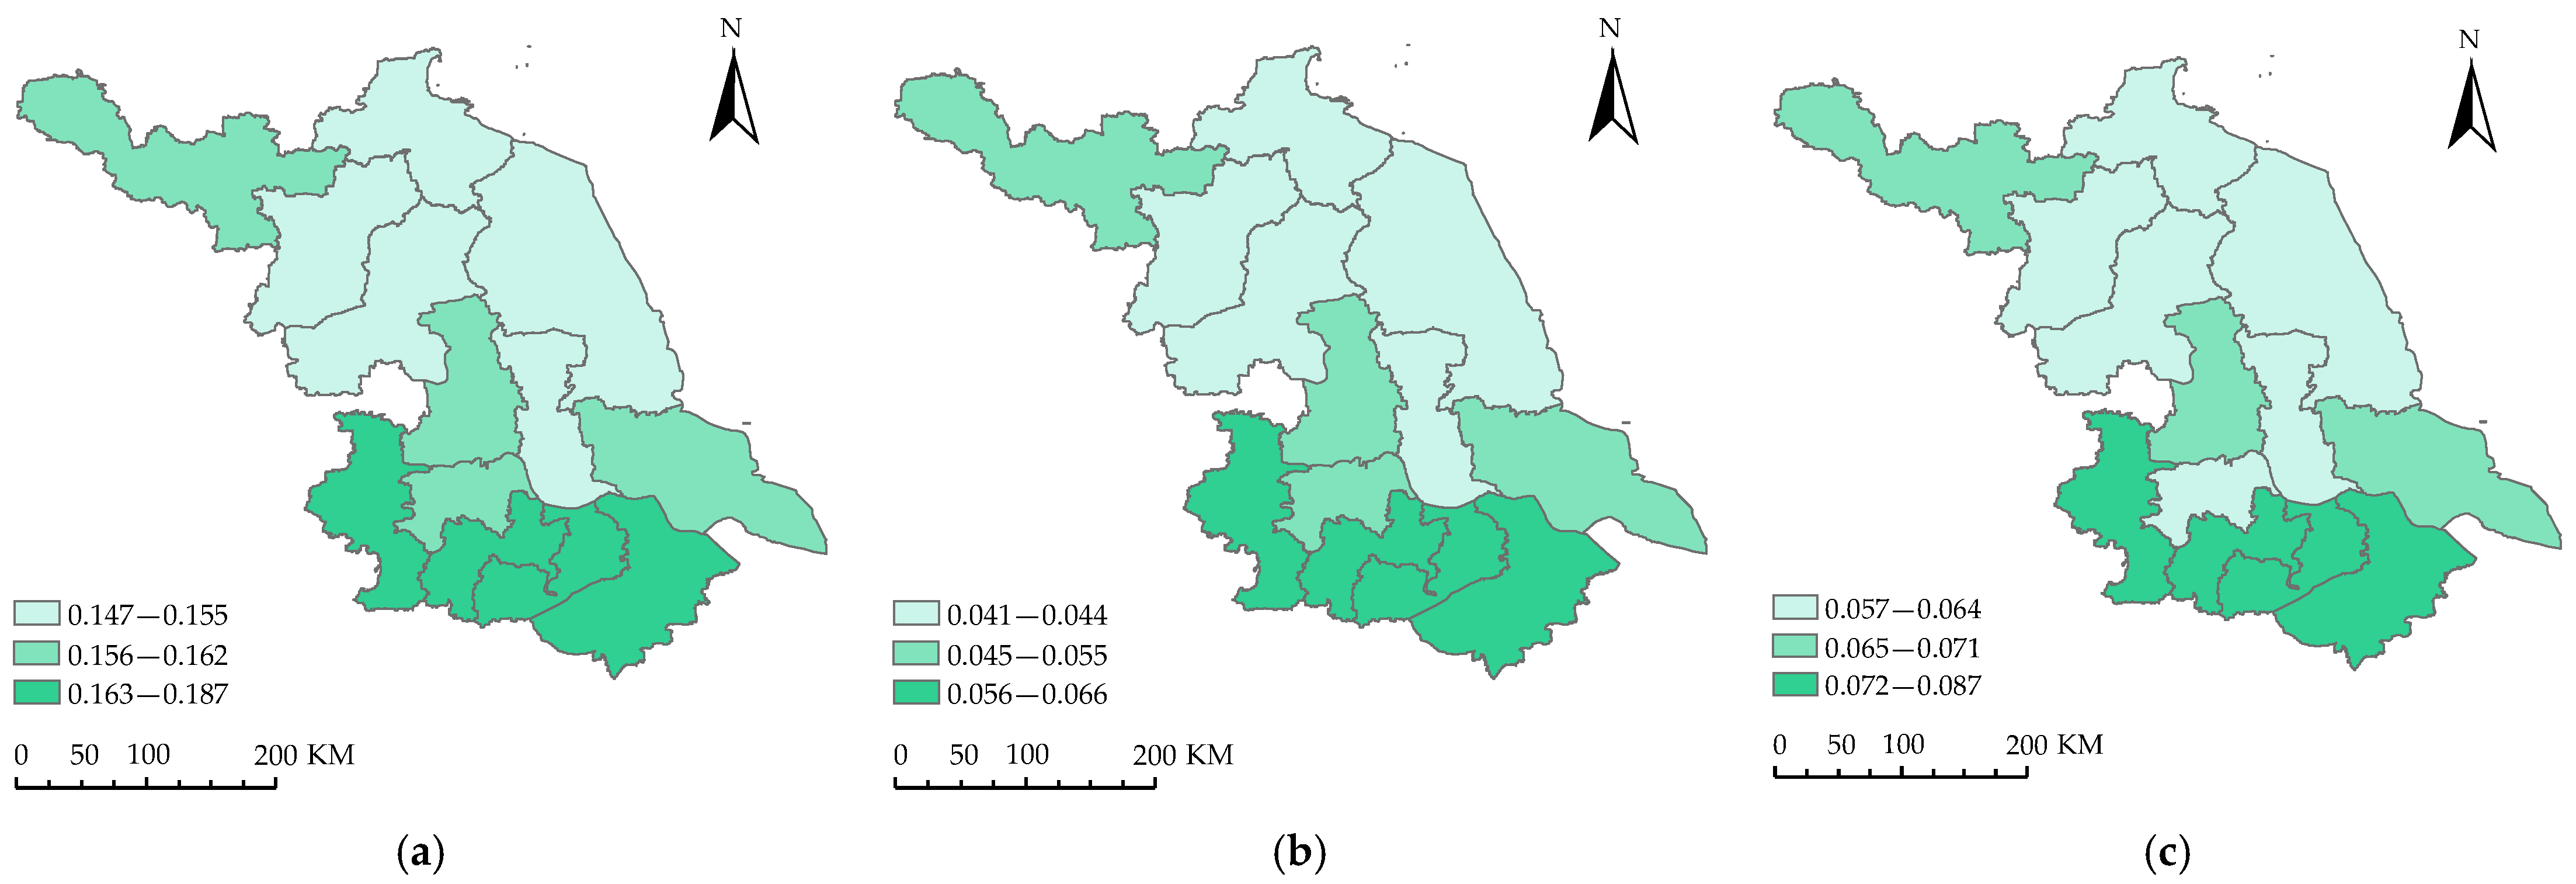
4.3. Subitem Analysis of Smart Society Indexes

4.3.1. Opening and Sharing of Government Information and Resources

Opening and sharing of government information and resources is the principles of integrating resources, promoting sharing, and strengthening security. Nanjing, Changzhou, Wuxi, and Suzhou have strong resource integration and sharing capacities; Xuzhou, Yangzhou, and Nantong are slightly weaker in these aspects. Lianyungang, Suqian, Huai’an, Yancheng, Taizhou, and Zhenjiang perform poorly in the aforementioned aspects, and the government should improve the opening and sharing of information resources (Figure 5a).

4.3.2. 5G Coverage

Research and development and the wide application of the new generation of information technology have elevated the innovation capacities of cities. Figure 5b reveals that Nanjing, Changzhou, Wuxi, and Suzhou have focused more on 5G construction, whereas Xuzhou, Yangzhou, Zhenjiang, and Nantong have not made a large investment into these technologies. Further investment in 5G construction is particularly required in Lianyungang, Suqian, Huai’an, Yancheng, and Taizhou.

4.3.3. State of IoT Development

The goal of constructing and developing IoT is to provide full sensing and efficient management and supply excellent services in accordance with the sustainable urban development philosophy. IoT technology is more widely used in Nanjing, Changzhou, Wuxi, and Suzhou; however, Xuzhou, Yangzhou, and Nantong have less 5G development. Further improvements in IoT deployments are required in Lianyungang, Suqian, Huai’an, Yancheng, Taizhou, and Zhenjiang (Figure 5c).

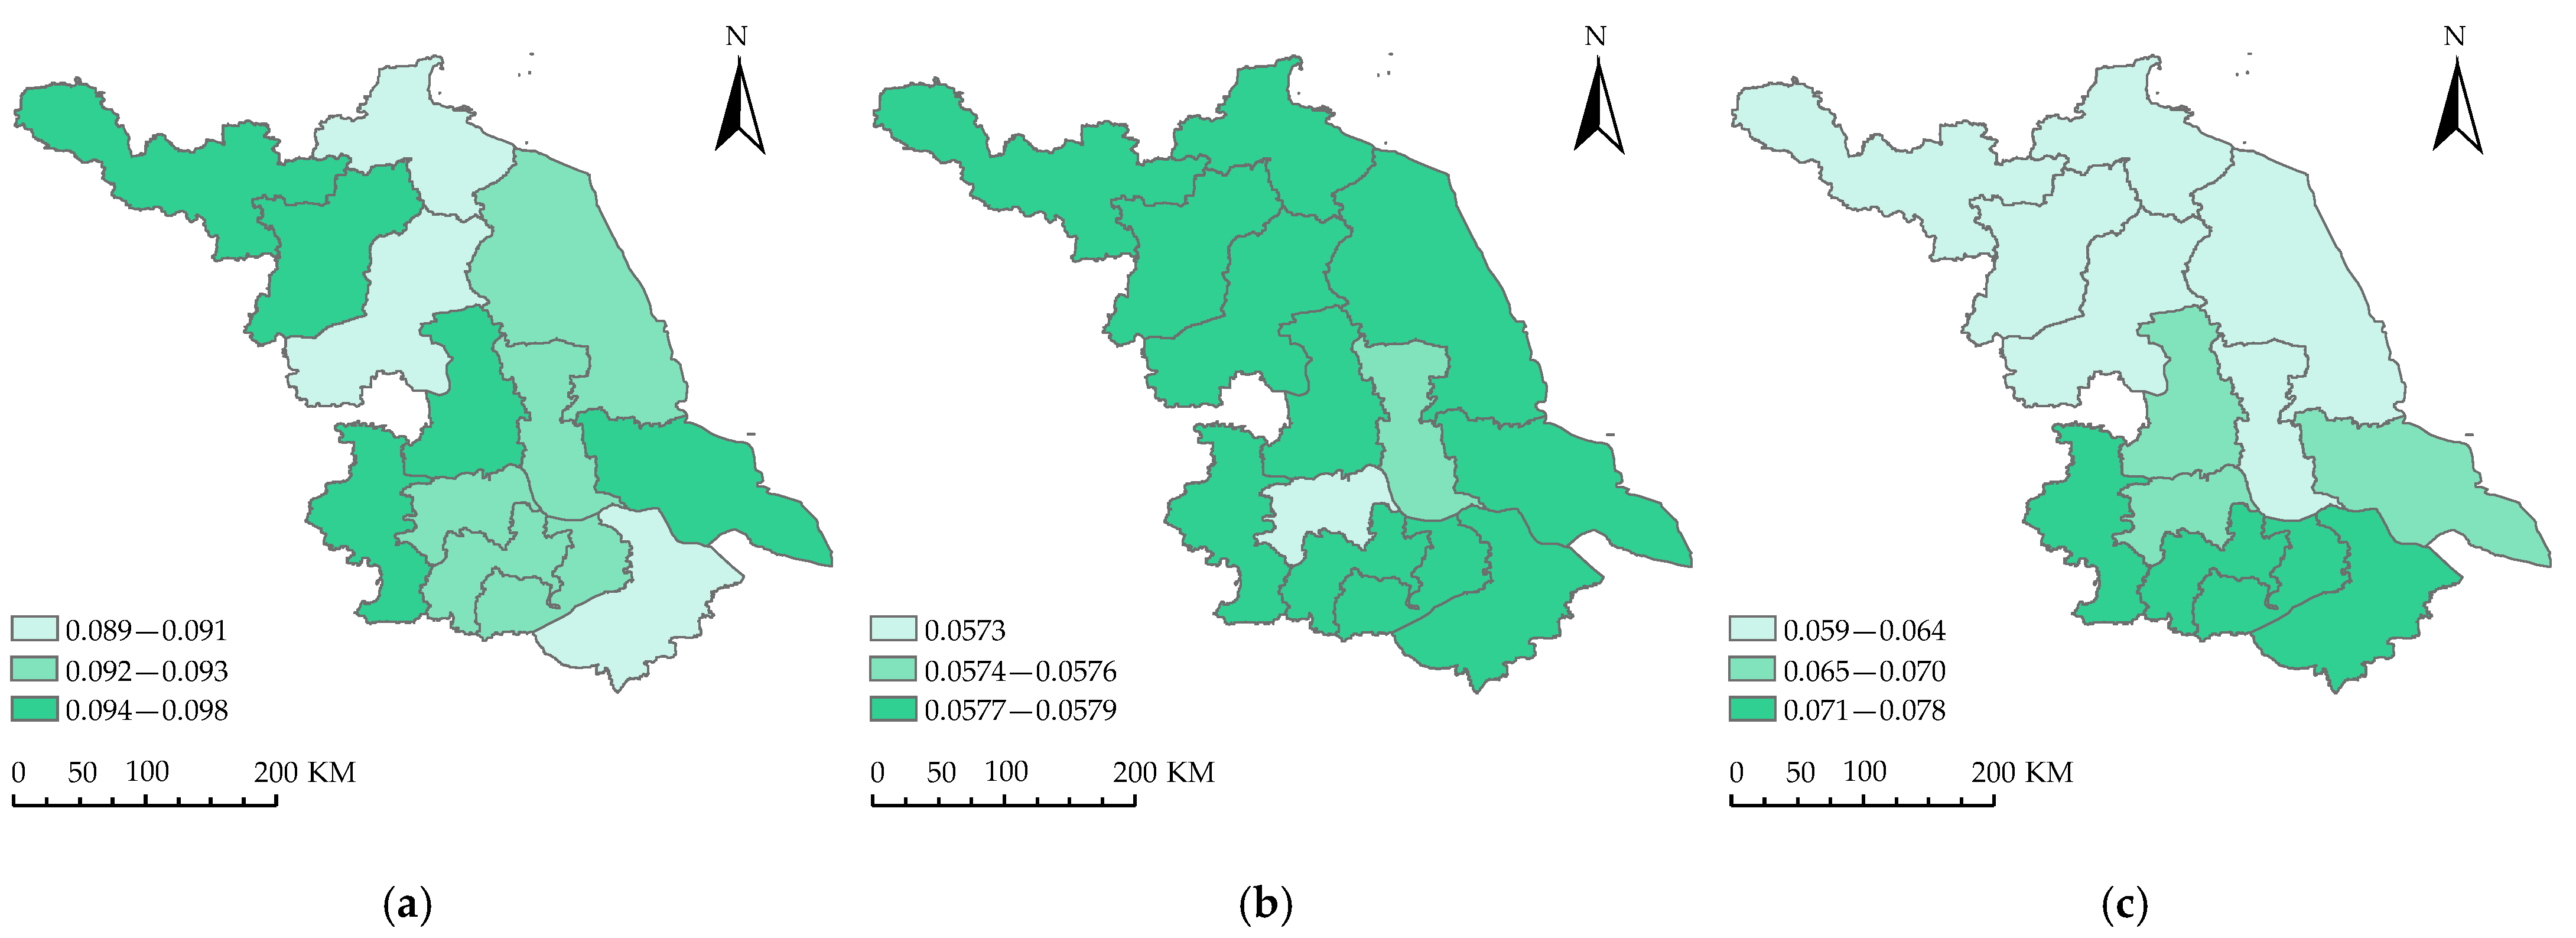
4.4. Subitem Analysis of Smart Environmental Protection Indicators

4.4.1. Green Coverage in Built-Up Areas

Green coverage in built-up areas refers to the percentage of green coverage in built-up areas in cities. According to Figure 6a, Xuzhou, Suqian, Yangzhou, Nanjing, and Nantong have a relatively higher green coverage, followed by Yancheng, Taizhou, Zhenjiang, Changzhou, and Wuxi. Lianyungang, Huai’an, and Suzhou have the lowest green coverage in built-up areas.

4.4.2. Harmless Treatment Rate of Domestic Refuse

Harmless treatment rate of domestic refuse refers to the percentage of the amount of urban refuse that is treated in a harmless manner in relation to the total amount of urban domestic refuse. The general requirement for harmless treatment rate of domestic refuse is ≥85%. Figure 6b shows that all prefecture-level cities in Jiangsu meet the aforementioned standard.

4.4.3. Environmental Protection

Environmental protection in smart cities involves the use of IoT technology for environmental management and decision making in a targeted and responsive manner. According to Figure 6c, Nanjing, Changzhou, Wuxi, and Suzhou had superior results for environmental protection, followed by Yangzhou, Zhenjiang, and Nantong. By contrast, Xuzhou, Lianyungang, Suqian, Huai’an, Yancheng, and Taizhou performed relatively poorly in environmental protection; thus, the governments of these cities should make further improvement in this aspect.

5. Conclusions

On the basis of existing research results for smart cities and the actual state of development in Jiangsu, an evaluation framework consisting of an index based on three dimensions, i.e., smart economy, smart society, and smart environmental protection, as well as several attributes for these dimensions for smart city evaluation were established in this study. Furthermore, after collecting relevant data and performing a comprehensive evaluation of 13 cities in Jiangsu using FAHP, the following conclusions were drawn:
  • Among the dimensions of smart economy, smart society, and smart environmental protection, smart economy had the highest weight, indicating that this dimension can best reflect the smart city level. Accordingly, its indexes also substantially reflect the development level of smart cities.
  • The development of smart cities is affected by numerous indexes, in which the GDP per capita, opening and sharing of government information and resources, and the state of technological innovation have the greatest weights. Economic improvements should be a major focus of currently developing smart cities, and the opening of government resources and technological innovation should be a secondary goal.
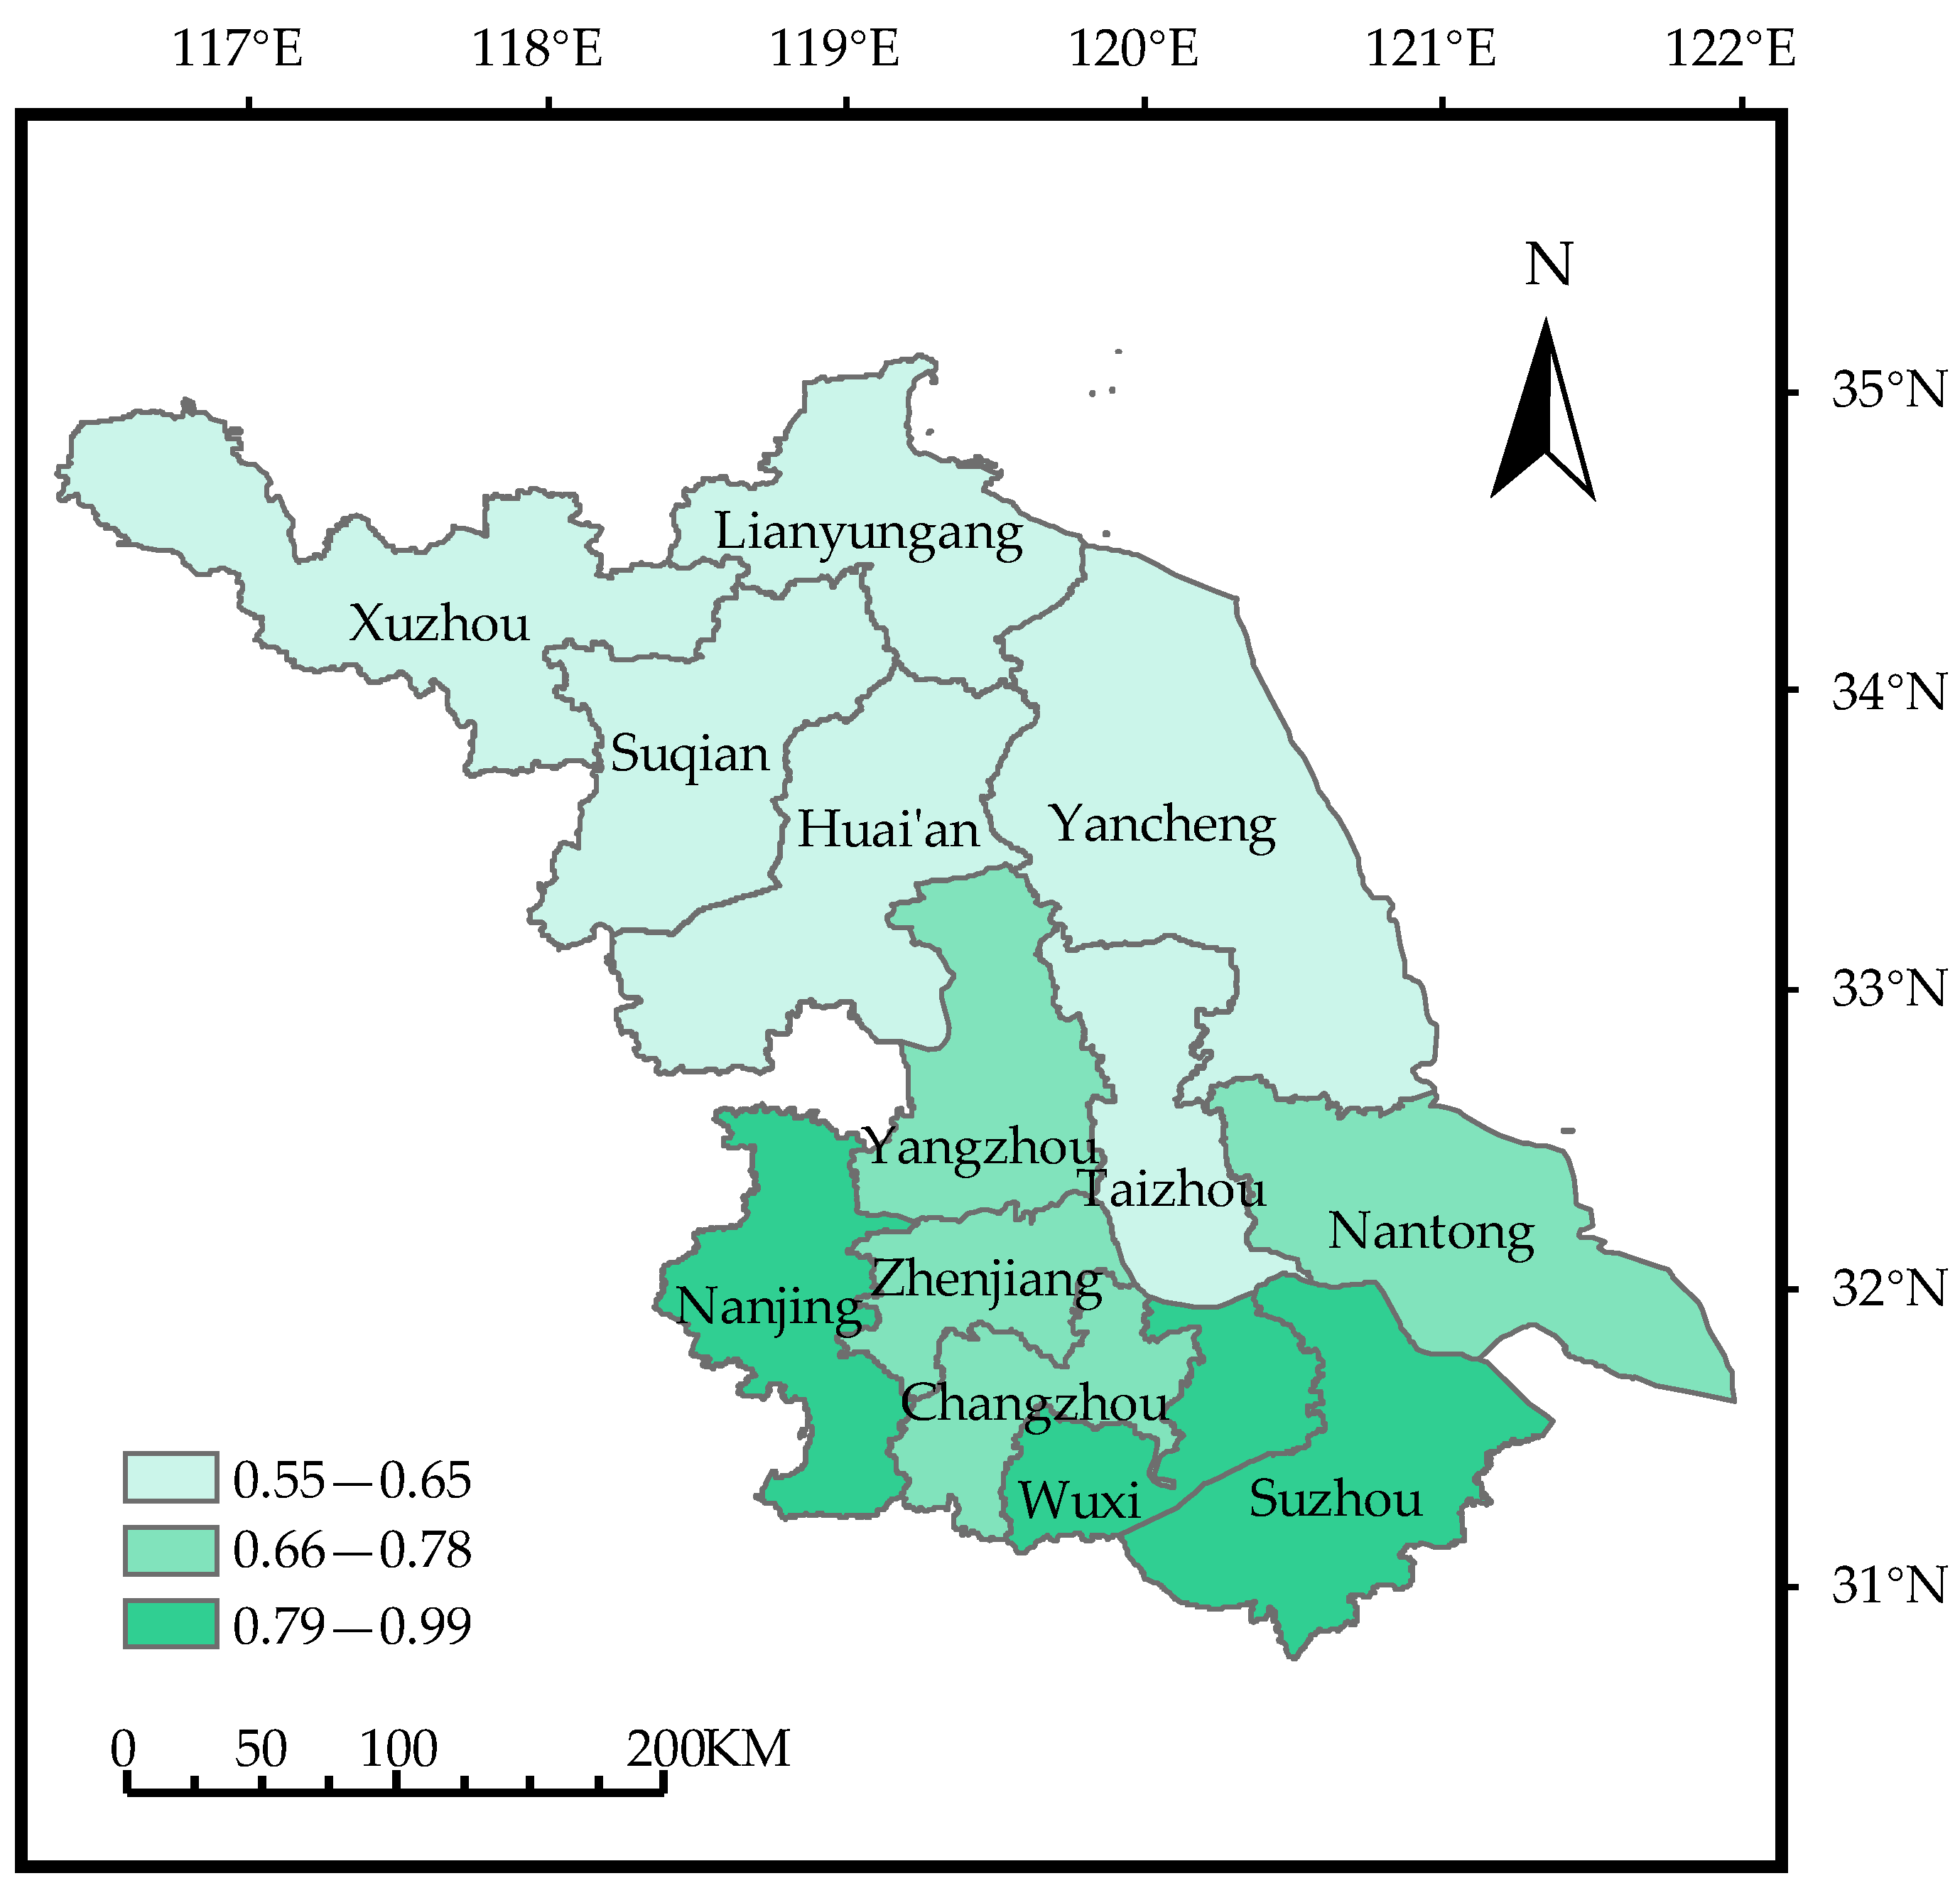
  • Despite the overall high level of smart city evaluation in Jiangsu, large regional differences were observed. The development of southern Jiangsu is greater than that of central and northern Jiangsu; northern Jiangsu was the least developed. Thus, southern Jiangsu should exercise its influence to assist cities in other regions. Moreover, cities in central and northern Jiangsu should innovate and expand construction to meet their individual needs, learn from the development models of leading cities, and accelerate their smart city development.
  • In actual applications, AHP may produce some unreasonable phenomena such as the reversion of evaluation results due to the limitations in expert group thinking or the difficulty in information acquisition. The opinions of different experts or scholars should be integrated and served as the evaluation basis in decision making. In some cases, decision-makers differ greatly in terms of the cognition of various decision-making attributes and some evaluators cannot reflect the evaluation results because of low weights. The calculated geometrical average is no longer suitable and the decisions cannot really reflect actual condition. The limitations of the present research can be improved by future researchers with more qualitative in-depth interview.
Overall, this study established a framework for smart city evaluation in the 5G IoT era. The framework can be used to identify methods of sustainable urbanization and serve as an essential reference for urban decision-makers in accelerating smart city development.

Author Contributions

Conceptualization, W.-L.H.; Funding acquisition, H.X. and C.Z.; Investigation, W.-L.H. and M.Q.; Methodology, W.-L.H. and H.-L.L.; Resources, W.-L.H. and H.X.; Software, M.Q. and C.Z.; Supervision, W.-L.H.; Validation, H.-L.L.; Visualization, H.-L.L.; Writing—original draft preparation, and Y.-C.S.; Writing—review and editing, and Y.-C.S. All authors have read and agreed to the published version of the manuscript.

Funding

Humanities and Social Sciences Foundation of the Chinese Ministry of Education (Grant No.20YJAGAT002, 20YJA630087); 2020 Major Project about the Philosophy and Social Sciences of Higher education in Jiangsu Province, China (Grant Number: 2020SJZDA043).

Institutional Review Board Statement

Not applicable.

Informed Consent Statement

Not applicable.

Data Availability Statement

Not applicable.

Acknowledgments

We would like to thank anonymous reviewers for their valuable comments and suggestions for improving this paper.

Conflicts of Interest

The authors declare no conflict of interest.

References

  1. Cividino, S.; Halbac-Cotoara-Zamfir, R.; Salvati, L. Revisiting the “City Life Cycle”: Global Urbanization and Implications for Regional Development. Sustainability 2020, 12, 1151. [Google Scholar] [CrossRef] [Green Version]
  2. Guerin-Pace, F. Rank-Size Distribution and the Process of Urban Growth. Urban Stud. 1995, 32, 551–562. [Google Scholar] [CrossRef]
  3. Carlucci, M.; Grigoriadis, E.; Rontos, K.; Salvati, L. Revisiting a Hegemonic Concept: Long-term ‘Mediterranean Urbanization’ in Between City Re-polarization and Metropolitan Decline. Appl. Spat. Anal. Policy 2017, 10, 347–362. [Google Scholar] [CrossRef]
  4. Li, H.; Wang, G.; Tian, G.; Jombach, S. Mapping and Analyzing the Park Cooling Effect on Urban Heat Island in an Expanding City: A Case Study in Zhengzhou City, China. Land 2020, 9, 57. [Google Scholar] [CrossRef] [Green Version]
  5. Egidi, G.; Salvati, L.; Vinci, S. The long way to tipperary: City size and worldwide urban population trends, 1950–2030. Sustain. Cities Soc. 2020, 60, 102148. [Google Scholar] [CrossRef]
  6. Gil, H. The elderly and the digital inclusion: A brief reference to the initiatives of the European Union and Portugal. MOJ Gerontol. Geriatr. 2019, 4, 213–221. Available online: http://hdl.handle.net/10400.11/6868 (accessed on 26 July 2021). [CrossRef] [Green Version]
  7. Paroutis, S.; Bennett, M.; Heracleous, L. A strategic view on smart city technology: The case of IBM Smarter Cities during a recession. Technol. Forecast. Soc. Chang. 2014, 89, 262–272. [Google Scholar] [CrossRef]
  8. Stübinger, J.; Schneider, L. Understanding Smart City—A Data-Driven Literature Review. Sustainability 2020, 12, 8460. [Google Scholar] [CrossRef]
  9. Notice of Launching the National Smart City Pilot Work, China. Available online: http://www.gov.cn/zwgk/2012-12/05/content_2282674.htm (accessed on 4 November 2021).
  10. National New Urbanization Plan (2014–2020). Available online: https://www.ndrc.gov.cn/xwdt/ztzl/xxczhjs/ghzc/201605/t20160505_971882.html (accessed on 4 November 2021).
  11. Shen, L.; Huang, Z.; Wong, S.W.; Liao, S.; Lou, Y. A holistic evaluation of smart city performance in the context of China. J. Clean. Prod. 2018, 200, 667–679. [Google Scholar] [CrossRef]
  12. Liu, P.; Peng, Z. China’s Smart City Pilots: A Progress Report. Computer 2014, 47, 72–81. [Google Scholar] [CrossRef]
  13. Chen, S.-J.; Hwang, C.-L. Fuzzy Multiple Attribute Decision Making Methods. In Fuzzy Multiple Attribute Decision Making. Lecture Notes in Economics and Mathematical Systems; Springer: Berlin/Heidelberg, Germany, 1992; Volume 375, pp. 289–486. [Google Scholar] [CrossRef]
  14. Graham, S. Telecommunications and the future of cities: Debunking the myths. Cities 1997, 14, 21–29. [Google Scholar] [CrossRef]
  15. Mitchell, W.J. City of Bits: Space, Place, and the Infobahn; The MIT Press: Cambridge, MA, USA, 1996. [Google Scholar]
  16. Buuse, D.v.d.; Kolk, A. An exploration of smart city approaches by international ICT firms. Technol. Forecast. Soc. Chang. 2019, 142, 220–234. [Google Scholar] [CrossRef]
  17. Allwinkle, S.; Cruickshank, P. Creating Smart-er Cities: An Overview. J. Urban Technol. 2011, 18, 1–16. [Google Scholar] [CrossRef]
  18. Harrison, C.; Eckman, B.; Hamilton, R.; Hartswick, P.; Williams, P. Foundations for Smarter Cities. IBM J. Res. Dev. 2010, 54, 1–16. [Google Scholar] [CrossRef]
  19. Nicos, K. Intelligent Cities: Innovation, Knowledge Systems and Digital Spaces; Taylor and Francis: London, UK, 2013. [Google Scholar] [CrossRef]
  20. Washburn, D.; Sindhu, U. Helping CIOs Understand “Smart City” Initiatives; Forrester Research: Cambridge, MA, USA, 2010; Available online: https://s3-us-west-2.amazonaws.com/itworldcanada/archive/Themes/Hubs/Brainstorm/forrester_help_cios_smart_city.pdf (accessed on 3 November 2021).
  21. Hollands, R.G. Will the real smart city please stand up?: Will the real smart city please stand up? City 2008, 13, 303–320. [Google Scholar] [CrossRef]
  22. Giffinger, R.; Gudrun, H. Smart cities ranking: An effective instrument for the positioning of the cities? ACE Archit. City 2010, 4, 7–26. [Google Scholar] [CrossRef] [Green Version]
  23. Florida, R. Cities and the Creative Class. City Community 2003, 2, 3–19. [Google Scholar] [CrossRef]
  24. Alawadhi, S.; Aldama-Nalda, A.; Chourabi, H.; Gil-Garcia, J.R.; Leung, S.; Mellouli, S.; Nam, T.; Pardo, T.A.; Scholl, H.J.; Walker, S. Building Understanding of Smart City Initiatives. Int. Conf. Electron. Gov. 2012, 7443, 40–53. [Google Scholar] [CrossRef] [Green Version]
  25. Yigitcanlar, T.; Kamruzzaman, M.; Buys, L.; Ioppolo, G.; Sabatini-Marques, J.; Da Costa, E.M.; Yun, J.H.J. Understanding ’smart cities’: Intertwining development drivers with desired outcomes in a multidimensional framework. Cities 2018, 81, 145–160. [Google Scholar] [CrossRef]
  26. Shi, H.; Tsai, S.-B.; Lin, X.; Zhang, T. How to Evaluate Smart Cities’ Construction? A Comparison of Chinese Smart City Evaluation Methods Based on PSF. Sustainability 2018, 10, 37. [Google Scholar] [CrossRef] [Green Version]
  27. Li, C.; Dai, Z.; Liu, X.; Sun, W. Evaluation System: Evaluation of Smart City Shareable Framework and Its Applications in China. Sustainability 2020, 12, 2957. [Google Scholar] [CrossRef] [Green Version]
  28. Wu, Z. Intelligent City Evaluation Systems in West. In Intelligent City Evaluation System. Strategic Research on Construction and Promotion of China’s Intelligent Cities; Springer: Singapore, 2018. [Google Scholar] [CrossRef]
  29. Moulaii, M.M.; Kharvari, F.; Shahhosseini, G.; Esmailpour Zanjani, N. Definition and recognition of required factors for smartening cities in developing countries. J. Urban Manag. Energy Sustain. 2019, 1, 119–127. [Google Scholar] [CrossRef]
  30. Roblek, V. 5—The smart city of Vienna. In Smart City Emergence; Anthopoulos, L., Ed.; Elsevier: Amsterdam, The Netherlands, 2019; pp. 105–127. [Google Scholar] [CrossRef]
  31. City-Ranking of European Medium-Sized Cities. Available online: https://internationalgbc.org/wp-content/uploads/2021/07/01016_smart_cities_final_report.pdf (accessed on 4 November 2021).
  32. Roussel, F.; Alexandre, F. Landscape ecological enhancement and environmental inequalities in peri-urban areas, using flora as a socio-ecological indicator–The case of the greater Paris area. Landsc. Urban Plann. 2021, 210, 104062. [Google Scholar] [CrossRef]
  33. Fernandez Agueda, B. Rationalizing the greater city. The 1919 international competition for Greater Paris. Plan. Perspect. 2017, 32, 1–24. [Google Scholar] [CrossRef]
  34. Jain, P. The Catch-up State: E-government in Japan. Jpn. Stud. 2010, 22, 237–255. [Google Scholar] [CrossRef]
  35. Jingye, L.; Takehiro, T. Practical Process for Introducing Smart Business Continuity Management of Smart City in Japan. Procedia Eng. 2016, 146, 288–295. [Google Scholar] [CrossRef] [Green Version]
  36. Shelton, T.; Zook, M.; Wiig, A. The ‘actually existing smart city’. Camb. J. Reg. Econ. Soc. 2015, 8, 13–25. [Google Scholar] [CrossRef]
  37. Shah, J.; Kothari, J.; Doshi, N. A Survey of Smart City infrastructure via Case study on New York. Procedia Comput. Sci. 2019, 160, 702–705. [Google Scholar] [CrossRef]
  38. Hu, Q.; Zheng, Y. Smart city initiatives: A comparative study of American and Chinese cities. J. Urban Aff. 2021, 43, 504–525. [Google Scholar] [CrossRef]
  39. Song, T.; Cai, J.; Chahine, T.; Li, L. Towards Smart Cities by Internet of Things (IoT)—A Silent Revolution in China. J. Knowl. Econ. 2021, 12, 1–17. [Google Scholar] [CrossRef]
  40. Yao, T.; Huang, Z.; Zhao, W. Are smart cities more ecologically efficient? Evidence from China. Sustain. Cities Soc. 2020, 60, 102008. [Google Scholar] [CrossRef]
  41. Yan, J.; Liu, J.; Tseng, F.-M. An evaluation system based on the self-organizing system framework of smart cities: A case study of smart transportation systems in China. Technol. Forecast. Soc. Chang. 2020, 153, 119371. [Google Scholar] [CrossRef]
  42. Dameri, R.P. Smart City Implementation; Springer: Genoa, Italy, 2017. [Google Scholar] [CrossRef]
  43. Abu-Rayash, A.; Dincer, I. Development of integrated sustainability performance indicators for better management of smart cities. Sustain. Cities Soc. 2021, 67, 102704. [Google Scholar] [CrossRef]
  44. Vinod Kumar, T.M.; Dahiya, B. Smart Economy in Smart Cities. In Advances in 21st Century Human Settlements; Vinod Kumar, T.M., Ed.; Springer: Singapore, 2017. [Google Scholar] [CrossRef]
  45. Anand, A.; Winfred Rufuss, D.D.; Rajkumar, V.; Suganthi, L. Evaluation of Sustainability Indicators in Smart Cities for India Using MCDM Approach. Energy Procedia 2017, 141, 211–215. [Google Scholar] [CrossRef]
  46. Wang, C.; Mao, G.; Hsu, W.-L. Synergy Effect of Regional Industrial Agglomeration and Urbanization. Sens. Mater. 2021, 33, 727–737. [Google Scholar] [CrossRef]
  47. Gandy, O.H.; Nemorin, S. Toward a political economy of nudge: Smart city variations. Inf. Commun. Soc. 2019, 22, 2112–2126. [Google Scholar] [CrossRef]
  48. Nieto-Mengotti, M.; López-Arranz, A.; Novo-Corti, I. Chapter 5—Smart City as a Platform Economy: Civic Engagement and Self-Employment in Focus; Elsevier: Amsterdam, The Netherlands, 2019; pp. 63–76. [Google Scholar] [CrossRef]
  49. Li, G.; Wang, Y.; Luo, J.; Li, Y. Evaluation on Construction Level of Smart City: An Empirical Study from Twenty Chinese Cities. Sustainability 2018, 10, 3348. [Google Scholar] [CrossRef] [Green Version]
  50. Wang, M.; Zhou, T.; Wang, D. Tracking the evolution processes of smart cities in China by assessing performance and efficiency. Technol. Soc. 2020, 63, 101353. [Google Scholar] [CrossRef]
  51. Xu, H.; Hsu, W.-L.; Meen, T.-H.; Zhu, J.H. Can Higher Education, Economic Growth and Innovation Ability Improve Each Other? Sustainability 2020, 12, 2515. [Google Scholar] [CrossRef] [Green Version]
  52. Westraadt, L.; Calitz, A. A modelling framework for integrated smart city planning and management. Sustain. Cities Soc. 2020, 63, 102444. [Google Scholar] [CrossRef]
  53. Laufs, J.; Borrion, H.; Bradford, B. Security and the smart city: A systematic review. Sustain. Cities Soc. 2020, 55, 102023. [Google Scholar] [CrossRef]
  54. Bakker, K.; Ritts, M. Smart Earth: A meta-review and implications for environmental governance. Glob. Environ. Chang. 2018, 52, 201–211. [Google Scholar] [CrossRef]
  55. Wang, C.; Long, R.; Mao, G.; Cao, L.; Hsu, W.-L. Spatiotemporal Sensitivity Characteristics of Water Resources in Huai River Ecological–Economic Belt, China. Sens. Mater. 2021, 33, 1473–1483. [Google Scholar] [CrossRef]
  56. Chen, T.-T.; Hsu, W.-L.; Chen, W.-K. An Assessment of Water Resources in the Taiwan Strait Island Using the Water Poverty Index. Sustainability 2020, 12, 2351. [Google Scholar] [CrossRef] [Green Version]
  57. Ren, Q.; Li, H. Spatiotemporal Effects and Driving Factors of Water Pollutants Discharge in Beijing–Tianjin–Hebei Region. Water 2021, 13, 1174. [Google Scholar] [CrossRef]
  58. Colding, J.; Barthel, S. An urban ecology critique on the “Smart City” model. J. Clean. Prod. 2017, 164, 95–101. [Google Scholar] [CrossRef]
  59. Cook, W.D.; Seiford, L.M. Priority Ranking and Consensus Formation. Manag. Sci. 1978, 24, 1721–1732. [Google Scholar] [CrossRef]
  60. Xu, H.; Hsu, W.-L.; Lee, Y.-C.; Chern, T.-Y.; Luo, S.-W. Information Application of the Regional Development: Strategic Couplings in Global Production Networks in Jiangsu, China. Information 2020, 11, 420. [Google Scholar] [CrossRef]
  61. Zhang, C.; Wang, C.; Mao, G.; Wang, M.; Hsu, W.-L. An Empirical Study on the Ecological Economy of the Huai River in China. Water 2020, 12, 2162. [Google Scholar] [CrossRef]
  62. Statistical Communiqué of the People’s Republic of China on the 2019 National Economic and Social Development. Available online: http://www.stats.gov.cn/ (accessed on 4 November 2021).
  63. Xi, G.; Zhen, F.; Cao, C.; Luosang, Z. Construction Mode and Propelling Strategy of Smart City: A Case Study of Jiangsu Province. Shanghai Urban Plan. Rev. 2018, 1, 27–31. Available online: https://t.cnki.net/kcms/detail?v=mZPqmfGOKqU2iq1jpm6Ly3u1bxOaJbZnhRB-khFw2l_TARjv8gEWAEEgGL5znJQ_vh5MtnWHNZfFckDsZ-zjnPYjMNdPrMVDwNb2Z41nakgVSJFUVagAOGwVvZw_1MRU&uniplatform=NZKPT (accessed on 4 November 2021). (In Chinese).
  64. Yoon, K.P.; Hwang, C.-L. Multiple Attribute Decision Making: An Introduction; Sage Publications: Thousand Oaks, CA, USA, 1995; Available online: https://0-uk-sagepub-com.brum.beds.ac.uk/en-gb/asi/book/multiple-attribute-decision-making (accessed on 4 November 2021).
  65. Tzeng, G.-H.; Huang, J.-J. Multiple Attribute Decision Making: Methods and Applications; CRC Press: Boca Raton, FL, USA, 2011; Available online: https://www.routledge.com/ (accessed on 4 November 2021).
  66. Linstone, H.A.; Turoff, M. The Delphi Method; Addison-Wesley Reading: Boston, MA, USA, 1975; Available online: https://www.amazon.co.uk/Delphi-Method-Applications-Harold-Linstone/dp/0201042932 (accessed on 4 November 2021).
  67. Barrios, M.; Guilera, G.; Nuño, L.; Gómez-Benito, J. Consensus in the delphi method: What makes a decision change? Technol. Forecast. Soc. Chang. 2021, 163, 120484. [Google Scholar] [CrossRef]
  68. Harvey, N.; Holmes, C.A. Nominal group technique: An effective method for obtaining group consensus. Int. J. Nurs. Pract. 2012, 18, 188–194. [Google Scholar] [CrossRef] [PubMed] [Green Version]
  69. Boussofiane, A.; Dyson, R.G.; Thanassoulis, E. Applied data envelopment analysis. Eur. J. Oper. Res. 1991, 52, 1–15. [Google Scholar] [CrossRef]
  70. Saaty, T.L. How to make a decision: The analytic hierarchy process. Eur. J. Oper. Res. 1990, 48, 9–26. [Google Scholar] [CrossRef]
  71. Saaty, T.L. What is the Analytic Hierarchy Process? In Mathematical Models for Decision Support; Springer: Berlin/Heidelberg, Germany, 1988; pp. 109–121. [Google Scholar]
  72. Myeong, S.; Jung, Y.; Lee, E. A Study on Determinant Factors in Smart City Development: An Analytic Hierarchy Process Analysis. Sustainability 2018, 10, 2606. [Google Scholar] [CrossRef] [Green Version]
  73. Wolnowska, A.E.; Konicki, W. Multi-criterial analysis of oversize cargo transport through the city, using the AHP method. Transp. Res. Procedia 2019, 39, 614–623. [Google Scholar] [CrossRef]
  74. Chaudhary, P.; Chhetri, S.K.; Joshi, K.M.; Shrestha, B.M.; Kayastha, P. Application of an Analytic Hierarchy Process (AHP) in the GIS interface for suitable fire site selection: A case study from Kathmandu Metropolitan City, Nepal. Socio-Econ. Plan. Sci. 2016, 53, 60–71. [Google Scholar] [CrossRef]
  75. Hu, J.; Chen, J.; Chen, Z.; Cao, J.; Wang, Q.; Zhao, L.; Zhang, H.; Xu, B.; Chen, G. Risk assessment of seismic hazards in hydraulic fracturing areas based on fuzzy comprehensive evaluation and AHP method (FAHP): A case analysis of Shangluo area in Yibin City, Sichuan Province, China. J. Pet. Sci. Eng. 2018, 170, 797–812. [Google Scholar] [CrossRef]
  76. Saaty, T.L. Decision making with the analytic hierarchy process. Int. J. Serv. Sci. 2008, 1, 83–98. [Google Scholar] [CrossRef] [Green Version]
  77. Buckley, J.J.; Feuring, T.; Hayashi, Y. Fuzzy hierarchical analysis revisited. Eur. J. Oper. Res. 2001, 129, 48–64. [Google Scholar] [CrossRef]
  78. Buckley, J.J. Fuzzy hierarchical analysis. Fuzzy Sets Syst. 1985, 17, 233–247. [Google Scholar] [CrossRef]
  79. Hsu, W.-L.; Shen, X.; Xu, H.; Zhang, C.; Liu, H.-L.; Shiau, Y.-C. Integrated Evaluations of Resource and Environment Carrying Capacity of the Huaihe River Ecological and Economic Belt in China. Land 2021, 10, 1168. [Google Scholar] [CrossRef]
  80. Hsu, W.-L.; Tsai, F.-M.; Shiau, Y.-C. Planning and assessment system for light rail transit construction in Taiwan. Microsyst. Technol. 2021, 27, 1051–1060. [Google Scholar] [CrossRef]
  81. ArcGIS. Available online: https://www.esri.com/en-us/arcgis/about-arcgis/overview?rsource=%2Fsoftware%2Farcgis (accessed on 4 November 2021).
Figure 1. Location and administrative areas of the study.
Sustainability 13 13606 g001
Figure 2. Membership function table of Linguistic Variables.
Sustainability 13 13606 g002
Figure 3. Comprehensive evaluation analysis.
Sustainability 13 13606 g003
Figure 4. Sub-item analysis of the smart economy indexes. (a) GDP per capita; (b) Science and technology expenditures; (c) State of technological innovation.
Sustainability 13 13606 g004
Figure 5. Subitem analysis of the smart society indexes. (a) Opening and sharing of government information and resources; (b) 5G coverage; (c) State of IoT development.
Sustainability 13 13606 g005
Figure 6. Sub-item analysis of the smart environmental protection index. (a) Green coverage in built-up areas; (b) Harmless treatment rate of domestic refuse; (c) Environmental protection.
Sustainability 13 13606 g006
Table 1. Description of the smart city evaluation indexes.
DimensionsEvaluation IndexesDescriptions
Smart
economy
GDP per capitaThe goal of smart cities is not merely to promote the growth of total urban GDP but also to improve people’s production and living standards.
Science and technology expenditureThe city’s expenditures for scientific research and experimental development, application of scientific research and experimental development results, scientific and technological education and training, and other relevant scientific and technological services.
State of technological innovationThe technological innovation of a city reflects its innovation capacity and driving force of the city’s development.
Smart
society
Opening and sharing of government information resources Integrate resources, promote sharing, strengthen security, and enhance the capacity of government data sharing and openness and big data services.
5G coverageThe 5G mobile communication network is a breakthrough and innovation in mobile communication technology in the era of modern network information, and it facilitates the development of smart cities.
State of IoT
development
A smart city is a comprehensive integration of applications in the IoT industry. By the unified and centralized management of sensing data and by processing big data smartly, a model for city management, control, and services can be established.
Smart
environmental
protection
Green coverage in built-up areasGreen coverage is an essential indicator that reflects the environmental protection state of a city.
Harmless treatment rate of domestic refuseThe percentage of the amount of urban refuse treated in a harmless manner in relation to the total amount of urban domestic refuse generated.
Environmental
protection
Environmental protection in smart cities involves the use of IoT technology to embed sensors and equipment into various environmental monitoring targets (objects) to realize environmental management and decision making in a dynamic manner.
Table 2. Evaluation index framework for smart city levels.
Target LayerDimension LayerIndex LayerCode
Smart citySmart economyGDP per capitaC1
Science and technology expendituresC2
State of technological innovationC3
Smart societyOpening and sharing of government information resourcesC4
5G coverageC5
State of IoT developmentC6
Smart environmental protectionGreen coverage in built-up areasC7
Harmless treatment rate of domestic refuseC8
Environmental protectionC9
Table 3. Fuzzy linguistic variables.
Fuzzy
Numbers
Semantic
Value
Fuzzy Number Endpoint
1 ˜ Equally important(1,1,3)
2 ˜ Between equally important and weakly important(1,2,4)
3 ˜ Weakly important(1,3,5)
4 ˜ Between weakly important and essentially important(2,4,6)
5 ˜ Essentially important(3,5,7)
6 ˜ Between essentially important and very strongly important(4,6,8)
7 ˜ Very strongly important(5,7,9)
8 ˜ Between strongly important and absolutely important(6,8,9)
9 ˜ Absolutely important(7,9,9)
Table 4. RI value table.
Index Number123456789101112
RI000.580.901.121.241.361.411.461.491.521.54
Table 5. Data standardization results.
RegionsC1C2C3C4C5C6C7C8C9
Nanjing0.8770.5290.5811.0000.9931.0001.0001.0001.000
Wuxi1.0000.3260.4650.9240.9180.9410.9531.0000.966
Xuzhou0.4410.1670.1480.8420.7630.8130.9761.0000.785
Changzhou0.8570.1670.3080.9450.8710.9200.9531.0000.930
Suzhou0.9971.0001.0000.9861.0000.9870.9091.0000.986
Nantong0.6620.2480.3240.8620.8370.8200.9761.0000.896
Lianyungang0.3520.0650.0760.7870.6490.6780.9091.0000.764
Huai’an0.4200.0610.1190.8140.6490.7120.9311.0000.757
Yancheng0.4360.1870.2100.8280.6680.7050.9531.0000.785
Yangzhou0.6940.1050.3010.8690.7570.7920.9761.0000.868
Zhenjiang0.7280.1080.2020.8550.7160.7390.9530.9900.848
Taizhou0.6310.0990.2060.8280.6610.6850.9530.9960.792
Suqian0.3210.0770.1120.8070.6210.6520.9761.0000.819
Table 6. Weights of smart city indexes.
Target LayerDimension LayerWeight Value of Dimension Layer Index LayerWeight Value of
Index layer
Smart citySmart economy0.427GDP per capita0.229
Science and technology expenditures0.090
State of technological innovation0.109
Smart society0.339Opening and sharing of government information and resources0.187
5G coverage0.066
State of IoT development0.087
Smart environmental protection0.234Green coverage in built-up areas0.098
Harmless treatment rate of domestic refuse0.058
Environmental protection0.078
Table 7. Comprehensive values of the state of smart city development in Jiangsu.
RankingAdministrative UnitComprehensive Value of the State of Smart City Development
1Suzhou0.986
2Nanjing0.884
3Wuxi0.849
4Changzhou0.782
5Nantong0.719
6Yangzhou0.703
7Zhenjiang0.686
8Taizhou0.646
9Xuzhou0.624
10Yancheng0.611
11Huai’an0.579
12Suqian0.558
13Lianyungang0.549
Publisher’s Note: MDPI stays neutral with regard to jurisdictional claims in published maps and institutional affiliations.

