
Determination of Selected Beneficial Substances in Peach Fruits
by
 , and
, and
Martina Mrázová
1, 
Eliška Rampáčková
1,
Petr Šnurkovič
2,
Ivo Ondrášek
1,
Tomáš Nečas
1,* and
and
Sezai Ercisli
3
1
Department of Fruit Science, Faculty of Horticulture in Lednice, Mendel University in Brno, 691 44 Lednice, Czech Republic
2
Department of Post-Harvest Technology of Horticultural Products, Faculty of Horticulture in Lednice, Mendel University in Brno, 691 44 Lednice, Czech Republic
3
Department of Horticulture, Faculty of Agriculture, Ataturk University, Erzurum 25240, Turkey
*
Author to whom correspondence should be addressed.
Sustainability 2021, 13(24), 14028; https://0-doi-org.brum.beds.ac.uk/10.3390/su132414028
Submission received: 3 November 2021
/
Revised: 8 December 2021
/
Accepted: 13 December 2021
/
Published: 20 December 2021
(This article belongs to the Special Issue Sustainable Fruit Growing: From Orchard to Table)
Abstract
:Peaches (Prunus persica L.) are a popular and sought-after dessert fruit. This is mainly due to their flavour, aroma, attractive appearance, and high content of substances that play an important role in human nutrition. The present study was carried out to determine some important analytical properties (sugars/sucrose, glucose, fructose and sorbitol), total acid, total phenolics, flavonoids, antioxidant capacity, carotenoids and anthocyanins of 34 selected peach varieties. The analyses are also complemented by colorimetric measurements of peach skin colour using CIELAB and other chromatic parameters. The results show, for example, that all peach varieties are good sources of phenolic compounds (9.43–577 mg gallic acid equivalent (GAE).100 g−1), flavonoids (1.12–95.1 mg catechin equivalent (CAE).100 g−1), and antioxidant capacity (136–462 mg Trolox equivalent (TE).100 g−1).
1. Introduction
There are a great variety of peach trees (Prunus persica L.), not only in terms of the length of ripening period, but also in terms of the pomological characteristics of the fruit, where we can distinguish yellow-fleshed, white-fleshed, red-fleshed, fully separable from the stone or clings, flat-shaped varieties, referred to as Peento, that are very popular in southern Italy and Asia. There are also well-known selections of varieties without any anthocyanin content, originating in Italy (the ‘ice peach’), and the Californian ‘Royal’ series of varieties, which are characterised by their very hard flesh and very low acid content, giving the fruit a sweet taste.
From a nutritional point of view, peaches contain a number of beneficial substances, making them an interesting addition to the human diet. Peaches are a rich source of dietary fibre (1.5 g.100 g−1) and provitamin A [1]. This fruit is considerably rich in antioxidants and is an important source of vitamins A, B, and C, carotenoids and phenolic compounds. Among the most important phenolic acids are chlorogenic and neochlorogenic acids, catechin, epicatechin, 3-glucoside of cyanidin (chrysanthemin), and quercetin derivatives [2,3,4,5]. Polyphenols represent the majority of antioxidants present in the diet and their daily intake should exceed 1 g/day, which is much higher than that of all other classes of phytochemicals and known dietary antioxidants [6]. They are low in fat and contain a lot of water, approximately 89 g per 100 g of fruit [7,8]. Peaches are very low in sugars (9–20 °Rf), with the main sugars present being sucrose, fructose, sorbitol, and glucose. The proportions of these sugars undergo changes during fruit ripening, with glucose and fructose being present in greater amounts in immature fruit and increasing as ripening progresses. At full maturity, sucrose content dominates [9,10,11]. Carbohydrates are an important source of energy in the human diet and also play an important role in the regulation of the gut microbiota [12]. They also have low levels of organic acids (0.13–1.16%) such as malic, citric, and folic acids. The content of L-ascorbic acid (vitamin C) in peaches is relatively low compared to other fruits such as kiwifruit or oranges, in which it is the most important antioxidant. Quinic, fumaric, and shikimic acids are present in smaller concentrations [13,14]. Amino acids (arginine, asparagine, isoleucine, lysine, serine, threonine, valine, leucine, phenylalanine, tryptophan, tyrosine, proline, and alanine) also contribute to the flavour of fruit and are found in peaches in different concentrations depending on the cultivar [15,16]. Among the mineral elements, they contain nitrogen, phosphorus, potassium, calcium, magnesium, iron, manganese, zinc, cooper, chromium, nickel, cobalt, lead, selenium, and fluoride [17,18]. Similar to apricots, the glycoside amygdalin (26%), protein amandine (3.8%), enzymes, lactase, and oleic acids are present in peach kernels. The leaves contain about 1% prunasin and are used against rheumatism, gastritis, headaches, and as a diuretic; when used externally, they are effective against eczema, ulcers, and other dermatoses [19].
The potential of peaches, especially those rich in phenolics, lies in delaying or even preventing the onset of neurogenerative diseases such as Alzheimer’s and Parkinson’s. They also help in the prevention of inflammation, atherosclerosis, diabetes, obesity, and cardiovascular disease. Due to their low sugar content, they can easily be included in nutritional therapy. They are easily digestible, have a strong alkaline effect on the body, and stimulate the secretion of digestive juices. They have both a laxative and a diuretic effect. Peach phenolics have been shown to display several biological activities such as antioxidant activity [20,21], anti-allergic and anti-inflammatory activities [22], antibacterial activity [23], hepatoprotective activity [24], nephroprotective activity [25], antiproliferative [26], chemopreventive, and anticancer activities [27,28].
The aim of this study was to compare varieties from different pomological groups as well as different geographical origins and thus get an overview of the differences in content composition from the point of view of titratable acidity, soluble solid content, sugars, phenolic compounds, flavonoids, antioxidant activity, carotenoids, and total anthocyanin content.
2. Materials and Methods
2.1. Site of Planting and Plant Material
In total, 34 peach cultivars of different origin were analysed in this study (Table 1). 20 cultivars from USA, 6 from Yalta, 5 from Italy, 1 from Czech Republic, 1 from France, and 1 from Slovakia. Trees of these cultivars were grown in the experimental orchard at the Faculty of Horticulture in Lednice, Mendel University in Brno (localisation 48.80°N/16.80°E, at an altitude of 172 m), with an average annual temperature of 9.7 °C.
Five fruits from each variety were harvested at their harvest maturity and transported to the laboratory for chemical analyses.
2.2. Determination of Titratable Acidity
The determination of titratable acidity was performed by potentiometric titration, with a solution of 0.1 mol.L−1 NaOH of a known factor up to pH 8.1 measured by a combined SenTix™ 81 pH electrode (WTW™, Prague, Czech Republic) coupled with inoLab 7110 pH meter (WTW™, Prague, Czech Republic). Titratable acidity was expressed as % malic acid equivalent [29]. Mixed fruits were used as a sample for titration.
2.3. Preparation of the Plant Samples for Analysis of Total Phenolic Content, Total Flavonoids, and Total Antioxidant Capacity
Prior to determination of content of secondary metabolites (phenolic compounds, flavonoids, and antioxidant capacity), methanol extract from fresh fruit material was performed. Five grams of the sample was homogenized with a hand blender in 25 mL 75% methanol. The extract was left to stand for 24 h and then filtered through a filter paper into a 50 mL measuring flask. The filtrate was then adjusted to the line with 75% methanol. Samples were transferred into a 20 mL plastic bottles and kept at −20 °C until the analysis [30].
2.4. Determination of Total Phenolic Content, Total Flavonoids, and Total Antioxidant Capacity
Analyses of all parameters were carried out according to the protocols of Zloch et al. (2004) [31] by using a SPECORD® 50 PLUS spectrophotometer (Analytik, Jena, DE). Total phenolic content was measured after reaction of sample extracts with Folin–Ciocalteu reagent at a wavelength of 765 nm and expressed in milligrams GAE per 100 g FW. Total flavonoid content was determined by using chloride and sodium nitrite and the results were expressed in milligrams CAE per 100 g FW. For determination of total antioxidant activity, the 2,2-diphenyl-1-picrylhydrazyl (DPPH) method was used. This method is based on the decolorizing property of the hydrogen radical of DPPH with hydrogen donors, which are included in phenolic compounds as well. Trolox (6-hydroxy-2.5.7.8-tetramethylchroman-2-carboxylic acid) was used as a standard, and the measurement was performed at 515 nm and then expressed in milligrams TE per 100 g FW.
2.5. Determination of Total Carotenoids
Prior to determination of the carotenoid content, sliced thin fruit sections were dried in a heat chamber FED 400 (Binder, Tuttlingen DE) at 50 °C for 24 h and pulverised in a mill Pulverisette 11 (Fritsch, Weimar, DE). Next, acetone was used to extract the pigments from the samples. Determination of photosynthetically active pigments (carotenoids) was performed with a SPECORD® 50 PLUS spectrophotometer (Analytic Jena AG, Germany) at 440 nm according to Holm (1954) [32]. Total carotenoids were expressed in milligrams per 100 g dry weight (DW).
2.6. Determination of Total Anthocyanin Content (TAC)
The determination of TAC was based on a pH differential method using changes in the colour of samples containing anthocyanins in various pH value environments. Five grams of homogenized whole fruit of peach was mixed with 25 mL of 0.1 M HCl. After 1 h of extraction, the solution was filtered and 0.5 mL of the filtrate was pipetted into 6 test tubes. A 2.5 mL (0.025 mol.L−1) of KCl solution of pH 1 was added into the first 3 test tubes and 2.5 mL (0.4 mol.L−1) solution of C2H3NaO2 of pH 4.5 was added into the remaining 3 test tubes. Prepared rest tubes were measured at wavelengths of 510 nm and 700 nm with a spectrophotometer SPECORD® 50 PLUS (Analytic Jena AG, Germany). The results were expressed in mg.100 g−1 fresh weight (FW).
2.7. Determination of Sugar Content
The soluble solids content was determined using the Abbé refractometer and expressed in weight percentage.
The determination of sugar content was performed by high performance liquid chromatography (HPLC). Juice was squeezed from the fruit and diluted with distilled water at a 1:4 ratio (2 mL juice + 8 mL H2O). The diluted sample was filtered through a microfilter and analysed. A Clarity chromatography station (Watrex, Prague, Czech Republic) with a Polymer IEX Ca_SN8422 column (250 × 8 mm; Watrex, Prague, Czech Republic) was used for making the analysis. The flow rate of the mobile phase (deionized water) was 0.5 mL.min−1, pressure 1.9 MPa, temperature 80 °C. A refractometric detector was used for making the evaluation. Fructose, glucose, sucrose, and sorbitol contents were converted into the fresh weight of plant material and expressed as g sugar per 100 g fruit.
2.8. Colour Analysis
Colour of cleaned skin of 5 fruits was analysed using colorimeter CR-400 (Konica Minolta®, Tokyo, Japan), equipped with D65 illuminant. The over colour and ground colour were distinguished where possible within the analysis. The data were processed by software SpectraMagic NX Lite (Konica Minolta®, Tokyo, Japan). The analysis is based on CIELAB scale. The colour parameters L*, a*, b* are directly measured in terms of standard observed and standard illuminant [33], where parameter L* represents the lightness of the fruit, parameter a* represents the axis in the direction from green to red and parameter b* represents the axis in the direction from blue to yellow. Values were displayed with the mean ± standard deviation. Cylindrical coordinates C*ab and h°ab were calculated from coordinates a* and b* by Equations (1) and (2) [34]:
C*ab = (a*2 + b*2)1/2
h°ab = tan−1 (b*/a*)
C*ab denotes the purity of saturation of the colour [35], which means the higher is the chroma (C*ab) the colour is more intense. Hue angle (h°ab) refers to the colour wheel and is measured in angles [36]. The colour difference ΔE*ab was accomplished for cultivars with measurable ground and over colour. Values were displayed with the mean ± standard deviation of ten replications. Given two colours in the CIELAB colour space, (L*1, a*1, b*1) and (L*2, a*2, b*2), the CIE76 colour difference formula is defined as (3):
ΔE*ab = (ΔL*2 + Δa*2 + Δb*2)1/2
ΔE*ab ≈ 2.3 corresponds to a JND (just noticeable difference) [37].
2.9. Statistical Analysis
Statistical analysis was performed in Statistica 12 (TIBCO, USA) and Microsoft Excel software. Single-factor ANOVA analysis (level of significance α = 0.05) was used for statistical processing and the Tukey HSD test was subsequently used to evaluate the statistical significance of differences between the individually measured values (TAC and chromatic parameters L*, a*, b*). Between colour parameters and TAC, the Spearman’s correlation coefficient ρ was determined using Statistica 12 (TIBCO, USA) and regression function with coefficient of determination R2 were determined using Microsoft Excel.
3. Results
The highest acid content was recorded in the fruit of the varieties ‘Benedicte’ (1.32% malic acid), ‘Helene’ (0.91% malic acid), and ‘Royal Majestic’ (0.85% malic acid). The varieties with the lowest acid content were ‘UFO 3’ (0.25% malic acid), ‘Fidelia’ (0.26% malic acid) and ‘Royal Glory’ (0.26% malic acid, Figure 1). The average value of the test set was 0.59% malic acid. The differences between the varieties were confirmed as statistically highly significant (Table 2).
Significantly, the highest representation of total phenolic compounds was found in fruits of the variety ‘Carolina Belle’ (577.72 mg GAE.100 g−1 FW), then in the variety ‘Krasava’ (334.02 mg GAE.100 g−1 FW, Figure 1), ‘Dixigem’ (285.24 mg GAE.100g−1 FW, Figure 1), and in the variety ‘Benedicte’ (238.09 mg GAE.100 g−1 FW). On the other hand, the lowest values of phenolic compounds content were observed in fruits of ‘Favorita Morettini’ (9.43 mg GAE.100 g−1 FW), ‘Early Redhaven’ (12.90 mg GAE.100 g−1 FW), and ‘Strelec’ (17.39 mg GAE.100 g−1 FW). In the studied set of cultivars, the total phenolic content in fruits ranged from 9.43 to 577 mg GAE.100 g−1 FW. The differences between the values were highly statistically significant (Table 3).
The highest concentration of flavonoids was measured in the fruits of ‘Carolina Belle’ (95.1 mg CAE.100 g−1 FW), ‘Benedicte’ (53.2 mg CAE.100 g−1 FW), and ‘Admiral de Wey’ (50.8 mg CAE.100 g−1 FW). The lowest values were observed in ‘UFO 3’, ‘Favorita Morettini’, ‘Alexandra’ and ‘Candor’ (1.12; 3.37; 4.09 and 5.16 mg CAE.100 g−1 FW). The average flavonoid value in the test set was 22.3 mg CAE.100 g−1 FW. The differences between the varieties were confirmed as statistically highly significant (Table 4).
Using the DPPH (2,2-diphenyl-1-picrylhydrazyl) method, values of antioxidant activity in peach fruits ranging from 136 to 462 mg TE.100 g−1 FW were determined. Specifically, the cultivar ‘Carolina Belle’ (249.08 mg TE.100 g−1 FW) had the highest value. All other varieties analysed showed relatively high values. The results varied within a few units. High values were also found in the fruit of the variety ‘Admiral de Wey’ (280.46 mg TE.100 g−1 FW) and in the variety ‘Dixigem’ (255.61 mg TE.100 g−1 FW). The Czech variety ‘Krasava’ also had high antioxidant capacity (250.07 mg TE.100 g−1 FW). The lowest total antioxidant capacity was measured in the fruits of ‘Favorita Morettini’ (136.15 mg TE.100 g−1 FW) and ‘Candor’ (150.72 mg TE.100 g−1 FW). The differences in the values were highly statistically significant (Table 5).
The average carotenoids content in the fruits of the studied varieties reached 1.67g.100 g−1 DW. The varieties with the highest carotenoids (4.77 mg.100 g−1 DW) include fruits of the variety ‘Romea’ (3.50 mg.100 g−1 DW, Figure 1), followed by fruits of the variety ‘Royal Majestic’ (3.14 mg.100 g−1 DW), ‘Favorita Morettini’ (3.12 mg.100 g−1 DW), and ‘Early Redhaven’ (3.12 mg.100 g−1 DW). On the other hand, the lowest total carotenoids content was determined in the fruits of ‘Krasava’, ‘Fidelia’, and ‘Anita’ (0.05; 0.24 and 0.24 mg.100 g−1 DW). Total carotenoids content was not detected in the cultivars ‘Benedicte’ and ‘Royal Glory’. The differences between the varieties were confirmed as statistically highly significant (Table 6).
High levels of anthocyanins were measured in the fruits of ‘Helene’ (3.74 mg.100 g−1 FW), ‘Royal Majestic’ (2.64 mg.100 g−1 FW), and ‘Favorita Morettini’ (2.13 mg.100 g−1 FW). On the other hand, low values were recorded in fruits of ‘Early Redhaven’, ‘UFO 3’, ‘Dostojnyj’, ‘Strelec’ and ‘Admiral de Wey’ (0.05; 0.05 0.14; 0.18 mg.100 g−1 FW). The average value of total anthocyanins of the tested set of varieties reached 0.70 mg.100 g−1 FW. The differences between the varieties were confirmed as statistically highly significant (Table 7).
In the set of varieties studied, the total soluble solids content of the fruit ranged from 8.3 to 14.7 °Rf. The varieties with the highest content were ‘Royal Majestic’ (14.7 °Rf), followed by ‘Helene’ (13.8 °Rf) and ‘Nerine’ (13.7 °Rf). The lowest values of the evaluated set of varieties were measured for the fruits of the ‘Fénix’ variety (8.3 °Rf, Figure 1), ‘Krasava’ and ‘Romea’, which had the same soluble solids value for both varieties (9.2 °Rf). The differences in the values found were highly statistically significant (Table 8).
The average sucrose, glucose, fructose, and sorbitol contents of the fruit were determined for each variety. The average sucrose content was 9.62 g.100 g−1 FW. The highest sucrose content was measured in the varieties ‘Narjadnyj Nikitskiy’ (16.57 g.100 g−1) and ‘Sonet’ (16.44 g.100 g−1). The lowest contents were observed in the cultivars ‘Alexandra’, ‘Suncrest’(Figure 1), and ‘Iris Rosso’ (4.89, 4.69 and 4.66 g.100 g−1, respectively). The glucose content ranged from 0.74 to 3.67 g.100 g−1. The highest contents were determined in the varieties ‘Sunshine’ (3.67 g.100 g−1) and ‘Admiral de Wey’ (3.50 g.100 g−1). The lowest content was measured in the varieties ‘UFO 3’ (0.82 g.100 g−1) and ‘Nerine’ (0.74 g.100 g−1). The average value of glucose content was 1.94 g.100 g−1. In the studied set of varieties, the total fructose content ranged from 0.48 to 2.39 g.100 g−1, with an average value of 1.37 g.100 g−1. The highest content was measured in the cultivars ‘Sunshine’ and ‘Dixigem’ (2.39 and 2.36 g.100 g−1). The lowest fructose content was observed in the variety ‘UFO 3’ (0.48 g.100 g−1). The average value of alcoholic sugar sorbitol in our study was 0.23 g.100 g−1. The variety ‘Benedicte’ greatly exceeded all other varieties in sorbitol content, with its content being determined at 1.57 g.100 g−1. Very low amounts were measured in the cultivars ‘Lakomyj’, ‘Nerine’, ‘Iris Rosso’, and ‘Alexandra’ (0.09; 0.09; 0.08 and 0.06 g.100 g−1). The differences in the values found were highly statistically significant (Table 9).
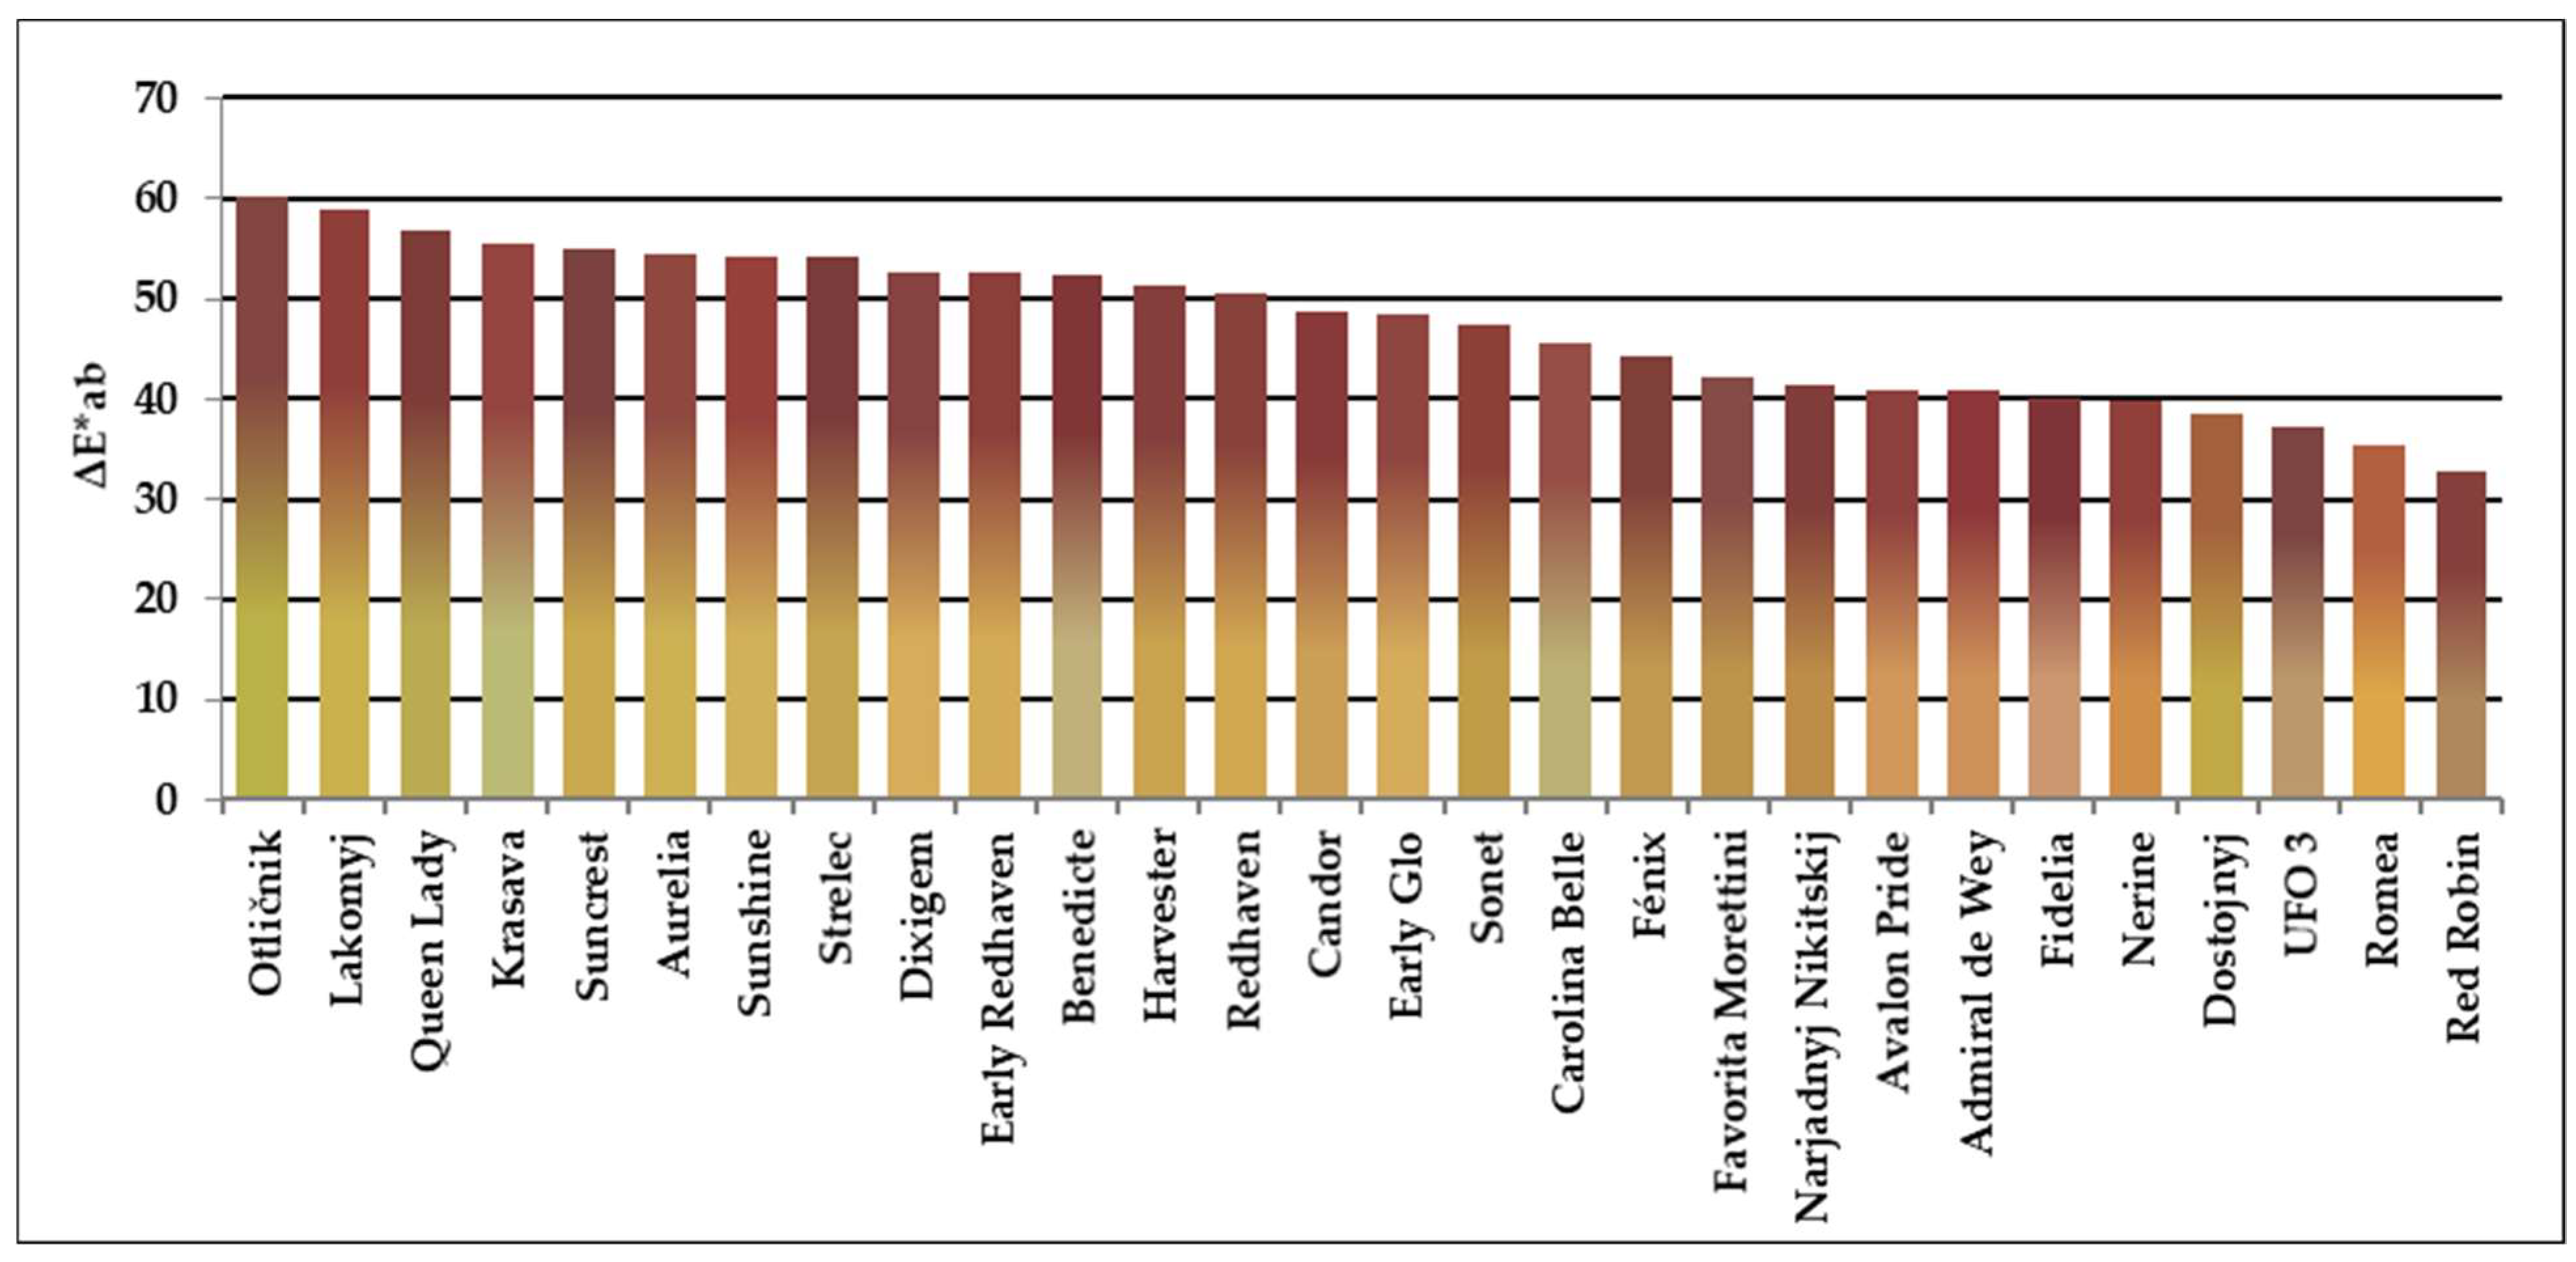
Colorimetric parameters L*, a*, b* for the basic skin colour of the fruit were measured for all varieties. In the varieties ‘Alexandra’, ‘Anita’, ‘Helene’, ‘Iris Rosso’, ‘Royal Glory’ and ‘Royal Majestic’, the skin was completely covered by the blush. The average values of L*, a*, b* are summarised in Table 10. The highest values of L* were found for the basic colour in the varieties ‘Krasava’, ‘Aurelia’, ‘Sunshine’ and for the cheek in the varieties ‘Romea’, ‘Dostojnyj’, ‘Carolina Belle’. In our study the highest value of a* were found for ‘Nerine’, ‘Admiral de Wey’, ‘Avalon Pride’, the lowest value were found for ‘Krasava’, ‘Otličnik’, ‘Carolina Belle’ and ‘Queen Lady’. For chromatic parameter b* the highest values were measured for ‘Romea’, ‘Otličnik’, ‘Lakomyj’ and the lowest values were found for ‘Fidelia’, ‘UFO 3’ and ‘Red Robin’. Colour intensity is represented by the chromatic parameter C*ab, which was determined using the chromatic parameters a* and b*, and its highest values were found for the basic colour of ‘Romea’, ‘Otličnik’, ‘Lakomyj’ and for the cheek colour of ‘Romea’, ‘Sunshine’, ‘Admiral de Wey’. From the measured values for base colour and cheek colour, the greatest colour difference ΔE*ab (Table 11) was found for the cultivars ‘Otličnik’, ‘Lakomyj’, ‘Queen Lady’. These varieties had the richest cheeks when compared to the base colour. On the other hand, the lowest ΔE*ab were found for the varieties ‘Red Robin’, ‘Romea’, ‘UFO 3’, where the cheek almost merged with the base colour. Figure 2 captures the exact colour found in the L*, a*, b* coordinates.
4. Discussion
The acid content of fruit is a key quality parameter and is an important factor in determining the taste of the fruit. Titratable acidity indicates the concentration of organic acids present in the fruit. Peaches have a very low level of organic acids. The total titratable acid content found in our set of varieties ranged from 0.26 to 1.32% malic acid on fresh weight. These values are similar to the results found in many other publications. Scordino et al. (2012) [38] reported TA contents ranging from 0.52–0.86% malic acid in Sicilian yellow flesh peaches on fresh weight. Similar values were also found in the work by Tomás-Barberán et al. (2010) [39], where the contents ranged from 0.53–0.97% malic acid in yellow flesh peaches on fresh weight, and 0.15–0.34% malic acid in white flesh peaches on fresh weight. Gil et al. (2002) [40] investigated the differences between white- and yellow-fleshed peach cultivars grown in California. The average TAC content found in the white-fleshed varieties was 0.22%, and in the yellow-fleshed varieties it was 0.69%.
In a publication by Cantin et al. (2009) [41], the total phenolic content ranged from 12.7 to 71.3 mg GAE.100 g−1 FW, with an average of 36.4 mg GAE.100 g−1 FW. In our selected set of cultivars, the average content reached 122.4 mg GAE.100 g−1 FW. Marinova et al. (2005) [42] investigated the determination of all phenolic compounds in fruit grown in Bulgaria. The total phenolic content in peach fruits was 50.9 mg GAE.100 g−1 FW, and similar values were reached by figs—Ficus carica (59.0 mg GAE.100 g−1 FW). Another publication by Saidani et al. (2017) [43] dealt with the determination of phenolic compounds separately in the peel and in the pulp. In the peel, contents ranging from 88.9 to 277 mg GAE.100 g−1 FW were determined, while in the pulp, contents ranging from 25.1 to 139 mg GAE.100 g−1 FW were determined. Previously, Zhao et al. (2015) [44] monitored the content of total phenolics in selected Chinese peach cultivars, ranging from 4.58 to 12.68 mg gallic acid equivalent (GAE).100 g−1 DW in the peel and from 0.82 to 6.52 mg GAE.100 g−1 DW in the pulp.
The obtained results of total flavonoids content in the tested set of varieties ranged from 1.1 to 95.1 mg CAE.100 g−1 FW. Di Vaio et al. (2015) [45] determined the total flavonoid content, and it ranged from 35.05-58.85 g CAE.kg−1 FW within the test set. In another publication by Cantin et al. (2009) [40], total flavonoid content ranged from 1.8 to 30.9 mg CAE.100 g−1 FW, with an average of 8.8 mg CAE.100 g−1 FW. Marinova et al. (2005) [42] investigated the determination of all phenolic compounds, as well as flavonoids in crops grown in Bulgaria. The total flavonoid content in peach fruits was 15.0 mg CAE.100 g−1 FW; similar values are seen in figs—Ficus carica (20.2 mg CAE.100 g−1 FW) and sweet cherries (19.6 mg CAE.100 g−1 FW). The highest representation of flavonoids was found in this work in blueberries (190.3 mg CAE.100 g−1 FW). Saidani et al. (2017) [43] determined the flavonoid content in the skin of peach fruits to be between 39 and 245 mg CAE.100 g−1 FW, and in the flesh between 8.18 and 112 mg CAE.100 g−1 FW.
Analyses of antioxidant components in products are fast becoming a recognized profile, primarily emphasizing antioxidant capacity as a quality index for many fruits and vegetables. The high phenolic content showed an increased antioxidant capacity in the studied varieties. The average value of antioxidant capacity determined by the DPPH (1-diphenyl-2,2-picrylhydrazyl) method showed values of 205.7 mg TE.100 g−1 FW. The authors of Di Vaio et al. (2015) [45] determined average antioxidant capacity values of 111.1 mg TE.100 g−1 FW in four peach cultivars. Saidani et al. (2017) [43], in a tested set of peach cultivars, determined the antioxidant capacity value in the skin of the fruit ranging from 133 to 401 mg TE.100 g−1 FW, and in the flesh ranging from 22.7 to 194 mg TE.100 g−1 FW. Zhao et al. (2015) [44] found antioxidant capacity contents in Chinese peach cultivars from 6.35 to 19.84 mg trolox equivalent antioxidant capacity (TE).100 g−1 DW in the peel and from 1.05 to 15.01 mg TE.100 g−1 DW in the pulp.
The content of carotenoids (especially β-carotene, zeaxanthin, lutein, neoxanthin) and anthocyanins increases with fruit maturity, largely due to the colouring of the fruit (formation of the cheek). The results obtained for total anthocyanin content in the tested set of cultivars ranged from 0.04 to 3.74 mg.100 g−1 FW. Cantín et al. (2009) [41] monitored the content of total anthocyanins in selected cultivars and found contents ranging between 0.1 and 26.7 mg of C3GE.kg−1 FW (0.1-26.7 mg of cyanidin-3-glucoside equiv. (C3GE) per kg of FW). In another publication by Saidani et al. (2017) [43], they discussed the determination of total anthocyanins separately in the peel and in the pulp. The average anthocyanin content in the peel was 5.53 mg C3GE.100 g−1 FW, while in the pulp the average content was 0.37 mg C3GE.100 g−1 FW. In other research on total anthocyanin content in apricot fruits, Rababah et al. (2011) [46] reported an average anthocyanin content of 2.54 mg.100 g−1 FW, whereas Contessa et al. (2013) [47] reported an anthocyanin content of 0.99 mg C3GE.100 g−1 FW.
The carotenoids content found in the set of cultivars ranged from 0.00 to 4.77 mg.100 g−1 DW. Gil et al. (2002) [40] observed differences in carotenoids content between white- and yellow-skinned peach cultivars. The average carotenoids content found in white-fleshed cultivars was 11.6 μg.100 g−1, while in yellow-fleshed cultivars it was 131.6 μg.100 g−1. Vizzotto et al. (2007) [48] also found higher carotenoids content in genotypes with yellow flesh (0.8 to 3.7 milligrams β-carotene per 100 g tissue) than in peaches with white flesh (0.0 to 0.1 milligrams β-carotene per 100 g tissue).
Soluble solid content (SSC) is an important characteristic of fruit, as it is closely related to consumer satisfaction and how well the fruit is liked. Zhao et al. (2015) [44] evaluated the soluble solid content of different Chinese peach cultivars; their findings ranged from 8.34 to 15.48 °Rf. These results are similar to ours, with values ranging from 8.30 to 14.70 °Rf in our set of cultivars. In another work, Gil et al. (2002) [40] investigated the differences between white- and yellow-fleshed peach cultivars grown in California. The average SSC content found in the white-fleshed varieties was 11.22 °Rf, while in the yellow-fleshed varieties it was 11.90 °Rf. For the Spanish varieties, Legua et al. (2011) [49] found SSC contents between 9.98 and 18.36 °Rf. Tavarini et al. (2008) [50] determined an average SSC value of 12.42 °Rf for Italian varieties.
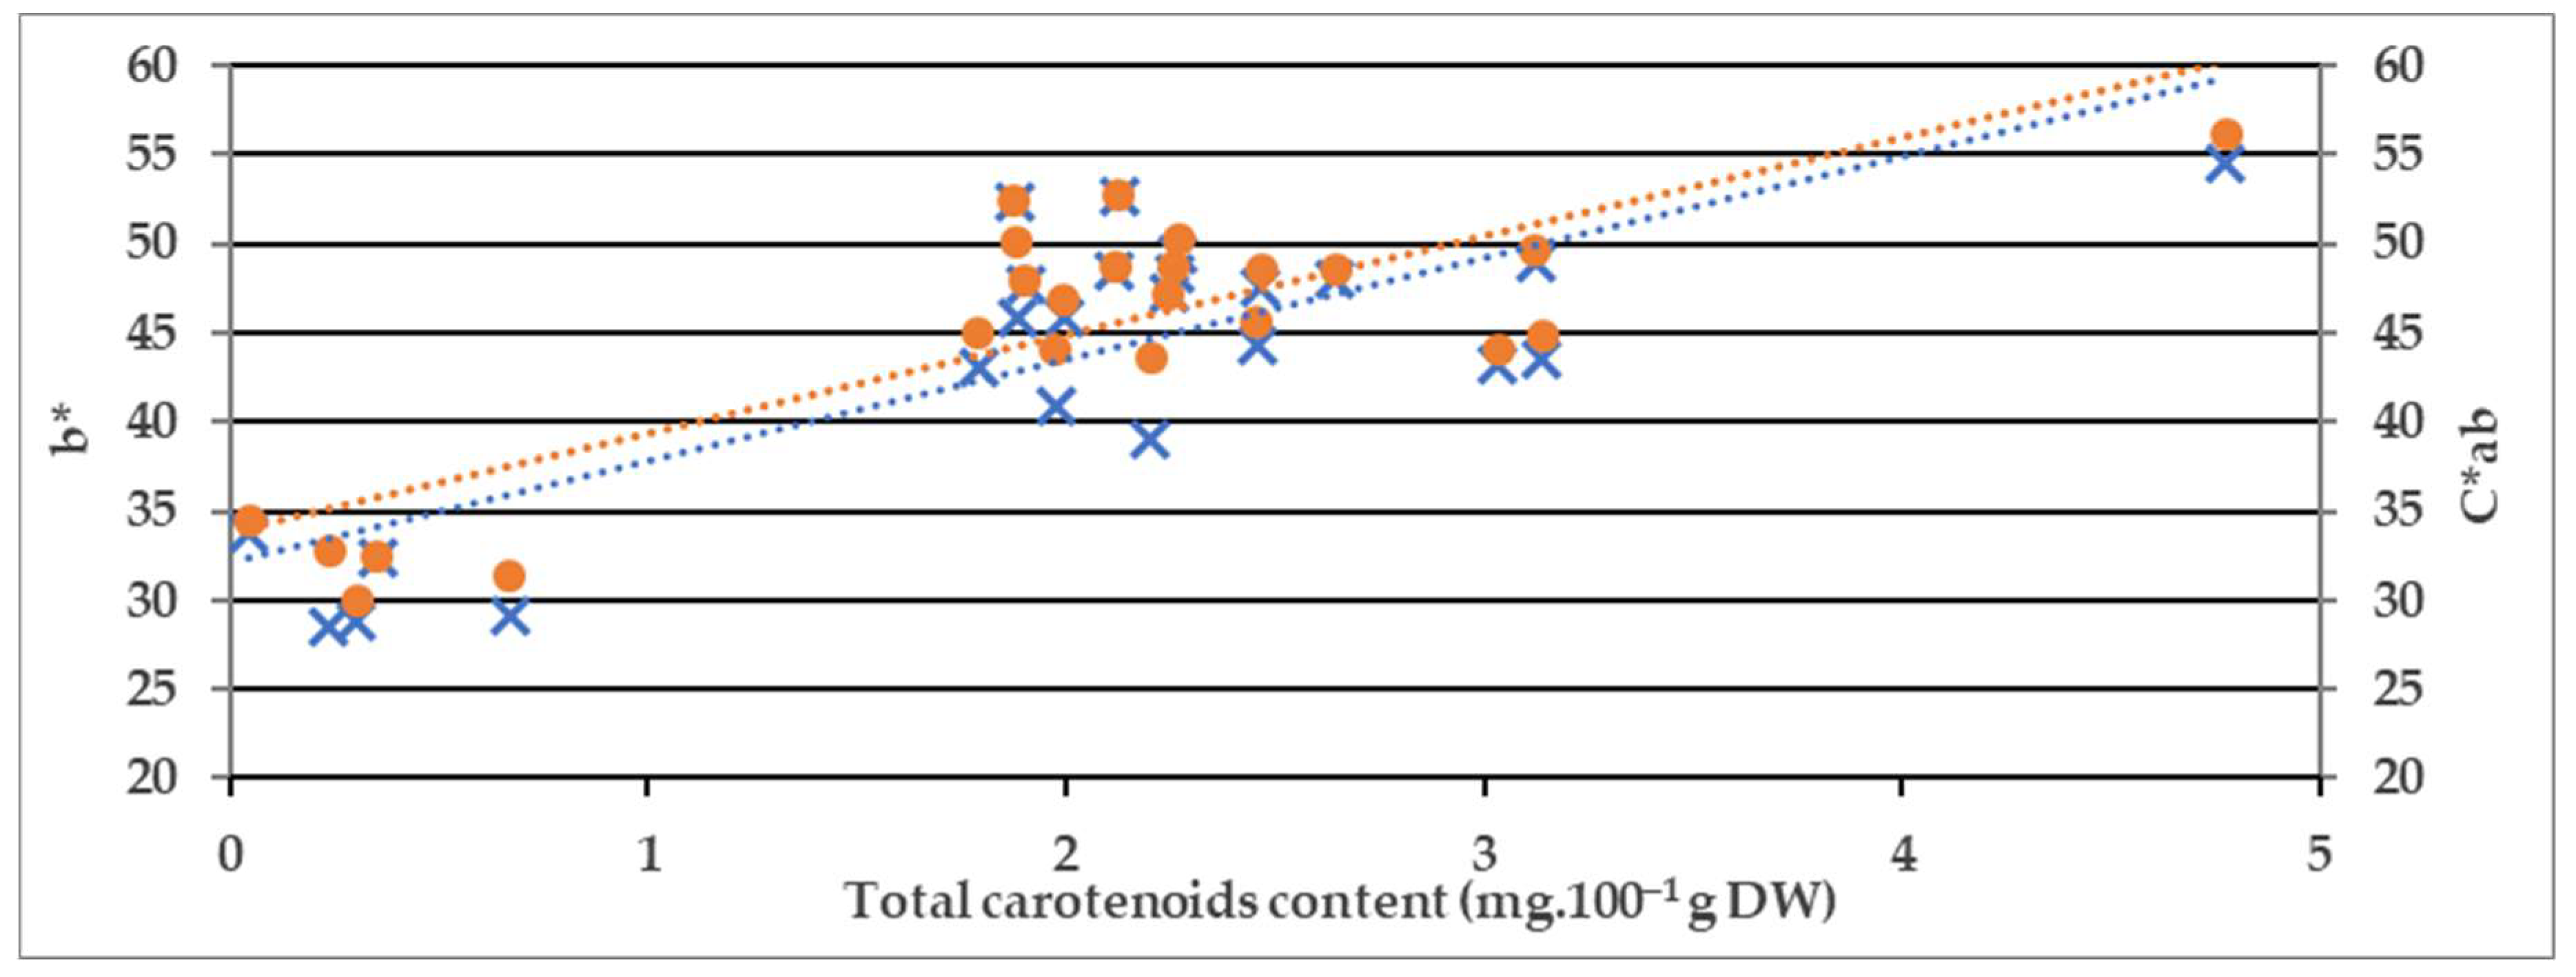
In this study, sucrose, glucose, fructose, and sorbitol were determined as the basic sugars of peaches and there were differences found among the cultivars (Table 10). The mean values of sucrose, glucose, fructose, and sorbitol were 9.62 g.100 g−1, 1.94 g.100 g−1, 1.37 g.100 g−1 and 0.23 g.100 g−1, respectively. These values are very similar to those determined by Forcada et al. (2014) [9]. The values found ranged from 3.5–9.8 g.100 g−1 sucrose, 0.4–1.5 g.100 g−1 glucose, 0.2–1.4 g.100 g−1 fructose, and 0.2–3.5 g.100 g−1 sorbitol. Nowicka et al. (2019) [51] investigated the sugar content of 20 peach cultivars. They determined sucrose content ranging from 3.4–5.4 g.100 g−1, glucose 0.27–0.84 g.100 g−1, fructose 0.41–1.03 g.100 g−1, and sorbitol content ranging from 0.15–0.74 g.100 g−1. Colaric et al. (2005) [13] determined sucrose levels between 46.14-66.92 g.kg−1 in some nectarine and peach cultivars. Cantin et al. (2009) [41] determined a similar sucrose content (47.10–64.00 g.kg−1), and further investigated the determination of glucose (5.60–8.00 g.kg−1) and fructose (6.9–10.3 g.kg−1) in peach and nectarine fruits. Gecer (2020) [52] measured sucrose (5216.3–9122.4 mg.100 g−1), glucose (721.7–1902.1 mg.100 g−1), and fructose (325.7–1048.1 mg.100 g−1) in some peach and nectarine cultivars. Robertson et al. (1990) [53] determined the average sorbitol content in yellow-fleshed cultivars, 0.46% and in white-fleshed cultivars, 0.37%. The colour of the fruit is an important parameter that influences the attractiveness of the fruit to consumers. A colorimetric analysis can also provide information on the degree of ripeness of the fruit. The colour of peaches using CIELAB was measured in studies before [54,55,56,57]. The value of a* has been suggested as colour index maturity [54]. The study was associated with changes of a* with chlorophyl degradation and an increase of anthocyanin content. Because of low values of anthocyanin in most cultivars of peaches, Ferrer et al. (2010) [55] found that changes of chromatic parameter b* can be a good indicator of ripeness of peach fruit. These changes correlated to an increase of carotenoids pigments. In our study the correlation relationship between carotenoids and chromatic parameter b* with a correlation coefficient R = 0.7951 and C* with R = 0.8051 were found (Figure 3). The cultivars ‘Otličnik’ and ‘Aurelia’ were accomplished as outliers and they are not included in the correlations; this can be attributed to insufficient maturity of these two cultivars.
5. Conclusions
Peach fruits have an important specific nutritional status among stone fruits. This means that peaches can serve as a source of sugars, mainly sucrose, as well as phenolics, carotenoids, and anthocyanins, and can also provide valuable antioxidants. The Czech ‘Krasava’ variety was found to be a variety that has a very high content of titratable acids, phenolics, flavonoids, and antioxidant capacity. It can be said that this variety is very interesting from a biochemical point of view and offers a certain potential. Peach consumption represents one of the main fruit incomes during the summer months and is subject to seasonal demand, i.e., the short period of availability in the year. While pome fruits may form the bulk of typical dietary intake during longer periods of the year, peaches are only a seasonal concern.
Author Contributions
Conceptualization, M.M. and E.R.; methodology, M.M. and P.Š.; formal analysis, M.M. and P.Š.; investigation, M.M.; resources, I.O.; data curation, M.M and E.R.; writing—original draft preparation, M.M. and E.R.; writing—review and editing, M.M. and S.E.; supervision, T.N.; funding acquisition, T.N. All authors have read and agreed to the published version of the manuscript.
Funding
This research received external funding from project by activity no. 6.2.10 ref. 51834/2017- MZE-17253, subprogram “National Program of Conservation and Utilization of Plant Genetic Resources and Agrobiodiversity,” which is funded by the Ministry of Agriculture of the Czech Republic.
Informed Consent Statement
Not applicable.
Data Availability Statement
Not applicable.
Acknowledgments
This research used the infrastructure acquired by the project CZ.02.1.01/0.0/0.0/16_017/0002334 Research Infrastructure for Young Scientists, which is co-financed by the Operational Program of Research, Development and Education.
Conflicts of Interest
The authors declare no conflict of interest.
References
- Janick, J.; Paull, R.E. The Encyclopedia of Fruit & Nuts; CABI: Wallingford, UK, 2008; p. 954. [Google Scholar]
- Davidović, S.M.; Veljović, M.S.; Pantelić, M.M.; Baošić, R.M.; Natić, M.M.; Dabić, D.Č.; Pecić, S.P.; Vukosavljević, P.V. Physicochemical, Antioxidant and Sensory Properties of Peach Wine Made from Redhaven Cultivar. J. Agric. Food Chem. 2013, 61, 1357–1363. [Google Scholar] [CrossRef] [PubMed]
- Campbell, O.E.; Padilla-Zakour, O.I. Phenolic and Carotenoid Composition of Canned Peaches (Prunus persica) and Apricots (Prunus armeniaca) as Affected by Variety and Peeling. Food Res. Int. 2013, 54, 448–455. [Google Scholar] [CrossRef]
- Cantin, C.M.; Moreno, M.A.; Gogorcena, Y. Evaluation of the antioxidant capacity, phenolic compounds, and vitamin C content of different peach and nectarine [Prunus persica (L.) Batsch] breeding progenies. J. Agric. Food Chem. 2009, 57, 4586–4592. [Google Scholar] [CrossRef] [PubMed]
- Liu, H.; Cao, J.; Jiang, W. Evaluation and Comparison of Vitamin C, Phenolic Compounds, Antioxidant Properties and Metal Chelating Activity of Pulp and Peel from Selected Peach Cultivars. LWT Food Sci. Technol. 2015, 63, 1042–1048. [Google Scholar] [CrossRef]
- Scalbert, A.; Johnson, I.T.; Saltmarsh, M. Polyphenols: Antioxidants and beyond. Am. J. Clin. Nutr. 2005, 81, 215S–217S. [Google Scholar] [CrossRef] [PubMed]
- Bento, C.; Gonçalves, A.C.; Silva, B.; Silva, L.R. Peach (Prunus persica): Phytochemicals and Health Benefits. Food Rev. Int. 2020, 36, 1–32. [Google Scholar] [CrossRef]
- Remorini, D.; Tavarini, S.; Degl’Innocenti, E.; Loreti, F.; Massai, R.; Guidi, L. Effect of Rootstocks and Harvesting Time on the Nutritional Quality of Peel and Flesh of Peach Fruits. Food Chem. 2008, 110, 361–367. [Google Scholar] [CrossRef] [PubMed]
- Forcada, C.F.I.; Gradziel, T.M.; Gogorcena, Y.; Moreno, M.Á. Phenotypic diversity among local Spanish and foreign peach and nectarine [Prunus persica (L.) Batsch] accessions. Euphytica 2014, 197, 261–277. [Google Scholar] [CrossRef] [Green Version]
- Caniato, F.F.; Galvao, J.C.C.; Finger, F.L.; Ribeiro, R.A.; Miranda, G.V.; Puiatti, M. Study of total soluble sugars, reducing sugars and starch composition in immature kernels of corn cultivars. Rev. Bras. Milho Sorgo. 2004, 3, 38–44. [Google Scholar] [CrossRef]
- Cirilli, M.; Bassi, D.; Ciacciulli, A. Sugars in peach fruit: A breeding perspective. Hortic. Res. 2016, 3, 1–12. [Google Scholar] [CrossRef] [Green Version]
- Sánchez-Moreno, C.; Pascual-Teresa, S.D.; Ancos, B.D.; Cano, M.P. Nutritional Values of Fruits. In Handbook of Fruits and Fruit Processing; John Wiley & Sons, Ltd.: Hoboken, NJ, USA, 2006; p. 29. [Google Scholar]
- Colaric, M.; Veberic, R.; Stampar, F.; Hudina, M. Evaluation of peach and nectarine fruit quality and correlations between sensory and chemical attributes. J. Sci. Food Agric. 2005, 85, 2611–2616. [Google Scholar] [CrossRef]
- Versari, A.; Castellari, M.; Parpinello, G.P.; Riponi, C.; Galassi, S. Characterisation of peach juices obtained from cultivars Redhaven, Suncrest and Maria Marta grown in Italy. Food Chem. 2002, 76, 181–185. [Google Scholar] [CrossRef]
- Iordănescu, O.A.; Alexa, E.; Radulov, I.; Costea, A.; Dobrei, A.; Dobrei, A. Minerals and amino acids in peach (Prunus persica L.) cultivars and hybrids belonging to world germoplasm collection in the conditions of West Romania. Agric. Agric. Sci. Procedia 2015, 6, 145–150. [Google Scholar] [CrossRef] [Green Version]
- Kim, H.R.; Kim, I.D.; Dhungana, S.K.; Kim, M.O.; Shin, D.H. Comparative assessment of physicochemical properties of unripe peach (Prunus persica) and Japanese apricot (Prunus mume). Asian Pac. J. Trop. Biomed. 2014, 4, 97–103. [Google Scholar] [CrossRef] [Green Version]
- Başar, H. Elemental Composition of Various Peach Cultivars. Sci. Hortic. 2006, 107, 259–263. [Google Scholar] [CrossRef]
- Melo, G.W.B.; Sete, P.B.; Ambrosini, V.G.; Freitas, R.F.; Basso, A.; Brunetto, G. Nutritional Status, Yield and Composition of Peach Fruit Subjected to the Application of Organic Compost. Acta Sci. Agron. 2016, 38, 103. [Google Scholar] [CrossRef] [Green Version]
- Valíček, P. Léčivé Rostliny Číny a Vietnamu: (j-z) 2. díl. 1. Vyd; Start: Benešov, Czech Republic, 2010; p. 351. (In Czech) [Google Scholar]
- Li, C.; Wang, M.H. Antioxidant activity of peach blossom extracts. J. Korean Soc. Appl. Biol. Chem. 2011, 54, 46–53. [Google Scholar] [CrossRef]
- Rossato, S.B.; Haas, C.; Raseira, M.D.C.B.; Moreira, J.C.F.; Zuanazzi, J.Â.S. Antioxidant potential of peels and fleshes of peaches from different cultivars. J. Med. Food. 2009, 12, 1119–1126. [Google Scholar] [CrossRef] [PubMed]
- Shin, T.Y.; Park, S.B.; Yoo, J.S.; Kim, I.K.; Lee, H.S.; Kwon, T.K.; Kim, M.K.; Kim, J.C.; Kim, S.H. Anti-allergic inflammatory activity of the fruit of Prunus persica: Role of calcium and NF-κB. Food Chem. Toxicol. 2010, 48, 2797–2802. [Google Scholar] [CrossRef]
- Cevallos-Casals, B.A.; Byrne, D.; Okie, W.R.; Cisneros-Zevallos, L. Selecting new peach and plum genotypes rich in phenolic compounds and enhanced functional properties. Food Chem. 2006, 96, 273–280. [Google Scholar] [CrossRef]
- Lee, C.K.; Park, K.K.; Hwang, J.K.; Lee, S.K.; Chung, W.Y. The extract of Prunus persica flesh (PPFE) attenuates chemotherapy-induced hepatotoxicity in mice. Phytother. Res. 2008, 22, 223–227. [Google Scholar] [CrossRef]
- Lee, C.K.; Park, K.K.; Hwang, J.K.; Lee, S.K.; Chung, W.Y. Extract of Prunus persica flesh (PPFE) improves chemotherapeutic efficacy and protects against nephrotoxicity in cisplatin-treated mice. Phytother. Res. 2009, 23, 999–1005. [Google Scholar] [CrossRef]
- Geng, M.; Li, W.; Yang, R.; Cui, C.; An, H.; Liu, H.; Wang, X. Antioxidant and antiproliferative aktivity (in vitro) of polyphenols from peach blossom. J. Food Agric. Environ. 2013, 11, 429–433. [Google Scholar]
- Noratto, G.; Porter, W.; Byrne, D.; Cisneros-Zevallos, L. Identifying peach and plum polyphenols with chemopreventive potential against estrogen-independent breast cancer cells. J. Agric. Food Chem. 2009, 57, 5219–5226. [Google Scholar] [CrossRef] [PubMed]
- Noratto, G.; Porter, W.; Byrne, D.; Cisneros-Zevallos, L. Polyphenolics from peach (Prunus persica var. Rich Lady) inhibit tumor growth and metastasis of MDA-MB-435 breast cancer cells in vivo. J. Nutri. Biochem. 2014, 25, 796–800. [Google Scholar] [CrossRef]
- Goliáš, J.; Němcová, A. Skladování a zpracování ovoce a zeleniny: (návody do cvičení). 1. vyd.; Mendelova zemědělská a lesnická univerzita v Brně: Brno, Czech Republic, 2009. [Google Scholar]
- Zloch, Z.; Čelakovský, J.; Aujezdská, A. Stanovení Obsahu Polyfenolů a Celkové Antioxidační Kapacity v Potravinách Rostlinného Původu. Závěrečná zpráva o plnění výzkumného projektu podpořeného finančně Nadačním fondem Institutu Danone; (In Czech). Ústav Hygieny Lékařské Fakulty UK Plzeň: Plzeň, Czech Republic, 2004. [Google Scholar]
- Holm, G. Chlorophyll mutations in barley. Acta Agr. Scand. 1954, 4, 457–471. [Google Scholar] [CrossRef]
- Zbíral, J. Analýza Rostlinného Materiálu: Jednotné Pracovní Postupy; Vyd. 2, rozš. A přeprac; (In Czech). Ústřední Kontrolní a Zkušební Ústav Zemědělský: Brno, Czech Republic, 2005. [Google Scholar]
- Lancaster, J.E.; Lister, C.E.; Reay, P.F.; Triggs, C.M. Influence of Pigment Composition on Skin Colour in a Wide Range of Fruit and Vegetables. J. Amer. Soc. Hort. Sci. 1997, 122, 594–598. [Google Scholar] [CrossRef] [Green Version]
- Clydesdale, F.M.; Ahmed, E.M. Colorimetry—Methodology and Applications. CRC Crit. Rev. Food Sci. Nutri. 1978, 10, 243–301. [Google Scholar] [CrossRef] [PubMed]
- Voss, D.H. Relating colourimeter measurement of plant colour to the royal horticultural society colour chart. HortScience 1992, 27, 1256–1260. [Google Scholar] [CrossRef]
- McGuire, R.G. Reporting of objective colour measurements. HortScience 1992, 27, 1254–1255. [Google Scholar] [CrossRef] [Green Version]
- Sharma, G. Digital Color Imaging Handbook; CRC Press: Boca Raton, FL, USA, 2003. [Google Scholar]
- Scordino, M.; Sabatino, L.; Muratore, A.; Belligno, A.; Gagliano, G. Phenolic Characterization of Sicilian Yellow Flesh Peach (Prunus persica L.) Cultivars at Different Ripening Stages. J. Food Qual. 2012, 35, 255–262. [Google Scholar] [CrossRef]
- Tomás-Barberán, F.A.; Gil, M.I.; Cremin, P.; Waterhouse, A.L.; Hess-Pierce, B.; Kader, A.A. HPLC—DAD − ESIMS analysis of phenolic compounds in nectarines, peaches, and plums. J. Agric. Food Chem. 2001, 49, 4748–4760. [Google Scholar] [CrossRef] [PubMed]
- Gil, M.I.; Tomás-Barberán, F.A.; Hess-Pierce, B.; Kader, A.A. Antioxidant capacities, phenolic compounds, carotenoids, and vitamin C contents of nectarine, peach, and plum cultivars from California. J. Agric. Food Chem. 2002, 50, 4976–4982. [Google Scholar] [CrossRef]
- Cantin, C.M.; Gogorcena, Y.; Moreno, M.A. Analysis of phenotypic variation of sugar profile in different peach and nectarine [Prunus persica (L.) Batsch] breeding progenies. J. Sci. Food Agric. 2009, 89, 1909–1917. [Google Scholar] [CrossRef] [Green Version]
- Marinova, D.; Ribarova, F.; Atanassova, M. Total phenolics and total flavonoids in Bulgarian fruits and vegetables. J. Univ. Chem. Technol. Metall. 2005, 40, 255–260. [Google Scholar]
- Saidani, F.; Giménez, R.; Aubert, C.; Chalot, G.; Betrán, J.A.; Gogorcena, Y. Phenolic, sugar and acid profiles and the antioxidant composition in the peel and pulp of peach fruits. J. Food Composit. Anal. 2017, 62, 126–133. [Google Scholar] [CrossRef] [Green Version]
- Zhao, X.; Zhang, W.; Yin, X.; Su, M.; Sun, C.; Li, X.; Chen, K. Phenolic composition and antioxidant properties of different peach [Prunus persica (L.) Batsch] cultivars in China. Int. J. Mol. Sci. 2015, 16, 5762–5778. [Google Scholar] [CrossRef] [Green Version]
- Di Vaio, C.; Marallo, N.; Graziani, G.; Ritieni, A.; Di Matteo, A. Evaluation of fruit quality, bioactive compounds and total antioxidant activity of flat peach cultivars. J. Sci. Food Agric. 2015, 95, 2124–2131. [Google Scholar] [CrossRef]
- Rababah, T.M.; Al-Mahasneh, M.A.; Kilani, I.; Yang, W.; Alhamad, M.N.; Ereifej, K.; Al-u'datt, M. Effect of jam processing and storage on total phenolics, antioxidant activity, and anthocyanins of different fruits. J. Sci. Food Agric. 2011, 91, 1096–1102. [Google Scholar] [CrossRef]
- Contessa, C.; Mellano, M.G.; Beccaro, G.L.; Giusiano, A.; Botta, R. Total antioxidant capacity and total phenolic and anthocyanin contents in fruit species grown in Northwest Italy. Sci. Hort. 2013, 160, 351–357. [Google Scholar] [CrossRef]
- Vizzotto, M.; Cisneros-Zevallos, L.; Byrne, D.H.; Ramming, D.W.; Okie, W.R. Large variation found in the phytochemical and antioxidant activity of peach and plum germplasm. J. Amer. Soc. Hort. Sci. 2007, 132, 334–340. [Google Scholar] [CrossRef] [Green Version]
- Legua, P.; Hernández, F.; Díaz-Mula, H.M.; Valero, D.; Serrano, M. Quality, bioactive compounds, and antioxidant activity of new flat-type peach and nectarine cultivars: A comparative study. J. Food Sci. 2011, 76, C729–C735. [Google Scholar] [CrossRef] [PubMed]
- Tavarini, S.; Degl’Innocenti, E.; Remorini, D.; Massai, R.; Guidi, L. Preliminary characterisation of peach cultivars for their antioxidant capacity. Int. J. Food Sci. Technol. 2008, 43, 810–815. [Google Scholar] [CrossRef]
- Nowicka, P.; Wojdylo, A.; Laskowski, P. Principal component analysis (PCA) of physicochemical compounds’ content in different cultivars of peach fruits, including qualification and quantification of sugars and organic acids by HPLC. Eur. Food Res. Technol. 2019, 245, 929–938. [Google Scholar] [CrossRef] [Green Version]
- Gecer, M.K. Biochemical content in fruits of peach and nectarine cultivars. Turk. J. Agric. For. 2020, 44, 500–505. [Google Scholar] [CrossRef]
- Robertson, J.A.; Horvat, R.J.; Lyon, B.G.; Meredith, F.I.; Senter, S.D.; Okie, W.R. Comparison of quality characteristics of selected yellow-and white-fleshed peach cultivars. J. Food Sci. 1990, 55, 1308–1311. [Google Scholar] [CrossRef]
- Delwiche, M.J.; Baumgardner, R.A. Ground colour as a peach maturity index. J. Am. Soc. Hort. Sci. 1985, 110, 53–57. [Google Scholar]
- Ferrer, A.; Remón, S.; Negueruela, A.I.; Oria, R. Changes during the ripening of the very late season Spanish peach cultivar Calanda Feasibility of using CIELAB coordinates as maturity indices. Sci. Hortic. 2005, 105, 435–446. [Google Scholar] [CrossRef]
- Pinto, C.; Reginato, G.; Shinya, P.; Mesa, K.; Díaz, M.; Atenas, C.; Infante, R. Skin color and chlorophyll absorbance: Indices for establishing a harvest date on non-melting peach. Sci. Hortic. 2015, 195, 231–236. [Google Scholar] [CrossRef]
- Cáceres, D.; Díaz, M.; Shinya, P.; Infante, R. Assessment of peach internal flesh browning through colorimetric measures. Postharvest Biol. Technol. 2016, 111, 48–52. [Google Scholar] [CrossRef]
Figure 1.
The photos of some cultivars obtained in this study.

Figure 2.
Values of ΔE*ab of individual peach cultivars. The ground colour is shown in the lower part of the column, and over colour is shown in the upper part according to the measured coordinates L*, a*, b*.
Figure 2.
Values of ΔE*ab of individual peach cultivars. The ground colour is shown in the lower part of the column, and over colour is shown in the upper part according to the measured coordinates L*, a*, b*.

Figure 3.
Relationship between b*, C*ab, and total carotenoids content (TCC) in peach cultivars. Blue points represent correlation between b* and TCC, orange points represent correlation between C*ab and TCC.
Figure 3.
Relationship between b*, C*ab, and total carotenoids content (TCC) in peach cultivars. Blue points represent correlation between b* and TCC, orange points represent correlation between C*ab and TCC.


Table 1.
The cultivars obtained in this study and their flesh colour, fruit type, and origin.
| Cultivars | Flesh Colour | Fruit Type | Origin | Cultivars | Flesh Colour | Fruit Type | Origin |
|---|---|---|---|---|---|---|---|
| Admiral de Wey | Yellow | Peach | USA | Iris Rosso | White | peach | Italy |
| Alexandra | White | Peach | USA | Krasava | Creamy | peach | Czech Republic |
| Anita | White | Peach | USA | Lakomyj | Yellow | peach | Yalta, Crimea |
| Aurelia | Yellow | Peach | Italy | Narjadnyj Nikitskij | Yellow | peach | Yalta, Crimea |
| Avalon Pride | Yellow | Peach | USA | Nerine | Yellow | peach | USA |
| Benedicte | Creamy | Peach | France | Otličnik | Yellow | peach | Yalta, Crimea |
| Candor | Yellow | Peach | USA | Queen Lady | Yellow | peach | USA |
| Carolina Belle | White | Peach | USA | Red Robin | White | peach | USA |
| Dixigem | Yellow | Peach | USA | Redhaven | Yellow | peach | USA |
| Dostojnyj | Yellow | Peach | Yalta, Crimea | Romea | Yellow | cling | Italy |
| Early Glo | Yellow | Peach | USA | Royal Glory | Yellow | peach | USA |
| Early Redhaven | Yellow | Peach | USA | Royal Majestic | Yellow | peach | USA |
| Favorita Morettini | Yellow | Peach | Italy | Sonet | Yellow | peach | Yalta, Crimea |
| Fénix | Yellow | Peach | Slovakia | Strelec | Yellow | peach | Yalta, Crimea |
| Fidelia | White | Peach | USA | Suncrest | Yellow | peach | USA |
| Harvester | Yellow | Peach | USA | Sunshine | Yellow | peach | USA |
| Helene | White | Peach | USA | UFO 3 | White | peento | Italy |
Table 2.
The total content of titratable acids in peach cultivars. The data are displayed as the mean ± standard deviation of three replications; a–p refer to the grouping based on the Tukey HSD test.
Table 2.
The total content of titratable acids in peach cultivars. The data are displayed as the mean ± standard deviation of three replications; a–p refer to the grouping based on the Tukey HSD test.
| Cultivars | Titratable Acidity [%] | Cultivars | Titratable Acidity [%] |
|---|---|---|---|
| Admiral de Wey | 0.44 ± 0.01 b,c | Iris Rosso | 0.676 ± 0.009 j,k,l,m |
| Alexandra | 0.452 ± 0.004 b,c | Krasava | 0.84 ± 0.02 n |
| Anita | 0.44 ± 0.01 b,c | Lakomyj | 0.591 ± 0.007 f,g,h |
| Aurelia | 0.643 ± 0.004 i,j | Narjadnyj Nikitskij | 0.513 ± 0.002 d |
| Avalon Pride | 0.61 ± 0.01 g,h,i | Nerine | 0.450 ± 0.002 b,c |
| Benedicte | 1.32 ± 0.04 p | Otličnik | 0.533 ± 0.002 d,e,f |
| Candor | 0.58 ± 0.01 f,g | Queen Lady | 0.636 ± 0.004 h,i,j |
| Carolina Belle | 0.691 ± 0.006 k,l,m | Red Robin | 0.72 ± 0.01 m |
| Dixigem | 0.573 ± 0.005 e,f,g | Redhaven | 0.53 ± 0.05 d,e |
| Dostojnyj | 0.415 ± 0.005 b | Romea | 0.562 ± 0.009 e,f,g |
| Early Glo | 0.463 ± 0.006 c | Royal Glory | 0.264 ± 0.006 a |
| Early Redhaven | 0.428 ± 0.006 b,c | Royal Majestic | 0.850 ± 0.003 n |
| Favorita Morettini | 0.645 ± 0.006 i,j,k | Sonet | 0.564 ± 0.005 e,f,g |
| Fénix | 0.655 ± 0.001 j,k | Strelec | 0.712 ± 0.006 l,m |
| Fidelia | 0.26 ± 0.01 a | Suncrest | 0.55 ± 0.03 d,e,f |
| Harvester | 0.712 ± 0.001 l,m | Sunshine | 0.668 ± 0.007 j,k,l |
| Helene | 0.910 ± 0.008 o | UFO 3 | 0.25 ± 0.02 a |
Table 3.
Total phenolic content in peach cultivars. The data are displayed as the mean ± standard deviation of three replications; a–w refer to the grouping based on the Tukey HSD test.
Table 3.
Total phenolic content in peach cultivars. The data are displayed as the mean ± standard deviation of three replications; a–w refer to the grouping based on the Tukey HSD test.
| Cultivars | Total Phenolic Content [mg GAE.100 g−1] | Cultivars | Total Phenolic Content [mg GAE.100 g−1] |
|---|---|---|---|
| Admiral de Wey | 104.4 ± 0.4 m | Iris Rosso | 103.4 ± 0.9 m |
| Alexandra | 19 ± 1 c,d | Krasava | 334 ± 2 v |
| Anita | 44.6 ± 0.4 f | Lakomyj | 18.4 ± 0.4 b,c |
| Aurelia | 139.3 ± 0.7 o | Narjadnyj Nikitskij | 66.7 ± 0.6 h |
| Avalon Pride | 162.2 ± 0.8 q | Nerine | 115 ± 2 n |
| Benedicte | 238 ± 1 t | Otličnik | 73 ± 2 i |
| Candor | 54.8 ± 0.3 g | Queen Lady | 151.2 ± 0.7 p |
| Carolina Belle | 577 ± 2 w | Red Robin | 65.6 ± 0.4 h |
| Dixigem | 285.2 ± 0.4 u | Redhaven | 193 ± 7 r |
| Dostojnyj | 110.5 ± 0.3 n | Romea | 72.8 ± 0.3 i |
| Early Glo | 47.0 ± 0.2 f | Royal Glory | 78 ± 4 i,j |
| Early Redhaven | 12.9 ± 0.3 a,b | Royal Majestic | 95 ± 3 l |
| Favorita Morettini | 9.4 ± 0.3 a | Sonet | 34.0 ± 0.4 e |
| Fénix | 80 ± 1 j | Strelec | 17.39 ± 0.04 b,c |
| Fidelia | 86.3 ± 0.9 k | Suncrest | 197 ± 2 r |
| Harvester | 203.0 ± 0.6 s | Sunshine | 195.0 ± 0.6 r |
| Helene | 152.0 ± 0.5 p | UFO 3 | 25 ± 2 d |
Table 4.
Total flavonoid content in peach cultivars. The data are displayed as the mean ± standard deviation of three replications; a–v refer to the grouping based on the Tukey HSD test.
Table 4.
Total flavonoid content in peach cultivars. The data are displayed as the mean ± standard deviation of three replications; a–v refer to the grouping based on the Tukey HSD test.
| Cultivars | Flavonoids [mg CAE.100 g−1] | Cultivars | Flavonoids [mg CAE.100 g−1] |
|---|---|---|---|
| Admiral de Wey | 50.8 ± 0.3 t | Iris Rosso | 12 ± 1 h,i |
| Alexandra | 4.1 ± 0.5 b,c | Krasava | 45.1 ± 0.5 s |
| Anita | 27.7 ± 0.2 n | Lakomyj | 10.6± 0.1 g,h |
| Aurelia | 18.0 ± 0.2 k | Narjadnyj Nikitskij | 31.8 ± 0.1 p |
| Avalon Pride | 24.2 ± 0.4 m | Nerine | 15.0 ± 0.1 j |
| Benedicte | 53.2 ± 0.5 u | Otličnik | 9.60 ± 0.09 f,g |
| Candor | 5.16 ± 0.06 c | Queen Lady | 20.1 ± 0.1 l |
| Carolina Belle | 95.1 ± 0.8 v | Red Robin | 34.1 ± 0.2 q |
| Dixigem | 35.6 ± 0.2 r | Redhaven | 24.5 ± 0.2 m |
| Dostojnyj | 12.7 ± 0.1 i | Romea | 8.2 ± 0.1 d,e |
| Early Glo | 27.4 ± 0.8 n | Royal Glory | 9.5 ± 0.7 e,f,g |
| Early Redhaven | 8.68 ± 0.09 d,e,f | Royal Majestic | 10.0 ± 0.7 g |
| Favorita Morettini | 3.4 ± 0.3 b | Sonet | 14.8 ± 0.2 j |
| Fénix | 7.55 ± 0.08 d | Strelec | 11.8 ± 0.2 h,i |
| Fidelia | 10.0 ± 0.3 g | Suncrest | 46.1 ± 0.3 s |
| Harvester | 23.3 ± 0.1 m | Sunshine | 30.20 ± 0.09 o |
| Helene | 18.4 ± 0.4 k | UFO 3 | 1.12 ± 0.02 a |
Table 5.
Antioxidant activity in peach cultivars. The data are displayed as the mean ± standard deviation of three replications; a–z refer to the grouping based on Tukey HSD test.
Table 5.
Antioxidant activity in peach cultivars. The data are displayed as the mean ± standard deviation of three replications; a–z refer to the grouping based on Tukey HSD test.
| Cultivars | Antioxidant Activity [mg.100 g−1] | Cultivars | Antioxidant Activity [mg.100 g−1] |
|---|---|---|---|
| Admiral de Wey | 280.5 ± 0.2 y | Iris Rosso | 184.59 ± 0.09 k |
| Alexandra | 184.09 ± 0.02 k | Krasava | 250.1 ± 0.3 w |
| Anita | 230.9 ± 0.2 u | Lakomyj | 178.20 ± 0.07 j |
| Aurelia | 203.44 ± 0.09 p | Narjadnyj Nikitskij | 211.48 ± 0.09 s |
| Avalon Pride | 184.54 ± 0.08 k | Nerine | 204.4 ± 0.1 q |
| Benedicte | 200.52 ± 0.08 o | Otličnik | 188.07 ± 0.04 l |
| Candor | 150.72 ± 0.06 b | Queen Lady | 210.7 ± 0.1 s |
| Carolina Belle | 462.41 ± 0.84 z | Red Robin | 206.9 ± 0.1 r |
| Dixigem | 256 ± 1 x | Redhaven | 233.1 ± 0.2 v |
| Dostojnyj | 175.11 ± 0.05 h | Romea | 169.16 ± 0.06 e |
| Early Glo | 220.1 ± 0.1 t | Royal Glory | 165.0 ± 0.3 c |
| Early Redhaven | 164.53 ± 0.06 c | Royal Majestic | 199.84 ± 0.05 o |
| Favorita Morettini | 136 ± 0 a | Sonet | 176.8 ± 0.1 i |
| Fénix | 166.76 ± 0.03 d | Strelec | 195.18 ± 0.05 n |
| Fidelia | 191.05 ± 0.07 m | Suncrest | 231.07 ± 0.06 u |
| Harvester | 203.9 ± 0.1 p,q | Sunshine | 233.9 ± 0.2 v |
| Helene | 173.5 ± 0.1 g | UFO 3 | 172.01 ± 0.05 f |
Table 6.
Total carotenoids in peach cultivars. The data are displayed as the mean ± standard deviation of three replications; a–j refer to the grouping based on the Tukey HSD test.
Table 6.
Total carotenoids in peach cultivars. The data are displayed as the mean ± standard deviation of three replications; a–j refer to the grouping based on the Tukey HSD test.
| Cultivars | Carotenoids [mg.100 g−1] | Cultivars | Carotenoids [mg.100 g−1] |
|---|---|---|---|
| Admiral de Wey | 2.20 ± 0.04 d,e,f,g | Iris Rosso | 0.40 ± 0.01 a,b |
| Alexandra | 0.45 ± 0.04 a,b | Krasava | 0.05 ± 0.59 a |
| Anita | 0.24 ± 0.02 a,b | Lakomyj | 2.13 ± 0.02 d,e,f |
| Aurelia | 1.1 ± 0.2 c | Narjadnyj Nikitskij | 1.8 ± 0.6 d |
| Avalon Pride | 2.0 ± 0.1 d,e | Nerine | 1.88 ± 0.06 d |
| Benedicte | * | Otličnik | 0.56 ± 0.01 b |
| Candor | 2.46 ± 0.03 e,f,g | Queen Lady | 2.24 ± 0.03 d,e,f,g |
| Carolina Belle | 0.36 ± 0.02 a,b | Red Robin | 0.67 ± 0.03 b,c |
| Dixigem | 2.47 ± 0.04 f,g | Redhaven | 2.27 ± 0.05 d,e,f,g |
| Dostojnyj | 1.88 ± 0.04 d | Romea | 4.8 ± 0.2 j |
| Early Glo | 2.0 ± 0.01 d,e,f | Royal Glory | * |
| Early Redhaven | 3.12 ± 0.01 h,i | Royal Majestic | 3.51 ± 0.05 i |
| Favorita Morettini | 3.14 ± 0.06 i | Sonet | 2.26 ± 0.05 d,e,f,g |
| Fénix | 3.03 ± 0.04 h,i | Strelec | 1.904 ± 0.009 d |
| Fidelia | 0.24 ± 0.06 a,b | Suncrest | 2.300 ± 0.003 a,b |
| Harvester | 2.64 ± 0.04 g,h | Sunshine | 2.12 ± 0.02 d,e,f |
| Helene | 0.31 ± 0.03 a,b | UFO 3 | 0.30 ± 0.03 a,b |
* Not measured.
Table 7.
Total anthocyanin content (TAC) in peach cultivars. The data are displayed as the mean ± standard deviation of three replications; a–p refer to the grouping based on the Tukey HSD test.
Table 7.
Total anthocyanin content (TAC) in peach cultivars. The data are displayed as the mean ± standard deviation of three replications; a–p refer to the grouping based on the Tukey HSD test.
| Cultivars | Total Anthocyanin Content [mg.100 g−1] | Cultivars | Total Anthocyanin Content [mg.100 g−1] |
|---|---|---|---|
| Admiral de Wey | 0.2 ± 0.4 a,b,c,d,e | Iris Rosso | 1.13 ± 0.08 j,k,l |
| Alexandra | 1.4 ± 0.3 l,m | Krasava | * |
| Anita | 1.65 ± 0.06 m | Lakomyj | * |
| Aurelia | 0.63 ± 0.06 f,g,h,i | Narjadnyj Nikitskij | 0.5 ± 0.1 c,d,e,f,g,h |
| Avalon Pride | 1.2 ± 0.2 k,l,m | Nerine | 0.47 ± 0.06 c,d,e,f,g,h |
| Benedicte | * | Otličnik | * |
| Candor | 0.26 ± 0.07 a,b,c,d,e,f | Queen Lady | 0.58 ± 0.06 e,f,g,h,i |
| Carolina Belle | 0.95 ± 0.03 i,j,k | Red Robin | 0.56 ± 0.04 d,e,f,g,h,i |
| Dixigem | 0.5 ± 0.1 c,d,e,f,g,h | Redhaven | * |
| Dostojnyj | 0.14 ± 0.04 a,b,c | Romea | * |
| Early Glo | 0.9 ± 0.3 h,i,j,k | Royal Glory | 1.3 ± 0.2 k,l,m |
| Early Redhaven | 0.05 ± 0.03 a,b | Royal Majestic | 2.6 ± 0.1 o |
| Favorita Morettini | 2.13 ± 0.08 n | Sonet | 0.815 ± 0.003 g,h,i,j |
| Fénix | 0.37 ± 0.03 a,b,c,d,e,f | Strelec | 0.17 ± 0.03 a,b,c,d |
| Fidelia | 0.55 ± 0.07 d,e,f,g,h,i | Suncrest | 0.4 ± 0.1 b,c,d,e,f,g |
| Harvester | 0.2 ± 0.1 a,b,c,d,e,f | Sunshine | 0.38 ± 0.05 a,b,c,d,e,f |
| Helene | 3.7 ± 0.2 p | UFO 3 | 0.05 ± 0.06 a,b |
* Not measured.
Table 8.
Soluble solid content (SSC) in peach cultivars. The data are displayed as the mean ± standard deviation of three replications; a–k refer to the grouping based on Tukey HSD test.
Table 8.
Soluble solid content (SSC) in peach cultivars. The data are displayed as the mean ± standard deviation of three replications; a–k refer to the grouping based on Tukey HSD test.
| Cultivars | Soluble Solid Content [°Rf] | Cultivars | Soluble Solid Content [°Rf] |
|---|---|---|---|
| Admiral de Wey | 10.7 ± 0.6 b,c,d | Iris Rosso | 12.5 ± 0.5 d,e,f,g,h,i |
| Alexandra | 10.2 ± 0.3 a,b | Krasava | 12.2 ± 0.3 c,d,e,f,g,h,i |
| Anita | 11.8 ± 0.8 b,c,d,e,f,g,h | Lakomyj | 12.3 ± 0.3 d,e,f,g,h,i |
| Aurelia | 12.2 ± 0.3 c,d,e,f,g,h,i | Narjadnyj Nikitskij | 13.5 ± 0.5 g,h,i,j |
| Avalon Pride | 11.30 ± 1.04 b,c,d,e,f | Nerine | 13.7 ± 0.8 h,i,j |
| Benedicte | 15.7 ± 0.3 k | Otličnik | 12.0 ± 0.5 b,c,d,e,f,g,h,i |
| Candor | 12.3 ± 0.3 d,e,f,g,h,i | Queen Lady | 11.0 ± 0.9 b,c,d,e |
| Carolina Belle | 11.8 ± 0.3 b,c,d,e,f,g,h | Red Robin | 10.8 ± 0.8 b,c,d |
| Dixigem | 11.8 ± 0.3 b,c,d,e,f,g,h | Redhaven | 13 ± 1 e,f,g,h,i,j |
| Dostojnyj | 13.2 ± 0.3 f,g,h,i,j | Romea | 11.8 ± 0.8 b,c,d,e,f,g,h |
| Early Glo | 10.3 ± 0.3 b,c | Royal Glory | 13.3 ± 0.6 g,h,i,j |
| Early Redhaven | 11.7 ± 0.3 b,c,d,e,f,g | Royal Majestic | 14.7 ± 0.3 j,k |
| Favorita Morettini | 11.8 ± 0.8 b,c,d,e,f,g,h | Sonet | 13.5 ± 0.5 g,h,i,j |
| Fénix | 8.3 ± 0.5 a | Strelec | 12.8 ± 0.3 e,f,g,h,i,j |
| Fidelia | 12.1 ± 0.5 c,d,e,f,g,h,i | Suncrest | 13.8 ± 0.8 i,j,k |
| Harvester | 12.2 ± 0.3 c,d,e,f,g,h,i | Sunshine | 11.2 ± 0.3 b,c,d,e |
| Helene | 13.8 ± 0.3 i,j,k | UFO 3 | 10.8 ± 0.3 b,c,d |
Table 9.
Sugars in peach cultivars. The data are displayed as the mean ± standard deviation of three replications; a–p refer to the grouping based on the Tukey HSD test.
Table 9.
Sugars in peach cultivars. The data are displayed as the mean ± standard deviation of three replications; a–p refer to the grouping based on the Tukey HSD test.
| Cultivars | Sucrose (g.100 g−1) | Glucose (mg.100 g−1) | Fructose (mg.100 g−1) | Sorbitol (g.100 g−1) |
|---|---|---|---|---|
| Admiral de Wey | 14.6 ± 0.2 m,n | 3.5 ± 0.2 j,k | 2.22 ± 0.08 j,k | 0.18 ± 0.05 d,e,f,g,h,i,j |
| Alexandra | 4.9 ± 0.1 a,b | 1.24 ± 0.06 a,b,c,d | 0.92 ± 0.04 b,c,d,e | 0.055 ± 0.002 a |
| Anita | 12.2 ± 0.6 k | 2.8 ± 0.4 g,h | 2.24 ± 0.05 j,k | 0.17 ± 0.02 c,d,e,f,g,h,i,j |
| Aurelia | 6.6 ± 0.1 c,d,e | 1.3 ± 0.1 a,b,c,d | 0.99 ± 0.02 b,c,d,e | 0.151 ± 0.007 b,c,d,e,f,g,h |
| Avalon Pride | 7.22 ± 0.07 c,d,e,f,g,h | 1.71 ± 0.06 d,e | 1.12 ± 0.05 b,c,d,e,f | 0.16 ± 0.02 b,c,d,e,f,g,h,i |
| Benedicte | 8.06 ± 0.04 f,g,h,i | 3.37 ± 0.03 i,j,k | 1.9 ± 0.1 i,j | 1.57 ± 0.03 o |
| Candor | 7.0 ± 0.3 c,d,e,f,g | 1.22 ± 0.03 a,b,c,d | 1.0 ± 0.1 b,c,d,e | 0.12 ± 0.02 a,b,c,d,e |
| Carolina Belle | 8.09 ± 0.06 g,h,i | 2.288 ± 0.007 f,g | 1.4 ± 0.2 f,g,h | 0.28 ± 0.02 k,l,m |
| Dixigem | 15.3 ± 0.3 m,n,o,p | 3.4 ± 0.1 k | 2.36 ± 0.05 k | 0.29 ± 0.02 k,l,m |
| Dostojnyj | 16 ± 1 n,o,p | 2.7 ± 0.7 f,g,h | 1.85 ± 0.09 h,i,j | 0.17 ± 0.07 c,d,e,f,g,h,i,j |
| Early Glo | 6.80 ± 0.08 c,d,e,f | 1.31 ± 0.07 b,c,d | 1.03 ± 0.04 b,c,d,e | 0.114 ± 0.002 a,b,c,d,e |
| Early Redhaven | 13.09 ± 0.05 k,l | 2.393 ± 0.006 f,g | 1.7 ± 0.1 g,h,i | 0.13 ± 0.01 a,b,c,d,e,f |
| Favorita Morettini | 15.57 ± 0.03 n,o,p | 2.72 ± 0.02 f,g,h | 1.45 ± 0.01 f,g,h | 0.21 ± 0.01 f,g,h,i,j,k |
| Fénix | 6.11 ± 0.09 b,c | 1.20 ± 0.02 a,b,c,d | 0.80 ± 0.01 a,b | 0.128 ± 0.002 a,b,c,d,e,f |
| Fidelia | 7.86 ± 0.05 e,f,g,h,i | 1.38 ± 0.03 b,c,d | 1.32 ± 0.05 e,f,g | 0.28 ± 0.01 k,l,m |
| Harvester | 8.8 ± 0.2 i,j | 1.71 ± 0.05 d,e | 1.1 ± 0.1 b,c,d,e,f | 0.23 ± 0.03 h,i,j,k |
| Helene | 7.1 ± 0.5 c,d,e,f,g,h | 1.12 ± 0.02 a,b,c | 0.90 ± 0.03 b,c,d | 0.24 ± 0.01 i,j,k,l |
| Iris Rosso | 4.7 ± 0.3 a | 1.4 ± 0.4 c,d | 1.0 ± 0.1 b,c,d,e | 0.077 ± 0.003 a,b |
| Krasava | 6.6 ± 0.3 c,d,e | 1.4 ± 0.2 c,d | 1.25 ± 0.07 c,d,e,f | 0.22 ± 0.01 g,h,i,j,k |
| Lakomyj | 7.03 ± 0.03 c,d,e,f,g,h | 1.26 ± 0.04 a,b,c,d | 0.9 ± 0.2 a,b,c | 0.092 ± 0.004 a,b,c,d |
| Narjadnyj Nikitskij | 16.6 ± 0.3 p | 2.9 ± 0.2 g,h,i | 2.0 ± 0.4 i,j,k | 0.16 ± 0.02 b,c,d,e,f,g,h,i |
| Nerine | 7.3 ± 0.3 c,d,e,f,g,h | 0.740 ± 0.005 a | 0.90 ± 0.06 b,c,d | 0.087 ± 0.005 a,b,c |
| Otličnik | 12.83 ± 0.05 k,l | 2.16 ± 0.08 e,f | 1.69 ± 0.01 g,h,i | 0.181 ± 0.002 e,f,g,h,i,j |
| Queen Lady | 14.1 ± 0.5 l,m | 3.1 ± 0.3 h,i,j,k | 2.0 ± 0.2 i,j,k | 0.33 ± 0.09 l,m |
| Red Robin | 7.621 ± 0.004 d,e,f,g,h,i | 1.47 ± 0.03 c,d | 0.9 ± 0.1 b,c,d,e | 0.2 ± 0.0 b,c,d,e,f,g,h |
| Redhaven | 8.73 ± 0.03 i,j | 1.56 ± 0.04 c,d | 1.11 ± 0.04 b,c,d,e,f | 0.138 ± 0.001 a,b,c,d,e,f,g |
| Romea | 9.7 ± 0.2 j | 1.57 ± 0.03 c,d | 1.14 ± 0.09 b,c,d,e,f | 0.144 ± 0.009 b,c,d,e,f,g,h |
| Royal Glory | 7.39 ± 0.08 c,d,e,f,g,h | 1.462 ± 0.003 c,d | 1.2 ± 0.1 c,d,e,f | 0.21 ± 0.03 f,g,h,i,j,k |
| Royal Majestic | 8.3 ± 0.7 h,i | 1.3 ± 0.1 b,c,d | 1.1 ± 0.3 b,c,d,e,f | 0.44 ± 0.05 n |
| Sonet | 16 ± 1 o,p | 3.1 ± 0.4 h,i,j | 2.0 ± 0.2 i,j,k | 0.25 ± 0.02 j,k,l |
| Strelec | 6.5 ± 0.3 c,d | 1.14 ± 0.04 a,b,c,d | 0.86 ± 0.08 a,b,c | 0.144 ± 0.007 b,c,d,e,f,g,h |
| Suncrest | 4.7 ± 0.1 a | 1.50 ± 0.05 c,d | 1.30 ± 0.03 d,e,f,g | 0.124 ± 0.002 a,b,c,d,e,f |
| Sunshine | 15.3 ± 0.1 m,n,o | 3.67 ± 0.03 k | 2.4 ± 0.1 k | 0.34 ± 0.02 m |
| UFO 3 | 8.19 ± 0.03 g,h,i | 0.819 ± 0.006 a,b | 0.475 ± 0.009 a | 0.21 ± 0.03 f,g,h,i,j,k |
Table 10.
The average values of individual chromatic parameters for peach skin ground colour and over colour of peach.
Table 10.
The average values of individual chromatic parameters for peach skin ground colour and over colour of peach.
| Ground Colour | L* | a* | b* | C* | h* |
|---|---|---|---|---|---|
| Average | 69.3 | 7.17 | 43.8 | 45.0 | 0.96 |
| Deviation | 3.83 | 7.12 | 8.04 | 7.67 | 1.01 |
| Over colour | L* | a* | b* | C* | h* |
| Average | 36.5 | 29.8 | 17.0 | 34.5 | 0.51 |
| Deviation | 4.83 | 4.67 | 5.44 | 6.06 | 0.11 |
Table 11.
Values of chromatic parameters for ground colour skin and over colour skin of the peach cultivars.
Table 11.
Values of chromatic parameters for ground colour skin and over colour skin of the peach cultivars.
| Ground Colour | Over Colour | ΔE*ab | |||||||||
|---|---|---|---|---|---|---|---|---|---|---|---|
| Cultivar | L* | a* | b* | C* | h | L* | a* | b* | C* | h | |
| Admiral de Wey | 65.5 | 19.3 | 39.1 | 43.6 | 1.1 | 35.8 | 37.6 | 18.0 | 41.7 | 0.45 | 40.8 |
| Alexandra | - | - | - | - | - | 29.1 | 21.9 | 10.2 | 24.2 | 0.43 | - |
| Anita | - | - | - | - | - | 36.0 | 33.5 | 15.5 | 37.0 | 0.43 | - |
| Aurelia | 73.6 | 1.96 | 50.8 | 50.8 | 1.53 | 39.6 | 30.0 | 19.1 | 35.6 | 0.57 | 54.3 |
| Avalon Pride | 67.5 | 16.8 | 40.8 | 44.1 | 1.18 | 37.8 | 33.6 | 18.2 | 38.2 | 0.50 | 41.0 |
| Benedicte | 72.5 | 0.36 | 29.8 | 29.8 | 1.56 | 33.1 | 32.1 | 16.6 | 36.1 | 0.48 | 52.3 |
| Candor | 68.7 | 10.8 | 44.3 | 45.7 | 1.33 | 35.3 | 33.7 | 17.3 | 37.9 | 0.48 | 48.6 |
| Carolina Belle | 71.9 | −2.44 | 32.3 | 32.4 | −1.50 | 42.5 | 29.6 | 18.8 | 35.1 | 0.57 | 45.5 |
| Dixigem | 73.2 | 9.21 | 47.6 | 48.5 | 1.38 | 37.4 | 29.3 | 14.5 | 32.7 | 0.46 | 52.7 |
| Dostojnyj | 69.9 | 0.78 | 52.4 | 52.4 | 1.56 | 48.4 | 25.7 | 32.5 | 41.4 | 0.90 | 38.4 |
| Early Glo | 72.6 | 9.38 | 45.9 | 46.9 | 1.37 | 39.4 | 31.8 | 18.8 | 37.0 | 0.53 | 48.4 |
| Early Redhaven | 72.4 | 8.69 | 48.9 | 49.7 | 1.40 | 36.8 | 33.1 | 19.0 | 38.2 | 0.52 | 52.5 |
| Favorita Morettini | 64.1 | 10.3 | 43.6 | 44.8 | 1.34 | 39.0 | 25.3 | 13.4 | 28.6 | 0.49 | 42.1 |
| Fénix | 65.9 | 9.11 | 43.2 | 44.1 | 1.36 | 35.5 | 27.9 | 17.1 | 32.7 | 0.55 | 44.2 |
| Fidelia | 66.7 | 16.2 | 28.5 | 32.8 | 1.05 | 33.0 | 33.0 | 14.9 | 36.2 | 0.42 | 40.0 |
| Harvester | 69.2 | 7.98 | 48.0 | 48.6 | 1.41 | 36.0 | 30.0 | 15.7 | 33.9 | 0.48 | 51.3 |
| Helene | - | - | - | - | - | 30.8 | 28.5 | 12.3 | 31.0 | 0.41 | - |
| Iris Rosso | - | - | - | - | - | 33.2 | 16.0 | 7.01 | 17.5 | 0.41 | - |
| Krasava | 74.5 | −6.95 | 33.8 | 34.5 | −1.37 | 40.1 | 34.1 | 19.9 | 39.5 | 0.53 | 55.4 |
| Lakomyj | 73.1 | 0.71 | 52.7 | 52.7 | 1.56 | 37.7 | 35.3 | 20.6 | 40.9 | 0.53 | 58.9 |
| Narjadnyj Nikitskij | 62.3 | 13.1 | 43.1 | 45.0 | 1.28 | 35.0 | 29.7 | 16.9 | 34.2 | 0.51 | 41.4 |
| Nerine | 64.9 | 20.3 | 45.8 | 50.1 | 1.15 | 37.8 | 34.8 | 20.3 | 40.3 | 0.53 | 39.9 |
| Otličnik | 71.6 | −6.38 | 53.5 | 53.9 | −1.45 | 37.5 | 26.8 | 16.5 | 31.4 | 0.55 | 60.2 |
| Queen Lady | 69.9 | −2.00 | 47.2 | 47.2 | −1.53 | 34.3 | 29.3 | 16.0 | 33.4 | 0.50 | 56.8 |
| Red Robin | 59.8 | 11.4 | 29.2 | 31.3 | 1.20 | 36.2 | 30.1 | 16.2 | 34.2 | 0.49 | 32.7 |
| Redhaven | 71.3 | 9.62 | 49.3 | 50.3 | 1.38 | 37.1 | 30.6 | 18.8 | 35.9 | 0.55 | 50.4 |
| Romea | 71.9 | 13.7 | 54.5 | 56.2 | 1.32 | 50.4 | 32.1 | 33.1 | 46.1 | 0.80 | 35.5 |
| Royal Glory | - | - | - | - | - | 25.6 | 30.0 | 10.0 | 31.6 | 0.32 | - |
| Royal Majestic | - | - | - | - | - | 27.0 | 20.3 | 7.17 | 21.6 | 0.34 | - |
| Sonet | 66.5 | 6.81 | 48.3 | 48.8 | 1.43 | 37.4 | 32.5 | 20.9 | 38.6 | 0.57 | 47.5 |
| Strelec | 69.5 | 4.39 | 47.8 | 48.0 | 1.48 | 34.1 | 28.3 | 14.3 | 31.7 | 0.47 | 54.3 |
| Suncrest | 70.9 | 5.23 | 50.2 | 50.5 | 1.47 | 35.2 | 25.3 | 13.6 | 28.7 | 0.49 | 54.0 |
| Sunshine | 73.7 | 4.27 | 48.4 | 48.6 | 1.48 | 39.0 | 36.4 | 21.8 | 42.4 | 0.54 | 54.3 |
| UFO 3 | 65.7 | 8.29 | 28.8 | 29.9 | 1.29 | 36.3 | 23.8 | 12.1 | 26.7 | 0.47 | 37.2 |
Publisher’s Note: MDPI stays neutral with regard to jurisdictional claims in published maps and institutional affiliations. |
© 2021 by the authors. Licensee MDPI, Basel, Switzerland. This article is an open access article distributed under the terms and conditions of the Creative Commons Attribution (CC BY) license (https://creativecommons.org/licenses/by/4.0/).
Share and Cite
MDPI and ACS Style
Mrázová, M.; Rampáčková, E.; Šnurkovič, P.; Ondrášek, I.; Nečas, T.; Ercisli, S. Determination of Selected Beneficial Substances in Peach Fruits. Sustainability 2021, 13, 14028. https://0-doi-org.brum.beds.ac.uk/10.3390/su132414028
AMA Style
Mrázová M, Rampáčková E, Šnurkovič P, Ondrášek I, Nečas T, Ercisli S. Determination of Selected Beneficial Substances in Peach Fruits. Sustainability. 2021; 13(24):14028. https://0-doi-org.brum.beds.ac.uk/10.3390/su132414028
Chicago/Turabian StyleMrázová, Martina, Eliška Rampáčková, Petr Šnurkovič, Ivo Ondrášek, Tomáš Nečas, and Sezai Ercisli. 2021. "Determination of Selected Beneficial Substances in Peach Fruits" Sustainability 13, no. 24: 14028. https://0-doi-org.brum.beds.ac.uk/10.3390/su132414028
Note that from the first issue of 2016, this journal uses article numbers instead of page numbers. See further details here.