1. Introduction
Given the definition provided by UNESCO [
1], cultural heritage encompasses two main categories. The first is
tangible cultural heritage, which refers to certain artifacts that survive in time such as paintings, manuscripts, sculptures, monuments, as well as cities or underwater ruins. The second is
intangible cultural heritage, which refers to non-physical artifacts such as oral traditions, performing arts, rituals, as well as social practices and pre-existing knowledge. Preserving cultural heritage is of vital importance, since it is the only way to constitute the necessary knowledge-base upon which we as humans can evolve. Although preserving tangible cultural heritage artifacts is somehow “straightforward”, preserving intangible ones requires recording, semantic annotation, and augmentation to put information in the right context. In fact, tangible artifacts are better perceived using such techniques. To that end, modern multimedia tools and frameworks provide several opportunities [
2,
3] as they can serve as a means for providing enhanced cultural storytelling experiences.
Living in a world of continuous digitalization [
4], one could also argue that computer and software development trends carry along important cultural characteristics. Watching a “computer” or “science fiction” movie of the 1980s or 1990s, playing an arcade game, or listening to a certain type of music reveals many cultural heritage elements on how people lived, communicated, and entertained themselves [
5]. In fact, similar to the case of typical cultural heritage assets, where preservation is of vital importance, the same applies in the software engineering domain where the need to produce sustainable software has been defined as one of the key challenges in the fields of computational science and engineering [
6]. This fact is more than evident considering that maintainability (the “official” term for sustainability in the “software engineering” language) is one of the most important quality characteristics according to ISO/IEC 25010:2011 [
7]. Maintainability is defined as the “degree of effectiveness and efficiency by which a product or system can be modified by the intended maintainers”. The importance of producing maintainable software is also indicated by the fact that maintenance-related tasks (i.e., code refactoring given the existence of updated requirements or bugs) often require up to 80% of the total effort put into the software project [
8]. To that end, several research efforts are directed towards the identification and construction of efficient methodologies along with the respective tools that enable evaluating maintainability [
9].
Assessing the extent to which a software component is maintainable is a multifaceted problem and is defined by the scope and internal characteristics of every software project. These characteristics greatly influence the effort required to modify and/or extend the project based on changes that occur both in terms of functional and non-functional requirements [
10,
11]. Various metrics have been proposed to model maintainability that quantify several primary properties of the source code such as cohesion, complexity, coupling, and degree of inheritance [
12,
13]. These metrics are often used as the information basis upon constructing maintainability evaluation models and predictors [
8,
14]. Apart from harnessing this information for assessing the extent to which a source code component is maintainable, constructing models requires defining the appropriate thresholds, which is a non-trivial task often taken by experts who manually examine the source code so as to decide the desirable values. However, considering the fact that maintainability evaluation is an adaptable procedure that requires examining various parameters over the project lifecycle along with the fact that maintenance effort is highly context-dependent, existing approaches are often restricted to certain use-case scenarios.
In this work, we argue that assessing software maintainability is not a one-off procedure, but a constantly running process throughout the development lifecycle that requires being able to adapt to the constantly changing characteristics of the software project. Given the continuously increasing size and complexity of the software projects currently, which makes the manual examination of the source code unattainable, we extend the data-driven methodology proposed by Papamichail et al. [
8], which harnesses information residing in online code hosting facilities towards building a maintainability evaluation methodology based on the analysis of software releases. As opposed to the aforementioned approach, which involves analyzing various software projects without accounting for their score and given the highly context-dependent nature of maintainability, we focus on a specific domain and show how the scope of software projects indeed affects the software maintainability methodology. In order to be aligned with the scope of this Special Issue, we target the multimedia domain, a domain highly related to preserving cultural heritage. Upon formulating our benchmark dataset, we apply static analysis to more than one hundred open-source multimedia tools and frameworks in order to compute a large number of metrics along with their evolution in time. This information constitutes the basis upon which we construct four models, each evaluating maintainability from the perspective of a certain code’s property.
The rest of this paper is organized as follows.
Section 2 reviews the current literature approaches on maintainability evaluation, while
Section 3 discusses the concepts included in our maintainability evaluation methodology along with the construction of our benchmark dataset.
Section 4 presents the components of our maintainability evaluation system, as well as the the steps involved towards the generalization of our models. Finally,
Section 5 evaluates our approach on a set of diverse axes, while
Section 6 concludes the paper and provides insights for further research.
2. Background Knowledge
According to several studies [
14,
15,
16,
17], maintainability prediction is considered as one of the most challenging tasks involved in the area of software quality. To that end and given its significance as a quality attribute, several research efforts are directed towards proposing methodologies that aspire to assess the extent to which a source code component is maintainable. In this context, the majority of the proposed approaches construct models based on the values of static analysis metrics that quantify several aspects of the source code [
8,
18,
19].
Although using metrics for evaluating maintainability has been proven efficient in certain use case scenarios, it exhibits certain inherent weaknesses. At first, using metrics requires setting the appropriate thresholds and/or defining the acceptable intervals. Given that this is a multi-faceted problem that requires taking into account various parameters, this process is usually taken by quality experts who are responsible for examining the source code and come up with the necessary quality targets [
20,
21]. However, the manual examination of the source code is both time- and resources-consuming, especially for large and complex projects. On top of that, this process is usually not feasible considering the fact that maintainability evaluation involves analyzing the source code on a regular basis given the changes that occur throughout the development process. These changes refer to both functional and non-functional requirements, and their frequency is highly dependent on the field of application of the software projects under evaluation. Especially in the multimedia domain, these changes are frequent considering that software needs to handle various different devices and formats, as well as the constantly updated architectures and communication protocols [
22].
Given the limitations of expert-aided solutions, several approaches employ machine learning as a way to model the influence of the values of static analysis metrics with the maintainability degree of software components. In this context, Koten and Gray [
23] used empirical data so as to train a Bayesian Belief Network (BBN) for assessing software maintainability, while Cong and Liu [
24] applied a fuzzy C-means clustering technique as the preprocessing step towards evaluating maintainability using a Support Vector Regression (SVR) model. Additional maintainability evaluation approaches suggest the usage of Artificial Neural Network (ANN) models [
25] and Adaptive Multivariate Regression Splines (MARSs) [
26]. Although efficient, these approaches do not account for the evolution of the software project under evaluation and thus do not provide the ability to predict non-maintainability at an early stage (before occurrence) when the required refactoring along with the respective change cost is minimal.
In an effort to overcome the aforementioned limitations and provide models that enable predicting maintainability, there are also approaches that employ release information as a way to monitor software evolution over time [
27,
28]. In a similar research direction, our prior work [
8] suggested that the evolution of the values of static analysis metrics as reflected in their linear trends can be used as a maintainability indicator. In the context of this approach, we harness information residing in online code hosting facilities so as to identify non-maintainable code components and thus construct the ground truth upon which we build our maintainability evaluation models.
In this work, we employ the aforementioned approach and extend it in several directions in order to create an efficient maintainability evaluation methodology applicable in a specific domain (in our case, the multimedia domain). At first, given that multimedia projects exhibit certain characteristics, we build a benchmark dataset that involves the analysis results of the most popular and reused multimedia tools, libraries, and frameworks. In an effort to provide a more accurate evolution analysis, we refrain from using releases, but we resort to analyzing the development lifecycle at the week level. Consequently, while trying to reduce false positives and given that trend analysis is highly dependent on the development phase, we design a methodology that combines evolution analytics with the absolute values of the static analysis metrics under examination. The evaluation of our approach indicates that our models are able to successfully model the special characteristics of software projects that target the multimedia domain and thus efficiently predict non-maintainability along with providing interpretable results.
3. Source Code Evolution as a Maintainability Indicator
In this section, we discuss our maintainability evaluation methodology built on information originating from the evolution of the source code throughout the project lifecycle. Specifically, we present our modeling strategy towards defining the extent to which a software component that targets the multimedia domain is maintainable, inspired by the one proposed by Papamichail et al. [
8]. Furthermore, we describe the construction of our benchmark dataset, which includes the values of various static analysis metrics computed for all multimedia-related tools, libraries, and frameworks included in the 1000 most starred and most forked GitHub Java projects.
3.1. Towards Modeling Maintainability
Employing the aforementioned maintainability evaluation approach [
8] suggests that using the trends of several static analysis metrics is able to quantify the source code properties of
complexity,
coupling,
inheritance, and
cohesion. We further extend it and resort to defining the degree to which a software component is maintainable based on the combination of two key factors. The first refers to the evolution of the values of static analysis metrics as reflected in their trends, while the second refers to the absolute values of these metrics. Combining the absolute values of the static analysis metrics with their trends aims at reducing the number of false positives, especially in the cases of relatively new software projects where changes in metrics are intense. This change intensity may not always suggest that a component is becoming non-maintainable, but it should definitely act as a warning factor. The severity of this warning factor depends on the absolute values of the static analysis metrics. In addition, it is worth noting that the desirable intervals of the values of static analysis metrics do not involve expert knowledge, but originate from the benchmark dataset.
Given the above, we analyze the lifecycle of packages that have been dropped from certain multimedia software projects (considered as candidates for non-maintainability occurrence), as reflected in the progressing behavior of a series of static analysis metrics along with their absolute values. Instead of using releases for defining the frequency of our analyses and in an effort to capture the progressing behavior of metrics in a more efficient manner, we analyze projects on a weekly basis. This design choice originates from the fact that the release schedule is subject to change especially in projects with a long lifecycle.
Figure 1 illustrates the evolution of the Nesting Level (NL) metric for the package
com.eftimoff.androipathview included in the repository
geftimov/android-pathview (
https://github.com/geftimov/android-pathview) over its full lifecycle, which consists of 73 weeks. Given the presented evolution, it is obvious that there are certain time periods where there are no changes in the respective package (for instance, the time period between Week 5 and Week 14). These idle periods refer to cases where the project appears to be inactive or the development focuses on different parts of the source code. As a result, in an effort to capture the actual evolution of each respective package, we keep only the weeks that exhibit at least one metric that has been changed. After having computed the actual change sequence for each package, we calculate the linear trend of each metric, which reflects its evolution behavior.
3.2. Benchmark Dataset
In an effort to create models that are tailor-made to the characteristics of the software projects that target the multimedia domain, our benchmark dataset includes the analysis results for all multimedia-related tools, libraries, and frameworks included in the 1000 most starred and forked GitHub Java projects. This selection originates from the fact that stars and forks reflect the degree of acceptance of the projects and thus their success among the community of developers. In addition, especially the high number of forks suggests that the projects adhere to certain software development principles and code writing guidelines and thus can be used as representative examples of the state-of-the-practice. Furthermore, projects that receive high traction are usually projects that exhibit a long lifecycle (usually several years) and a large number of contributors and thus are suitable for analyzing maintainability-related information.
Upon having extracted the information regarding the 1000 most starred and most forked GitHub projects, our first step involves selecting the ones that refer to the multimedia domain. To that end and in an effort to construct an automatic benchmark dataset formulation procedure, we use the GitHub API (
https://api.github.com) and extract the description and the keywords of each project. Then, we check whether they contain words that are related to multimedia (such as
image,
video,
audio,
view,
sound,
player, and
media, along with their synonyms). Following this process, we identified 114 projects, which constitute our benchmark dataset.
Table 1 presents some general statistics regarding our benchmark dataset.
After having constructed our benchmark dataset, we perform two types of analysis. The first involves analyzing the latest version (last commit) of all projects in order to compute a large set of static analysis metrics that quantify four primary code properties:
cohesion,
complexity,
coupling, and
inheritance. This dataset is used to extract the profiles of the static analysis metrics and thus calculate the desirable intervals based on frequency analysis. The second analysis type refers to monitoring code evolution. In this context, we select 10 projects to perform a full lifecycle analysis at the week level. Given that performing full lifecycle analysis is a highly time- and resource-consuming task and in an effort to create a dataset that represents multimedia projects that exhibit different characteristics, this selection is based on the size, the complexity, and the length of the lifecycle of the projects. Of course, although the full analysis of the 10 projects provides enough information for building our maintainability evaluation models, given that our methodology is fully incremental, we can increase this number in order to further strengthen the effectiveness of our models. Information regarding our experimental setup along with the corresponding source code for creating our benchmark dataset can be found online (
https://github.com/AuthEceSoftEng/multimedia-tools-sustainability).
In the context of this analysis, we extract information regarding the packages that have been removed, and this removal originates from them being non-maintainable. The analysis results for these packages are used to extract the trends of the static analysis metrics and thus create the training dataset for our maintainability evaluation models. The evolution analysis at the week level involves analyzing more than 50 M lines of code.
Table 2 provides a full reference of the computed metrics along with their computation level (method or class). Given that all static analysis metrics are computed either at the class level or method level, we generate the value of each metric at the package level as the average of the values regarding all classes and methods included in the package. The computation of all static analysis metrics was performed using Sourcemeter (
https://www.sourcemeter.com/) tool.
4. Maintainability Evaluation System
In this section, we present our approach towards quantifying the extent to which a multimedia-related software component is maintainable. In addition, we describe the calculation of the desired intervals of the values of various static analysis metrics based on our benchmark dataset along with the construction of our models, each targeting a certain source code property.
4.1. Overview
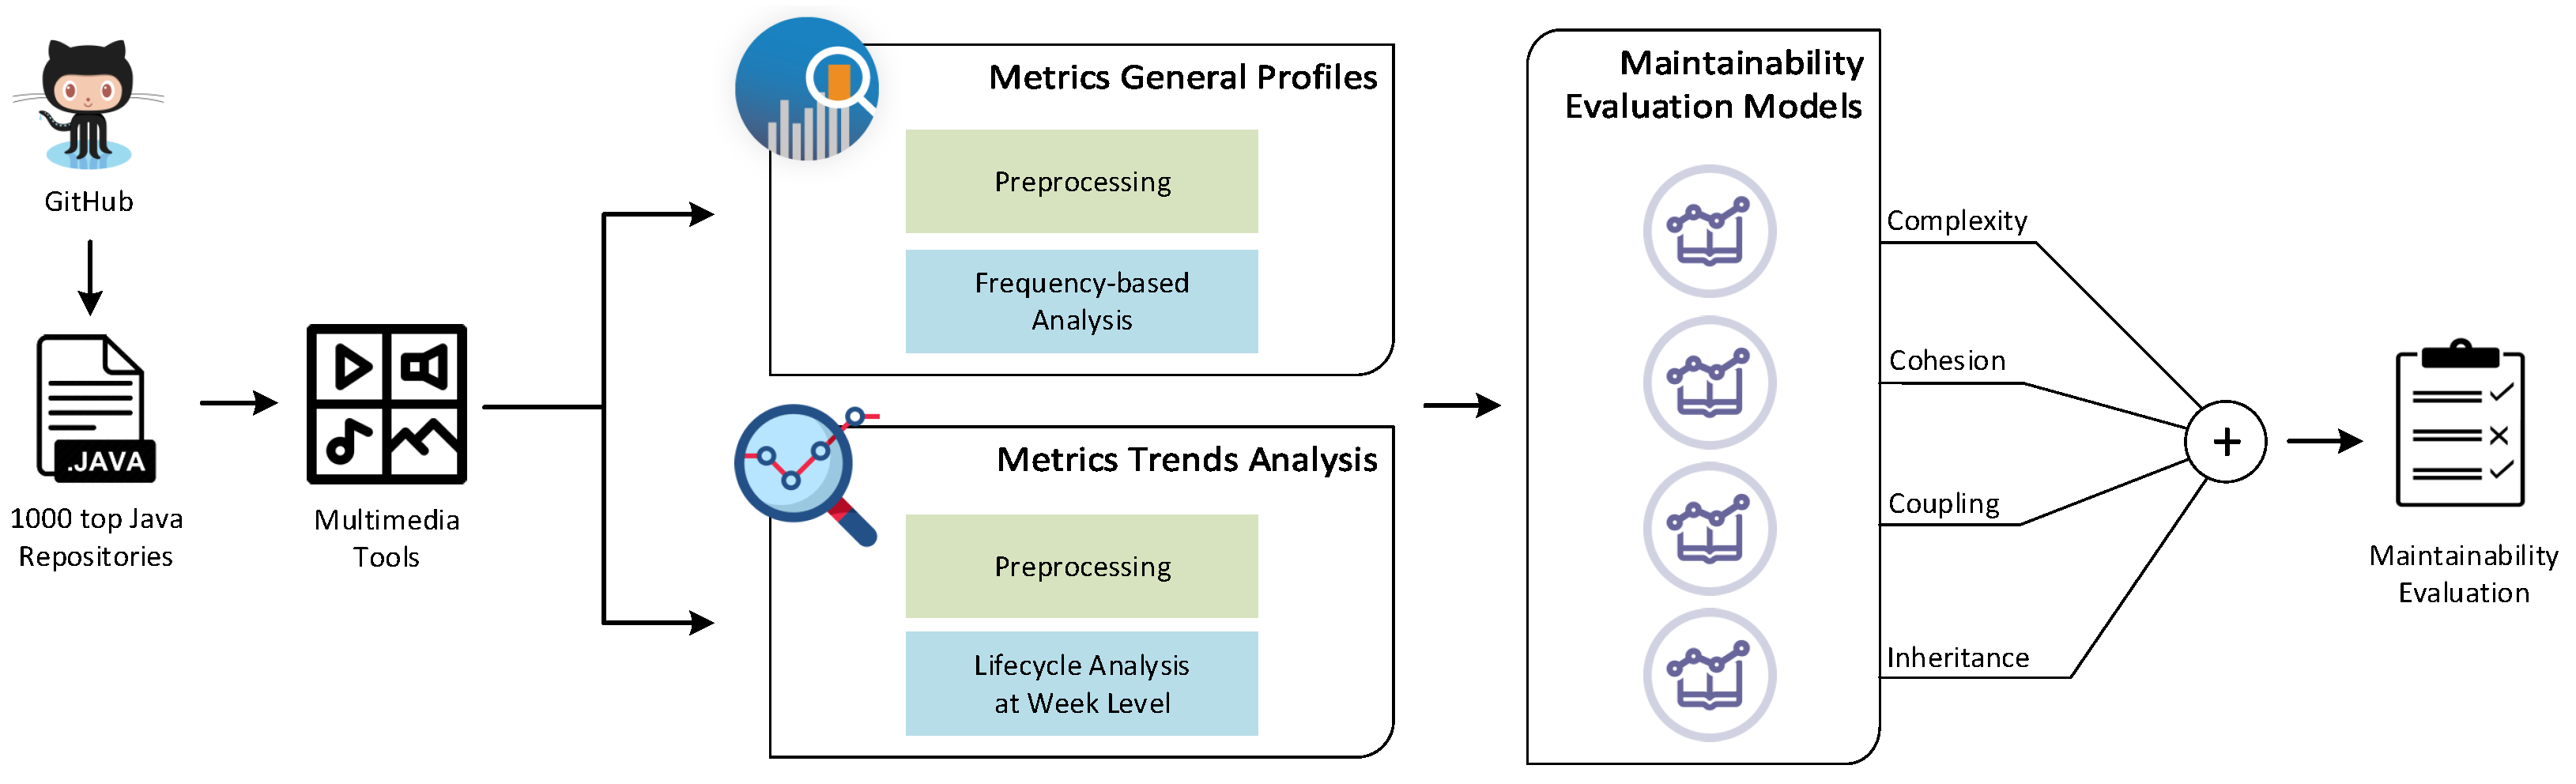
Figure 2 provides a general overview of our maintainability evaluation system targeting multimedia tools, which involves the following steps.
Step 1: We use the GitHub API in order to extract the information of the 1000 most starred and most forked Java projects. We use the attributes description and keywords and apply natural language processing techniques in order to identify the ones that are related to multimedia. During this process, we identified 114 multimedia-related projects.
Step 2: After constructing our benchmark dataset, we select 10 projects so as to perform a thorough lifecycle analysis at the week level. To that end, we again use the GitHub API in order to retrieve a full list of all commits for each project. Then, we calculate all weeks between the first and the last commit along with the latest commit hash (attribute sha) for each respective week.
Step 3: Having identified the repositories that are related to multimedia, we perform static analysis in order to calculate the values of various metrics that quantify four primary source code properties: cohesion, complexity, coupling, and inheritance. We perform two types of analysis. The first involves analyzing all 114 repositories so as to create the benchmark dataset for extracting the general profiles of static analysis metrics, while the second involves analyzing all the aforementioned commits of the 10 projects selected for lifecycle analysis. This information is going to be used to calculate the metrics’ progressing behavior.
Step 4: We use the static analysis results for all 114 projects in order to extract the general profile of each metric. In an effort to calculate the profiles that correspond to the general distributions of the values of static analysis metrics [
29], we apply frequency analysis and polynomial regression. These profiles aim at providing information regarding the acceptable intervals of the values of static analysis metrics and thus to be used as non-maintainability indicators.
Step 5: We use the results regarding the lifecycle analysis performed for the 10 selected projects so as to locate the packages that have been dropped and calculate the trends of their computed metrics. These trends constitute the information basis upon constructing our maintainability evaluation models. In this context and in an effort to maintain the purity of our dataset, we apply a series of quality criteria to determine the packages that are actually dropped based on reasons that are related to quality control.
Step 6: The sixth step involves training our maintainability evaluation models using the results of the two previous steps. During this process, we employ one class classification using support vector machines and train four maintainability evaluation models, each targeting a certain code property.
Step 7: The last step involves combining the output of all four models into a single score that reflects the maintainability degree of the package under evaluation.
4.2. Preprocessing
The preprocessing step involves determining the non-maintainable packages by determining the source code property (or properties) that cause non-maintainability. This first step involves computing all metrics at the package level in order to identify their trends using linear regression. Given that we have already performed a full-scale analysis at the week level, we use the results in order to create the necessary mappings and thus identify the classes that are part of each package. In order to perform the necessary mappings, we use the package declarations located at the top of each source code file.
After having calculated all trends for all packages included in the 10 projects under evaluation, the next step involves extracting the packages that are being dropped. Upon using the commit information to sort the analyses in the correct order based on the commit timestamp, we identify the lifecycle of each unique package. The term lifecycle refers to the time period between the first week and the last week the package existed in the project. In case the index of the last week is not equal to the index of the last week of the project, then the package has been dropped and thus is considered as a candidate for being non-maintainable.
After having extracted all candidates, the next step involves applying a series of quality criteria so as to eliminate false positives given that dropping a package does not necessarily originate from actions that have to do with quality control. To that end, in an effort to maintain the purity of our dataset, we apply the following filters:
We keep only packages that are present for more than four consecutive weeks in an effort to eliminate packages that are being dropped based on changes in requirements and/or design choices.
We keep only packages that appear to have at least one metric that exhibits a trend that negatively affects its maintainability degree.
We apply code clone detection techniques in order to identify packages that have been renamed and thus should be eliminated from our training dataset. Otherwise, these packages are identified as dropped.
After having extracted all the non-maintainable packages, the next step involves deciding the property (or properties) that is (or are) responsible for them being non-maintainable. For instance, a dropped package that appears to have a high positive trend for the Nesting Level (NL) metric is considered as non-maintainable due to complexity. Upon applying this process for all packages and code properties under evaluation (complexity, coupling, cohesion, and inheritance), we use this ground truth information for constructing our maintainability evaluation models.
4.3. Metrics Behaviors’ Extraction
As already noted, our methodology involves using the analysis results for the 114 multimedia-related projects included in the 1000 most popular and reused GitHub Java projects in order to extract the general behavior of each static analysis metric. These behaviors are then used for translating the values of each static analysis metric into a score in the interval of , which reflects the compliance of the source code component with the state-of-the-practice as extracted by the benchmark dataset. This score is used along with the metrics’ trends for constructing our maintainability evaluation models. Given that each metric quantifies a certain property, the scores of all metrics that refer to a certain property are aggregated into a final score that reflects the property itself.
Our first step towards modeling the general behavior of each metric involves computing its distribution using all code components included in our benchmark dataset. In order to eliminate any introduced bias and given that different projects contain code components that exhibit high differences in terms of the values of static analysis metrics, we apply outlier detection techniques so as to eliminate extreme values. In this context, we use boxplot analysis and eliminate values that fall outside the interval
, where
and
refer to the first and the third quartile, respectively, while
refers to the the Interquartile Range. After having eliminated outliers, we compute the distribution of the values of each metric as reflected in their histogram. For selecting the appropriate bin size, we employ the Scott formula [
30], which asymptotically minimizes the integrated mean squared error and represents a global error measure of a histogram estimate. Given the Scott formula, bin width is given by the following formula:
In the above equation, is an estimate of the standard deviation of the metric values and n is the size of the data sample.
Upon having extracted the generic distribution of the values of each static analysis metric following the aforementioned procedure, we use the generated bins in order to construct a set of data instances that translate the values of each metric into a compliance score. These data instances have the form , where refers to the center of each bin and refers to the normalized frequency of the bin. In that way, the bins of higher frequency receive higher scores. In an effort to model the identified behaviors, we apply polynomial regression on the set of data instances produced in the previous step, and the result for each metric is an evaluation model able to translate the values of the metric into a score given the standards of the benchmark dataset.
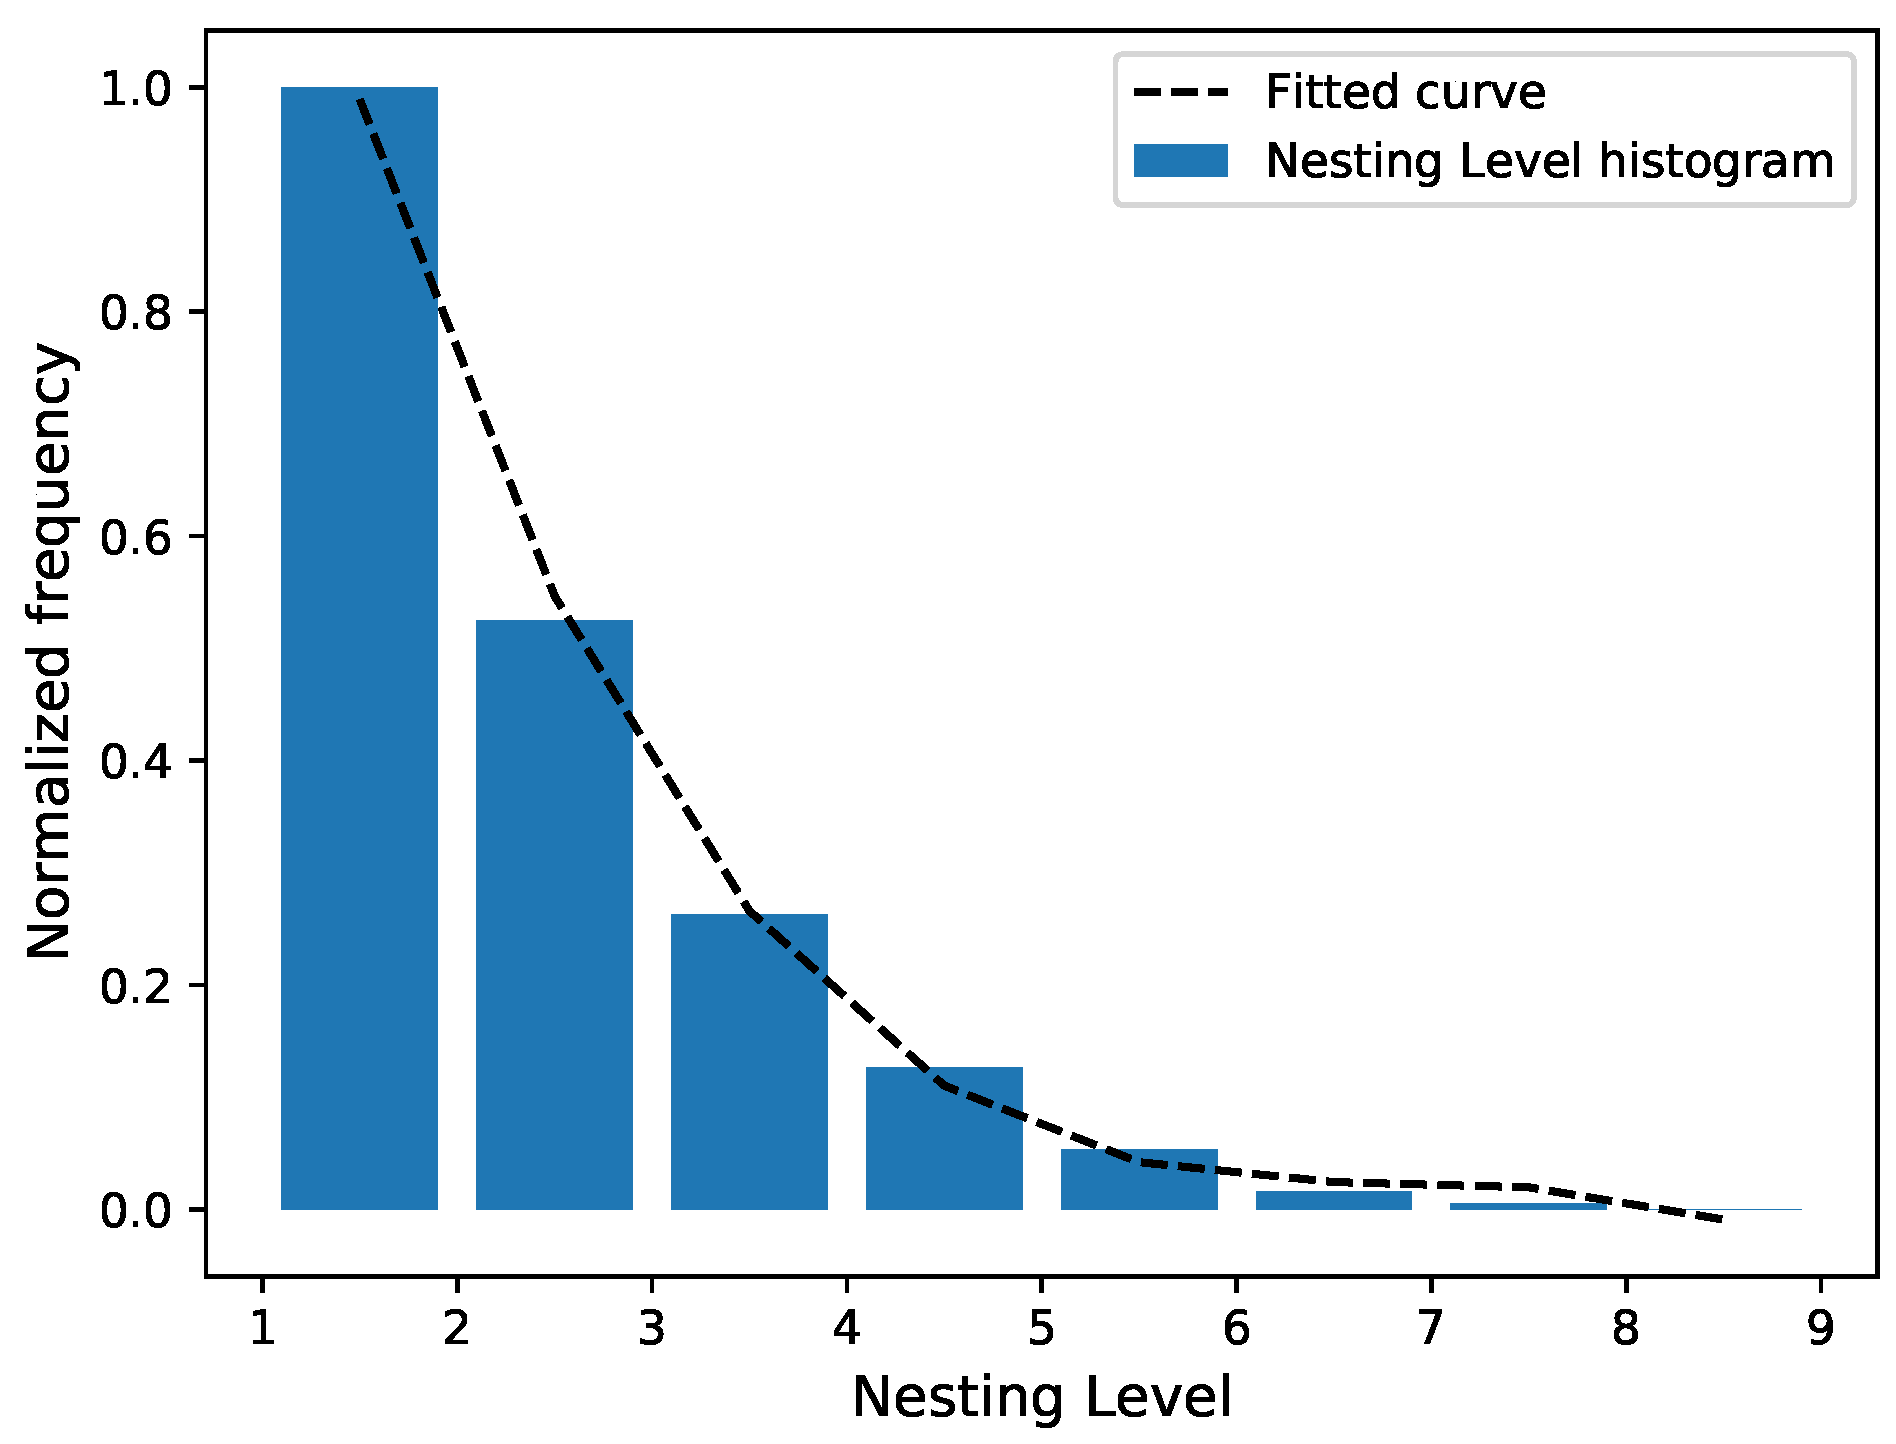
Figure 3 illustrates the aforementioned procedure for the case of the
Nesting Level (NL) metric, which is computed at the class level. The blue bars depict the histogram of the NL values (the ones kept after the outlier detection step), while the black dashed line refers to the fitted curve that translates NL values into a complexity score. The degree of the polynomial for each metric s determined using the elbow method of the
Root-Mean-Squared-Error (RMSE). This ensures that the constructed models are effective and able to provide reasonable estimates, while we avoid overfitting. Given the actual scores
and the predicted scores
, the RMSE is calculated as follows:
The RMSE and Mean Absolute Error (MAE) of the polynomial regression models for all metrics computed at the method and class levels are shown in
Table 3.
4.4. Models’ Construction
As already noted, after having calculated the metrics’ trends for the packages identified as non-maintainable along with the respective property (or properties) flagged as responsible for the non-maintainability, the next step involves training four maintainability evaluation models, each targeting a certain source code property. Given that we only have information regarding the packages identified as non-maintainable (we cannot come to a conclusion for the other packages), we employ one class classification using Support Vector Machines (SVMs). The selection of four models instead of one (using all metrics) originates from the fact that our primary target was building a configurable and interpretable maintainability evaluation system able to adapt to the individual needs of each project under examination.
As for training each model, we use only the packages that were flagged for the respective source code property. The attributes of the training dataset are the computed trends of the static analysis metrics that quantify the respective property along with the score computed using the general behavior of metrics.
Table 4 presents the number of packages identified as non-maintainable for each source code property, while
Table 5 provides information regarding the selection of meta-parameters for each one-class classifier. This selection is based on the percentage of False Negatives (FNs) and optimizes the values of three meta-parameters:
nu, which corresponds to the fraction of training errors and a lower bound of the fraction of support vectors,
gamma, which is the kernel coefficient that reflects how far the influence of a single training example reaches, and
cost, which trades off the misclassification of training examples against the simplicity of the decision surface. As shown in
Table 4, coupling and complexity are the dominant properties responsible for most non-maintainable occurrences.
The following paragraphs present the training results regrading the trained maintainability evaluation models, each targeting a different primary source code property.
Complexity model:
The dataset includes the trends regarding five static analysis metrics that are related to complexity: NL, Nesting Level Else-if (NLE), Weighted Methods per Class (WMC), McCabe Cyclomatic Complexity (McCC), and Halstead Program Length (HPL). As shown in
Table 5, the selected values for the nu, gamma, and cost parameters are 0.022, 0.134, and 512, respectively. The percentage of the FNs is 2.62%.
Cohesion model:
The dataset includes the trends regarding the Lack of Cohesion in Methods (LCOM5) metric, which corresponds to the number of coherent classes into which each class could be split. In a similar manner to the aforementioned analysis, the selected values are 0.041, 0.047, and 256 for the nu, gamma, and cost parameters, respectively, while the percentage of false negatives is 3.37%.
Coupling model:
The dataset includes the trends regarding five static analysis metrics that are related to coupling: Coupling Between Object classes (CBO), Coupling Between Object classes Inverse (CBOI), Number of Incoming Invocations (NII), Number of Outgoing Invocations (NOI), and Response set For Class (RFC). For the coupling model, the selected values are 0.03, 0.06, and 256 for the nu, gamma, and cost parameters, respectively, while the percentage of false negatives is 2.84%.
Inheritance model:
The dataset includes the trends regarding five static analysis metrics that are related to inheritance: Depth of Inheritance Tree (DIT), Number Of Ancestors (NOA), Number Of Children (NOC), Number Of Descendants (NOD), and Number Of Parents (NOP). For the inheritance model, the selected values are 0.027, 0.12, and 32 for the nu, gamma, and cost parameters, respectively, while the percentage of false negatives is 2.67%.
5. Evaluation
The evaluation of our maintainability evaluation methodology is performed around three axes. The first evaluates our system for its ability to predict the maintainability degree at the package level for a number of randomly selected multimedia-related projects that exhibit different characteristics in terms of the size and length of the lifecycle. The second axis evaluates our system for its ability to predict non-maintainability at an earlier stage, while the third evaluates the maintainability evaluation results from a software quality perspective.
5.1. Efficiency of Maintainability Evaluation
Our first evaluation axis assesses the ability of our maintainability evaluation system to effectively identify non-maintainable packages by employing the evolution of static analysis metrics as reflected in their linear trends along with their compliance with the state-of-the-practice as reflected in their acceptable intervals based on the constructed benchmark dataset. To that end, we apply our methodology on four independent and randomly selected multimedia projects. Namely, the selected projects are alexvasilkov/GestureViews (
https://github.com/alexvasilkov/GestureViews), graphhopper/graphhopper (
https://github.com/graphhopper/graphhopper), janishar/PlaceHolderView (
https://github.com/janishar/PlaceHolderView), and wyouflf/xUtils3 (
https://github.com/wyouflf/xUtils3).
Table 6 presents certain statistics regarding the evaluation repositories. As given by the provided statistics, the evaluation repositories differ both in terms of size and in their length of lifecycle. At this point, it is worth noting that the full-scale analysis for the aforementioned repositories involves analyzing more than 25 million lines of code.
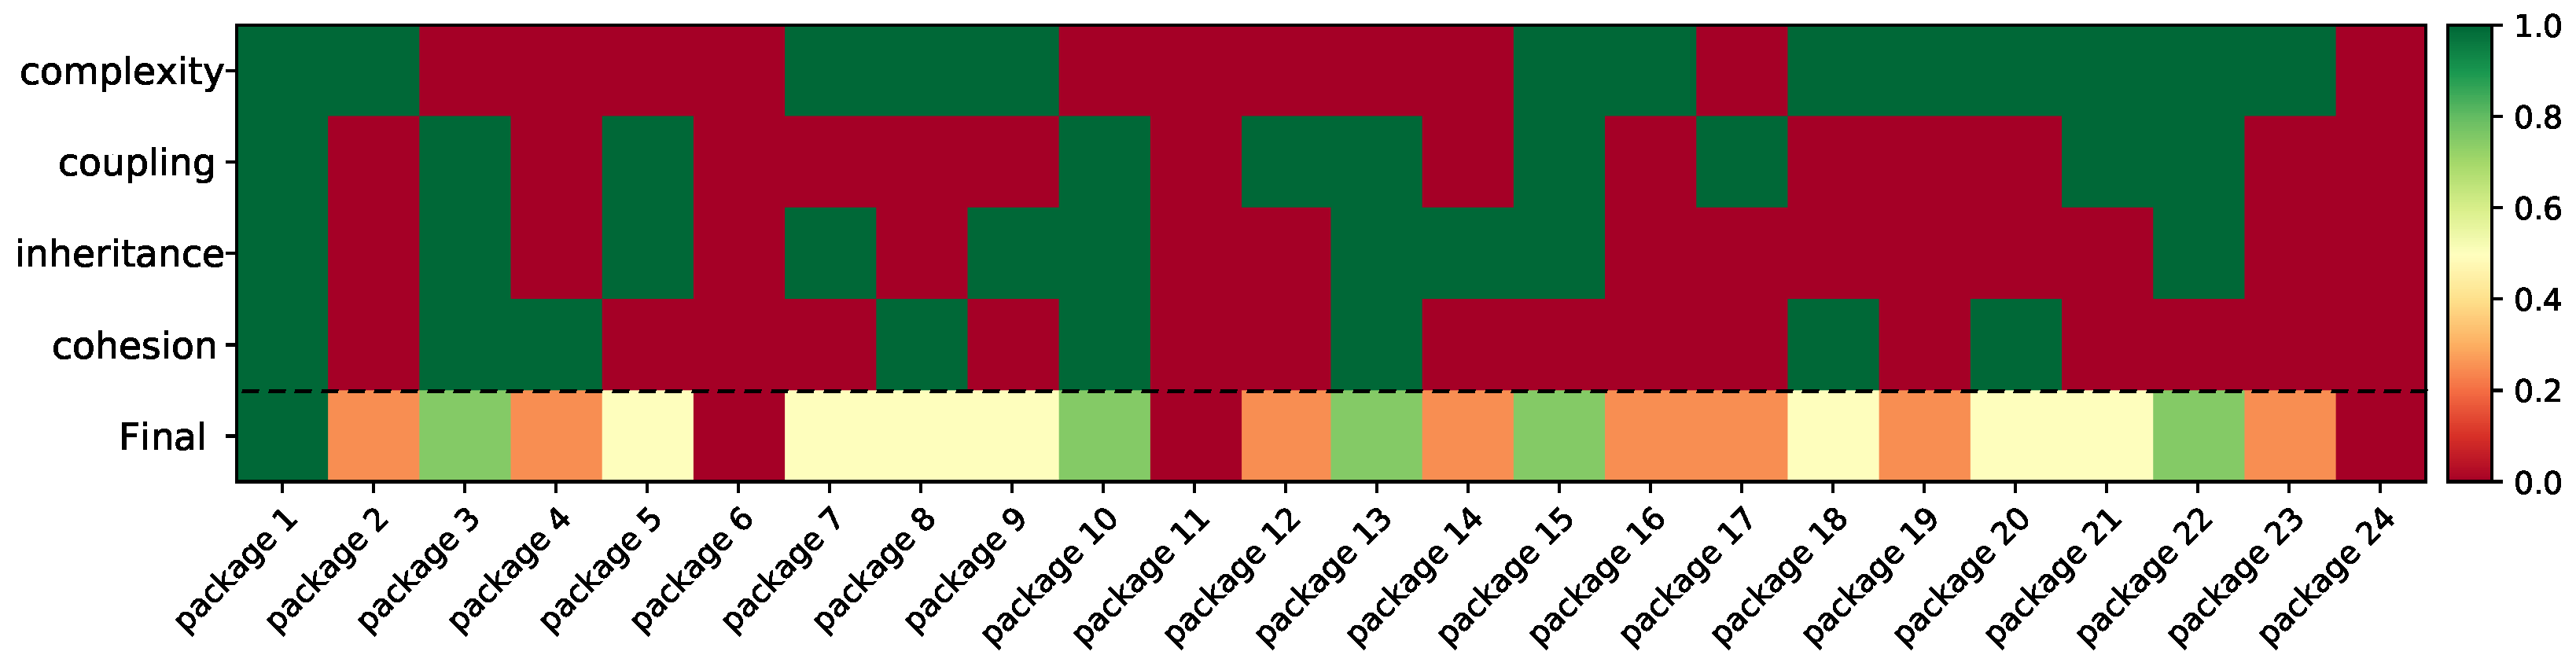
Figure 4 gives a graphical representation of our maintainability evaluation results using the janishar/PlaceHolderView project as our reference repository. The lifecycle of the PlaceHolderView project is 96 weeks, and it includes 24 packages that contain around 9000 lines of code. Upon analyzing a snapshot of the project for each one of the 96 weeks (around 500 K lines of code), we compute the trends of all static analysis metrics that quantify the properties complexity, coupling, inheritance, and cohesion. In addition, given the constructed models that enable translating the values of each static analysis metric into a compliance score (using the extracted general distributions), we compute for each property one score for each package that expresses its compliance with the acceptable intervals of the static analysis metrics that quantify the property. The computed trends along with the compliance scores are then given as the input in our already constructed maintainability evaluation models, each targeting a certain code property. Each row of the heat map illustrates the maintainability evaluation results based on a different property. The green color denotes that the package is considered as maintainable regarding the respective code property, while red indicates that the package is considered as non-maintainable. The final maintainability score for each package occurs as the average of the four respective properties. This final score reflects the risk of the package becoming non-maintainable, while the disaggregation provides interpretable results regarding the properties that need improvement.
Upon further evaluating the ability of our models to effectively identify non-maintainable packages, we present the results for the four repositories used for evaluation.
Table 7 presents the respective results based on the sensitivity criterion along with the percentage of packages identified as non-maintainable for each source code property. Sensitivity was chosen as our evaluation criterion as it expresses the proportion of true positives that are correctly identified by our models given that we can only come to a safe conclusion for non-maintainable packages. Given the provided results, the sensitivity (true positive rate) of our maintainability evaluation approach varies from 76.12% (janishar/PlaceHolderView project) to 92.47% (graphhopper/graphhopper project), which indicates that our models are able to effectively identify non-maintainable packages. Finally, as for the properties responsible for the non-maintainable packages, they indicate that every project exhibits different strengths and weaknesses as they vary among the evaluation repositories. This is expected as the characteristics of each project are greatly influenced by its scope. For instance, given the nature of the graphhopper project, which implements a routing engine for OpenStreetMap, along with its large size and complex functionality, it is expected to exhibit a higher percentage of non-maintainable packages based on complexity and coupling.
5.2. Ability to Provide Early Predictions
Given the vital importance of predicting maintainability at an earlier stage as a way to prevent cases where major refactoring is needed, which is a highly time- and resource-consuming task, our second evaluation axis targets assessing the ability of our system to provide early predictions and thus act in a preventive rather than in a corrective manner. The early prediction refers to the percentage of lifecycles (expressed as the number of weeks) for which our models are able to correctly identify non-maintainability.
To that end, we calculated the metrics’ trends for every package and for every week in the lifecycle taking into account only the previous releases. For instance, given a certain package that appears to be in the project for 60 weeks (this time period constitutes its full lifecycle) and is then being dropped, we use only the values of the first 45 weeks (as if our current timestamp was the 45th week) in order to calculate the metrics’ trends and use our models to evaluate its maintainability degree. If we successfully identify the package as non-maintainable, then we have a correct prediction 15 weeks ahead, which corresponds to 25% of the package lifecycle. Using this strategy for all weeks, we were able to assess the maintainability degree of each package for every release, as if it was the current release and thus calculated the number of releases ahead for which our models provided correct evaluation. The number of releases was then transformed into the percentage of lifecycles for each package by dividing it by the total number of weeks. As already noted, we use the term lifecycle for a package in order to refer to the time period between the first and the last week it existed in the software project.
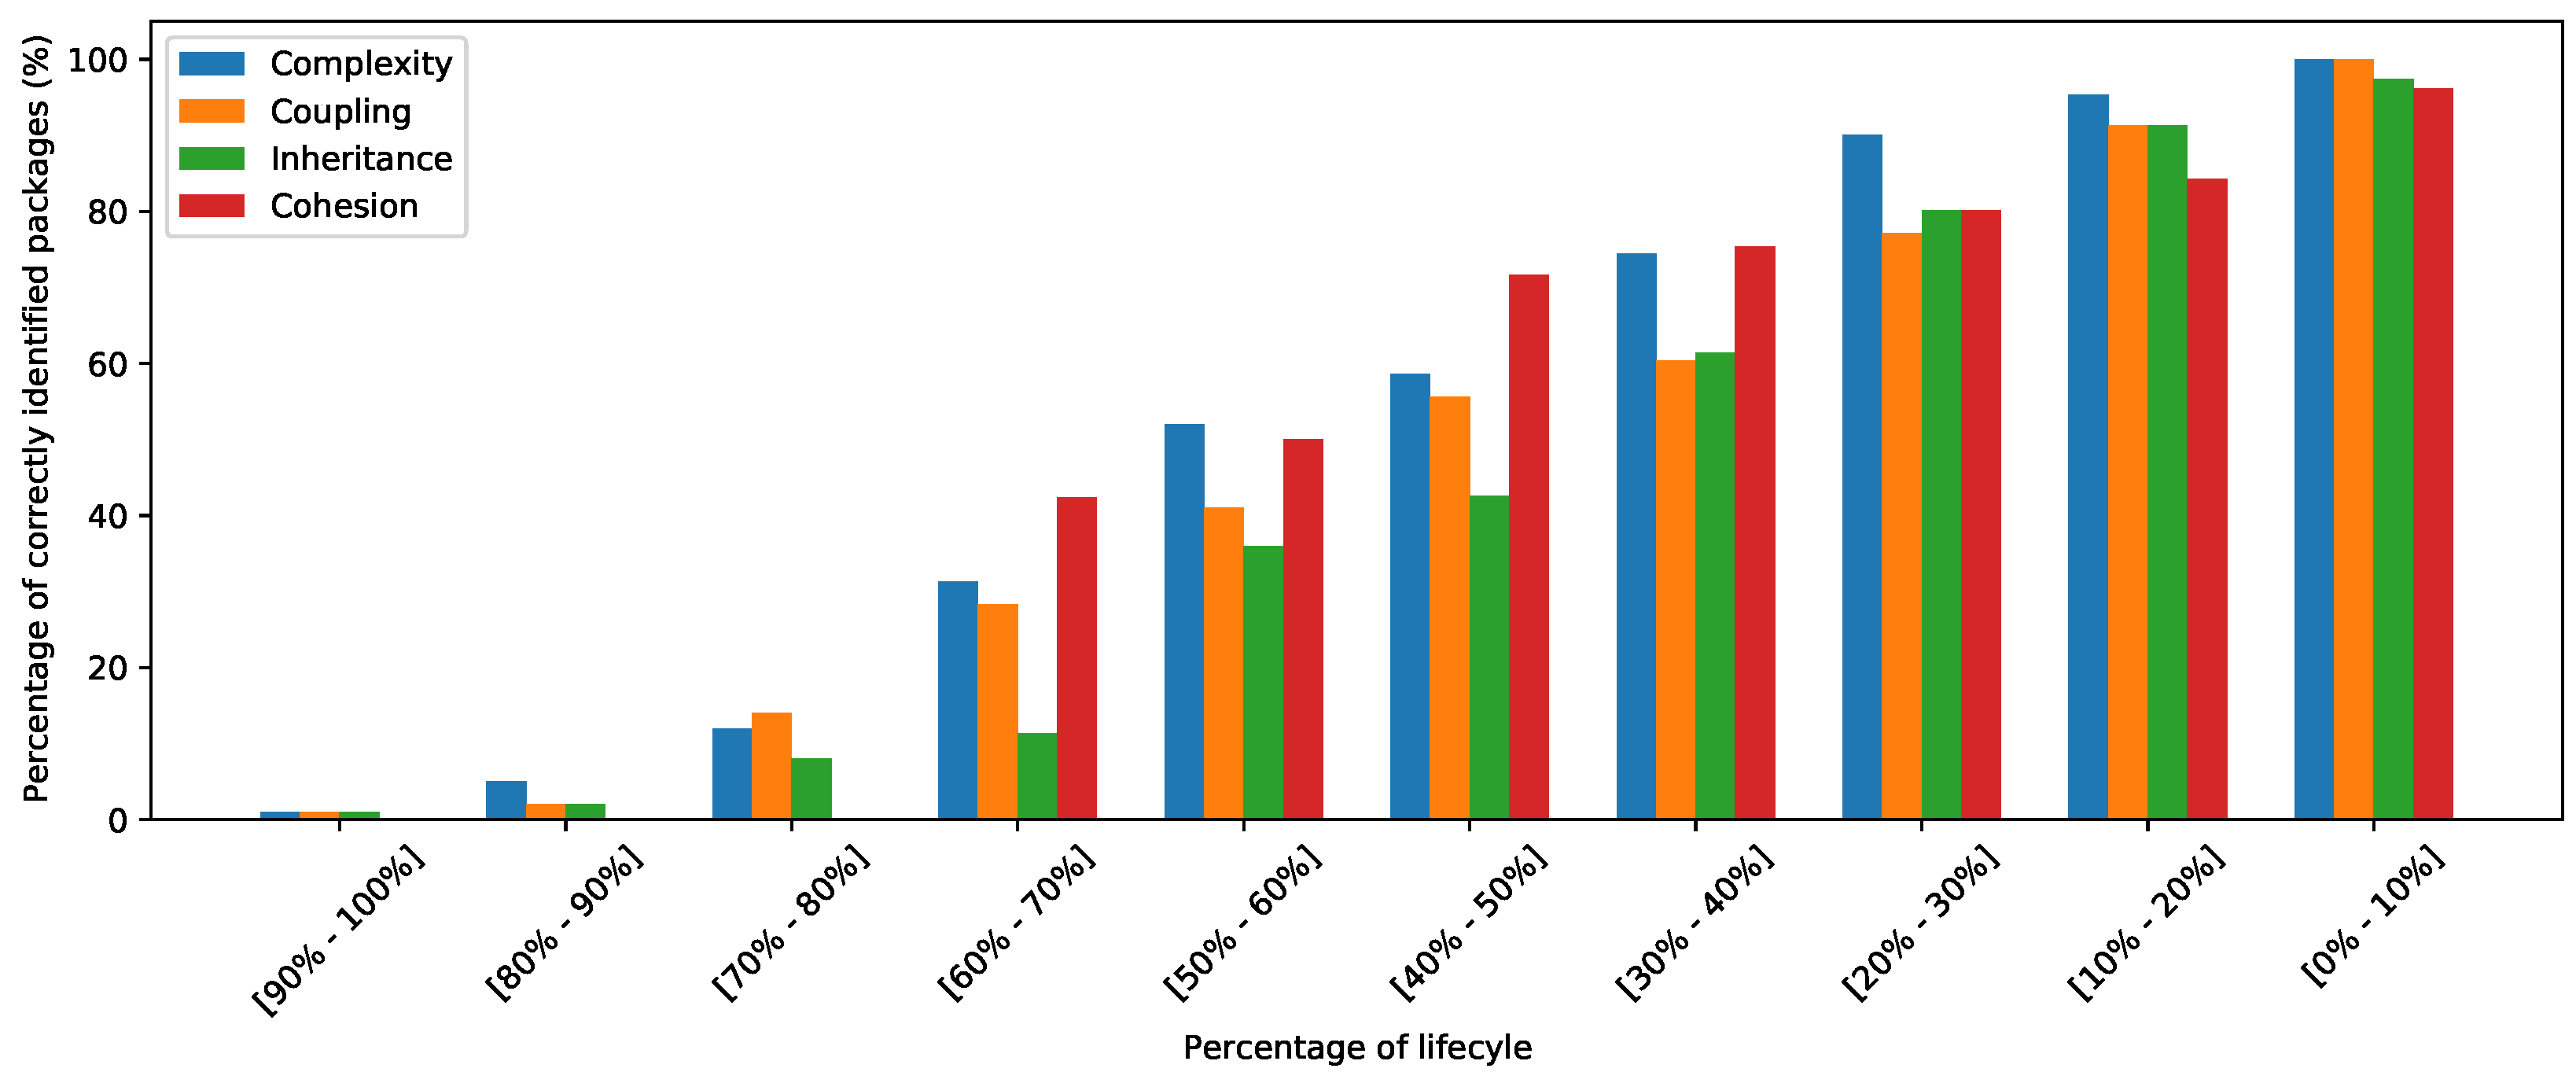
Figure 5 illustrates the ability of each evaluation model to provide early predictions. Specifically, the
y axis corresponds to the percentage of packages correctly identified as non-maintainable for each source code property, while the x axis refers to the percentage of lifecycles divided into ten intervals. Each interval expresses the percentage of the lifecycles ahead for which our models is able to provide correct maintainability evaluation. For instance, the first interval refers to the time period between the current week (0% ahead) up to 10% ahead. Given a certain interval, each bar refers to a different code property. As expected, while the lifecycle ahead increases, the percentage of correctly identified packages decreases. The results indicate that all four models are able to provide correct evaluation (for almost 50% of the non-maintainable packages) at least 50% to 60% earlier.
5.3. Case Study
As for the third evaluation axis and in an effort to assess whether the compliance scores computed using the general distribution of metrics are logical from a software quality perspective, we manually examined the values of the static analysis metrics for methods and classes that received both high and low compliance scores (these scores are then aggregated into the package level and are used along with the metrics’ trends for modeling).
Table 8 provides an overview of the computed static analysis metrics for representative examples of methods and classes with different scores. The table contains static analysis metrics for two methods and two classes regarding each source code property that received both high and low scores.
Examining the values of the metrics, we may note that the scores regarding all four properties are reasonable from a quality perspective. Concerning the class that received a high cohesion score, it appears to be very cohesive as the LCOM5 (Lack of Cohesion in Methods 5) metric, which refers to the number of cohesive classes in which a non-cohesive class should be split, is one. From a complexity perspective, the class that received a high score appears to be very well structured, which is denoted by the low values of the nesting level (NL and NLE) metrics, along with the low value (eight) of the Weighted Methods per Class (WMC) metric. The latter is computed as the sum of the McCabe’s Cyclomatic Complexity (McCC) values of its local methods. As a result, a high score for the complexity property is expected. The same applies for the case of methods, where the one that received a low score appears to be highly nested and of extreme complexity considering the value of McCC (31).
As for the coupling property, the class that received a high score appears to be very well decoupled, which is denoted by the values of all five metrics. The same applies for the respective methods that exhibit low values regarding the metrics NII and NOI, which refer to the number of incoming and outgoing invocations, respectively. On the other hand, the code components that receive low scores appear to be highly coupled, which has a negative impact on their maintainability degree. Finally, given the values of the static analysis metrics that quantify inheritance, the class that received a low score appears to lie deep in the code inheritance tree, which has a negative impact in its understandability. This fact also affects its maintainability degree. On the other hand, the class that received a high score appears to be well placed in the inheritance tree following the principles of object-oriented programming. Given all of the above, our scoring mechanism appears to be able to effectively translate the values of static analysis metrics into an interpretable compliance score.
6. Conclusions and Future Work
In this work, we propose a maintainability evaluation methodology targeting multimedia projects that harness information residing in code hosting facilities. Our methodology, applicable at the package level, employs the evolution of static analysis metrics along with the compliance of the source code with their acceptable intervals as extracted by the benchmark dataset, which contains multimedia projects that receive a high degree of acceptance by the community of developers. Upon performing a thorough code analysis on a weekly basis and in an effort to provide interpretable results, our methodology quantifies the extent to which a software component targeting the multimedia domain is maintainable by evaluating four axes, each targeting a primary source code property: complexity, coupling, inheritance, and cohesion. The evaluation of our approach denotes that our models are able to predict maintainability at an earlier stage (in many cases, more than 50% of the project lifecycle), while at the same time, the results regarding all four axes are logical from a software quality point of view. Considering all the above, we argue that our system can be a valuable tool for developers.
Future work lies in several directions. At first, we could further expand the selection of metrics to be used for the construction of our models. In addition, we could also expand the trend analysis by employing additional trend types, especially non-linear, in order to be able to identify more complex behaviors. Furthermore, we could also apply clustering techniques in order to split our code components into coherent clusters and thus construct additional models, each applying to the specific characteristics of each cluster. Finally, we could also expand our benchmark dataset with more multimedia-related projects to cover additional use case scenarios and thus strengthen the effectiveness of our system.


