
Economic Perspective on Discontinuing Fossil Fuel Subsidies and Moving toward a Low-Carbon Society


1
Global Sustainable Development Economic Institute, Sunmoon University, Asan 31460, Korea
2
Department of International Economics and Trade & Global Sustainable Development Economic Institute, Sunmoon University, Asan 31460, Korea
3
Urban Infrastructure Research Division, The Incheon Institute, Incheon 22711, Korea
*
Authors to whom correspondence should be addressed.
Sustainability 2021, 13(3), 1217; https://0-doi-org.brum.beds.ac.uk/10.3390/su13031217
Submission received: 12 December 2020
/
Revised: 16 January 2021
/
Accepted: 21 January 2021
/
Published: 25 January 2021
(This article belongs to the Section Energy Sustainability)
Abstract
:In Korea, multiple efforts, including subsidies to energy industries, have been made to increase renewable energy use and strengthen the competitiveness of renewable energy industries. Ironically, a considerable number of subsidies have also been provided for fossil fuels, drawing criticism both within Korea and overseas that these subsidies increase not only fossil fuel consumption and greenhouse gas emissions, but also energy market distortion. Thus, the Korean government announced a plan to discontinue some fossil fuel subsidies in 2020. Based on Korea’s policy orientation to expand renewable energy and strengthen its competitiveness, various scenarios to phase out fossil fuel subsidies and increase renewable energy subsidies can be examined. This study used the computable general equilibrium model to subdivide the energy sector and analyze the influence of changes in subsidies on the Korean economy and CO2 emissions based on three scenarios. The results show that phasing out fossil fuel subsidies causes a significant reduction in domestic CO2 emissions by −6.9 to −8.5%, depending on our scenarios. Implementing energy policy in Korea may have minimum impacts on its economy when fossil fuel subsidies transfer to renewable energy industries. The real gross domestic product could be only decreased by −0.04 to −0.14%.
1. Introduction
The demand for renewable energy has been rapidly increasing worldwide, as countries seek to respond to climate change, reduce air pollutant emissions, and prepare for fossil energy depletion. The International Energy Agency (IEA) expects that renewable energy will account for 45% of the primary energy demand by 2040, which is almost three times higher than the current value [1]. The proportion of renewable energy in Korea’s total energy consumption in 2018 was 3.9%, which was significantly low compared to the Organization for Economic Co-operation and Development (OECD) average of 10.2% [2]. As such, several national plans have been established in Korea to increase the proportion of renewable energy and to strengthen its competitiveness in the energy sector [3]. Recently, a comprehensive plan—the “Korean New Deal”—was announced, which includes strategies to increase renewable energy use, i.e., the promotion of electric and hydrogen vehicles and the early retirement of diesel vehicles, to transform Korea into a sustainable, low-carbon, eco-friendly country. Renewable energy has the advantage of minimizing environmental damage [4], but its internal rate of returns (IRR) is relatively low with respect to higher risks [5]. Nonetheless, renewable energy continues to have considerable potential, as it enables cost reduction through learning by doing [6]. Therefore, any deficiencies can be overcome if suitable amount of subsidies are provided early.
By contrast, a considerable amount of subsidies have also been provided for fossil fuels in Korea for industrial support, energy welfare, and economic activation. Fossil fuel subsidies have been the largest challenge to countries’ ability to respond to global climate change, because they distort the energy market by encouraging unnecessary fossil fuel consumption and, thereby, increase CO2 emissions [7]. Specifically, the proportion of coal and oil in Korea’s final energy consumption in 2018 amounted to 64.1% [3]. Due to the high social cost imposed by fossil fuel subsidies, many studies have analyzed the reform of fossil fuel subsidies and its economic, environmental, and social impacts. Whitley and van der Burg [8], for instance, suggested the types of costs incurred as a result of fossil fuel subsidies from economic, social, and environmental perspectives: considerable burden on government budgets, continued inequality and limited access to inexpensive energy (deepening inequality), weakened competitiveness of the economy and low-carbon industries, increased risks related to stranded assets, weakened energy security, damage to public health caused by worsening air pollution, and denial of carbon price signals.
Some studies explored the impact of changes in fossil fuel subsidy policies in specific countries. In their studies, Li et al. [9] found that GDP increases by up to 0.65% and carbon emissions reduce by up to 6% when petroleum and gas subsidies were removed in Malaysia, and Wesseh et al. [10] analyzed that environmental quality improves by 1.9% due to the removal of fuel subsidies in Ghana. However, Gelan’s study [11] showed that transfer compensation is needed to accompany the reduction of fossil fuel subsidies in Kuwait because it leads to a decline in GDP. Bazilian and Onyeji [12] found that abolishing fossil fuel subsidies causes a decline in the competitiveness of firms, household income, and economic growth. Siddig et al. [13] analyzed the economic impact of eliminating fossil fuel subsidies in Nigeria and confirmed that the negative impact on households can be mitigated by supporting low-income households with the income from subsidy cuts. Recently, Aniello et al. [14] investigated the economic impacts of environmental friendly techniques by implementing the German renewable energy law in North-Rhine Westphalia (NRW). Brożyna et al. [15] studied renewable energy ratio and consumption to meet the 2020 European Union (EU) targets for Czech Republic and Slovakia.
In Korea, studies have estimated the scale of fossil fuel subsidies and the effects of their abolition. For instance, Kim et al. [16] estimated the scale of fossil fuel subsidies in Korea and analyzed the effect of removing them. Kang et al. [17,18] estimated the scale of environmentally harmful subsidies that accelerate the emission of air pollutants such as particulate matter, nitrogen oxide, and volatile organic compounds, and GHGs. On the other hand, environmentally friendly subsidies including renewable energy generation, development and improvement contribute to air quality improvement and reduce GHG emissions for the energy and power sector. Lee and Hong [19] demonstrated that transportation fuel subsidies have a positive impact on income distribution by improving income inequality for trucking industry workers. Hahn [20] estimated the pollutant damage costs arising from the diesel and liquified petroleum gas (LPG) consumption of commercial trucks and proposed stepwise reform plans to phase out subsidies to diesel for five years. Lee et al. [21] proposed a policy of purchasing and disposing of licenses by the government, a policy to convert subsidies to income support, a safety remuneration system, and a policy to support the purchase of eco-friendly trucks as measures to reform transportation fuel subsidies. Hong et al. [22] suggested that transportation fuel subsidies be reduced or abolished to decrease the market share of trucks, and that logistics costs be adjusted to reflect reality.
Since fossil fuel subsidies are obstacles to the path to low-carbon society, it is obvious that their removal and reform will accelerate the development of renewable energy. In this regard, studies have been conducted on converting fossil fuel subsidies to renewable energy subsidies. Ouyang and Lin [23] estimated the scale of fossil fuel subsidies in China and showed that it is possible to increase clean energy consumption and improve energy efficiency by reducing fossil fuel subsidies and providing subsidies for renewable energy. Chartri et al. [24] analyzed the economic effect and changes in the output of electricity by each source when the financial resources generated by reducing subsidies for natural gas for power generation and imposing consumption tax on electricity are used to subsidize renewable energy in Malaysia. Bae [25] analyzed the effect of removing coal subsidies and converting them to biomass production subsidies using the CGE model in Korea, and found that the subsidy conversion decreased GHG emissions by approximately 12% despite an approximately 2.3% reduction in GDP. This study also showed that converting coal subsidies to renewable energy production subsidies is better than creating demand for renewable energy by increasing public expenditure, in terms of GDP loss, changes in welfare, and cost-effectiveness of GHG reduction, even though the study only reviewed biomass among renewable energy sources and coal among fossil fuel sources. To the best of our knowledge, no study has investigated the economic link between increasing renewable energy subsidies and phasing out fossil fuel subsidies in Korea, even though implementing Korea’s energy strategies will necessitate significant amount of public expenditure.
This study examines renewable energy support policies and the status of fossil fuel/renewable energy subsidies in Korea, and analyzes the ripple effect of phasing out fossil fuel subsidies and expanding renewable energy subsidies. The study also measures the economic effects and CO2 emissions arising as a result of redistributing the additional government revenue generated by phasing out fossil fuel subsidies. This study constructs a CGE model that delineates the energy sources of the electric power sector, and compares the economic and environmental ripple effects based on both the fossil fuel subsidy abolition level and the provision of renewable energy subsidies. The research results provide implications for establishing subsidy policies in the energy sector to expand the proportion of renewable energy and construct sustainable energy systems.
2. Energy Support Policies
2.1. Fossil Fuel Support Policies and Subsidies
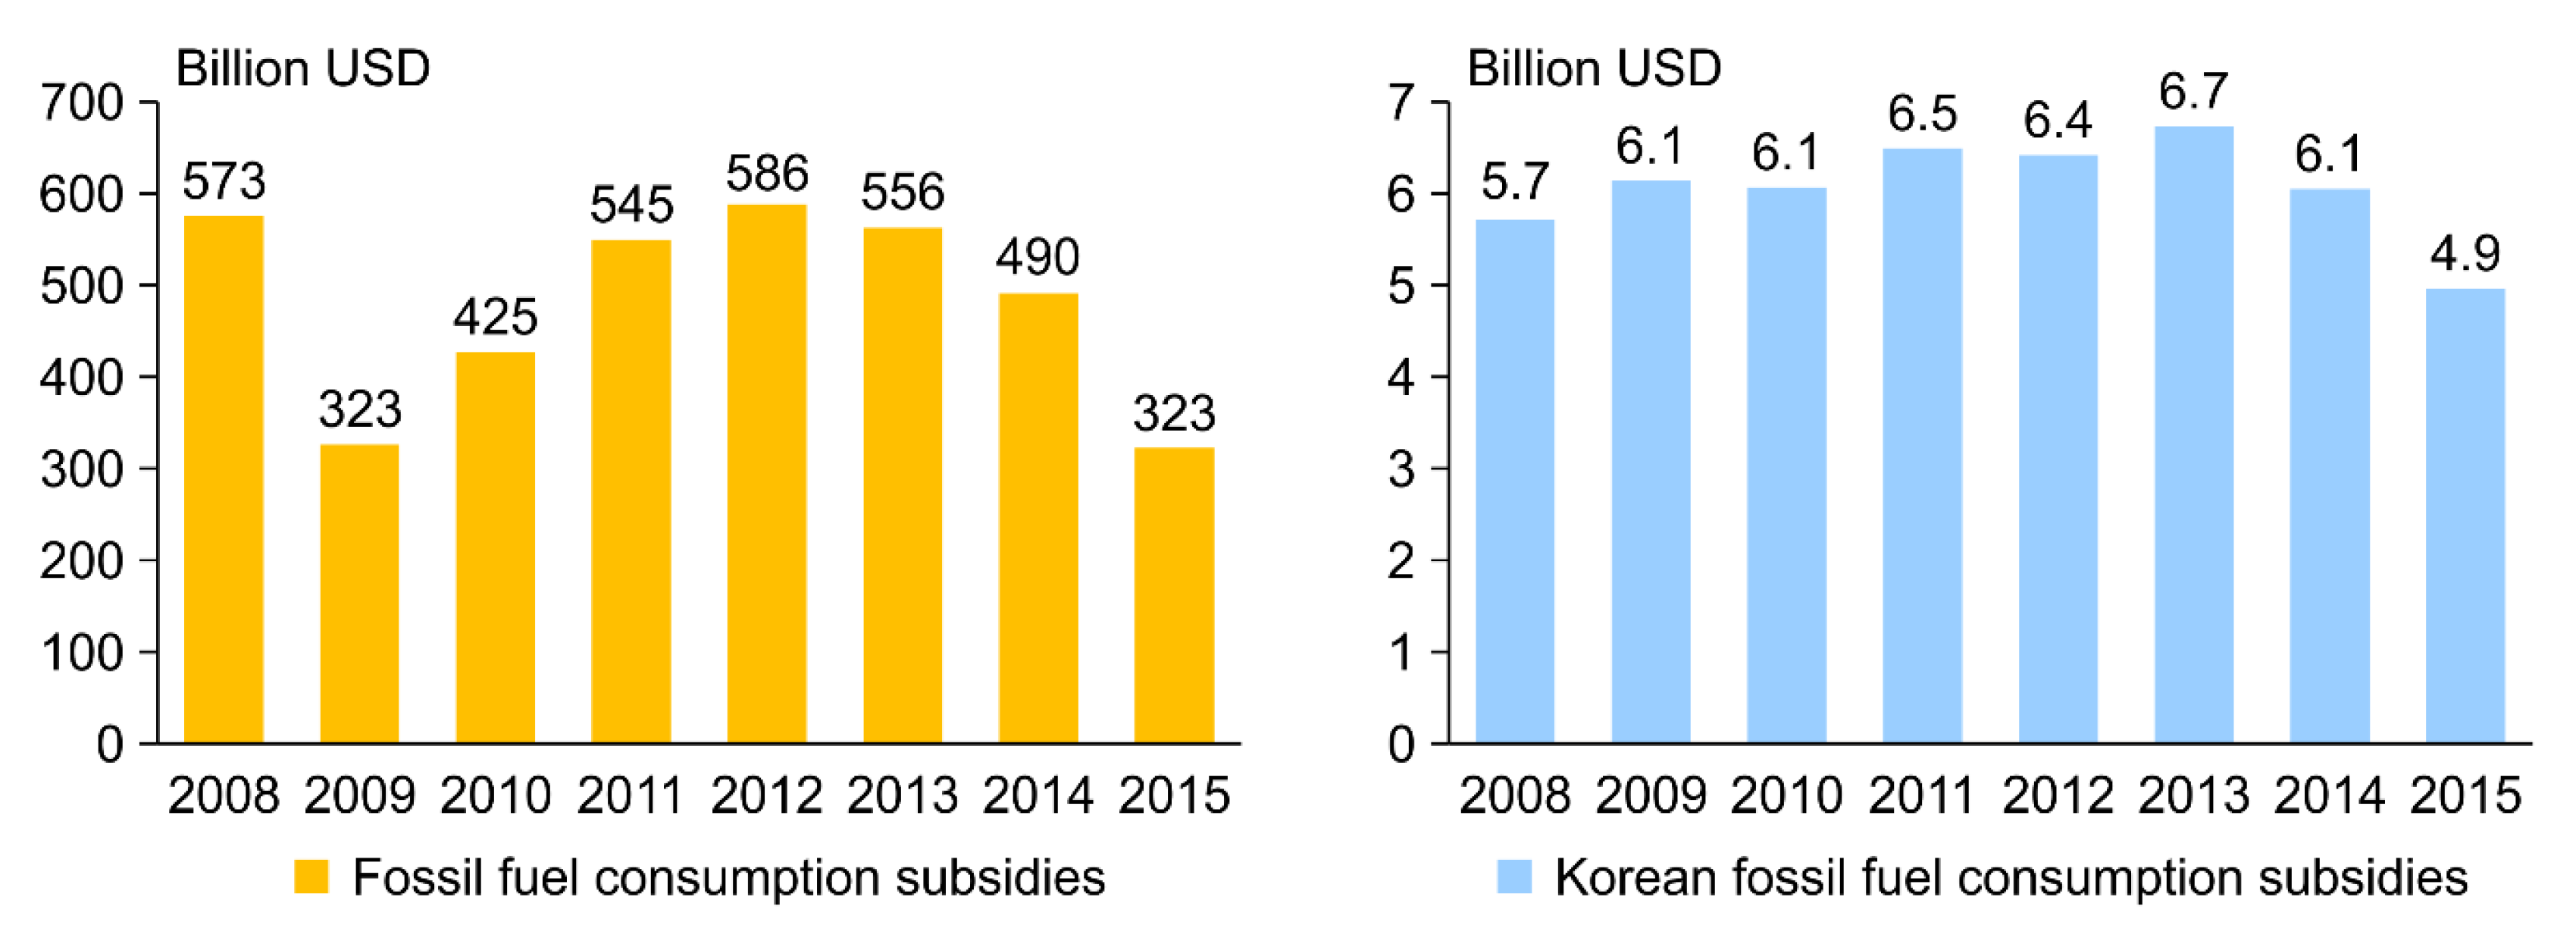
Fossil fuel subsidies have been gradually phased out worldwide, and many countries have initiated the reform of fossil fuel subsidies. The Sustainable Development Goals determined at the UN General Assembly in 2015 rationalized inefficient fossil fuel subsidies. Figure 1 shows the magnitude of global and Korean fossil fuel subsidies from 2008–2015. The scale of global fossil fuel subsidies decreased from USD 500 billion in 2014 to USD 325 billion in 2015 and further to USD 260 billion in 2016 [26,27], whereas Korean fossil fuel subsidies tended to increase until 2013 and then decreased to USD 4.9 billion in 2015 [16].
Regarding the fossil fuel subsidy and tax exemption policies of the Korean government, the OECD stated that such policies: (1) may increase CO2 and pollutant emissions by encouraging fossil fuel consumption; (2) violate the polluter-pays principle; (3) may impose a burden on future generations due to environmental and health damage. The Korean government established a plan to abolish subsidies for stable coal production and briquette manufacturing by 2020—the “Fossil Fuel Subsidy Abolition Plan” was shared at the 2010 G20 Summit held in Seoul [28]. Subsidies for stable coal production were abolished in 2010 as planned, but discussions on the abolition of subsidies for briquette manufacturing were interrupted over a concern that the abolition would cause damage to low-income households due to a rise in the cost of briquettes.
Table 1 shows Korean fossil fuel subsidies in 2015, which were reconstructed to delineate coal and oil subsidies based on the results of the study by Kim et al. [16]. Fossil fuel subsidies consist of direct and implicit subsidies. Direct subsidies include coal mine, bituminous coal, and oil subsidies, and support for anthracite coal generation. Implicit subsidies include oil tax exemption for agriculture and fishery as well as for self-generators on islands, surtax exemption for bituminous and anthracite coal, a fuel cost support project for low-income people, and tax exemption for power generation bituminous coal and power generation anthracite coal. The total fossil fuel subsidies in 2015 amounted to USD 4.9 billion. Among them, subsidies for coal (coal, coke, and hard coal) were USD 1.7 billion, and subsidies for oil (crude petroleum, gasoline, diesel, kerosene, and bunker) were USD 3.2 billion. Among the subsidies for coal, tax exemption for power generation bituminous coal (USD 1.5 billion) accounted for the largest proportion, at 83.5%. Oil subsidies were USD 3.2 billion. Transportation fuel subsidies (USD 2.1 billion) represented 65.0% of the oil subsidies and 42.1% of the total fossil fuel subsidies.
Among the Korean fossil fuel subsidies, transportation fuel subsidies are particularly controversial. Transportation fuel subsidies support all or part of the tax imposed on oil for transport service providers, transport franchisees, or entrusted/consigned truckers based on the “Truck Transportation Business Act.” In the case of commercial trucks, subsidies are provided for diesel and LPG only. Transportation fuel subsidies account for the largest proportion (42.1% as of 2015) among all fossil fuel subsidies, while the diesel consumption of trucks that receive oil subsidies accounts for 40% of the total diesel consumption by trucks; here, it is noteworthy that diesel trucks are the largest on-road mobile pollution source. [20]. Consequently, many countries have tended to reduce support for diesel due to its considerable external effects [28]. Meanwhile, one opinion is that abolishing transportation fuel subsidies will not significantly decrease diesel consumption unless accompanied by a sharp increase in diesel price, because the diesel consumption of trucks is extremely inelastic. Another opinion is that it is difficult to abolish transportation fuel subsidies immediately considering the creation of jobs in or economic contributions of the logistics industry, in which transportation fuel subsidies represent a large proportion of the income of commercial truck owners [20]. Therefore, one study proposed the purchase and disposal of licenses by the government, conversion of subsidies to income support and a safety remuneration system, and support for the purchase of eco-friendly trucks as measures to reform transportation fuel subsidies [21]. Thus, abolishing transportation fuel subsidies is necessary but requires realistic supplementary measures.
2.2. Policies and Subsidies for Supporting Renewable Energy
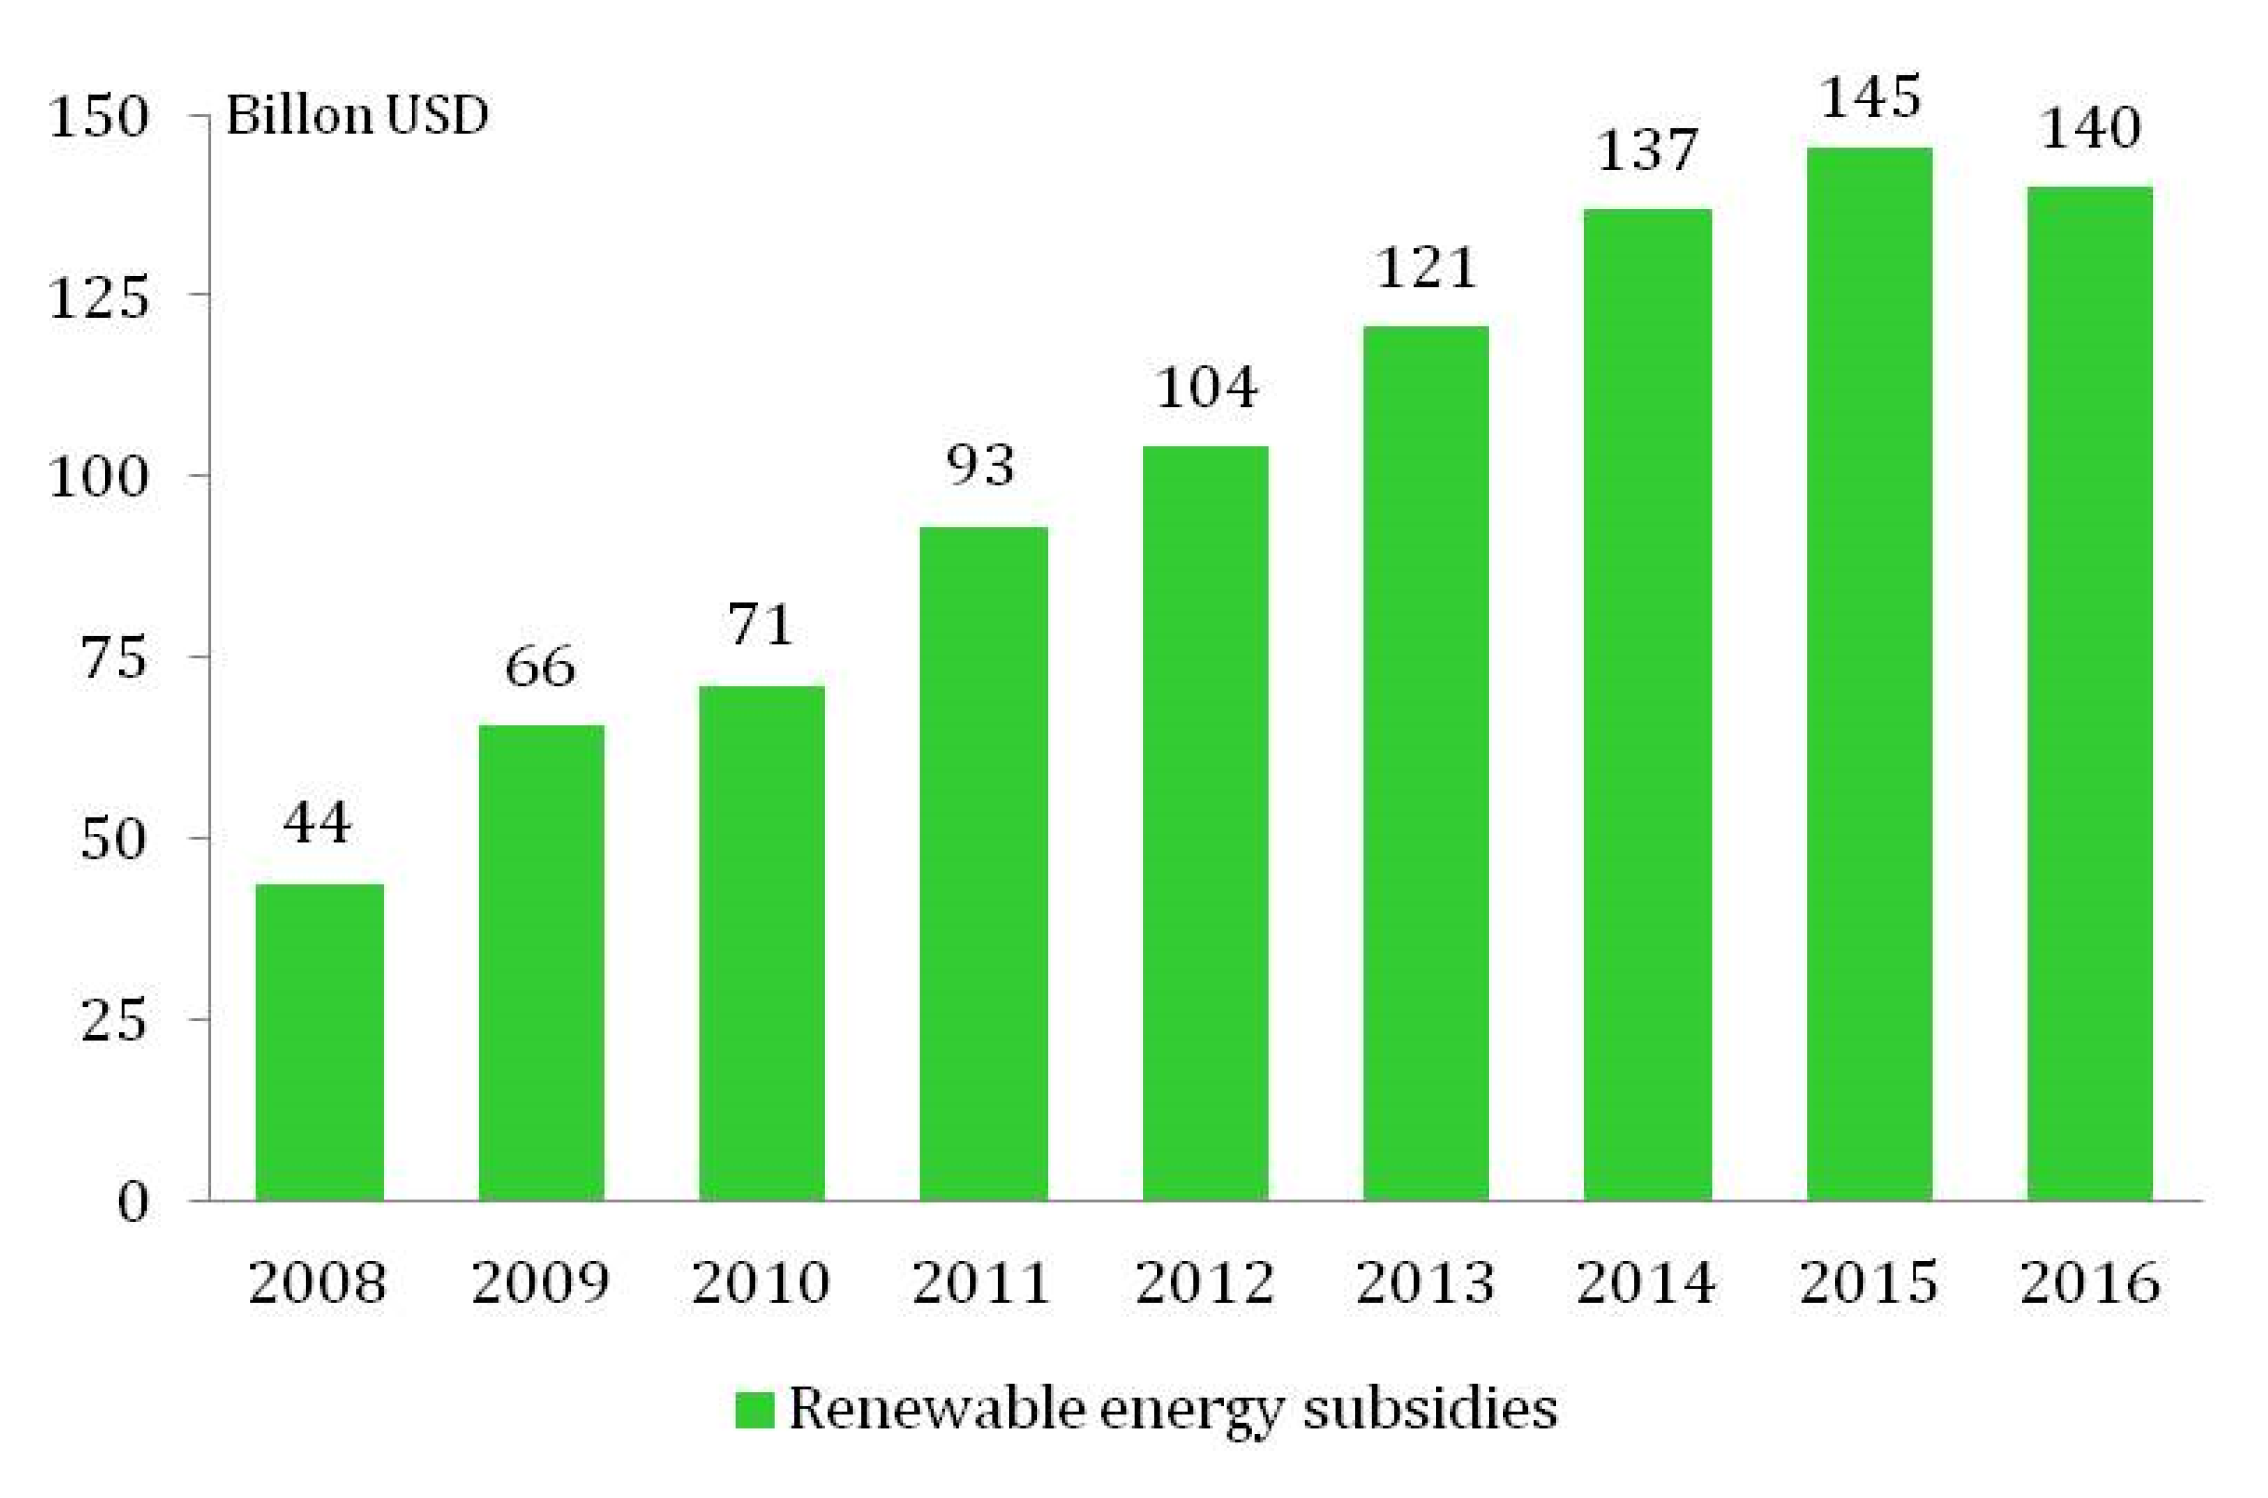
In Figure 2, global renewable energy subsidies have increased generally but decreased slightly in 2016. They amounted to USD 150 billion in 2015 and USD 140 billion in 2016. They were supported primarily from the budget, through feed-in tariffs that compensate for the difference between the cost of renewable energy generation and the electricity cost paid by consumers [1]. In Korea, renewable energy subsidies are supported through renewable energy supply subsidies, feed-in tariffs, and renewable energy certificate (REC) transaction amounts. The Korea Energy Agency provides subsidies for installing photovoltaic systems on the rooftops of homes and buildings. Korea Electric Power Corporation and the Korea Power Exchange have launched feed-in tariff programs for solar power generation with high production costs. Renewable energy subsidies in Korea have increased annually, from USD 1.5 billion in 2016 to USD 1.7 billion in 2017 and USD 2.2 billion in 2018. Photovoltaic subsidies accounted for the largest proportion, increasing from USD 0.8 billion in 2016 to USD 0.9 billion in 2017 and USD 1.0 billion in 2018.
Moreover, the Korean government set a goal of increasing the proportion of renewable energy to 20% and the installed capacity to 63.8 GW by 2030 as part of its “Renewable Energy 3020 Plan” [3], under which the focus on renewable energy sources—previously oriented to waste and biomass—will witness a strategic shift to solar and wind power. Additionally, the Plan would be put into practice with the participation of residents rather than outsiders or entrepreneurs, and large-scale renewable energy projects would be developed. In relation to the renewable energy R&D roadmap, cost reduction and the pursuit of advanced technologies were set as short-term goals, and the pre-emption of next-generation technologies was set as a long-term goal. Further, the “Third Energy Master Plan” [29] set a goal of increasing the proportion of renewable energy to 30–35% by 2040, with renewable energy industries being promoted as future growth engines. In addition, the “Plan to Strengthen Competitiveness for Renewable Energy Industry” [30] was promulgated to strengthen the global technological competitiveness of Korea’s renewable energy industries and to expand the foundation for growth. Additionally, the “green new deal” portion of the recently announced “New Deal Comprehensive Plan” [4] announced the expansion of large-scale R&D, verification projects, and equipment supply, for the growth of new and renewable energy industry ecosystems centered on solar power and wind power. Therefore, it is expected that solar and wind power generation will grow to 26.3 GW by 2022 and 42.7 GW by 2025.
3. Methodology and Data
3.1. Computable General Equilibrium Model
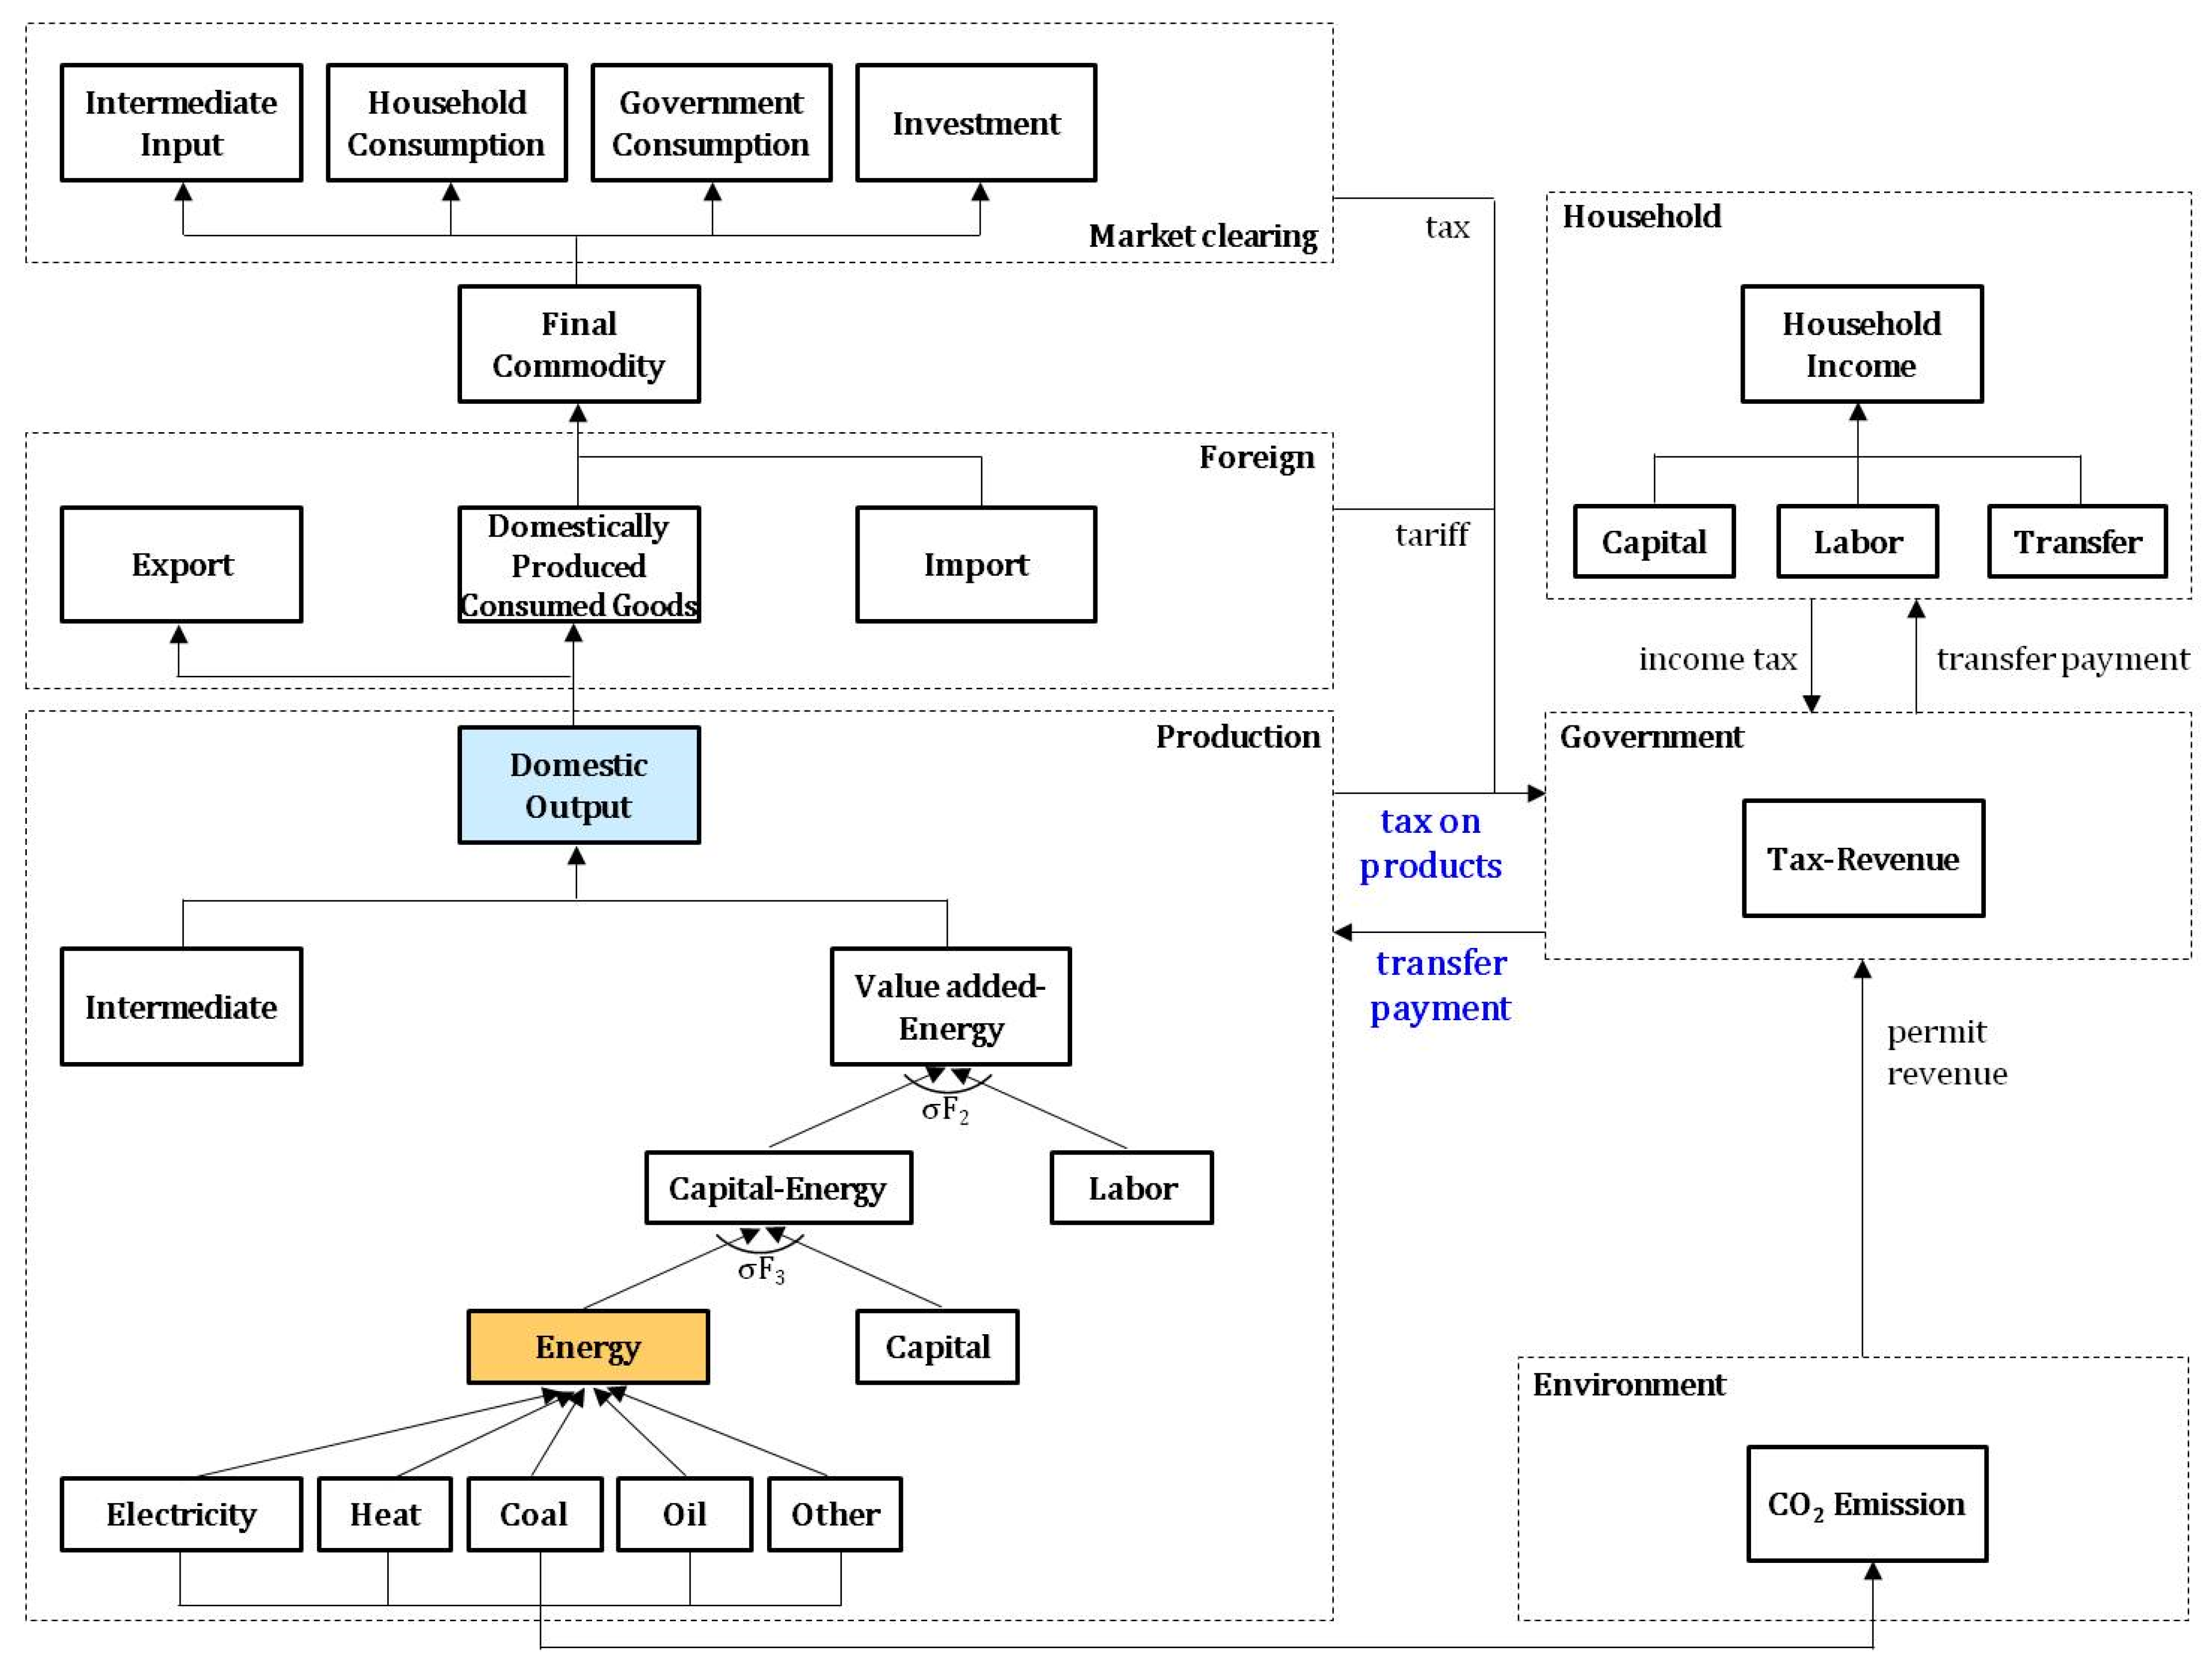
Reducing or expanding subsidies for specific energy sources affects its consumptions, as well as the demand for energy substitutions or energy composites, CO2 emissions, and the overall national economy. To analyze the effects of changing energy subsidy policies on the overall national economy and CO2 emissions, the CGE model can be utilized. This model framework has been commonly used for economic or trade policy analysis since the 1980s, but it has recently been utilized for various objectives, including environmental policy analysis [31]. Implementing energy policy may affect the economic indicators and other socio-economic variables in many cases, and the CGE model has great merit in considering the interdependencies between these variables [32]. Hence, this study analyzed the effects of reducing and abolishing Korean fossil fuel subsidies and utilizing the subsequent government revenue for the expansion of renewable energy subsidies within the Korean economy and the reduction of CO2 emissions using a single-country CGE model that endogenized CO2 emissions and constructed the structure of the emission market. In this study, a CGE model was constructed that was composed of production, consumption, government, savings and investment, and foreign sectors [31].
Figure 3 shows the structure of a typical CGE model and the flow of goods and services between producers, households, the government, and foreign sectors—which are economic subjects—and the changes caused by policy variables. If specific energy subsidies are reduced, the related industry experiences the same effect as having to pay tax in proportion to production. This will change the production volume and price of the energy source, thereby affecting the supply and demand of the energy composite (consisting of all energy sources). It will also change the production volume in all industries that use the energy, resulting in changes in CO2 emissions at the national level. In addition, changes in domestic output will change imports and exports, thereby affecting the final consumption of households and the government as well as changing the demand for labor and capital, which are substitute input elements for the energy composite. The effects of such exogenous policy changes on the overall economy can be measured through changes in macroeconomic variables such as GDP, while their impact on changes in CO2 emissions can be measured by endogenizing CO2 emissions in the model.
The CGE model consists of equations that express the optimized decision-making of each economic subject based on the Walrasian paradigm [33]. In this study, the production sector was divided into 30 industries, and each industry was assumed to produce one product. The production sector is composed of the equilibrium conditions derived through cost minimization. The production block in Figure 3 shows the multi-level production process by which an output is produced; the energy sector is expressed in more detail than in Figure 4. In the final step, the value added-energy composite is combined with the intermediate product, which is the final product of other industries, through Leontief function, to produce the output. In relation to the production of the value added-energy composite, the energy composite is produced first through the combination of 16 energy sources. The energy composite combines with capital to produce the capital-energy composite, which combines with labor to produce the value added-energy composite. Constant elasticity substitution (CES) was applied to all sub-steps to produce the value added-energy composite.
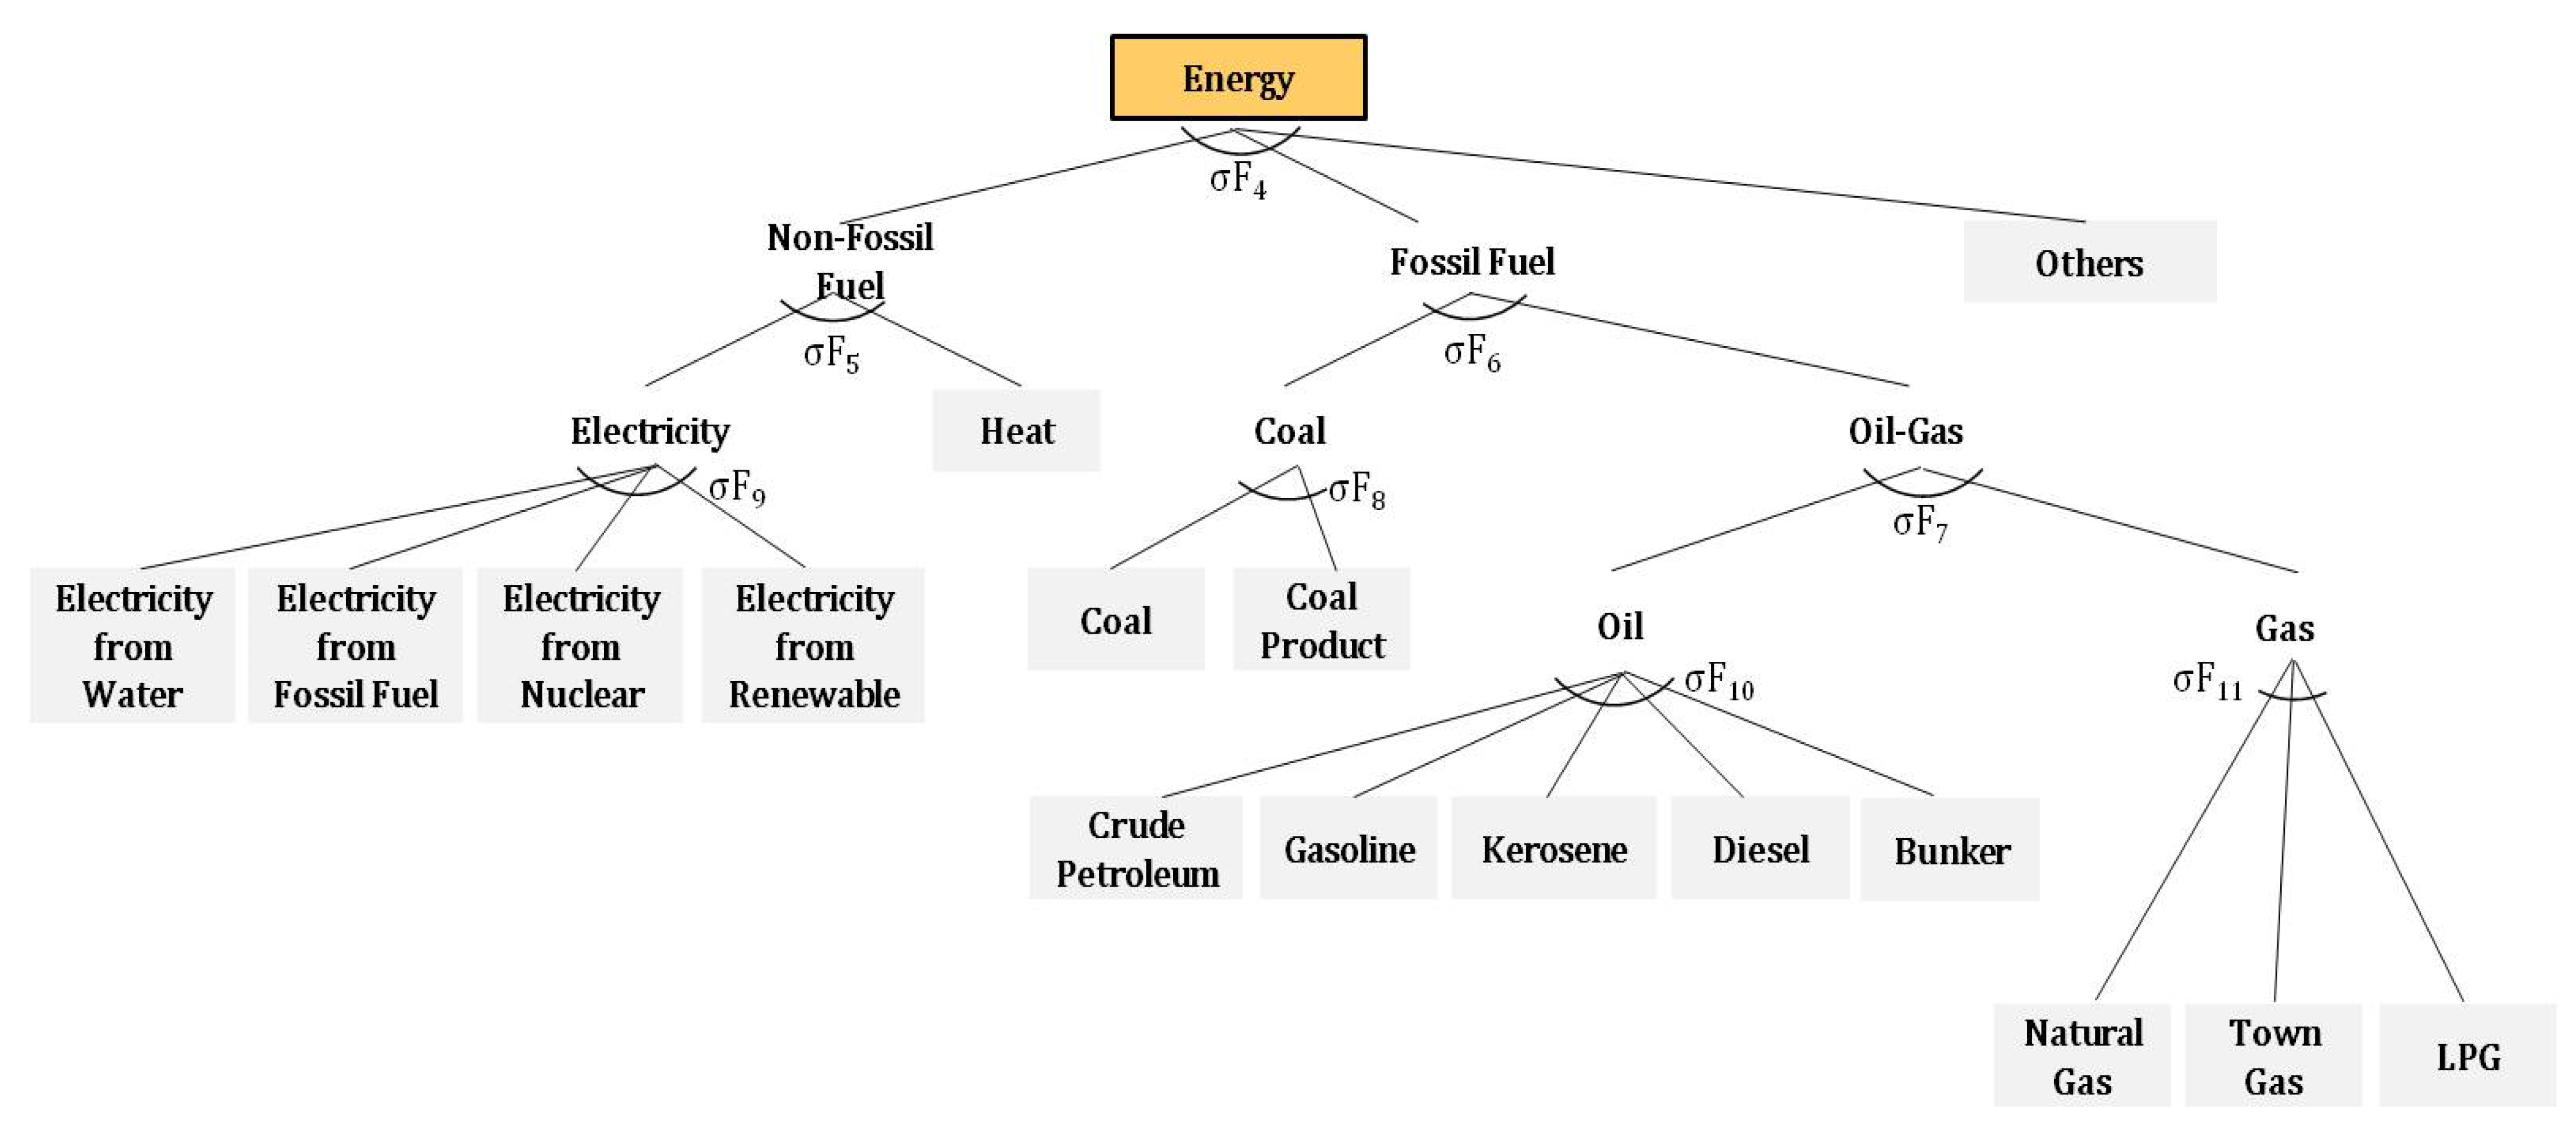
Figure 4 shows the nesting structure in which 16 energy sources produce the energy composite. Electricity was divided into four sources according to its characteristics, and other energy sources were also subdivided into twelve energy sources (shaded blocks). Through this structure, it is possible to identify the substitution among energy sources resulting from the reduction and abolition of fossil fuel subsidies and the expansion of renewable energy subsidies [24]. All 16 energy sources are CO2 emission sources, and emissions from each industry are determined by the consumption of individual energy sources.
For the production-side, the input demand function is derived by the solution of optimization process and cost minimization problems for producers [31]. For example, optimization in the value added-energy composite production step, in which the energy-capital composite is combined with labor, can be expressed as:
where is the cost function, represents industries, is the price of the energy-capital composite, is the energy-capital composite input, is the tax rate of labor, is the price of labor, is the labor input, is the output, is the efficiency parameter in the CES function, is the elasticity of substitution, and , is the distribution parameter.
Meanwhile, the producer earns no excess profit under perfect competition, and marginal revenue equals output price. Perfect competition also means that marginal cost equals average cost. Therefore, output price equals average cost, and the producer’s revenue equals cost [32,34]. In this instance, the zero-profit condition for Equation (1) can be expressed as follows.
where is output price. This condition, along with the cost minimization condition of the producer, determines the amounts and prices of input elements.
In the value added-energy composite production step, the zero-profit condition is as shown in Equation (3). Imposing taxes and reducing subsidies are identical in terms of their practical effects. When a tax rate () is imposed in proportion to the output of the industry (), the income of the producer decreases by . By contrast, when subsidies are provided by the government in proportion to the output, the income of the seller will increase. Hence, the tax and the government transfer can be understood as opposite signs. Therefore, the abolishment of subsidies can be reflected in the CGE model by decreasing the income of the seller (), and the provision of subsidies can be reflected by increasing the income of the seller (), as with applying tax. This is the same principle that was applied in the study by Paltsev et al. [35], in which the government’s income from the sale of emission permits was treated as government tax revenue at par with other taxes, and the value of the emission permits allocated free of charge was applied to the model as a transfer to the producer from the government.
where is the price of the value added-energy composite, is the value added-energy composite input, is the coefficient of intermediate commodity demand, is the permit price, and is the initial free allocation permit. The tariffs or import charges imposed on the import of energy sources can be reflected in the model from the same perspective. If a tariff is imposed at a rate of , the import price in the base year, , increases to , and the government tax revenue increases by (where is the volume of import). Therefore, reimposing tariffs and import charges that have been exempted, due to changes in energy subsidy policies, can be reflected in the model by changing the tariff rate.
Households represent all consumers and maximize utility under a limited budget. Household income includes the income obtained through labor and capital supply and the income transferred from the government. All disposable income, the remaining income after subtracting the consumption tax, net product tax, income tax, and savings from household income, is spent on consumer goods. In this study, the Cobb–Douglas function was used for the consumer’s utility function, and the demand function for consumer goods was derived through an optimization process.
Government income includes revenue from consumption tax, product tax, production tax, income tax, and tariffs. Government savings can be obtained by subtracting the government consumption and transfer to households from government income. The Cobb-Douglas function was used for the utility function of the government, and the demand function for government consumer goods was derived through utility maximization. The final domestic products can be exported or supplied to the domestic market and then produced as final products through a combination with imported goods. The amounts of domestic and export goods are derived through revenue maximization according to the constant elasticities of transformation (CET) function. Domestic goods produced and supplied in Korea are combined with imported goods to produce final goods. The respective demand for domestic and imported goods is derived under the cost minimization problem.
3.2. Data
3.2.1. Social Accounting Matrix
We use the social accounting matrix (SAM) to calibrate the CGE model; this matrix implies a transaction among industries and other agents. SAM is based on Korea’s input–output table, with 2015 taken as the base year (2015, basic price) [36]. As shown in Table 2, we have classified 30 industries. The energy sector was subdivided into 16 energy industries, whereas other industries were divided into 14 non-energy industries. For the income tax from households and the government transfer to households, we employed the income accounts from institutional sectors’ data on national accounts in the Korean Statistical Information Service (KOSIS) [2]. Income tax is the sum of current taxes on income, wealth, and so on, and households’ social contributions in the households (uses) item. The government transfer income refers to social benefits other than in-kind social transfers in the general government (uses) item.
If CES function is assumed in the production sector, the elasticity of substitution between production factors must be defined exogenously. For the step in which the value added-energy composite is produced through the combination of the capital-energy composite and labor () and the step in which the capital-energy composite is produced through the combination of the energy composite and capital (), the elasticity values estimated by Kwon et al. [37] were applied. For the step in which electricity is generated from the four electricity sources () and the step in which electricity and heat energy produce non-fossil fuel (), the elasticity of substitution is 0.5 [38]. For the step in which coal and oil-gas produce fossil fuel () and the step in which oil and gas produce oil-gas (), the elasticity values are 0.3 and 2.0, respectively [39]. The elasticity of substitution is 0.5 for the step in which non-fossil fuel, fossil fuel, and others produce energy (), and it is 1.0 for the remaining steps (, , and ) [35].
3.2.2. CO2 Emissions Per Energy Input
In this study, the results derived by Park et al. [40] were applied to derive the emissions per energy input (tonCO2eq/USD 1000). These values were derived by dividing the emissions (tonCO2eq) for each industry by the energy input (USD 1000) for each industry. CO2 is emitted according to the amount of fossil energy consumed by each industry, while indirect emissions are not calculated.
4. Analysis
4.1. Scenarios
In this study, scenarios were constructed based on different levels of reduction in Korean fossil fuel subsidies and the conversion of the subsequent government surplus funds to renewable energy subsidies. The partial or complete abolition of fossil fuel subsidies was considered as an option for each scenarios, and whether the surplus funds generated by abolishing fossil fuel subsidies was converted to renewable energy subsidies or left as government income was set as another option. Accordingly, three scenarios were set based on the fossil fuel subsidies in 2015 (Table 3). In scenario 1, subsidies for stable coal production and briquette manufacturing, which were promised by the Korean government in 2020, are abolished along with other briquette subsidies, except for the fuel cost support project for low-income people. The scale of scenario 1 is USD 1.7 billion. Specifically, subsidies provided in the production, manufacturing, and sales stages of coal and coal products are abolished, and the exempted taxes are imposed again (scale of USD 0.4 billion). In addition, the tariffs and import charges exempted in the import stage of bituminous coal are imposed again (scale of USD 1.3 billion). In scenario 2, the fossil fuel subsidies abolished in scenario 1 (USD 1.7 billion) are converted to renewable energy subsidies. In scenario 3, all fossil fuel subsidies (USD 4.9 billion) are abolished and converted to renewable energy subsidies. Government income increases in scenario 1, because the reduced fossil fuel subsidies are not invested in other industries. Government tax revenue remains neutral in scenarios 2 and 3, because the abolished fossil fuel subsidies are converted to renewable energy subsidies.
4.2. Results
4.2.1. Economic Impact
Table 4 shows the effect of reducing fossil fuel subsidies on the Korean economy by scenario. Reducing or abolishing fossil fuel subsidies had a negative effect on the overall economy. This is because reducing or abolishing subsidies for fossil fuels, which are input elements of production, reduces the production of fossil fuels, which consequently affects the production of industries as well as other economic subjects, such as consumption and overseas sectors, through substitutional relations with other energy sources or input elements, such as labor and capital. Except for government consumption in scenario 1, GDP, consumption, investment, exports, and imports decrease in all scenarios. Government consumption increases in scenario 1 because government income increases due to the reduction in fossil fuel subsidies. As the increase in government consumption is offset by a reduction in household consumption, investment, exports, and imports, GDP decreases by 0.04%. In scenario 2, household consumption, investment, exports, and imports reduce less compared to scenario 1 because the fossil fuel subsidies reduced in scenario 1 are invested as renewable energy subsidies, thereby recycling government resources. Since government tax revenue, which increased in scenario 1, remains neutral, the GDP loss is higher in scenario 2 (−0.05%) than in scenario 1 (−0.04%). A comparison of the results of scenarios 1 and 2 shows that the negative effect on the economy can be reduced by converting the reduced fossil fuel subsidies to renewable energy subsidies, that is, through government revenue redistribution. In scenario 3, all fossil fuel subsidies are abolished and converted to renewable energy subsidies, which further increases the negative effect on the economy. The real GDP decreases by 0.14% because final consumption, investment, imports, and exports decrease. In scenario 3, in particular, abolished transportation fuel subsidies causes a significantly large impacts on the economy comparted to discontinue subsidies for the coal industry. Therefore, the reduction in the output of oil industries has a larger negative effect on the economy despite the redistribution of renewable energy subsidies.
In addition, Table 4 shows the changes in domestic CO2 emissions by each scenario. The reduction and abolition of fossil fuel subsidies lead to a decrease in CO2 emissions. In scenarios 1, 2, and 3, CO2 emissions decrease by 7.0, 6.9, and 8.5%, respectively. When these are considered together with the real GDP changes in the scenarios presented in Table 4, the changes in CO2 emissions compared to the real GDP changes are −7.0, −6.9, and −8.4% for scenarios 1, 2, and 3, respectively. Thus, scenario 3 exhibits the largest reduction in CO2 emissions with only small decreases in the real GDP reduction.
Table 5 shows the outputs and shares of the industries in the energy sector. In the reference year, 2015, outputs are USD 49.6 billion, 3.9 billion, 0.8 billion, 41.1 billion, 26.2 billion, and 31.5 billion, for electricity, heat, coal, oil, gas, and others, respectively. In scenario 1, the output of coal industries decreases by 66.2% (i.e., USD 0.3 billion) and the outputs of other energy sources also slightly decrease (electricity −2.3%, heat −0.7%, oil −1.4%, gas −2.6%, and others −0.7%), resulting in a 2.1% decrease (i.e., USD 149.9 billion) in total output in the energy sector. In scenario 2, the output of coal industries decreases by 66% (i.e., USD 0.3 billion), but the reduction in the output of electricity (i.e., −0.1%, USD 49.6 billion) is smaller compared to scenario 1, as the abolished fossil fuel subsidies are invested in renewable energy industries. The reduction in the outputs of the other energy sources is also lower compared to scenario 1 (heat −0.3%, oil −1.2%, gas −2.4%, and others −0.4%), resulting in a 1.2% decrease (i.e., USD 151.3 billion) in total output in the energy sector. In scenario 3, the reduction in the output of coal industries decreases by −68.3% (i.e., USD 0.3 billion) as fossil fuel subsidies are completely abolished and invested in renewable energy industries, and the output of oil industries decreases by 22.2% (i.e., USD 31.9 billion) due to the abolition of oil subsidies. The output of electricity industries increases by 1.9% (i.e., USD 50.6 billion) as larger subsidies are invested in renewable energy compared to the other scenarios. However, due to the abolition of fossil fuel subsidies, the outputs of the other energy sources decrease (heat −3.0%, gas −3.3%, and others −0.6%), resulting in a 6.5% decrease (i.e., USD 143.2 billion) in total output in the energy sector.
The share in the total energy sector was examined based on the sectoral output. In the base year, the proportions of each energy source are 32.4% for electricity, 2.5% for heat, 0.6% for coal, 26.8% for oil, 17.1% for gas, and 20.6% for others. In all three scenarios, the proportion of the output of coal industries in the total output of the energy sector significantly decreases to 0.2 due to the abolition of coal subsidies. However, the proportion of electricity increases to 32.8 and 35.3% in scenario 2 and 3, respectively, due to the expansion of renewable energy subsidies. The proportion of oil decreases to 22.3% in scenario 3 due to the abolition of subsidies. There is no difference in heat, gas, and others, due to no direct subsidy nor abolition of its subsidy.
If the output of energy industries, which is the input element of production, decreases, demand for other input elements increases, leading to an increase in the price of the input elements. This is the economic cost of abolishing fossil fuel subsidies, and it appears as a decrease in macro-economic variables such as GDP. However, abolishing fossil fuel subsidies must not be judged by the economic impact alone, because it leads to a reduction in CO2 emissions through reduced fossil fuel consumption and expanded renewable energy.
4.2.2. Electricity Perspective
Table 6 shows the sectoral output, share, and CO2 emission change for each electricity source (water, fossil fuel, nuclear, and renewable). In the reference year, 2015, total outputs of electricity are USD 49.6 billion and can be divided into its sources; water (USD 0.7 billion), fossil fuel (USD 35.4 billion), nuclear (USD 11.0 billion), and renewable (USD 2.5 billion). The output of electricity by fossil fuels decreases due to the abolition of subsidies −2.8%, −2.3%, and −3.2%, in scenario 1, scenario 2, and scenario 3, respectively. The expansion of renewable energy subsidies leads to a significant increase in the output of electricity by renewable energy, 35.6% (USD 3.3 billion) and 91.9% (USD 4.7 billion), in scenario 2 and scenario 3, respectively. The outputs by water and nuclear sources decrease slightly. Due to the discontinuing fossil fuel subsidies, the total electricity output is shown that 2.3% decrease, which is equivalent to USD 48.5 billion, in scenario 1. Since abolished subsidies are transferred to support renewable energies in scenario 2 and 3, the level of total electricity outputs are increased by USD 49.6 billion, which is equivalent to the reference year level, and USD 50.6 billion in scenario 2 and 3, respectively. Changes in electricity output by three different scenarios should impact price of electricity in domestic market. Decreased total electricity output in scenario 1 leads 2% increase in the market price. However, dramatic increase in electricity output by expansion of renewable energy in scenario 3 leads to decrease 2% of electricity price in the domestic market.
The energy mix in Korea is reformed when it shifts from scenario 1 to 3—the ratio of electricity provided by fossil fuel sources is reduced while that by renewable energy sources is increased. Owing to these changes, CO2 emissions from the use of fossil fuels for power generation decrease by 8.6–9.2%. As the use of renewable energy for power generation also generates CO2 emissions in small quantities, CO2 emissions increase if the output of electricity by renewable energy increases. The ratio of the reduction in CO2 emissions to the reduction in the output of electricity is 6.5%, 8.6%, and 10.9% for scenarios 1, 2, and 3, respectively. The value increases with the latter scenarios, because the proportion of the fossil fuel source decreases while that of the renewable source increases in the electricity source configuration. Moreover, the ratio of CO2 emissions to the output of electricity by source in the base year is 6.2 tCO2eq/thousand USD for the fossil fuel source, 0.03 tCO2eq/thousand USD for the nuclear source, 0.02 tCO2eq/thousand USD for the renewable source, and 0.01 tCO2eq/thousand USD for the water source, with fossil fuels having the highest value. Therefore, the total CO2 emissions in the electricity sector decrease as the proportion of the fossil fuel source decreases and that of renewable energy increases.
5. Conclusions
In Korea, several energy policies have been established to expand renewable energy use and construct sustainable low-carbon energy systems. Additionally, subsidies have been continuously provided for the growth of renewable energy industries. However, a considerable amount of subsidies have also been provided to fossil fuels for welfare, industrial protection, and economic activation. Since fossil fuel subsidies serve as obstacles to the construction of low-carbon energy systems, by accelerating fossil fuel consumption and increasing CO2 emissions, the abolition of fossil fuel subsidies has been continuously discussed. Although the Korean government established a policy to abolish coal subsidies by 2020, the policy could not be implemented. As abolishing fossil fuel subsidies can expand renewable energy, it is suggested that the financial income generated by reducing fossil fuel subsidies be converted to subsidies for renewable energy industries. Therefore, this study examined the policies of the Korean government to support renewable energy and the status of subsidies for fossil fuels and renewable energy. In addition, the effects of phasing out fossil fuel subsidies and expanding renewable energy subsidies on the economy and CO2 emissions were analyzed. In addition, we attempted to analyze the impacts of discontinuing fossil fuel subsidies in Korea to find the way toward a low carbon society. The general idea is that abolishing fossil fuel subsidies may have positive influences on reducing carbon emissions and constructing a sustainable energy system by introducing a significant energy-tax structural reform. Compared to previous studies, it is clear that findings of this research represent the most updated and dynamic structural changes of the energy sector in Korea. Based on the main analysis results, the implications are summarized as follows.
First, abolishing fossil fuel subsidies has a negative effect on macro-economic variables such as GDP. The effect increases as the scale of subsidy abolition increases. However, abolishing fossil fuel subsidies must not be judged by the economic aspect alone, because the social and environmental costs of fossil fuel subsidies are not properly reflected in this conclusion. Many studies have shown that the cost of fossil fuel subsidies is not small. Therefore, it is necessary to analyze the impact of abolishing fossil fuel subsidies from a more comprehensive perspective. In the future, a comprehensive analysis will be possible if the environmental cost incurred by fossil fuel subsidies is reflected in the analysis.
Second, when the surplus funds generated by phasing out fossil fuel subsidies are invested in renewable energy industries, household consumption, investment, exports, and imports are reduced to a lesser extent compared to when fossil fuel subsidies are simply abolished. In addition, reducing fossil fuel subsidies causes a reduction in the production volume of fossil fuels and a subsequent reduction in the output of electricity. The input of the reduced subsidies into renewable energy increases the output of electricity using renewable energy, thereby decreasing the reduction in the total output of electricity.
Third, abolishing fossil fuel subsidies reduces the proportions of coal and oil in total energy consumption, thereby decreasing CO2 emissions by 7–8%. This indicates that abolishing fossil fuel subsidies significantly reduces GHG emissions. Therefore, it is necessary to reduce or abolish fossil fuel subsidies to respond to climate change and replace such subsidies with other types of support—such as support for purchasing eco-friendly trucks and income support—to assist low-income people. Given that the complete abolition of fossil fuel subsidies—as opposed to partial reduction—brought about a larger reduction in CO2 emissions compared to the reduction in real GDP, the complete abolition of fossil fuel subsidies is important in terms of efficiency.
Fourth, reducing or abolishing fossil fuel subsidies and converting them to renewable energy subsidies has a positive effect on the electricity source configuration. In this case, the proportion of fossil fuels significantly decreases while that of renewable energy significantly increases, thereby decreasing the CO2 emissions of the electricity sector by 8–9%. Reducing or abolishing fossil fuel subsidies and expanding renewable energy subsidies may be critical to expand renewable energy and reduce CO2 emissions, which are objectives that have been articulated by the Korean government in several plans.
In future studies, the environmental impact of abolishing fossil fuel subsidies should be more comprehensively analyzed by investigating the effect on reducing air pollutants. Moreover, since fossil fuel subsidies have an income supplementation effect, further research is required on the impact of subsidy abolition on social inequality and on strategies to minimize the side effects of abolishing transportation fuel subsidies. If more studies are conducted on the environmental and social costs inherent in fossil fuel subsidies and the impact of abolishing fossil fuel subsidies is comprehensively analyzed based on such studies, more effective discussions on phasing out fossil fuel subsidies will be possible.
Author Contributions
K.P., J.H. and Y.L. contributed to the design and development of this research. K.P. analyzed the status of the electricity generation sector and developed the static CGE model. J.H. analyzed the national environmental policy and provided policy guidelines to build policy scenarios for the model. The bulk of the manuscript was written by K.P., J.H. and Y.L. All authors have read and agreed to the published version of the manuscript.
Funding
This research was funded by a National Research Foundation of Korea Grant funded by the Korean Government (NRF-2019S1A5C2A03082527). This work was supported by the Sun Moon University Research Grant of 2020.
Institutional Review Board Statement
Not applicable.
Informed Consent Statement
Not applicable.
Data Availability Statement
Data available in a publicly accessible repository that does not issue DOIs. Publicly available datasets were analysed in this study. Data can be found here: http://www.kosis.re and http://www.bok.or.kr.
Acknowledgments
The authors thank the Global Sustainable Development Economic Institute (GSEI), the Incheon Institute, and the University of California at Riverside for providing generous in-kind support to continue this research. In addition, the construction comments from four anonymous reviewers greatly helped improve this paper.
Conflicts of Interest
The authors declare no conflict of interest.
References
- International Energy Agency. World Energy Outlook; International Energy Agency (IEA): Paris, France, 2018. [Google Scholar]
- Korean Statistical Information Service. Income Account; Korean Statistical Information Service: Seoul, Korea, 2019. [Google Scholar]
- Ministry of Trade, Industry, and Energy. Basic Plan on Electricity Demand and Supply (2019~2033), 9th ed.; Ministry of Trade, Industry, and Energy (MOTIE): Sejong, Korea, 2019.
- Ministry of Economy and Finance. Korean New Deal Comprehensive Plan; Ministry of Economy and Finance (MOEF): Sejong, Korea, 2020.
- Yang, X.; He, L.; Xia, Y.; Chen, Y. Effect of government subsidies on renewable energy investments: The threshold effect. Energy Policy 2019, 132, 156–166. [Google Scholar] [CrossRef]
- Van der Zwaan, B.; Rabl, A. The learning potential of photovoltaics: Implications for energy policy. Energy Policy 2004, 32, 1545–1554. [Google Scholar] [CrossRef]
- Burniaux, J.-M.; Chateau, J. Greenhouse gases mitigation potential and economic efficiency of phasing-out fossil fuel subsidies. Int. Econ. 2014, 140, 71–88. [Google Scholar] [CrossRef]
- Whitley, S.; van der Burg, L. Fossil Fuel Subsidy Reform: From Rhetoric to Reality; New Climate Economy c/o World Resources Institute: London, UK; Washington, DC, USA, 2015; Volume 10, p. 3. [Google Scholar]
- Li, Y.; Shi, X.; Su, B. Economic, social and environmental impacts of fuel subsidies: A revisit of Malaysia. Energy Policy 2017, 110, 51–61. [Google Scholar] [CrossRef]
- Wesseh, P.K., Jr.; Lin, B.; Atsagli, P. Environmental and welfare assessment of fossil-fuels subsidies removal: A computable general equilibrium analysis for Ghana. Energy 2016, 116, 1172–1179. [Google Scholar] [CrossRef]
- Gelan, A.U. Kuwait’s energy subsidy reduction: Examining economic and CO2 emission effects with or without compensation. Energy Econ. 2018, 71, 186–200. [Google Scholar] [CrossRef]
- Bazilian, M.; Onyeji, I. Fossil fuel subsidy removal and inadequate public power supply: Implications for businesses. Energy Policy 2012, 45, 1–5. [Google Scholar] [CrossRef]
- Siddig, K.; Aguiar, A.; Grethe, H.; Minor, P.; Walmsley, T. Impacts of removing fuel import subsidies in Nigeria on poverty. Energy Policy 2014, 69, 165–178. [Google Scholar] [CrossRef]
- Aniello, G.; Tbben, J.; Kuckshinrichs, W. The Transition to Renewable Energy Technologies?mpact on Economic Performance of North Rhine-Westphalia. Appl. Sci. 2019, 9, 3783. [Google Scholar] [CrossRef] [Green Version]
- Brożyna, J.; Strielkowski, W.; Fomina, A.; Nikitina, N. Renewable Energy and EU 2020 Target for Energy Efficiency in the Czech Republic and Slovakia. Energies 2020, 13, 965. [Google Scholar] [CrossRef] [Green Version]
- Kim, J.H.; Kim, H.S.; Lee, H.J. Study on Fossil Fuel Subsidy Reform in Korea; Korea Environment Institute (KEI): Sejong, Kerea, 2017. [Google Scholar]
- Kang, M.O.; Lee, S.Y. The Environmentally Friendly Reform and its Effect of Subsidies in the Energy and Electric Power Sectors (I); Korea Environment Institute (KEI): Seoul, Korea, 2007. [Google Scholar]
- Kang, M.O.; Lee, S.Y. The Environmentally Friendly Reform and its Effect of Subsidies in the Energy and Electric Power Sectors (II); Korea Environment Institute (KEI): Seoul, Korea, 2008. [Google Scholar]
- Lee, J.; Hong, G. A Study on the Effects of Gas Tax Subsidies on Inequality of the Freight Trucking Industry. J. AKES 2007, 18, 157–185. [Google Scholar]
- Hahn, J.S. Solution to improve the gas tax subsidy to reduce pollution from freight trucks. J. Environ. Policy Adm. 2020, 28, 1–20. [Google Scholar]
- Lee, D.G.; Sung, M.J.; Kim, S.R. A Study on Truck Fuel Subsidy Reform: Based on Environmental Taxation; Korea Institute of Public Finance (KIPF): Sejong, Korea, 2018. [Google Scholar]
- Hong, D.H.; Yun, S.J.; Park, J.Y.; Park, S.A. The practice of transition management to reduce diesel trucks: Focusing on the fuel tax subsidies in Korea. Space Environ. 2009, 68, 246–282. [Google Scholar] [CrossRef]
- Ouyang, X.; Lin, B. Impacts of increasing renewable energy subsidies and phasing out fossil fuel subsidies in China. Renew. Sustain. Energy Rev. 2014, 37, 933–942. [Google Scholar] [CrossRef]
- Chatri, F.; Yahoo, M.; Othman, J. The economic effects of renewable energy expansion in the electricity sector: A CGE analysis for Malaysia. Renew. Sustain. Energy Rev. 2018, 95, 203–216. [Google Scholar] [CrossRef]
- Bae, J.-H. Comparison of Different Policy Measures for Fostering Climate Friendly Fuel Technology Applying a Computable General Equilibrium Model. Environ. Resour. Econ. Rev. 2010, 19, 509–546. [Google Scholar]
- International Energy Agency. World Energy Outlook 2016; International Energy Agency (IEA): Paris, France, 2016. [Google Scholar]
- International Energy Agency. World Energy Outlook 2017; International Energy Agency (IEA): Paris, France, 2017. [Google Scholar]
- The Organisation for Economic Co-operation and Development. OECD Environmental Performance Reviews: Korea; The Organisation for Economic Co-operation and Development (OECD): Paris, France, 2017. [Google Scholar]
- Ministry of Trade, Industry and Energy (MOTIE). Third Energy Master Plan (2019.6); Ministry of Trade, Industry and Energy (MOTIE): Sejong, Korea, 2019.
- Ministry of Trade, Industry and Energy (MOTIE). Plan to Strengthen Competitiveness for Renewable Energy Industry; Ministry of Trade, Industry and Energy: Sejong, Kerea, 2019.
- Park, K.; Yoon, T.; Shim, C.; Kang, E.; Hong, Y.; Lee, Y. Beyond Strict Regulations to Achieve Environmental and Economic Health?An Optimal PM2. 5 Mitigation Policy for Korea. Intern. J. Environ. Res. Public Health 2020, 17, 5725. [Google Scholar] [CrossRef] [PubMed]
- EcoMod. Advanced Techniques in CGE Modeling with GAMS; EcoMod Modeling School: Istanbul, Turkey, 2010. [Google Scholar]
- Hosoe, N.; Gasawa, K.; Hashimoto, H. Textbook of Computable General Equilibrium Modeling: Programming and Simulations; Springer: New York, NY, USA, 2010. [Google Scholar]
- Springer, K. The DART General Equilibrium Model: A Technical Description; Kiel Working Paper: Kiel, Germany, 1998. [Google Scholar]
- Paltsev, S.; Reilly, J.M.; Jacoby, H.D.; Eckaus, R.S.; McFarland, J.R.; Sarofim, M.C.; Asadoorian, M.O.; Babiker, M.H.M. The MIT Emissions Prediction and Policy Analysis (EPPA) Model: Version 4; MIT Joint Program on the Science and Policy of Global Change: Cambridge, MA, USA, 2005. [Google Scholar]
- Bank of Korea. Input-Out Table 2015; Bank of Korea (BOK): Seoul, Korea, 2016. [Google Scholar]
- Kwon, O.-S.; Han, M.; Ban, K.; Yoon, J. Constructing an Energy-extended KLEM DB and Estimating the Nested CES Production Functions for Korea. Environ. Resour. Econ. Rev. 2018, 27, 29–66. [Google Scholar]
- Yun, T.; Cho, G.L.; Kim, J.-Y. Analyzing economic effects with energy mix changes: A hybrid CGE model approach. Sustainability 2019, 8, 1048. [Google Scholar] [CrossRef] [Green Version]
- Cho, G.L. Assessment and Implications of the National Target in Reducing Greenhouse Gases; Korea Economic Research Institute: Seoul, Korea, 2010. [Google Scholar]
- Park, K.W.; Kang, S.W. An economic impact analysis of reforming the energy tax: Up- and downstream carbon tax in the energy sector. J. Environ. Policy Adm. 2020, 28, 49–77. [Google Scholar] [CrossRef]
Figure 1.
Estimates of global (Source: [26,27]), and Korean (Source: [16]) fossil-fuel consumption subsidies.

Figure 2.
Estimates of global renewable energy subsidies (Source: [27]).
Figure 2.
Estimates of global renewable energy subsidies (Source: [27]).

Figure 3.
Framework of the CGE model.

Figure 4.
Composition of the energy sector.


Table 1.
Details of Korean fossil fuel subsidies (as of 2015) (unit: million USD, %).
| Item | Size | ||
|---|---|---|---|
| Coal subsidies | direct subsidies | coal mine subsidies | 76 (1.5) |
| bituminous coal subsidies | 112 (2.3) | ||
| support for anthracite coal generation | 2 (0.03) | ||
| implicit subsidies | surtax exemption for bituminous and anthracite coal | 34 (0.7) | |
| fuel cost support project for low-income people | 14 (0.3) | ||
| tax exemption for power generation bituminous coal | 1450 (29.4) | ||
| tax exemption for power generation anthracite coal | 49 (1.0) | ||
| sub-sum | 1737 (35.2) | ||
| Oil subsidies | direct subsidies | transportation fuel subsidies | 2078 (42.1) |
| implicit subsidies | oil tax exemption for self-generators on islands | 1 (0.03) | |
| oil tax exemption for agriculture and fishery | 1116 (22.6) | ||
| sub-sum | 3196 (64.8) | ||
| Total | 4933 (100.0) | ||
Note. 1 USD = 1178 KRW (as of August 19, 2020) (Source: [16], reorganized by the authors).
Table 2.
Industry classification.
| Sector | Industries | Elasticity of Substitution | |
|---|---|---|---|
| Energy sector (16) | Electricity (water) | 1.131 | 0.953 |
| Electricity (fossil) | 1.131 | 0.953 | |
| Electricity (nuclear) | 1.131 | 0.953 | |
| Electricity (renewable) | 1.2 | 1.008 | |
| Steam and hot water | 1.131 | 0.953 | |
| Coal | 1.223 | 1.006 | |
| Coke and hard coal | 1.089 | 1.003 | |
| Crude petroleum | 1.006 | 0.999 | |
| Gasoline | 1.046 | 1.006 | |
| Kerosene | 1.013 | 1.001 | |
| Diesel | 1.038 | 1.012 | |
| Bunker | 1.058 | 0.983 | |
| Natural gas | 1.001 | 1.001 | |
| Town gas | 0.993 | 0.999 | |
| LPG | 1.029 | 0.999 | |
| Other petroleum products | 1.001 | 1.001 | |
| Non-energy sector (14) | Agricultural, forest, fishery goods | 1.181 | 1.005 |
| Metal ores, nonmetallic minerals | 1.4 | 0.99 | |
| Food, beverages, tobacco | 0.711 | 1.001 | |
| Textile and leather products | 6.236 | 1.001 | |
| Wood, paper, printing | 0.844 | 0.863 | |
| Chemical products | 1.131 | 0.953 | |
| Nonmetallic mineral products | 1.131 | 0.953 | |
| Basic metal products | 0.979 | 1.001 | |
| Fabricated metal products and machinery | 1.131 | 0.953 | |
| Electronic equipment and precision instruments | 0.844 | 0.863 | |
| Transportation equipment | 0.711 | 1.001 | |
| Other manufactured products | 0.711 | 1.001 | |
| Water supply, waste, construction | 0.711 | 1.001 | |
| Service | 1.131 | 0.953 | |
Table 3.
Fossil fuel subsidy retention/abolition and renewable energy subsidy expansion by scenario (Unit: billion USD).
Table 3.
Fossil fuel subsidy retention/abolition and renewable energy subsidy expansion by scenario (Unit: billion USD).
| Category | Scenario 1 | Scenario 2 | Scenario 3 | |
|---|---|---|---|---|
| Fossil fuel subsidies | coal mine subsidies | ⅹ | ⅹ | ⅹ |
| bituminous coal subsidies | ⅹ | ⅹ | ⅹ | |
| support for anthracite coal generation | ⅹ | ⅹ | ⅹ | |
| surtax exemption for bituminous and anthracite coal | ⅹ | ⅹ | ⅹ | |
| fuel cost support project for low-income people | ○ | ○ | ⅹ | |
| tax exemption for power generation bituminous coal | ⅹ | ⅹ | ⅹ | |
| tax exemption for power generation anthracite coal | ⅹ | ⅹ | ⅹ | |
| transportation fuel subsidies | ○ | ○ | ⅹ | |
| oil tax exemption for self-generator of islands | ○ | ○ | ⅹ | |
| oil tax exemption for agriculture and fishery | ○ | ○ | ⅹ | |
| sum | −1.723 | −1.723 | −4.933 | |
| Renewable energy subsidies | 0 | +1.723 | +4.933 | |
Note: ○ indicates a Subsidy retention and ⅹ is denoted a subsidy abolition.
Table 4.
Change in economic variables (%) and CO2 emissions.
| Scenario 1 | Scenario 2 | Scenario 3 | |
|---|---|---|---|
| Real GDP | −0.04 | −0.05 | −0.14 |
| Real household consumption | −0.12 | −0.01 | −0.13 |
| Real government consumption | 0.48 | −0.12 | −0.10 |
| Real investment change | −0.19 | −0.08 | −0.21 |
| Export amount change | −0.55 | −0.44 | −1.32 |
| Import amount change | −0.65 | −0.52 | −1.57 |
| Change in CO2 emissions | −7.0 | −6.9 | −8.5 |
| Change in CO2 emissions compared to the real GDP change | −7.0 | −6.9 | −8.4 |
Table 5.
Sectoral output and share in energy sector (unit: billion USD,%).
| Reference Year (2015) | Scenario 1 | Scenario 2 | Scenario 3 | |||||
|---|---|---|---|---|---|---|---|---|
| Output | Share | Output | Share | Output | Share | Output | Share | |
| Electricity | 49.6 | 32.4 | 48.5 | 32.4 | 49.6 | 32.8 | 50.6 | 35.3 |
| Heat | 3.9 | 2.5 | 3.9 | 2.6 | 3.9 | 2.6 | 3.8 | 2.6 |
| Coal | 0.8 | 0.6 | 0.3 | 0.2 | 0.3 | 0.2 | 0.3 | 0.2 |
| Oil | 41.1 | 26.8 | 40.5 | 27.0 | 40.6 | 26.8 | 31.9 | 22.3 |
| Gas | 26.2 | 17.1 | 25.5 | 17.0 | 25.6 | 16.9 | 25.3 | 17.7 |
| Others | 31.5 | 20.6 | 31.3 | 20.9 | 31.4 | 20.7 | 31.3 | 21.8 |
| Total | 153.1 | 100 | 149.9 | 100 | 151.3 | 100 | 143.2 | 100 |
Table 6.
Sectoral output, share, and CO2 emission change by electricity sources (unit: billion USD,%).
Table 6.
Sectoral output, share, and CO2 emission change by electricity sources (unit: billion USD,%).
| Reference Year | Scenario 1 | Scenario 2 | Scenario 3 | ||||||||
|---|---|---|---|---|---|---|---|---|---|---|---|
| Output | Share | Output | Share | CO2 Emission Change | Output | Share | CO2 Emission Change | Output | Share | CO2 Emission Change | |
| Electricity | 49.6 | 100 | 48.5 | 100 | −8.7 | 49.6 | 100 | −8.6 | 50.6 | 100 | −9.2 |
| Water source | 0.7 | 1.5 | 0.7 | 1.5 | −2.7 | 0.7 | 1.5 | −1.5 | 0.7 | 1.4 | −6.6 |
| Fossil Fuel source | 35.4 | 71.4 | 34.4 | 71.0 | −8.7 | 34.6 | 69.8 | −8.7 | 34.3 | 67.8 | −9.2 |
| Nuclear source | 11.0 | 22.2 | 10.9 | 22.5 | −2.6 | 10.9 | 22.0 | −1.9 | 10.8 | 21.4 | −4.8 |
| Renewable source | 2.5 | 5.0 | 2.4 | 5.0 | −2.8 | 3.3 | 6.7 | 34.1 | 4.7 | 9.3 | 80.5 |
| Electricity Price | Increasing in 2% | No significant variation | Decreasing in 2% | ||||||||
Publisher’s Note: MDPI stays neutral with regard to jurisdictional claims in published maps and institutional affiliations. |
© 2021 by the authors. Licensee MDPI, Basel, Switzerland. This article is an open access article distributed under the terms and conditions of the Creative Commons Attribution (CC BY) license (http://creativecommons.org/licenses/by/4.0/).
Share and Cite
MDPI and ACS Style
Park, K.; Lee, Y.; Han, J. Economic Perspective on Discontinuing Fossil Fuel Subsidies and Moving toward a Low-Carbon Society. Sustainability 2021, 13, 1217. https://0-doi-org.brum.beds.ac.uk/10.3390/su13031217
AMA Style
Park K, Lee Y, Han J. Economic Perspective on Discontinuing Fossil Fuel Subsidies and Moving toward a Low-Carbon Society. Sustainability. 2021; 13(3):1217. https://0-doi-org.brum.beds.ac.uk/10.3390/su13031217
Chicago/Turabian StylePark, Kyungwon, Yoon Lee, and Joon Han. 2021. "Economic Perspective on Discontinuing Fossil Fuel Subsidies and Moving toward a Low-Carbon Society" Sustainability 13, no. 3: 1217. https://0-doi-org.brum.beds.ac.uk/10.3390/su13031217
Note that from the first issue of 2016, this journal uses article numbers instead of page numbers. See further details here.