
Measuring Historical Urban Neighborhood Sustainability: America’s Grand Avenues

Edward J. Bloustein School, Rutgers University, New Jersey, NJ 08854, USA
Sustainability 2021, 13(3), 1358; https://0-doi-org.brum.beds.ac.uk/10.3390/su13031358
Submission received: 4 January 2021
/
Revised: 22 January 2021
/
Accepted: 25 January 2021
/
Published: 28 January 2021
(This article belongs to the Special Issue Transformation of Cities: Toward Resilient and Antifragile Models)
Abstract
:From 1850 through approximately 1920, wealthy entrepreneurs and elected officials created “grand avenues” lined by mansions in New York City, Chicago, Detroit, and other developing US cities. This paper examines the birthplaces of grand avenues to determine whether they have remained sustainable as magnets for healthy and wealthy people. Using data from the US EPA’s EJSCREEN system and the CDC’s 500 cities study across 11 cities, the research finds that almost every place where a grand avenue began has healthier and wealthier people than their host cities. Ward Parkway in Kansas City and New York’s Fifth Avenue have continued to be grand. Massachusetts Avenue in Washington, D.C., Richmond’s Monument Avenue, St. Charles Avenue in New Orleans, and Los Angeles’s Wilshire Boulevard are national and regional symbols of political power, culture and entertainment, leading to sustainable urban grand avenues, albeit several are challenged by their identification with white supremacy. Among Midwest industrial cities, Chicago’s Prairie Avenue birthplace has been the most successful, whereas the grand avenues of St. Louis, Cleveland, Detroit, and Buffalo have struggled, trying to use higher education, medical care, and entertainment to try to rebirth their once pre-eminent roles in their cities.
1. Introduction
The industrial revolution brought unprecedented wealth and millions of eager immigrants to dozens of US cities located on the Atlantic seaboard and along the Midwest’s Great Lakes and rivers. Entrepreneurs built mansions along grand avenues in Buffalo, Chicago, Cleveland, Detroit, Galveston, Kansas City (MO), Los Angeles, New Orleans, New York City, Richmond (VA), St. Louis, and Washington, D.C., and others. Their mansions and grand streets, often 180 or more feet wide (55 m), with tree-lined medians symbolized the high quality of life that wealth could bring between 1850 and 1920.
One century has passed since these grand avenues were built. With so many residential options available to affluent people, it is unrealistic to assume that mansions on grand avenues located in the heart of major cities would now host so many of the wealthiest. Some grand avenues may have continued to attract affluent and politically powerful people, or at least middle-class populations compared to other parts of their host cites. Yet, many likely have become indistinguishable from the cities that host them, even if they have wide streets and some mansions remain.
The goal of this paper is to assess the early 21st-century sustainability of selected grand avenues through the lenses of socioeconomic status, public health, and environmental quality. More specifically, the following four questions were the focus of this research:
- What are the income, education, and racial/ethnic attributes of people living along or near grand avenues compared to the population of their surrounding political jurisdiction?
- How does the public health of people living along or near these grand avenues compare to the surrounding jurisdiction as a whole?
- How do environmental metrics in the grand avenue neighborhoods compare to those of the surrounding jurisdiction?
- What attributes and policies appear to be associated with grand avenues that have been sustainable as attractive to high socioeconomic status and healthy people?
Why is a look at the evolution of former grand avenues in the United States relevant to urban attractiveness and sustainability today? The author suggests three reasons. The study should identify local and neighborhood attributes and policies that increase the chances of neighborhood sustainability. Second, attractive urban neighborhoods require successful meshing of the social, economic and environmental pillars of sustainability [1,2]. This study examines all three pillars. Third, the author is convinced that the two key data sets used in this study, both introduced since 2015, are the start of what will become available during this decade. He expects the data used here to be superseded by information that will become available in the near future to inform urban neighborhood sustainability.
Before describing some key literature, the author briefly defines “grand avenue” and “sustainability” for purposes of this paper. There is no agreed upon definition of “grand avenue.” For example, Chicago, Detroit, Los Angeles, New York City, and St. Louis have streets named grand avenue that do not correspond to the set studied in this paper. Using their experiences in Barcelona, New York, Paris, and elsewhere, Jacobs et al. [3] distinguish three types of boulevards. One is a wide road that separates local from through traffic. A second has a landscaped median, roadways, sometimes a railroad line and sidewalks on either side. The third is a wide road with a wide median, and tree-lined sidewalks.
The 11 places studied here are closest in appearance to the third group, but several have or had the attributes of the second group, at least when they were designed. Cigliano and Bradford [4] classify a grand avenue as possessing a residential function, hosting high socioeconomic status individuals, offering elegant, perhaps ostentatious designs and technologies that are further enhanced by monumental features. Their definition fits the 11 study grand avenues, or at least it did when the grand avenues were built.
In regard to sustainability, a working definition for this study is a grand avenue that has continued to attract to wealthy and healthy people compared to the host city over the course of more than one century. This implies to the author that the avenue has achieved an attractive balance of social, economic and environmental assets [1,2].
The literature provides strong clues about the economic, social and physical environments that would make an urban neighborhood attractive and sustainable or undermine it in the 21st century. We focus on dependence on manufacturing, job opportunities, high cost of living, and fear of crime and blight. These factors play out at regional and neighborhood scales.
The industrial revolution was built around iron and steel, coal, and rail lines in Europe, North America and elsewhere [5]. Harris [6] classified American cities into several categories, including “diversified” and “manufacturing.” Pittsburgh, Cleveland, Detroit, and Buffalo exemplify the manufacturing group, whereas New York City, Chicago, Philadelphia, St. Louis and Baltimore were classified as “diversified. The diversified set were not as dependent on manufacturing, and hence had more options to attract relatively affluent people through finance and other non-manufacturing functions when the U.S. began to lose manufacturing jobs. This literature suggests that manufacturing cities would be less sustainable as hosts for grand avenues than their more diversified counterparts [7,8,9,10,11]. It also suggests that diversification meant a city could stand as a symbol for commerce, entertainment, politics, and/or culture rather than post-industrial rust.
Historical studies from the 20th century showed that crime and dilapidated structures, often owned by absentee landlords, were inimical to establishing high quality sustainable residential neighborhoods [12,13,14]. Residents were more distressed by crime and blight than by high taxes, expensive housing, traffic congestion and bad weather. Fast forward to the 21st century, and the same findings emerge about crime and blight. A feeling of safety attracts people and high or perceived crime discourages them. The FBI publishes crime data that the media and companies use to attract and discourage movers. For example, Stebbins’s [15] article about high-crime cities is illustrative of the use of data to brand the Midwest’s old manufacturing cities as crime ridden. All five of Midwestern cities in this paper are listed among the 35 cities in the US with the highest crime rates: Detroit, St. Louis, Chicago, Cleveland, and Kansas City (MO). In addition, three others in this grand avenue study were included as among the most dangerous: New Orleans, Buffalo, and Washington, DC.
FBI crime statistics reach down to the neighborhood scale. For example, Arrest Records [16] named the 25 worst neighborhoods in the US. Three are in Detroit, two in Chicago, one each in St. Louis, New Orleans and Washington, DC. None of the neighborhoods are grand avenues, but negative labeling of cities and their neighborhoods discourages potential residents, much as mid-20th-century “redlining” continues to undermine the populations living in neighborhoods branded by government policies [17].
Trahner [18] focuses on high costs, low wages, high crime, and dense traffic, identifying 20 cities that people cannot “flee fast enough.” These include grand avenue cities: New York City, Los Angeles, Washington, DC, Chicago, and Detroit. Whiteman [19] identified 20 U.S. cities that people were “eager to get out.” At the top of the list are New York City, Los Angeles, Washington, DC, Chicago, Detroit, and Richmond, all part of the grand avenue group. Sauter [20] identified 50 U.S. regions that people are leaving “in droves.” The top five on the list were Chicago, Los Angeles, Detroit, St. Louis, and Cleveland, all with grand avenues included in this study.
Good news may counterbalance some negative branding. Richard Florida’s [21] thesis is that creative people are the future. The idea about knowledge creation attracting wealth goes back to at least Adam Smith [22], and more recently Pred [7], and Glaeser [23]. The formula for attracting the creative class includes good jobs, inexpensive housing, and a high-quality environment, including ample opportunities for leisure, and excellent education systems.
Martin [24] lists 15 cities that are attracting millennials (20–34 year olds), emphasizing that New York city and Los Angeles are not in the list. None are from the cities in this grand avenue study. One of the 15, Overland Park (#14 in attractiveness) is five miles from Ward Parkway in Kansas City, one of the grand avenues. Niche [25] goes down to the neighborhood scale. The top of their 2020 list of attractive neighborhoods includes numerous locations in Palo Alto, Tampa, Arlington (VA), Richardson (TX), and Bellevue (WA). Not until numbers 50–75 in their list do we find a place that is near one of the grand avenues, which is Overland Park (KS).
Balancing attractive and unattractive attributes at the city scale, Niche [26] ranked 231 US cites from best to least attractive using 16 metrics, including cost of living, higher education, housing, and public schools with 45% of the weight. Diversity, absence of crime, family friendliness, health and fitness, good jobs, nightlife outdoor activities walkability, good weather and shortest commute received the remaining positive criteria weights. Washington, DC was ranked 34, with an overall grade of A. Kansas City (MO) and NYC ranked 61 and 72, respectively. Next came Chicago, Buffalo, Los Angeles, St. Louis and Richmond, with ranks of 101, 134 142, 149 and 151, respectively. New Orleans, Cleveland, and Detroit ranked 165, 188, and 197, respectively. The median rank of the 11 cities with grand avenues in this study was 142—in other words, the grand avenues in these cities in balance are relatively unattractive cities, according the weight of evidence from these survey reports.
However, the focus of this research is the sustainability of each grand avenue in the context of its host city, not the city per se. Having visited all of the grand avenues and read about them, the author expected some of the grand avenues, especially the locations where the avenue began, to have used to the advantage of their central location on a broad street often tied into mass transit to host prominent universities, museums and other cultural magnets, hospitals, entertainment centers, retail establishments, and parks. In the best cases, the grand avenue would have become symbolic of a desirable economic, political or social cause. In many cases, the mansions would be gone, but others would have been adapted to the needs of early 21st century.
If the grand avenue neighborhoods have continued to attract wealth, the data should show the following:
- Fewer people living along or near the grand avenues should be lower socioeconomic status than their host cities;
- Negative health outcomes and unhealthy behaviors should be less prevalent and disease prevention should be more prevalent in the grand avenue neighborhood than the host city;
- Environmental indicators such as fine particulates and diesel particles should be lower than in the surrounding city.
Briefly, the major findings are consistent with the expectations but with several interesting deviations. The grand avenue origination nodes (hereafter called ORIGINS) have populations that are notably healthier and wealthier than their surrounding cities. Some of the full grand avenues (hereafter called ENTIRES) do not. Furthermore, the environmental metrics for diesel, 2.5 pm particles and traffic for most ORIGINS are higher than their host cities. The processes involved in trying to remain attractive depend upon the historical, economic, and social contexts, summarized in three grand avenue groups that are distinguished in the paper.
The next section describes the data used to compare each grand avenue and its host city in regard to socioeconomic status, public health and environmental exposure. Emphasis is on the challenges of applying the data to answering the four research questions. Section three presents the results, that is, compares the ORIGINS and the ENTIRES with the host cities. The 11 grand avenues are grouped into three categories based on their attractiveness in the fourth section. The discussion describes the major findings, their limitations, and offers suggestions for both research and public policy.
2. Materials and Methods
Two pieces of information are available to determine whether grand avenues have been sustainable. Cigliano and Landau [4] identified twelve U.S. grand avenues, carefully described their history, provided many photographs and details to help locate their origins and summarized their social context. Readers can see precisely where they were located. Aerial photography allows us to see what these streets are like today. Other places have grand avenues, such as, Boston’s Commonwealth Avenue, the Grand Concourse in the Bronx, and State Street in Salt Lake City. However, to be consistent only those from Cigliano and Landau [4] were included in this study.
Eyes and photographs can produce deceptive perceptions. Even walking the streets with a camera and talking to residents, which this author has performed, will not necessarily produce a credible view of granular elements of socioeconomic status, public health and environmental quality. The camera and eyes are good steps for researchers, but too limited, representing only a snapshot of reality.
During the last five years, two publicly available data sets allow us to consistently measure who lives in these areas, what is their aggregate health status, and what is the environmental quality of their grand avenue neighborhoods. Twelve grand avenues were described in Cigliano and Bradford’s book [4]. One, Broadway in Galveston, Texas was not included in the study because Galveston’s population is only approximately 51,000 and therefore the health data were not available at the fine geographical scale. Galveston City was the location of the worst US national disaster measured by an estimated 8000 deaths [27] in 1900 when a hurricane struck the island. Galveston had been the “Wall Street of the South.” It is now has a 10 mile-long (16.1 km) seawall that is 17 feet (5.2 m) high and 16 feet (4.9 m) deep at its base.
Table 1 lists in alphabetical order the 11 grand avenues included in this study along with the populations of their host cities. Figure 1 shows their locations.
The host city populations range from less than 300,000 for St. Louis (MO) and Richmond (VA) to New York City with an estimated population of 8.5 million. Geographically, two of the 11 grand avenues are in the Northeast, four in the South, four in the Midwest, and one in the West.
2.1. Socioeconomic and Environmental Data: EJSCREEN [https://www.epa.gov/ejscreen]
Two of the three databases for this study came from EJSCREEN, a publicly-accessible database built by the U.S.EPA as one response to President Clinton’s 1994 Environmental Justice Executive Order 12,898 that required every federal department to create an environmental justice program. The tool was released in 2015, and this study used the year 2019 version, which contains data for the period 2011–2019 [28]. This section summarizes EJSCREEN, focusing on the data and challenges faced in designing this study.
2.1.1. Geographical Database
EJSCREEN offers options for constructing geographical databases. Users can provide a “known geography”, such as the cities of Chicago, St. Louis, and Washington, D.C. The known geography alternative was used here in order to compare their grand avenues to their cities as a whole. Sustainability for these grand avenues means people living near them should be wealthier, healthier, and the areas should have better environmental quality than their cities as a whole. In other words, we should find less evidence of social and environmental injustice challenges marked by high rates of poverty, less educational achievement, few minority population clusters, and degraded high risk environments.
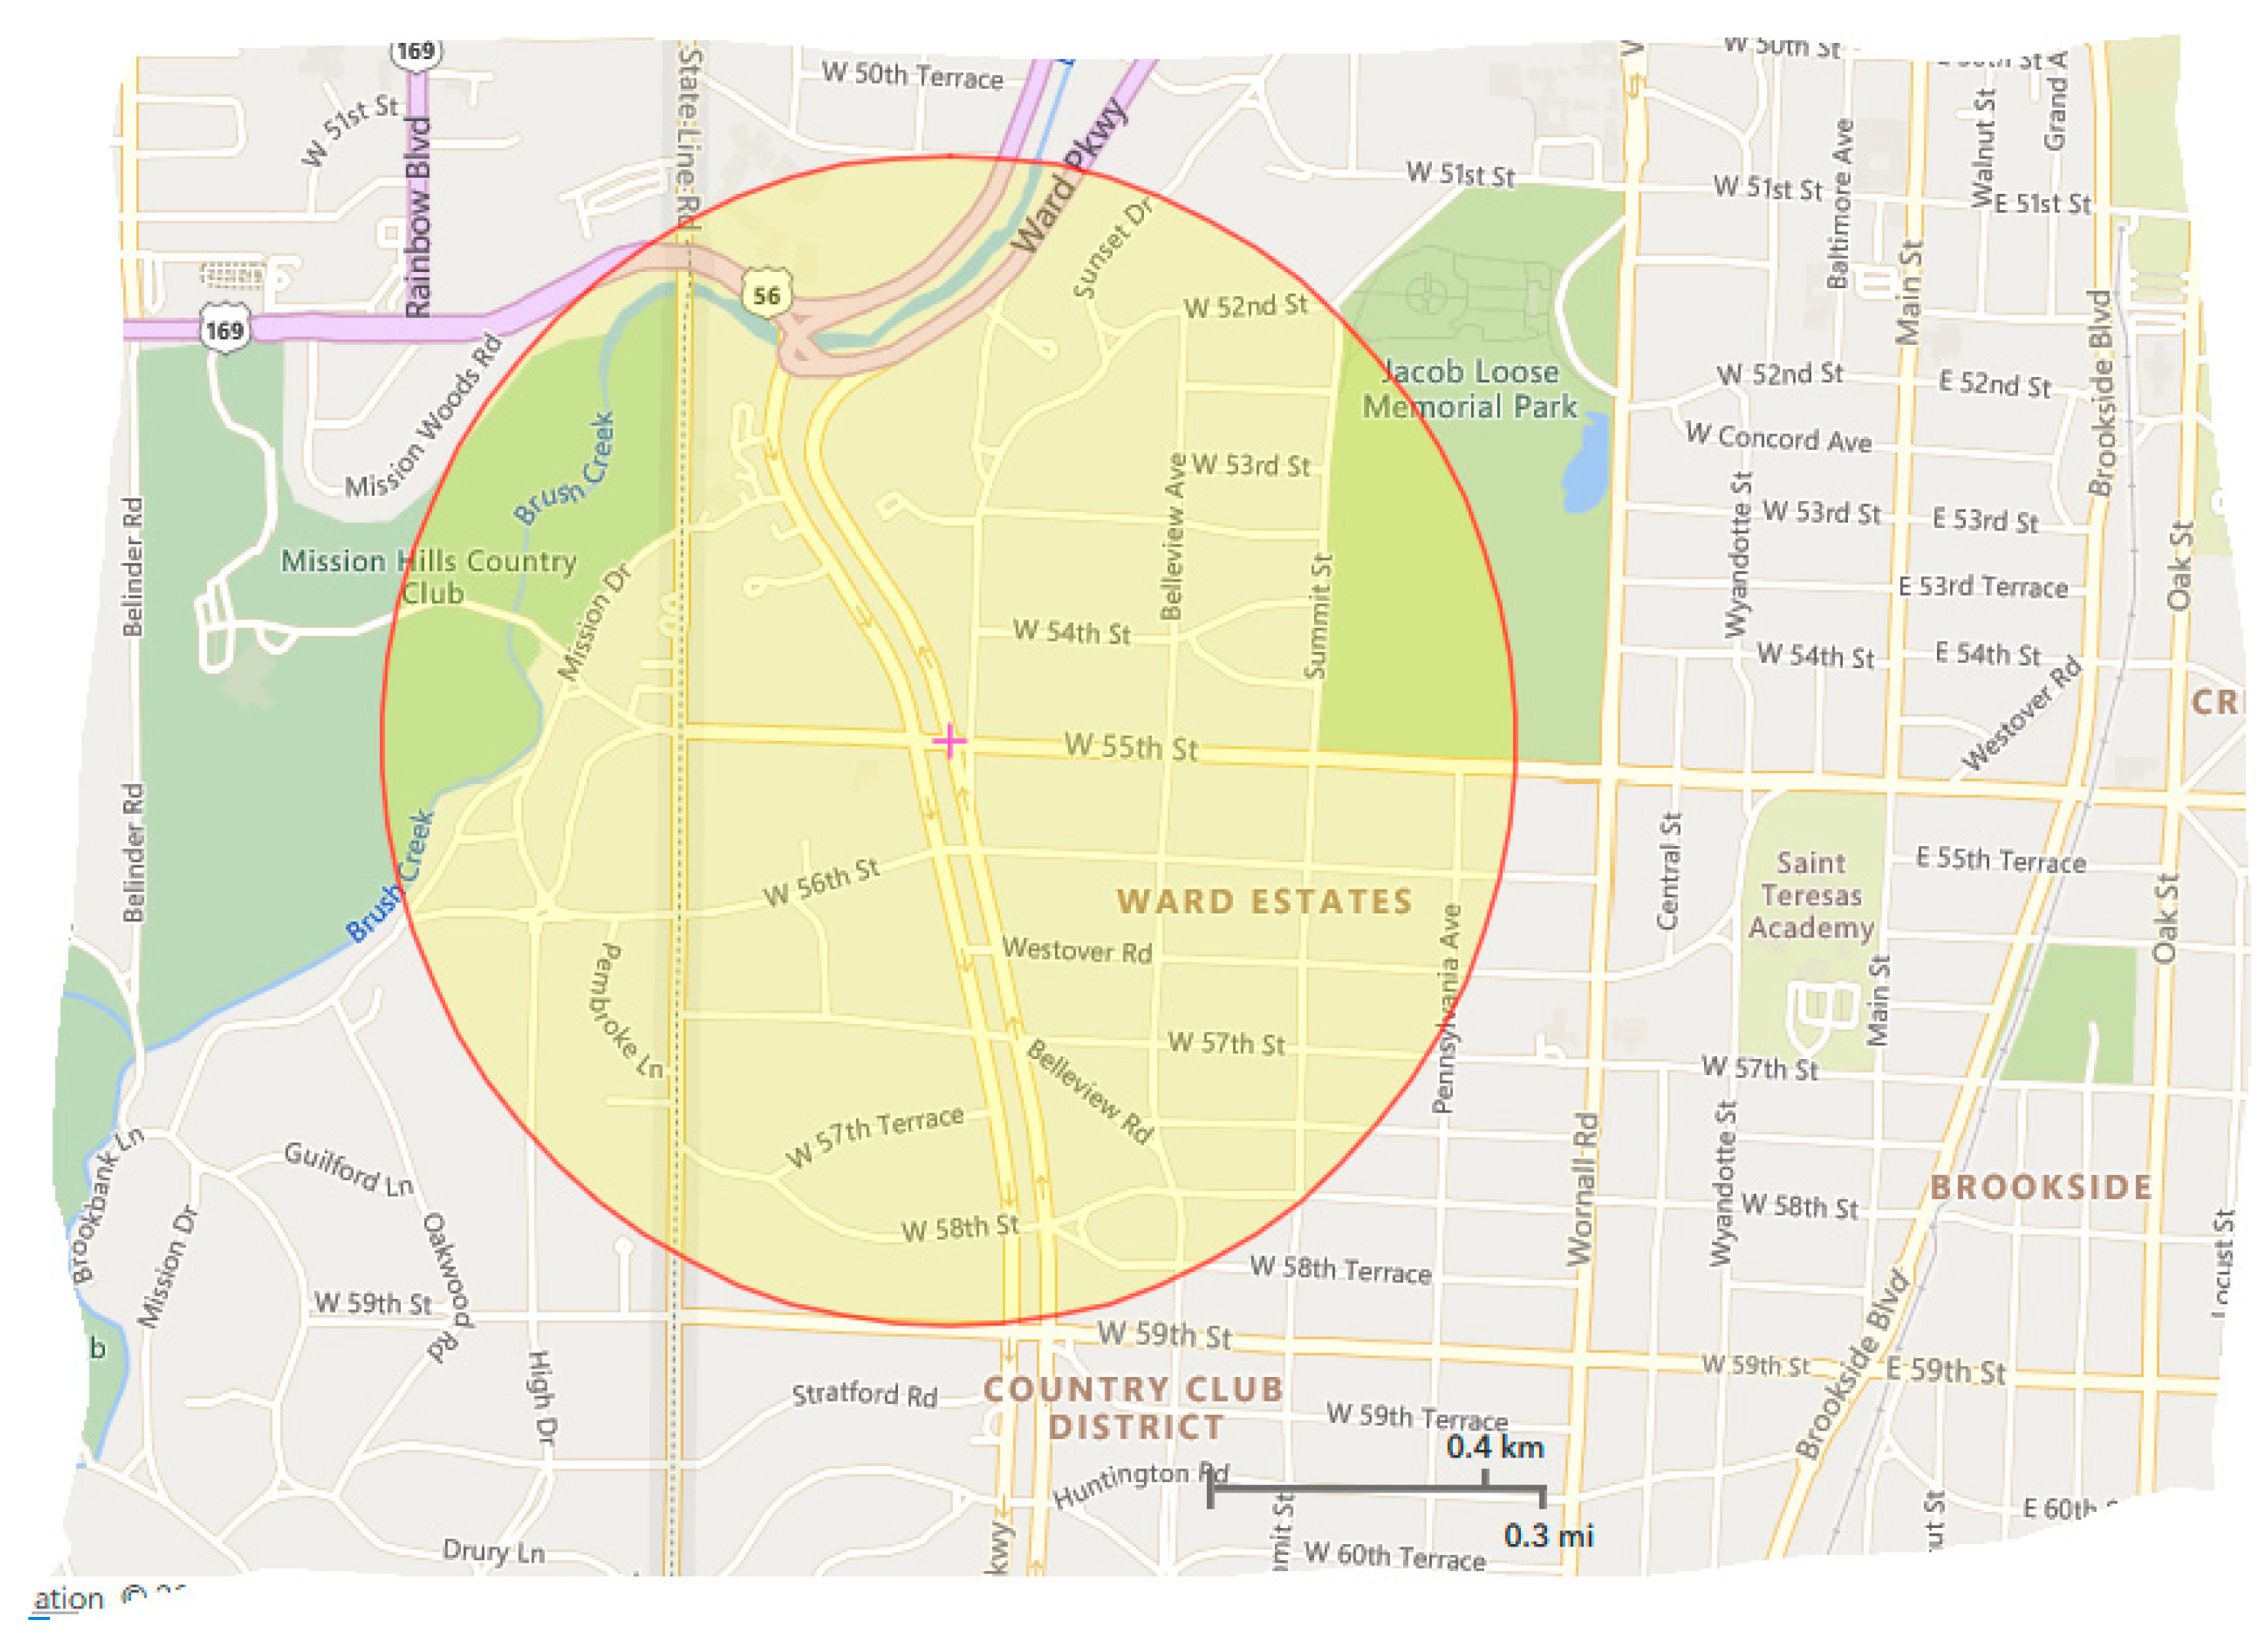
Two other EJSCREEN area spatial building blocks were used. One was to draw a circle of ½ mile radius (804.7 m) around the ORIGINS of each grand avenue to create 11 “grand avenue ORIGINS. Cigliano and Landau [4] present photos and discuss homes on each grand avenue. The author studied all these locations, and chose one for a ORIGIN based on the literature and personal visits. A caveat that it is quite possible is that someone else would pick another ORIGIN node (see example below of Ward Parkway).
With regard to the grand avenue as a whole, several are more than 15 miles (24.2 km) long. For example, Wilshire Boulevard runs from Los Angeles City to Santa Monica. To be consistent, this study used segments of grand avenues that were in the same city. To build these grand avenue blocks, the author constructed polygons from end to end within the host city. The polygons capture the grand avenue path, adjacent housing, and parts of adjacent side streets. Measured from the center of the grand avenue, the author experimented with widths of 1 mile (1609 m), ½ mile (804.7 m), and ¼ mile (402.4 m). The largest polygon in larger cities such as New York and Chicago clearly crossed into multiple neighborhoods, and therefore was unacceptable. The smallest too narrowly defined the area, leaving out developments that are heavily influenced by the grand avenues. In short, ½ mile (804.7 m) measurement from the center of the venue was a compromise that led to 1 mile-wide grand avenue polygon-shaped ENTIRES for each of the 11 locations.
2.1.2. Social and Environmental Data
EPA’s 2019 EJSCREEN includes 18 demographic and environment metrics, 11 of which were included in this study (Table 2). The demographic indictors are drawn from the original language in President Clinton’s 1994 Executive Order 12898. In the context of the grand avenues, sustainability implies relatively few vulnerable people.
This study included three types of environmental metrics. One set are air pollutants. Particulates (2.5 pm) and ozone are indicators representing national ambient air quality standards, and diesel was added because high concentrations have been associated with large industrial complexes with a great deal of truck traffic, which is the case near many of these grand avenues.
A second type of environmental indicator is based on proximity to potential hazards: superfund sites, risk management plan (RMP), and nearby traffic. EJSCREEN software calculates the distance from the centroid of the study area to these land uses. Briefly, superfund sites are orphaned hazardous waste and industrial sites, some of which have been fully remediated and others that have not. The risk is through direct contact or indirectly through the soil or groundwater [29].
RMP plans address Section 112(r) of the 1990 Clean Air Act amendments. Facilities that use extremely hazardous substances must have a RMP, and these are revised and resubmitted to EPA every five years [30]. Living near an RMP site does not imply exposure, but it does imply potential exposure under a failure scenario.
The traffic measurement indicator measures distance from nearby heavily traveled highways. The superfund, traffic, and RMP distance-based metrics are assumed to be represent possible exposure.
The last of seven environmental indicators, arguably the most serious, is exposure to lead paint. The actual indicator is proportion of housing built prior to 1960. After 1960, the use of lead paint in the U.S. was dramatically reduced as business and the U.S. government were finally persuaded that lead paint lead to serious neurological damage among young children. The U.S. Bureau of the Census publishes data about housing age, which was the metric used by EJSCREEN.
Models embedded in EJSCREEN calculate values for every area. The socioeconomic data and the lead indicator are based on US census block and tracts. Circles and polygons cross census blocks and tracts. The GIS-based software pulls data from each granular census area and apportions them to the circles and polygons. A similar process is used for the environmental data. The most uncertain data set are the air pollutants because the software reaches out to nearby monitoring stations, each of which has a specific latitude and longitude. Places with a higher density of air quality monitoring stations should have the most credible air quality data.
Fine particles and diesel particles tend to be geographically localized, whereas ozone is a regional contaminant able to move hundreds of miles. Hence, the author expected to find smaller differences in ozone than particles. Indeed, the author expected to find smaller differences for the air pollution environmental indicators than for the socioeconomic and health ones within each area because air pollutants drift.
2.1.3. Health Data [https://help.healthycities.org/hc/en-us/articles/115002518668-CDC-s-500-Cities-Project]
Beginning in 1984, the Centers for Disease Control and Prevention [31] built the largest ongoing health survey in the world with 400,000 adult samples. The data were interesting, but for years were available only for states. A cooperative project between the CDC and the Robert Wood Johnson Foundation created the 500 Cities project, which allows the public to access indicators at the census tract scale for the 500 largest cities in the United States [32]. The data are available on maps that users can review and numeric data allow comparisons at the census tract scale.
The interactive web application allowed the author to identify census tracts that approximate the ORIGINS and ENTIRES. The geographical fit is imperfect because 2–4 census tracts comprise the ORIGINS and 10–25 are within the full ENTIRES, especially along long grand avenues such as Prairie Avenue in Chicago, and Wilshire Boulevard in Los Angeles. The author tested unweighted averages, weighted averages (weighted by population size), and medians of tracts that were at least half in the grand avenue ½ mile (804.7 m) zone. The arithmetic averages were used to avoid extreme values. Eventually, the technology should include programs that allow users to create a variety of shaped polygons similar to those in EJSCREEN.
Twenty-seven health indicators were available. The author picked one health outcome, one prevention and one unhealthy behavior metric to summarize health status as follows:
- 13 health outcomes: physical health not good for ≥14 of the last 30 days among adults (≥18 years old). The data set also includes arthritis, asthma, high blood pressure, cancer, high cholesterol, and all teeth lost.
- 9 prevention metrics: current lack of health insurance among adults 18–64 years. The data set also includes indicators about respondent visits to doctors and dentists, screening for high cholesterol, mammography, cervical cancer and colon cancer, and vaccinations; and
- 5 unhealthy behaviors: obesity among adults aged ≥18 years. The data also includes information about binge drinking, current smoking, no leisure-time physical activity, and sleeping less than 7 h.
These three health indicators illustrate the potential utility of the behavioral risk factor data being collected by the CDC. While the data are an imperfect fit to the spatial socioeconomic and environmental data, they measure critical indicators that are consistent with places of high socioeconomic status. If the grand avenue area has remained attractive, not many occupants should be physically ill for two weeks, they should have health insurance, and relatively few residents should be obese.
Twenty-four others were also available. However, the data represent census tracts and the time period covered by the data are primarily from 2013 and 2014, and involve a complex small area estimation procedure from sample data. The author did want to skip these data, nor did he want to overexpose these data at this time because he is concerned about spatial uncertainty. Hence, he picked three measures that are well-known indicators of stressful conditions among the adult population, rather than others that are primarily aiming at younger (e.g., binge drinking) and seniors (e.g., arthritis). This database is being worked on, and the author fully expects it to be widely used in the not too distant future, especially if support continues for development, which is critical.
3. Results
3.1. Preliminary Results
Table 3 summarizes the population densities for the grand avenue nodes and the grand avenues as a whole with estimates from the American Community surveys for the years 2013–2017. The first and second data columns are estimated populations and densities for the ORIGIN nodes and columns 3–5 are for the grand avenues as a whole (ENTIRES). New York’s Fifth Avenue has much higher density, reflecting its evolution from a few mansions to high-density multi-family land use. Ward Parkway laid out on rolling hills near the border of Kansas and Missouri with massive mansions on both sides has a density along the full road that is approximately 6% of Fifth Avenue’s (see below).
Table 4 aggregates the results for socioeconomic status, health and environmental indicators. The numbers in Table 4 and Table 5 are derived by obtaining the ORIGINS’ and ENTIRES’ data and dividing them by the city value. For example, with regard to lead (measured by housing built before 1960), the ORIGIN value for Prairie Avenue was only 42% of the city’s value and the ENTIRE value was 92%. Across the set of seven environmental indicators, the ORIGIN average value was 87 and it was 107 for the ENTIRE Prairie Avenue. In other words, the Prairie Avenue ORIGIN has slight better environmental results across the set of seen environmental metrics and the ENTIRE grand avenue has slightly worse results (see Appendix A for ORIGIN and city data).
Three patterns stand out. One is that the ORIGINS and ENTIRE grand avenues have attracted a disproportionate share of healthier and more affluent people than their host cities. The median ORIGIN number across the set of health indicators was 66 (100 would be the same as the city) and it was 79 for the socioeconomic indicators across the 11 places. The median environmental indicator score was 98, which means that the same advantage is not found for the grand avenues in regard to environmental metrics.
The second pattern is that the ORIGINS have lower values than the ENTIRES for 8 of the 11 the health indicators, 7 of the 11 environmental ones, and 6 of the socioeconomic metrics. In other words, as a whole, the ORIGINS have been slightly more sustainable than the ENTIRE grand avenue set.
The third general observation is that results are spatially clustered, that is, not randomly distributed across the 11 locations. The Spearman rank correlation (rho) between the ORIGINS and ENTIRES for socioeconomic status 0.734 (p < 0.01) was 0.448 for health and 0.406 for the environmental indicators. In other words, the node and entire avenue values for the same set of metrics were moderately associated. The relationships between the health and socioeconomic status were stronger than they were for the environmental indicators. For example, the rank correlation between the ORIGIN socioeconomic and ORIGIN health indicators was 0.664 (p < 0.02) and was only 0.252 with the ORIGIN environmental metric ranks.
Table 4 aggregates the results across the 11 grand avenues in order to classify the groups into three categories, and Table 5 summarizes the result in three groups. The author did not come to analysis with the idea of creating a specific number of groups. The three groups resulted from the data fitting into categories that fit expectations from the literature described earlier.
3.2. Group 1: Grand Avenues That Have Maintained Their Attractiveness
Ward Parkway in Kansas City, Missouri, and New York City’s Fifth Avenue are near polar opposites in many ways. The population density of the Ward Parkway grand avenue area is less than 4000 per square mile and that of Fifth Avenue is over 60,000. Ward Parkway has a wide tree and grass-lined median, with statues and massive mansions set back from the road, and an occasional walker, runner and biker. Fifth Avenue is wide but packed with automobiles and a high density of walkers along the sidewalk seemingly always busy. Nearly all of Ward Parkway’s residents own their homes, whereas less than one-third of those on or adjacent to Fifth Avenue do. Many readers of this article will have heard of and many will have visited Fifth Avenue, but not Ward Parkway (Figure 2).
While they are very different, both are similar in regard to their attractiveness as highly valued urban avenues and places where the economically privileged concentrate. Ward Parkway is an approximately 6.9 mile-long north–south road in Kansas City, Missouri that parallels the nearby State Line Road between Missouri and Kansas. The American Planning Association [33] labeled Ward Parkway as a Great Place in America with fountains and other statues, neighborhood parks, a rolling landscape and beautiful mansions and churches. If anything, the APA’s praise understates the beauty of Ward Parkway, which is named after a Kansas City attorney Hugh Ward who hired builder J.C. Nichols to turn the undeveloped tract into the most desirable residential neighborhood in Kansas City. Their year 1906 plan succeeded. Both built homes near 55th Street and Ward Parkway. Many elected officials (e.g., Tom Pendergast), and the owners of AMC Theaters, co-founder of H&R Block, and the Hudson Oil Company have lived in mansions set back from Ward Parkway.
Nichols and his colleagues travelled to England and Italy where they purchased fountains and other statues to aggrandize Ward Parkway. People who live along the road and nearby have contributed to keeping the avenue’s picturesque appearance through a small sales tax. Ward Parkway is not lined with stores and shopping malls. These lie at the north–south borders, as does the University of Missouri-Kansas City Campus.
The author placed the ORIGIN on Ward Parkway and 55th street near to the homes of its developers. Table 4 and Table 5 show that Ward Parkway’s ORIGIN and entire grand avenue had average numbers much lower than the city as a whole. Those health measures are approximately 2/3 of those of the city and the socioeconomic status measures are approximately half. The ORIGIN node number of 34 for socioeconomic status is the lowest of any in this study for a set of comparisons. Indicators that are higher than that for the city are for traffic density, diesel particles, and 2.5 pm particles, reflecting the high traffic on the road, and lead, attributable to the older housing. The community has long been aware of the traffic-related challenge to the parkway, which has been shown to be highest at 55th street from traffic that cuts across Ward Parkway between Kansas and Missouri. The Mid-American Regional Council [34] and others directed efforts to measure the traffic, air quality and address the issue through traffic control measures, many of which have been implemented.
In short, a disproportionate number of the wealthiest, most educated, and healthiest residents of the Kansas City, Missouri area have settled in the Ward Parkway area. Short of a major economic or environmental disaster in this area and a breakdown of government-controlled traffic management, it is hard to see this area losing its appeal. Figure 2 shows the location of the Ward Parkway (see Figure 3) ORIGIN node on 55th Street. This map from EJSCREEN is followed by three photos taken by the author.
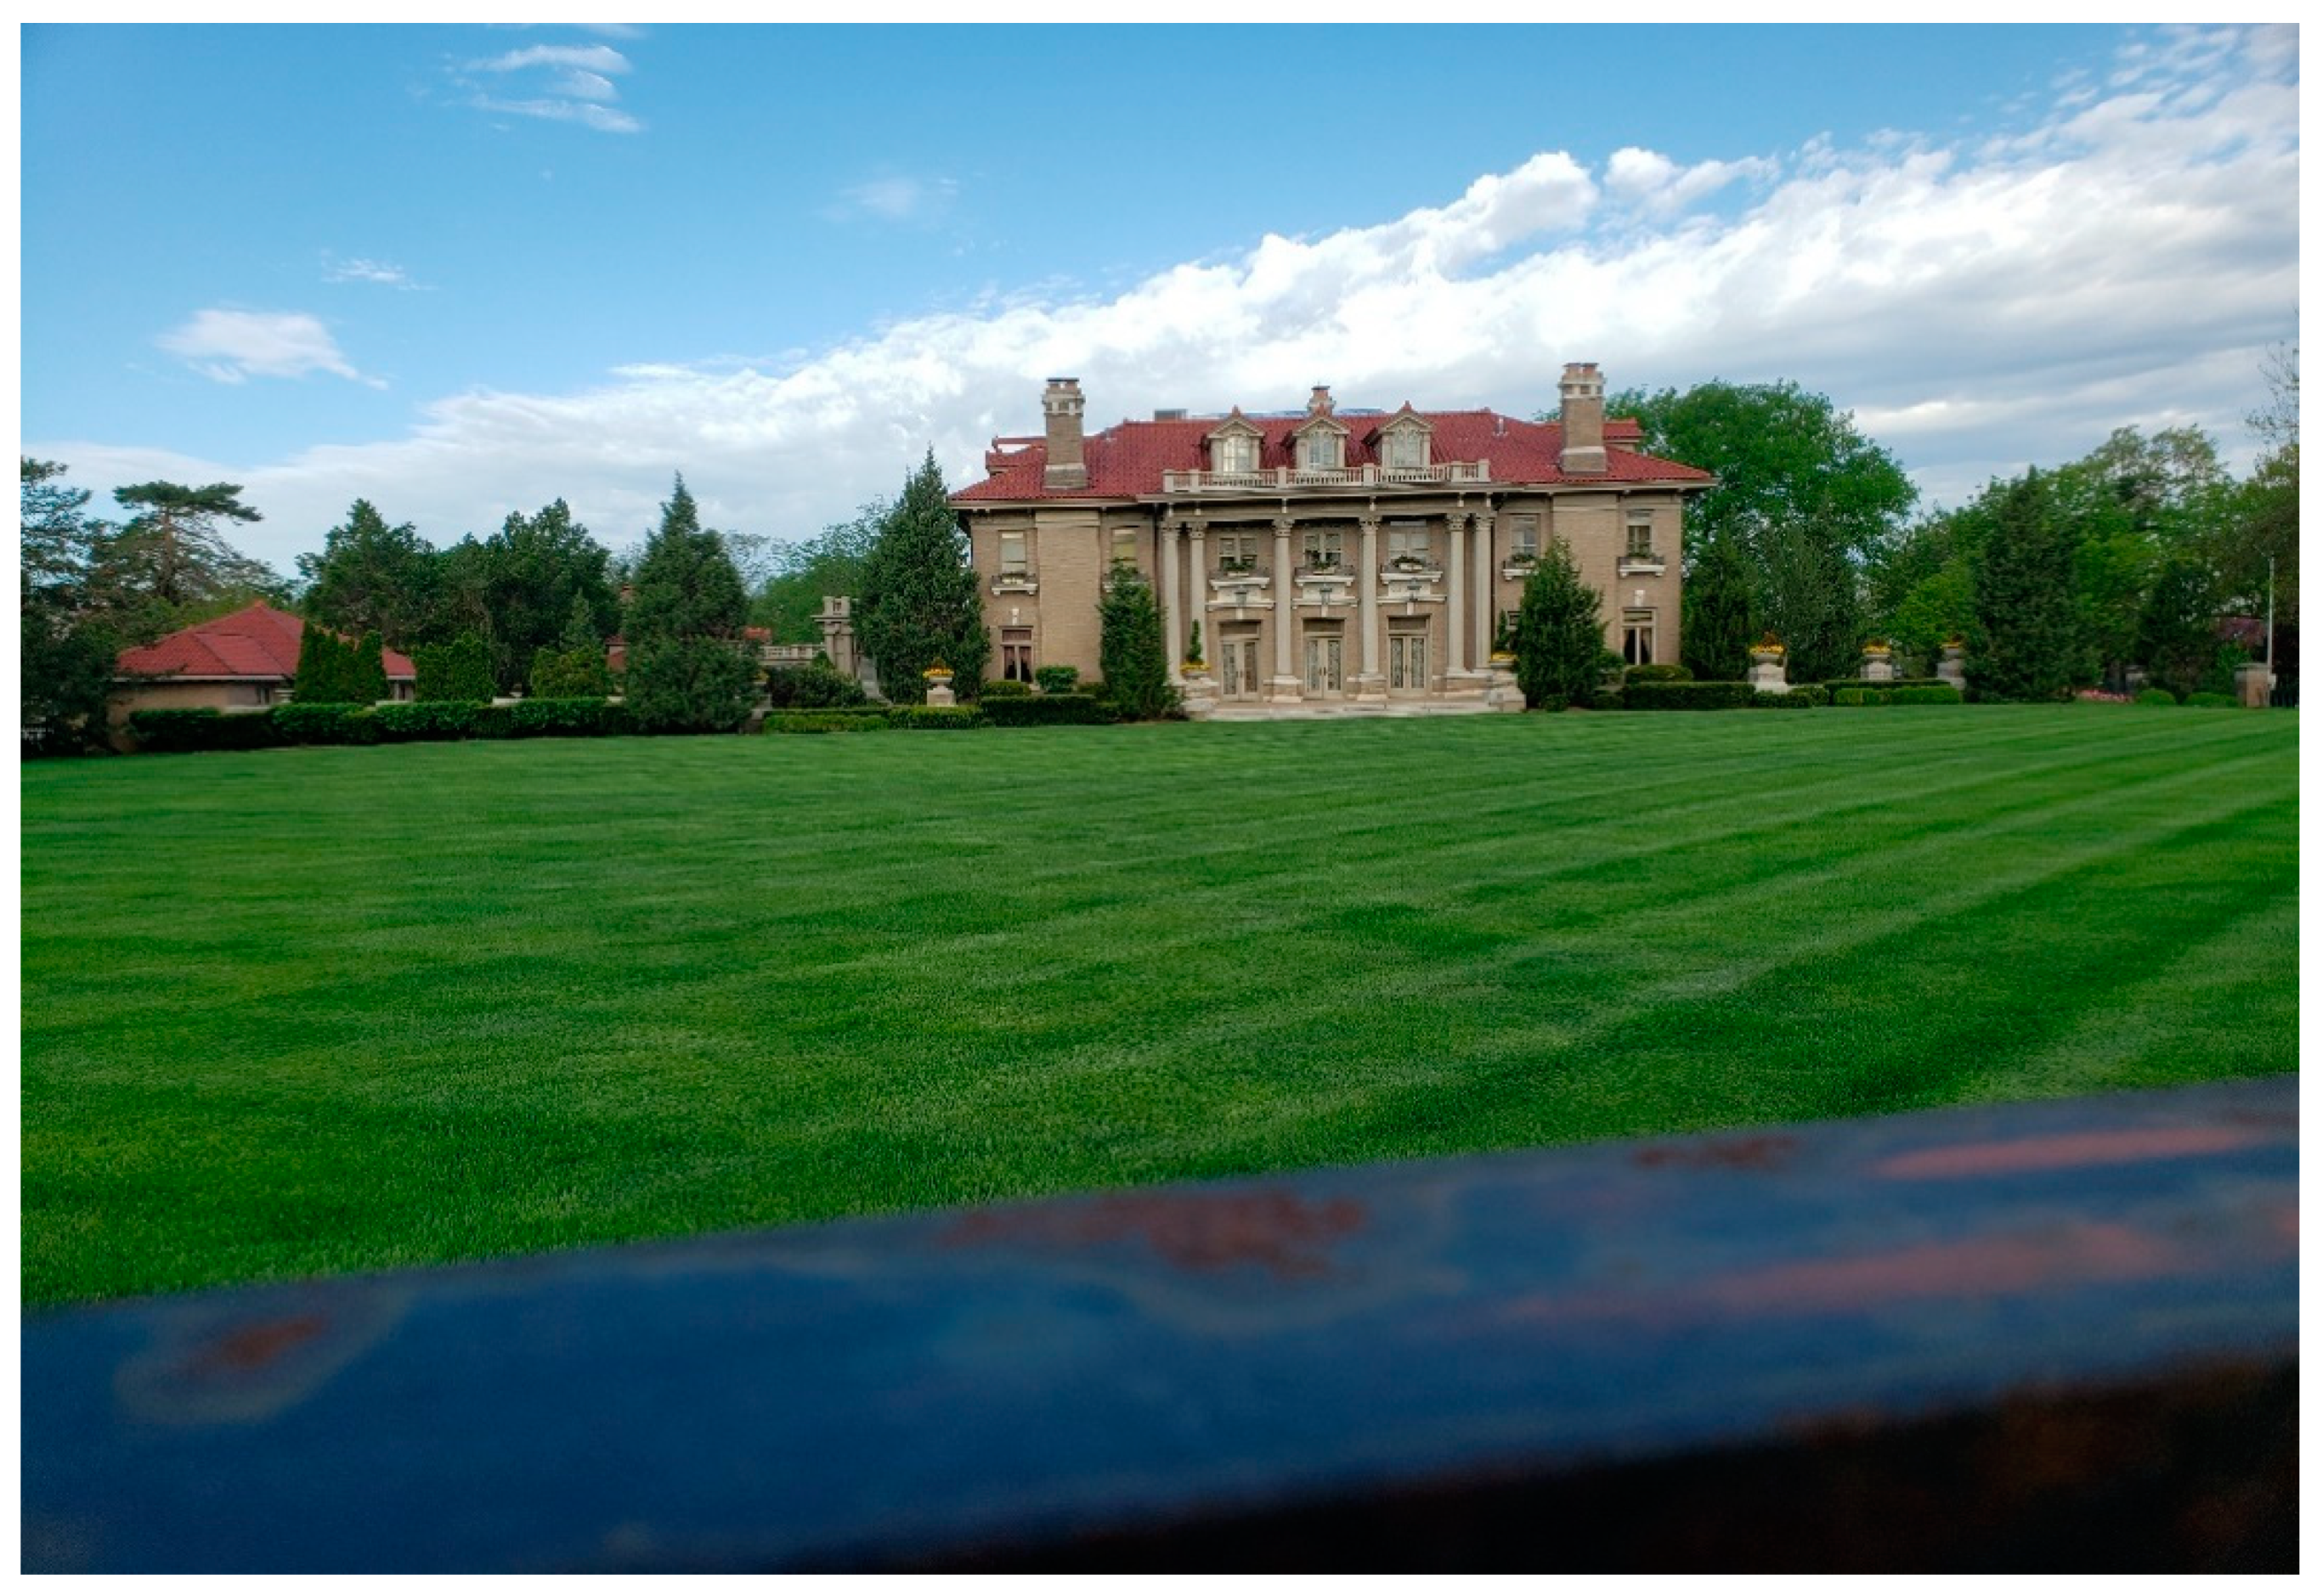
The reader can see one side of the parkway road, then an increase in elevation to the right. A car is visible at approximately 3 o’clock underneath a branch. Figure 4 is a beautiful home in the immediate vicinity, and Figure 5 is a photo of an even larger one.
Baruch College’s School of Business [35] estimated that in 2018 over 65 million people visited New York City, making the city the most visited place in the United States. Even with reductions due to the COVID-19 epidemic, the appeal of Fifth Avenue remains. People gravitate toward Fifth Avenue, located across from Central Park. Nine museums are located along “museum mile” between 82nd and 100th street along Fifth Avenue, including the Metropolitan Museum of the Art and the Guggenheim. The southern part of museum mile intersects with millionaire’s row of mansions built by the Henry Clay Frick, Andrew Carnegie, and others between 59th and 96th street. Many of the grand avenue mansions were demolished and have been replaced by extraordinarily expensive apartments and condominiums located across the street from Central Park.
Two other attractions are large shopping stores such as Saks Fifth Avenue, Lord & Taylors, Tiffany’s, B. Altman, and Bergdorf Goodman. Those not interested in shopping may visit the Empire State Building, Rockefeller Center, Trump Tower and the Chrysler Building between 37th and 51st. Irving Berlin’s 1948 Easter Parade (49th to 57th streets) featuring Fred Astaire’s astonishing dancing skills drew a great deal of attention to Fifth Avenue.
Fifth Avenue’s midtown grandeur is an undeniable magnet. Yet, Fifth Avenue first appears in an 1811 New York City plan on what was burial ground and is now Washington Square Park, near what is now New York University. The first large homes were built in this area in the 1830s on what is now the areas of Greenwich Village and the home of New York University. The ORIGIN was centered at 5th avenue and 17th street, just north of Washington Square Park. The grand avenue northern boundary was set on 120th Street where Marcus Garvey Park changes the road. Overall, Fifth Avenue offers extraordinary attractions for those with resources to afford the cost.
The metrics for Fifth Avenue’s ORIGIN and the grand avenue (Table 4 and Table 5) are similar to Ward Parkway’s. Only the diesel particles, 2.5 pm particles and lead paint were higher than the city as a whole. These are not surprising, given the older housing in the area and high density traffic in this area.
A major economic recession and hazard event could damage part of Fifth Avenue, and COVID-19 has already made cities and other dense concentrations less attractive to those with wealth. It would take a prolonged event to dent Fifth Avenue’s status as a grand avenue.
3.3. Group 2: Four Southern and Western Grand Avenues with Symbolic Advantages and Challenges
The socioeconomic, health and environmental data identify Massachusetts Avenue in Washington, DC, Wilshire Boulevard in Los Angeles, Monument Parkway in Richmond, and St. Charles Avenue in New Orleans as a second group of grand avenues. The data show a pattern across the four. Each ORIGIN and avenue as a whole has much lower health and socioeconomic status numbers (Table 4). These numbers are not as low as those for Ward Parkway and Fifth Avenue. Yet, they are notably lower than their cities as a whole. Hence, these grand avenues have continued to attract relatively healthy, well-educated and affluent people. Their numbers for environmental indicators are almost all over 100. What helps explain the relative attractiveness of these four to healthy and wealthy people? This question is answered for each grand avenue in the following paragraphs.
Massachusetts Avenue’s socioeconomic status numbers are typical of this set (low socioeconomic and health numbers and high environmental numbers compared to the city). By design Massachusetts Avenue is a major northwest to southeast road that intersects almost every major avenue in Washington, D.C. [36]. At 19th Street southeast, it heads northwest around Union Station and then northwest, curving around multiple traffic circles before crossing into Montgomery County, Maryland. Heavy automobile traffic is synonymous with Massachusetts Avenue.
The ORIGIN was centered between Scott and DuPont circles. Like Fifth Avenue, Massachusetts avenue benefits from tourists. Destination DC [37] estimated that 23.8 million people visited Washington, D.C. in 2018, spending $7.8 billion and supporting 76,000 jobs. The district is not only the seat of the national government but it also has numerous museums, war memorials, theaters, multiple universities, a convention center, sports and other attractions bring visitors to this political symbol of the US.
Massachusetts Avenue was once a millionaire’s road. Millionaires row is now Embassy Row, with the clear majority of embassies located along Massachusetts Avenue between Scott Circle and the U.S. Naval Observatory. Those that are not embassies were converted into businesses, headquarters for the American Association for the Advancement of Science, the Airline Pilots Association, the Brookings Institution, the American Enterprise Institute and other organization headquarters. Short of an untoward event such as a major terrorist attack, repeated events such as COVID-19 that reduce the attractiveness of Washington, D.C., it is hard to envision a decline in the importance and attractiveness of Massachusetts Avenue, especially in the Embassy row area along Massachusetts Avenue.
If Fifth Avenue epitomizes a capitalist grand avenue and Massachusetts Avenue a national government one, then Wilshire Boulevard is the grand avenue of U.S. entertainment. Wilshire is a major east–west road between downtown Los Angeles and Santa Monica. When the Los Angeles area was settled, several wealth clusters were established. One is at the intersection of Wilshire Boulevard and Western Avenue, which served this study for the ORIGIN node. The Paramount studios are approximately one mile north, Hancock Park is a short distance west, and nearby are Los Angeles City College, the Wilshire Country Club, the Los Angles Country Club, and Hollywood Forever Cemetery. Within a 30 min trip on the purple mass transit line are MGM studios, the miracle mile with many of Los Ageless museums, the Wilshire Grand Center (tallest building in California at 1100 feet [335 m]), the Grammy Center and the Los Angeles Convention Center. The density of entertainment-related activity around Wilshire Boulevard is remarkable and implies a sustainable grand avenue, unless the area loses its long-standing leading position in the entertainment industry.
Monument Avenue in Richmond, Virginia has had symbolic value and faces major changes because of that symbolism. In the early 20th century, Virginians picked the area to host statues dedicated to confederate war heroes. The grand avenue is best known for the set of monuments built for Confederate leaders Robert E. Lee, J.E.B. Stuart, Jefferson Davis, and Stonewall Jackson. In 1996, a statue was built to honor the famous tennis star, Richmond native Arthur Ashe.
Monument Avenue’s metrics show very good health and socioeconomic results (Table 4). The environmental metrics are less favorable, with 13 of the 14 ratios higher than that for the city, but on average approximately only 5 percent higher than that for the city as a whole.
The author doubts that the environmental metrics are any more than a minor inconvenience to this historic district. Over one century ago, wealthy members of Richmond society purchased lots and moved to apartments along tree-lined 5.4 mile-long (8.69 km) Monument Avenue. One hundred years later, controversy threatens the area. The construction of statues of Confederate leaders has been controversial. After the death of George Floyd in 2020, the Davis Monument was torn down and the Stuart, Jackson, and Maury monuments were removed later in 2020.
Many of the century old homes had already been redesigned to accommodate college students who attend Virginia Commonwealth University (VCU) at the end of Monument Avenue and Richmond University approximately one mile away. Crime rates are higher closer to VCU and the city downtown, and vacancy rates are high because of the university student body [38,39]. Judged by real estate ads for homes, the mansions remain quite expensive. Without the civil rights challenge being played out so dramatically in this area, Monument Avenue appears to be a sustainable residential area for upper and middle income families and college students. The area has a guaranteed market, but it is not clear how the civil rights controversy will impact the neighborhood’s sustainability.
On 15 June 2020, Oliver [40] reported that six residents of Monument Avenue had filed a law suit seeking to prevent removal of the General Robert E. Lee Statute. Their argument is that the removal of this and other statutes would lead to the loss of historic district status and lower the value of property. A counterargument is that Monument Avenue could become a symbol of addressing civil rights injustices. In December 2020, real estate listings do not seem to have notably changed. There has been an attitude change by some people, but it is too early to know how this will be expressed in this area.
St. Charles Avenue in New Orleans is well known for its historic mansions, as well as well as its tree-lined grand avenue. The author placed the ORIGIN adjacent to Tulane University and Loyola University and across the road is Audubon Park and its zoo. The area is served by the St. Charles Street Car line, which runs approximately every 10 min and can bring residents to the Garden District in approximately 20 min and to the French Quarter and central business district in 45–55 min.
Many of St. Charles’s mansions were demolished, until the area became a historic district. Some of the remaining mansions are owned by individual families. Others have become hotels, condominiums, rental housing, small businesses and a library. Two other issues have contributed to the sustainability of this part of St. Charles Avenue’s sustainability. One is the New Orleans police have made a concerted effort to reduce illegal drug activity in the area. Further, Katrina-related flooding of this part of the city was less than in many other parts of the city.
Perhaps, the most powerful elements supporting the attractiveness of the ORIGIN area are the two universities between St. Charles Avenue and Freret Street. Neighborhood Scout [41] reports the area as marked by high real estate value, a low crime rate, accessibility by foot and street car for college students that disproportionately reside in the area.
Like Richmond, New Orleans played a major role in the civil war, which is part of its legacy. Yet, New Orleans has multiple symbolic roles and has multiple nicknames of which the “big easy” is the most prominent, that is, symbolic of easy living with a French twist. New Orleans also has been talking about renaming streets that are identified with the Confederate leaders who symbolized white supremacy. The angst appears to be much less than it has been in Richmond, but there are no guarantees [42].
3.4. Group 3: Five Midwest Industrial Revolution Cities
In regard to sustainability, socioeconomic status, health and environmental metrics place the five grand avenues in Chicago, St. Louis Cleveland, Detroit, and Buffalo at the bottom of sustainability success. Beginning with the cities, in 1910, when the grand avenues in these cities were growing and flourishing, these five cities ranked number 2, 4, 6, 9, and 10 in population in the United States, respectively. A half-century later, each grew in population and as a set they increased from 4.323 to 7.379 million. In 1960, the US was the world’s great manufacturing center, producing half of the world’s manufactured products while containing only 6% of the world’s population. Fifty years later, in 2010, the aggregate population of these five cites was back to 4.386 million. The five cities were economically devastated by de-industrialization, as well as suburbanization, the construction of suburban shopping malls, urban renewal, mortgage financing that hurt older cities, segregation, urban conflicts that were pronounced in the 1960s, and opening of the sunbelt [43].
In regard to the metrics, one pattern carried over from the first six grand avenues to the five Midwest industrial cities. The health indicator numbers for the five ORIGIN nodes were all less than 100 (average 74). Yet their grand avenues as a whole did not continue this pattern (average 101). The avenues had numbers exceeding 100 for half of the 15 comparisons (5 cities × 3 indicators), especially in Chicago and Cleveland. In regard to the socioeconomic indicators, three of five nodes and four of the five grand avenues had numbers exceeding 100. Three of the five grand avenues had higher minority proportions than their cities as a whole. The environmental indicators are higher for the full grand avenues than their cities, especially for traffic, distance from sites with risk management plans, and for diesel and 2.5 pm particles.
Several of the industrial city ORIGIN nodes have been more sustainable than others. Prairie Avenue in Chicago is perhaps the most successful effort to adapt to the dramatic losses in manufacturing. Many of Chicago’s most affluent families moved to South Prairie Avenue and built mansions after the Chicago Fire of 1871 [4]. Industry, once located along Prairie Avenue and the waterfront to the east, decreased and was replaced by commercial and residential development.
The approximately six block-long ORIGIN node in midtown Chicago is no longer filled with mansions. Located near to Soldier Field, the home of the Chicago Bears professional football team, multiple large high-rise condominiums, downtown museums, major hotels, including a Marriot Marquis and Hyatt Regency, the mansions occupied extremely valuable land. The Glessner House was restored and with the Henry Clarke House and the Wheeler mansion, they symbolize what was once a large cluster of mansions along Prairie Avenue. They are in an area that has become a commercial, recreation, and high-rise condo center. Almost half of the residents of the Prairie Avenue ORIGIN node are homeowners, notably different from their counterparts in Detroit, Cleveland, St. Louis, and Buffalo, where homeownership is less than 10%.
Prairie Avenue heads south approximately 18 miles (30 km) from 16th street to 134th street and the Chicago municipal border. The Prairie Avenue ORIGIN node is notably different from the larger grand avenue to the south. For example, in regard to feeling poorly during the last 30 days, the ORIGIN had a number of 45 (lowest among all 11 ORIGIN nodes) whereas the full grand avenue number was 127 for Prairie Avenue out to 134th street. Differences for insurance and obesity were also marked between the ORIGIN and the long extension through south Chicago.
In regard to socioeconomic status, the ORIGIN node’s income and less than high school education metrics were less than half of the cities, and its minority ratio was also lower. Diesel, 2.5 pm particles, and traffic were the same or higher than for the city and the entire grand avenue. Doubtless explained by the construction of new large condominiums, the lead indicator in the ORIGIN is far lower than the city and the entire grand avenue, as well as every other ORIGINs in this study. In short, Prairie Avenue appears to have created a new high-status node and assuming people are willing to continue to live in high-rise clusters post-COVID-19, this grand avenue origin node has a path forward to a sustainable future. The full grand avenue does not appear to have a similar fix toward sustainability as a relatively attractive boulevard.
The neighborhood that constituted Vandeventer Place in St. Louis no longer exists. St. Louis University took over some of the buildings, and therefore it is not surprising that the ORIGIN node’s population of students has many healthy, highly educated and poor residents. Another part of the former gated mansion community is now a hospital. Only approximately six percent of the housing in the ORIGIN node is occupied by their owners. The days of grand mansions occupied by grand families along Vandeventer Place are over.
Buffalo, once a major manufacturing center on Lake Erie, lost more than half of its population between 1960 and 2010. Its millionaires row was on Delaware Avenue. Many of the mansions were demolished before a historic district was created in 1974, and only 17 remained. Further, medical facilities and a small university campus are within one mile, along with another historic district to the west. Rental units now constitute over 80% of the housing.
Like Buffalo and St. Louis, Cleveland had its millionaire’s row with more than 15 mansions on Euclid Avenue. Commercial expansion moved toward the neighborhood. Many of the mansions were turned into apartments, and the Cleveland’s Freeway Interstate 90 cut across Euclid Avenue. Several of the remaining mansions have been taken over by Cleveland State University and associated medical facilities. Sustainability along Euclid Avenue is taking shape along the same lines as its counterparts in Buffalo and St. Louis.
In 1960, Detroit had a population of 1.67 million people and was the 5th most populated city in the US. A half-century later, Detroit’s automobile industry has been undermined by competition and the city lost more than half of its population. Woodward Avenue was the grand avenue for both shopping and housing. It has been transformed into Wayne State University’s major campus, a small campus for Michigan State University, a children’s hospital, the John Dingell VA Medical center, and museums and gallery attractions. The baseball stadium for the Detroit Tigers baseball team and another for the Detroit Lions football team are less than a mile away. The area is now Detroit’s major effort to build a core to replace what it has lost. The era of expensive mansions has passed for Detroit, Cleveland, St. Louis, and Buffalo. Home ownership in the grand avenue nodes in these four cities is 4%, 2%, 6%, and 19%. If the Chicago model diffused to these four, condominiums would draw well-paid workers with a desire for entertainment. These four, however, seem far away from that model in this area for the near-term future.
4. Discussion
In response to the questions raised in the introduction, what was learned about the sustainability of historic city grand avenue-centered neighborhoods by focusing on 11 historic grand avenues? Four observations stand out. The most obvious is that the nodes where these grand avenues originated almost always have remained locations where residents are notably healthier and wealthier than their counterparts living in the same cities. The same observation is to a lesser extent true of their entire boulevard. Second, while health and socioeconomic status indictors are much healthier in grand avenue neighborhoods, air quality measures are not, especially for diesel, 2.5 pm particles and traffic density. Third, the data analysis led to a simple classification of the 11 grand avenues into three groups. Two of the 11 clearly have been grand avenues for their entire history and appear not to have lost any of their ability to attract wealthy and healthy people. A second group of prominent avenues have benefited as physical symbols of US economics, politics and cultures. However, increasing dissatisfaction with racial injustice presents a challenge to two of them. The last group of five former Midwest US cities, once world manufacturing centers, have struggled to maintain their historic grand avenues, using higher education, medical facility, amenities, and, when possible, sports identities to try to find a new role. Fourth, the research demonstrates that new publicly available data sets that have emerged during the last half decade are able to provide information that researchers can use to objectively assess the social, health and environmental status of neighborhoods.
To the best of the author’s knowledge, this is the first effort to use both of these databases to assess the evolution of small urban spaces. This is not to say that a great deal of thinking and effort has not been focused on these same places in relationship, for example, to social and environmental justice [44,45,46,47,48]. What is different here is that the author was able to assess current status with these consistent databases created to allow researchers to perform comparative analyses.
This study has limitations. Five are summarized here. One is that only 11 places were studied. Many more cities in the US and elsewhere had grand avenues, albeit perhaps not as historically grand in appearance. More need to be studied. Second, the author tried to make the analysis as replicable as possible. In fact, however, he made judgments that others might not agree with. One of these is the location of the grand avenue nodes (ORIGINS), and a second is limiting the grand avenue to the host city. Third, the author used less than one-third of metrics in the two databases. The choice to focus on a small number reflects his public health and planning backgrounds, and his knowledge of these places. Clearly, work with the metrics should be undertaken. Fourth, the author knows two of the 11 grand avenues very well. Yet, local historians familiar with these places may conclude that some of the observations drawn from the data about the individual places are incorrect. Fifth, the COVID-19 event has impacted public desire to live in cities, in general, and this author believes the last four grand avenues are more vulnerable than most because of their already serious challenges. While Zakaria [49] believes that people are social animals, and hence will continue to be attracted to cities, a good deal of research is needed to see which cities are impacted more than others. That information will take time to gather.
The future direction of this kind of work is to increasingly incorporate big data to reflect on urban neighborhood sustainability and redevelopment. The data used here will in a matter of a decade markedly expand with more indicators about the social, economic and environmental pillars of neighborhood sustainability. The author expects more timely and granular data will open up opportunities to reflect on urban pasts and connect them to urban futures, including public experiential input. Overall, the author hopes that this project makes a case that it behooves researchers to use data and tools such as those used in this study to improve our understanding of the on the ground reality and possibilities of sustainable historic neighborhoods.
What insights can non-Americans draw from this U.S.-centric study? None will be entirely new to residents of other nations, rather they reinforce ideas, plans and actions put forward by the United Nations, as well as some countries and cities. First, older manufacturing cities have suffered relative to the others, which has been transferred, although not completely, to their grand avenues. The implication is that plans to economically diversify cities are imperative. Second, the granular scale of analysis shows interactions among social, economic and environmental pillars of sustainability. These need to be monitored and balanced because the historic advantages of grand avenues can be lost, especially when original homes are stressed by aging and loss of attractive neighborhood attributes. Third, opportunities to enhance recreational, educational, medical, cultural, art, and historical roles can provide the sustainable core, especially when linked to readily accessible and flexible non-automobile transportation opportunities and appropriate levels of policing. In the U.S., historic district designation has helped, but many of the most attractive elements of grand avenues were lost before these designations occurred. Fourth, we are rapidly moving into an era when social, economic, demographic, and public health data will be integrated into publicly available databases that will allow closer meaningful interaction between professionals and community members in developing and simulating on computers the impacts of different neighborhood designs. To the best of the author’s knowledge, this was the first time that the two databases were used at this granular level. This clearly will not be the last time. The author is currently involved in work that will report on the extent to which large cities are focusing on maintaining grand avenues, restoring them, or changing their purposes using databases such as these.
While individual cities develop, debate, and implement options, the United Nation’s Sustainable Goal 11 (SDG 11) [50] addresses much of what has been examined in this study at the macro level. SDG 11 calls for making cities inclusive, safe, resilient, and sustainable. Their report addresses specifics such as safe and affordable housing, service and transportation. It speaks to comprehensive risk management, green and public spaces, and many other attributes that would make places more attractive and sustainable. The author is optimistic that we have demographic, social, economic, environmental, infrastructure and other data sets that will allow analysts and community representatives to plan together for grand avenue and less grand places.
Funding
No funding was available for this research.
Institutional Review Board Statement
Not applicable for studies not involving humans.
Informed Consent Statement
Not applicable for studies not involving humans.
Data Availability Statement
The data are from public data sets. However, a reviewer wanted to see a located ORIGIN and some data. Hence, the author added this table and Figure 2 (above).
Acknowledgments
The author thanks three anonymous reviewers for their constructive suggestions.
Conflicts of Interest
The author declares no conflict of interest.
Appendix A. Data Sets
Table A1 presents SAMPLE data gathered from the ESCREEN and CDC data sets. The EJSCREEN ORIGIN numbers are compared to the state numbers in the table. Then they are compared to their host city in the analysis. The CDC numbers are rates that are compared to the city as a whole in the analysis. To simplify the information, node and city data are presented, and not the full grand avenue. The first row is Fifth Avenue and the last Wilshire Boulevard. The designation 1 represents the ORIGIN node and the designation 3 represents the entire city. PM = PM2.5; oz = ozone; diesel = diesel particles; traf = traffic; lead = lead; sup = superfund; rmp = risk management plan; min=minority; ling=linguistic isolation; inc=low income; physical health last 30 days; obe=obesity; ins=insurance. The last three columns are ratios of ORIGIN node to city x 100: phy1/3 = node divided by city; obe1/3 = node/city; insu1/3 = node/city

Table A1.
Selected Data and Several Calculations.
| Location | pm1 | pm3 | oz1 | oz3 | des1 | des3 | traf1 | traf3 | lead1 | lead3 | |
|---|---|---|---|---|---|---|---|---|---|---|---|
| 1-5TH AVE | 96 | 87 | 29 | 41 | 99 | 91 | 82 | 89 | 51 | 50 | |
| 2-BUFFAL | 47 | 47 | 91 | 85 | 56 | 41 | 75 | 66 | 76 | 81 | |
| 3-DETROIT | 92 | 94 | 80 | 66 | 98 | 92 | 95 | 92 | 73 | 87 | |
| 4-CLEVE | 93 | 88 | 27 | 30 | 95 | 92 | 97 | 91 | 71 | 85 | |
| 5-CHICAGO | 80 | 78 | 44 | 68 | 98 | 93 | 95 | 92 | 30 | 71 | |
| 6-NEWYORK | 18 | 18 | 79 | 90 | 90 | 93 | 85 | 93 | 98 | 91 | |
| 7-DC-MASS | 47 | 38 | 52 | 44 | 92 | 63 | 90 | 65 | 25 | 42 | |
| 8-STL-VAN | 96 | 92 | 89 | 89 | 98 | 94 | 97 | 93 | 78 | 91 | |
| 9-RICHMOND | 81 | 79 | 43 | 41 | 87 | 75 | 93 | 87 | 97 | 91 | |
| 10-WARD PKY | 28 | 27 | 56 | 62 | 81 | 77 | 89 | 86 | 91 | 74 | |
| 11-WILSHIRE | 78 | 66 | 52 | 60 | 85 | 78 | 85 | 88 | 81 | 73 | |
| sup1 | sup3 | rmp1 | rmp3 | min1 | min3 | ling1 | ling3 | hsl1 | hsl3 | inc1 | |
| 1-5TH AVE | 64 | 79 | 65 | 77 | 41 | 62 | 44 | 69 | 13 | 58 | 23 |
| 2-BUFFAL | 12 | 13 | 99 | 96 | 58 | 63 | 62 | 56 | 63 | 66 | 77 |
| 3-DETROIT | 37 | 47 | 89 | 82 | 88 | 93 | 86 | 78 | 72 | 89 | 92 |
| 4-CLEVE | 20 | 25 | 90 | 90 | 87 | 91 | 97 | 88 | 81 | 88 | 96 |
| 5-CHICAGO | 46 | 56 | 93 | 83 | 72 | 78 | 69 | 79 | 31 | 75 | 40 |
| 6-NEWYORK | 78 | 91 | 95 | 83 | 45 | 78 | 63 | 75 | 11 | 50 | 23 |
| 7-DC-MASS | 59 | 71 | 65 | 60 | 34 | 47 | 69 | 68 | 40 | 56 | 40 |
| 8-STL-VAN | 64 | 86 | 93 | 90 | 87 | 90 | 78 | 84 | 60 | 71 | 87 |
| 9-RICHMOND | 71 | 73 | 97 | 92 | 42 | 79 | 53 | 67 | 31 | 73 | 85 |
| 10-WARD PKY | 50 | 71 | 81 | 70 | 40 | 86 | 72 | 88 | 3 | 59 | 1 |
| 11-WILSHIRE | 62 | 69 | 15 | 71 | 56 | 56 | 83 | 75 | 32 | 68 | 39 |
| inc3 | phy1 | phy3 | obe1 | obe3 | insu1 | insu3 | phy1/3 | obe1/3 | insu1/3 | ||
| 1-5TH AVE | 57 | 6.80 | 12.40 | 13.50 | 24.40 | 6.10 | 16.10 | 0.55 | 0.55 | 0.38 | |
| 2-BUFFAL | 82 | 13.90 | 15.10 | 32.80 | 35.10 | 14.30 | 14.30 | 0.92 | 0.93 | 1.00 | |
| 3-DETROIT | 88 | 13.50 | 19.40 | 31.50 | 44.50 | 13.90 | 18.50 | 0.70 | 0.71 | 0.75 | |
| 4-CLEVE | 87 | 11.70 | 18.70 | 32.40 | 41.00 | 12.40 | 16.60 | 0.63 | 0.79 | 0.75 | |
| 5-CHICAGO | 72 | 5.40 | 11.90 | 26.70 | 32.30 | 8.90 | 17.80 | 0.45 | 0.83 | 0.50 | |
| 6-NEWYORK | 63 | 10.00 | 14.60 | 29.30 | 35.40 | 9.60 | 14.40 | 0.68 | 0.83 | 0.67 | |
| 7-DC-MASS | 57 | 5.50 | 9.00 | 18.30 | 25.50 | 5.50 | 8.30 | 0.61 | 0.72 | 0.66 | |
| 8-STL-VAN | 73 | 8.50 | 14.80 | 28.70 | 35.50 | 12.70 | 18.10 | 0.57 | 0.81 | 0.70 | |
| 9-RICHMOND | 83 | 7.50 | 13.00 | 24.70 | 16.90 | 12.10 | 16.90 | 0.58 | 0.74 | 0.72 | |
| 10-WARD PKY | 58 | 8.80 | 14.00 | 23.20 | 17.30 | 6.80 | 17.30 | 0.63 | 0.65 | 0.39 | |
| 11-WILSHIRE | 67 | 9.00 | 12.30 | 18.90 | 17.60 | 8.80 | 17.60 | 0.73 | 0.75 | 0.50 |
References
- National Research Council. Sustainability and the U.S. EPA; The National Academies Press: Washington, DC, USA, 2011; Available online: https://www.nap.edu/catalog/13152/sustainability-and-the-us-epa (accessed on 23 December 2020). [CrossRef]
- National Research Council. Sustainability Concepts in Decision-Making: Tools and Approaches for the US Environmental Protection Agency; The National Academies Press: Washington, DC, USA, 2014. [Google Scholar] [CrossRef]
- Jacobs, A.; MacDonald, E.; Robe, Y. The Boulevard Book; MIT Press: Cambridge, MA, USA, 2002. [Google Scholar]
- Cigliano, J.; Bradford, S. The Grand American Avenue, 1850–1920; Pomegranate Artbooks: San Francisco, CA, USA, 1994. [Google Scholar]
- Rostow, W. The Stages of Economic Growth: A Non-Communist Manifesto; Cambridge University Press: Cambridge, MA, USA, 1960. [Google Scholar]
- Harris, C. A Functional Classification of Cities in the United States. Geogr. Rev. 1943, 33, 86–99. [Google Scholar] [CrossRef]
- Pred, A. The Spatial Dynamics of U.S. Urban Industrial Growth, 1800–1914: Interpretive and Theoretical Essays; MIT Press: Cambridge, MA, USA, 1966. [Google Scholar]
- Alexander, J. The Basic-Nonbasic Concept of Urban Economic Functions. Econ. Geogr. 1954, 30, 246–261. [Google Scholar] [CrossRef]
- Morrissett, I. The Economic Structure of American Cities. Reg. Sci. Assoc. Pap. Proc. 1958, 4, 239–256. [Google Scholar] [CrossRef]
- Nelson, H. A Service Classification of American Cities. Econ. Geogr. 1955, 31, 189–210. [Google Scholar] [CrossRef]
- Duncan, O.; Scott, W.; Lieberson, S.; Duncan, B.; Winsborough, H. Metropolis and Region; The Johns Hopkins Press: Baltimore, MD, USA, 1960. [Google Scholar]
- Greenberg, M.; Schneider, D. Environmentally Devastated Neighborhoods: Perceptions, Realities, and Policies; Rutgers University Press: New Brunswick, NJ, USA, 1996. [Google Scholar]
- Greenberg, M. Improving Neighborhood Quality: A Hierarchy of Needs. Hous. Policy Debate 1999, 10, 601–624. [Google Scholar] [CrossRef]
- Sternlieb, G. The Tenement Landlord; Rutgers University Press: New Brunswick, NJ, USA, 1969. [Google Scholar]
- Stebbins, S. The Midwest Is Home to Many of America’s Most Dangerous Cities. 26 October 2019. Available online: http://www.jsoline.com (accessed on 20 December 2020).
- Arrest Records.com. The 25 Worst Neighborhoods in the United States. 2020. Available online: https://www.arrestrecords.com/the-25-worst-neighbeohoods-in-the-United-States/ (accessed on 16 December 2020).
- Nardone, A.; Chiang, J.; Corburn, J. Historic Redlining and Urban Health Today in U.S. Cities. Environ. Justice 2020, 13, 109–119. [Google Scholar] [CrossRef]
- Trahner, E. People Can’t Flee These U.S. Cities Fast Enough. 2020. Available online: https://momeywise.com/a/people-cant-flee-these-us-cities-fast-enough (accessed on 17 December 2020).
- Whiteman, D. People Living in these US Cities Are Most Eager to Get Out. 2020. Available online: https://www.google.com/search?channel=tus2&client=firefox-b-1-d&q=Doug+Whiteman.+US+cities+are+most+eager (accessed on 20 December 2020).
- Sauter, M. 50 U.S. Cities People Are Leaving in Droves. 1 January 2019. Available online: https://www.businessinsiders.com/50-cities-americans-have-been-abandoning-in-the last decade (accessed on 19 December 2020).
- Florida, R. The Rise of the Creative Class; Basic Books: New York, NY, USA, 2002. [Google Scholar]
- Smith, A. The Wealth of Nations; Introduction by Robert Reich; Modern Library: New York, NY, USA, 2000. [Google Scholar]
- Glaeser, E. The New Economics of Urban and Regional Growth. In The Oxford Handbook of Economic Geography; Clark, G., Feldman, M., Gertler, M., Eds.; Oxford University Press: Oxford, UK, 2003; pp. 83–98. [Google Scholar]
- Martin, E. These Are the 15 US Cities Attracting the Most Millennials—LA and New York Didn’t Make the List. 2018. Available online: https://www.cnbc.com/2018/06/13/u-s-cities-most-popular-fro-millennilas.html (accessed on 20 December 2020).
- Niche 2020 Best. Neighborhoods to Live in America. 2020. Available online: https://www.niche.com/places-to-live/search/best-neighborhoods/ (accessed on 20 December 2020).
- Niche 2020. Best Cities to Live in America. 2020. Available online: https://www.niche.com/places-to-live/search/best-cities (accessed on 26 December 2020).
- City of Galveston. Hazard Mitigation Plan, Update. 2017. Available online: https://www.galvestontx.gov/DocumentCenter/View/9437/COG-HMP---Final---080217 (accessed on 26 December 2020).
- US Environmental Protection Agency. EJSCREEN Technical Documentation; U.S. EPA: Washington, DC, USA, 2019. [Google Scholar]
- Committee on Remedial Action Priorities for Hazardous Waste Sites for Remedial Action Priorities; National Research Council. Ranking Hazardous Waste Sites for Remedial Action; National Academy Press: Washington, DC, USA, 1994. [Google Scholar]
- US EPA. Risk Management Plan (RMP) Rule. 2020. Available online: https://www.epa.gov/rmp (accessed on 26 December 2020).
- Center for Disease Control and Prevention (CDC). Behavioral Risk Factor Surveillance System. 2020. Available online: https://www.cdc.gov/brfss/annual_data/annual_data.htm (accessed on 26 December 2020).
- Centers for Disease Control and Prevention. 500 Cities Project: 2016 to 2019. 2020. Available online: https://www.cdc.gov/places/about/500-cities-2016-2019/index.html (accessed on 26 December 2020).
- American Planning Association. Ward Parkway: Kansas City, Missouri. 2012. Available online: https://planning.org/greatplaces/streets/2012/wardparkway.htm (accessed on 16 December 2020).
- Mid-America Regional Council. Operation Green Light Traffic Signal Coordination Report: Ward Parkway Corridor, 55th to 89th. 2013. Available online: https://www.marc.org/Transportation/Programs/assets/signal/Ward-Pkwy-Full-Report.aspx (accessed on 23 December 2020).
- Baruch College, NYC: Tourism. 2018. Available online: https://www.baruch.cuny.edu/nycdata/tourism/index.html (accessed on 23 December 2020).
- Berg, S. Grand Avenues: The Story of Pierre Charles L’Enfant, the French Visionary Who Designed Washington, D.C.; Random House, Vintage Books: New York, NY, USA, 2008. [Google Scholar]
- Destination DC. Destination DC Announces Record 23.8 Million Visitors to Washington, D.C. in 2018. 2019. Available online: www.Prnewswire.com (accessed on 24 December 2020).
- Neighborhood Scout. Richmond, VA (Virginia Commonwealth U). 2020. Available online: htps://www.neigbeohooddscout.com/va/richmond/Virginia-commonweakth (accessed on 23 December 2020).
- Neighborhood Scout. Richmond, VA (Monument Ave/Mulberry St). 2020. Available online: htps://www.neigbeohooddscout.com/va/richmond/Virginia-commonweakth (accessed on 23 December 2020).
- Oliver, N. Fearing Loss of Favorable Tax Treatment, Six Monument Ave. Residents Join Legal Effort to Halt Statue Removal. 15 June 2020. Available online: https://www.virginiamercury.com/2020/06/15/fearing-loss-of-favorabler (accessed on 23 December 2020).
- Neighborhood Scout. About New Orleans, LA (Tulane U of Louisiana/Freret St). 2020. Available online: https://www.neighbrohoodscout.com/la/new-orleans/tulane-u-of-lou (accessed on 23 December 2020).
- Adelson, J. Parks, Streets “That Honor White Supremacists” Would Be Re-Named by This New Orleans Committee. 9 June 2020. Available online: https://www.nola.com/news/article_02e2c3c0-aa96-11ea-9c26-930417d9d67a.html (accessed on 24 December 2020).
- Fishman, R. The American Metropolis at Century’s End: Past and Future Influences. Hous. Policy Debate 2000, 11, 199–213. [Google Scholar] [CrossRef]
- Hirsch, A. Making the Second Ghetto: Race and Housing in Chicago, 1940–1960; University of Chicago Press: Chicago, IL, USA, 1983. [Google Scholar]
- Sides, J.L.A. City Limits: African American Los Angeles from the Great Depression to the Present; University of California Press: Berkeley, CA, USA, 2006. [Google Scholar]
- Sprague, T. The Origins of the Urban Crisis: Race and Inequality in Detroit; Princeton University Press: Princeton, NJ, USA, 1996. [Google Scholar]
- Angotti, T.; Morse, S. (Eds.) Zoned Out! Race, Displacement, and City Planning in New York City; Terreform: New York, NY, USA, 2017. [Google Scholar]
- Rothstein, R. The Color of Law: A Forgotten History of How Our Government Segregated America; Liveright: New York, NY, USA, 2017. [Google Scholar]
- Zakaria, F. Ten Lessons for a Post-Pandemic World; W.W. Norton: New York, NY, USA, 2020. [Google Scholar]
- Department of Economic and Social Affairs, United Nations. Goal 11: Make Cities Inclusive, Safe, Resilent, and Sustainable. 2020. Available online: https://sdgs.un.org/goals/goal11 (accessed on 18 January 2021).
Figure 1.
Location of eleven cities. Cities: 1 = Buffalo, NY; 2 = Cleveland, OH; 3 = New York, NY; 4 = Washington, DC; 5 = Richmond, VA.; 6 = Chicago, IL; 7 = New Orleans, LA; 8 = St. Louis, MO; 9 = Kansas City, MO; 10 = Los Angeles, CA; 11 = Detroit, MI.
Figure 1.
Location of eleven cities. Cities: 1 = Buffalo, NY; 2 = Cleveland, OH; 3 = New York, NY; 4 = Washington, DC; 5 = Richmond, VA.; 6 = Chicago, IL; 7 = New Orleans, LA; 8 = St. Louis, MO; 9 = Kansas City, MO; 10 = Los Angeles, CA; 11 = Detroit, MI.

Figure 2.
Ward Parkway ORIGIN node.

Figure 3.
Ward Parkway median near 55th Street on Ward Parkway.

Figure 4.
Home on Ward Parkway.

Figure 5.
Ward Parkway Mansion (Mack B. Nelson house).

Table 1.
Eleven grand avenues.
| Grand Avenue | City | Estimated Population of City, 2020 (Pre-Census Numbers) 1000s |
|---|---|---|
| Delaware Avenue | Buffalo, NY | 255 |
| Euclid Avenue | Cleveland, Ohio | 379 |
| Fifth Avenue | New York City, NY | 8551 |
| Massachusetts Avenue | Washington, DC | 721 |
| Monument Avenue | Richmond, VA | 232 |
| Prairie Avenue | Chicago, IL | 2694 |
| St. Charles Avenue | New Orleans, LA | 390 |
| Vandeventer Place | St. Louis, MO | 294 |
| Ward Parkway | Kansas City, MO | 505 |
| Wilshire Boulevard | Los Angeles, CA | 4016 |
| Woodward Avenue | Detroit, MI | 667 |
Table 2.
EJSCREEN metrics, 2019 *.
| Metric | Explanation |
|---|---|
| Demographic | Vulnerable Population Proxies |
| Minority population, % | More vulnerable population |
| Low-income population, % | More vulnerable population |
| Population with less than a high school education, % | More vulnerable population |
| Linguistically isolated population, % | More vulnerable population |
| Environmental | Selected indicators |
| Particulate matter (PM 2.5 in ug/m3) | Annual average, year 2016 of particles 2.5 microns or less in diameter. Numbers derived from a combination of monitoring and modeling. |
| Ozone (ppb) | May-September average, ozone level, 2016. A combination of monitoring and modeling. |
| NATA diesel PM (ug/m3) | Diesel particulate matter level in air, 2014. National Air Toxics Assessment program focused on 187 hazardous air pollutants. |
| Traffic proximity and volume (daily traffic count/distance to road) | Annual average vehicle count at major roads within 500 m of block centroid divided by distance in meters, 2017 |
| Superfund proximity (site count/km distance) | Count of proposed and listed divided by distance in km, 2019 |
| RMP proximity (facility count/km distance) | Sites within 5 km or nearest one beyond 5 km divided by distance in km, 2019. |
| Lead paint indicator (% pre-1960 housing) | % of housing built pre-1960, as an indicator of potential lead exposure, 2013–2017. |
* Source: US EPA [28].
Table 3.
Population data for grand avenues, 2013–2017.
| Grand Avenue | Grand Avenue Node (ORIGINS) Population, 2013–2017 * | Grand Avenue Node (ORIGINS), Population Density per sq. mi [2.59 sq. km], 2013–2017 | Entire Grand Avenue (ENTIRES) Population, 2013–2017 | Entire Grand Avenue (ENTIRES) Population Density, per sq. mile [2.59 sq. km], 2013–2017 ** | Entire Grand Avenue (ENTIRES) Area, sq. miles [2.59 sq. km] |
|---|---|---|---|---|---|
| Delaware Avenue | 6332 | 8015 | 39,028 | 7364 | 5.30 |
| Euclid Avenue | 6231 | 7887 | 31,162 | 5457 | 5.71 |
| Fifth Avenue | 75,704 | 95,827 | 377,457 | 61,176 | 6.17 |
| Massachusetts Avenue | 23,208 | 29,377 | 97,745 | 14,923 | 6.55 |
| Monument Avenue | 9588 | 12,136 | 21,691 | 5278 | 4.11 |
| Prairie Avenue | 15,305 | 19,373 | 173,623 | 9640 | 18.01 |
| St. Charles Avenue | 7664 | 9701 | 31,791 | 9350 | 3.40 |
| Vandeventer Place *** | 5835 | 7386 | 14,951 | 4902 | 3.05 |
| Ward Parkway | 1189 | 1505 | 23,296 | 3669 | 6.35 |
| Wilshire Boulevard | 5790 | 7329 | 367,240 | 20,819 | 17.64 |
| Woodward Avenue | 6607 | 8363 | 39,589 | 4350 | 9.10 |
* Population estimated to reside in 0.79 square mile [1.61 sq. km] circle with a radius of ½ mile [804.7 m]. ** Area based on a polygon with a distance from the center line to the edges of ½ mile [804.7 m]. *** Used Vandeventer Avenue as the full grand avenue.
Table 4.
Socioeconomic, public health, and environmental metric index results by grand avenue *.
| Grand Avenue | ORIGIN Grand Avenue SES | ORIGIN Grand Avenue Public Health | ORIGIN Grand Avenue Environment | ENTIRE Grand Avenue SES | ENTIRE Grand Avenue Public Health | ENTIRE Grand Avenue Environment |
|---|---|---|---|---|---|---|
| Ward Parkway [Kansas City] | 34 | 56 | 102 | 47 | 69 | 94 |
| Fifth Avenue [New York City] | 48 | 49 | 93 | 88 | 69 | 97 |
| St. Charles Avenue [New Orleans] | 50 | 73 | 98 | 89 | 71 | 101 |
| Monument Avenue [Richmond] | 69 | 68 | 106 | 55 | 64 | 105 |
| Massachusetts Avenue [Washington, D.C.] | 79 | 66 | 111 | 66 | 73 | 104 |
| Wilshire Boulevard [Los Angeles] | 79 | 66 | 90 | 103 | 63 | 101 |
| Prairie Avenue [Chicago] | 69 | 59 | 87 | 96 | 118 | 107 |
| Woodward Avenue [Detroit] | 98 | 72 | 100 | 98 | 83 | 101 |
| Vandeventer Place ** [St. Louis] | 99 | 66 | 99 | 104 | 108 | 101 |
| Euclid Avenue [Cleveland] | 102 | 72 | 96 | 102 | 110 | 98 |
| Delaware Avenue [Buffalo] | 95 | 95 | 107 | 82 | 98 | 101 |
| Median | 79 | 66 | 98 | 89 | 73 | 101 |
* Numbers are average of (ORIGINS/city) × 100 in columns 2–4, and (ENTIRES/city) × 100 in columns 5–7. For example, 34 for Ward Parkway for SES 34 means that the origination node number was 34% of the city number averaged across the set of four SES indicators. ** Vandeventer Avenue used as entire grand avenue.
Table 5.
Grouped aggregate results for grand avenues.
| Grand Avenue | Group | Average ORIGIN and ENTIRE Grand Avenue | Lower Values than City (max = 28) |
|---|---|---|---|
| Ward Parkway [Kansas City] | 1 | 67 | 20 |
| Fifth Avenue [New York City] | 1 | 74 | 23 |
| St. Charles Avenue [New Orleans] | 2 | 81 | 21 |
| Monument Avenue [Richmond] | 2 | 78 | 14 |
| Massachusetts Avenue [Washington, D.C.] | 2 | 83 | 19 |
| Wilshire Boulevard [Los Angeles] | 2 | 84 | 18 |
| Prairie Avenue [Chicago] | 3 | 90 | 14 |
| Woodward Avenue [Detroit] | 3 | 92 | 17 |
| Vandeventer Place * [St. Louis] | 3 | 94 | 12 |
| Euclid Avenue [Cleveland] | 3 | 97 | 12 |
| Delaware Avenue [Buffalo] | 3 | 97 | 17 |
| Median | na | 84 | 17 |
* Vandeventer Avenue used as entire grand avenue.
Publisher’s Note: MDPI stays neutral with regard to jurisdictional claims in published maps and institutional affiliations. |
© 2021 by the author. Licensee MDPI, Basel, Switzerland. This article is an open access article distributed under the terms and conditions of the Creative Commons Attribution (CC BY) license (http://creativecommons.org/licenses/by/4.0/).
Share and Cite
MDPI and ACS Style
Greenberg, M.R. Measuring Historical Urban Neighborhood Sustainability: America’s Grand Avenues. Sustainability 2021, 13, 1358. https://0-doi-org.brum.beds.ac.uk/10.3390/su13031358
AMA Style
Greenberg MR. Measuring Historical Urban Neighborhood Sustainability: America’s Grand Avenues. Sustainability. 2021; 13(3):1358. https://0-doi-org.brum.beds.ac.uk/10.3390/su13031358
Chicago/Turabian StyleGreenberg, Michael R. 2021. "Measuring Historical Urban Neighborhood Sustainability: America’s Grand Avenues" Sustainability 13, no. 3: 1358. https://0-doi-org.brum.beds.ac.uk/10.3390/su13031358
Note that from the first issue of 2016, this journal uses article numbers instead of page numbers. See further details here.