Case Report

Transit-Oriented Development: Exploring Citizen Perceptions in a Booming City, Can Tho City, Vietnam

1
Research Center of Smart Construction, National Central University, Jhongli, Taoyuan 32001, Taiwan
2
Department of Civil Engineering, National Central University, Jhongli, Taoyuan 32001, Taiwan
3
School of Management Science and Real Estate, Chongqing University, Chongqing 400044, China
*
Author to whom correspondence should be addressed.
Sustainability 2021, 13(3), 1370; https://0-doi-org.brum.beds.ac.uk/10.3390/su13031370
Submission received: 31 December 2020 / Revised: 23 January 2021 / Accepted: 25 January 2021 / Published: 28 January 2021
(This article belongs to the Special Issue Sustainable Transportation and Traffic in Smart Cities)

Abstract

:
Transit-oriented development (TOD) is a crucial method for sustainable urban development and encouraging the use of public transit, especially for large densely populated cities such as Can Tho City, one of the top five cities in Vietnam. This study is aimed at identifying the factors which have a significant effect on the citizens’ engagement of public transport in the TOD environment. Based on the literature review and expert knowledge, 3 hypotheses related to citizens’ perceptions and citizen’s engagement are developed. A questionnaire was accordingly established using structural equation modeling (SEM). As a result, a total of 8 factors with 31 stems were obtained. The survey questionnaires were distributed to citizens of Can Tho City with 749 responses collected for KMO test Chi-square of 0.905. The analysis shows that all three hypotheses stand: (1) the citizens’ perception of local government’s capacity plays an important role in the citizens’ willingness to engage on public transport; the citizens’ perception of the usefulness of (2) TOD and (3) public transport has a positive influence on the engagement on public transport system. The major contribution of this study is that it can help other cities in developing countries to apply TOD.

1. Introduction

The impact of both global warming and the decreasing amount of non-renewable resources have made the necessity to achieve sustainable urban transportation more essential than ever in many countries. The rapid increase in private transportation has become a serious problem in several cities. This rise is correlated with environmental pollution and the exhaustion of natural resources. Therefore, the principles of population-environment balance, which aims to bring an economically viable society in harmony with the ecological system, are encouraged. Transit-oriented development (TOD) has recently become popular as a mechanism to encourage intelligent growth and sustainable development in urban areas where TOD can be regarded as an urban development that optimizes the residential, business and leisure space within walking distance of public transport [1,2]. TOD could play a central role in achieving sustainable transportation and resolving mobility issues and their impacts on the urban environment [3]. There are two situational challenges to face in the implementation of TOD in developed countries in Europe, the United States, and Australia. It is first necessary to construct new urban development with the focus on TOD; the second is to restructure existing urban areas to enhance TOD [4]. It was found that the TOD implementation strategy developed first in European cities, before moving towards complete adoption of TOD in the American-Australian model [5]. However, Vietnam has different features and may have to follow different routes than developed countries in terms of “smart” development and sustainable transportation, given their special political system and central-local government relationship. Given its young and dynamic urban population, high levels of internet coverage, and the trend of extensive international integration, Vietnam still has many opportunities to build a new city structure with a smart and sustainable transportation system [6].
For TOD to be successful, the coordination of land use and transport was identified as a key point [7]. However, the involvement of citizens was also one of the crucial elements in achieving TOD towards sustainable mobility [8]. It was shown that the opinion of the population in judging a service can contribute to the planning phase of a city’s transport systems [9]. The views of local people on problems and solutions can be quite distinct from those who are responsible for formulating policies. The bottom-up approach could highlight some key issues related to the implementation process and provide benefits for the future policy strategies of the city [10]. Additionally, the engagement of citizens on transport schemes can be easier to achieve via social media platforms [11]. Several studies have been carried out examining the citizen’s perception and the citizen’s engagement in the field of sustainable transportation development. However, less research has been conducted on the relationship between the perceptions and the engagement of citizens in public transport systems in the TOD environment, particularly in developing countries.
This study was carried out to address the possibility of TOD in Can Tho City by determining the factors with the most significant effect on the willingness of citizens to use public transport in the TOD environment. The structure of the hypotheses and the framework of the questionnaire are built based on an intensive literature review and interviews with experts. This research analyses the citizens’ engagement in public transport systems concerning the citizens’ perception of the capacity of local government and the usefulness of TOD and public transport. Therefore, considering the effects on the intention of citizens to use public transport, three hypotheses were given. These included the perceived local government capacity, perceived TOD’s usefulness, and perceived public transport’s significant usefulness. The findings of this study can help local governments, city planners, and practitioners better understand the conditions existing in the city and assist them in making decisions for applying TOD in developing countries.
Based on the Guidelines to develop the Structural Equation Model [12], the research steps were built to achieve research objectives, as shown in Figure 1.

2. Literature Review

2.1. Transit-Oriented Development (TOD)

Urban and transportation planning aims to improve the quality of citizens’ lives. Planners must therefore seek sustainability in order to meet the expectations of quality of life for present and future generations [13]. The concept of TOD was first introduced as a mixed-use community with an average walking distance of 2000 feet (0.61 km) to transit stops and core commercial areas [14]. TOD was suggested as a compact, mixed-use community that was based around a transit station to encourage residents, employees, and shoppers to drive their cars less and to use mass transit more [15]. TOD was defined as a combination of land use and transport planning that makes walking, cycling, and public transit use more convenient and attractive, while also optimizing the capacity of existing transit services by concentrating on transit hubs, and nodes [16]. Additionally, TOD could be a mechanism to encourage smart growth and leverage economic development [17]. It was shown that an apartment which was near a station and had a good pedestrian environment had a significantly higher value than a similar one that was not close to a station [18]. TOD is not only providing mobility choices, adaptable housing, and a promise of increasing income but also promoting a healthy lifestyle [19,20]. Also, TOD helps conserve open space as well as reduce dependence on non-renewable energy sources [21]. Significant reductions are possible through the use of life-cycle energy, greenhouse gas emissions, and respiratory and smog impacts from smart growth strategies [22]. A good TOD will achieve five main objectives: location efficiency; a variety of choices; value recovery; place creation; and node-to-place conflict resolution [23]. Generally, TOD is aimed at integrating land use and access to public transit, to encourage the best use of transit, creating compact development, encouraging a modal shift from private vehicles to transit, fostering smart growth, and so on.

2.2. Factors Influencing the Citizens’ Perceptions of TOD
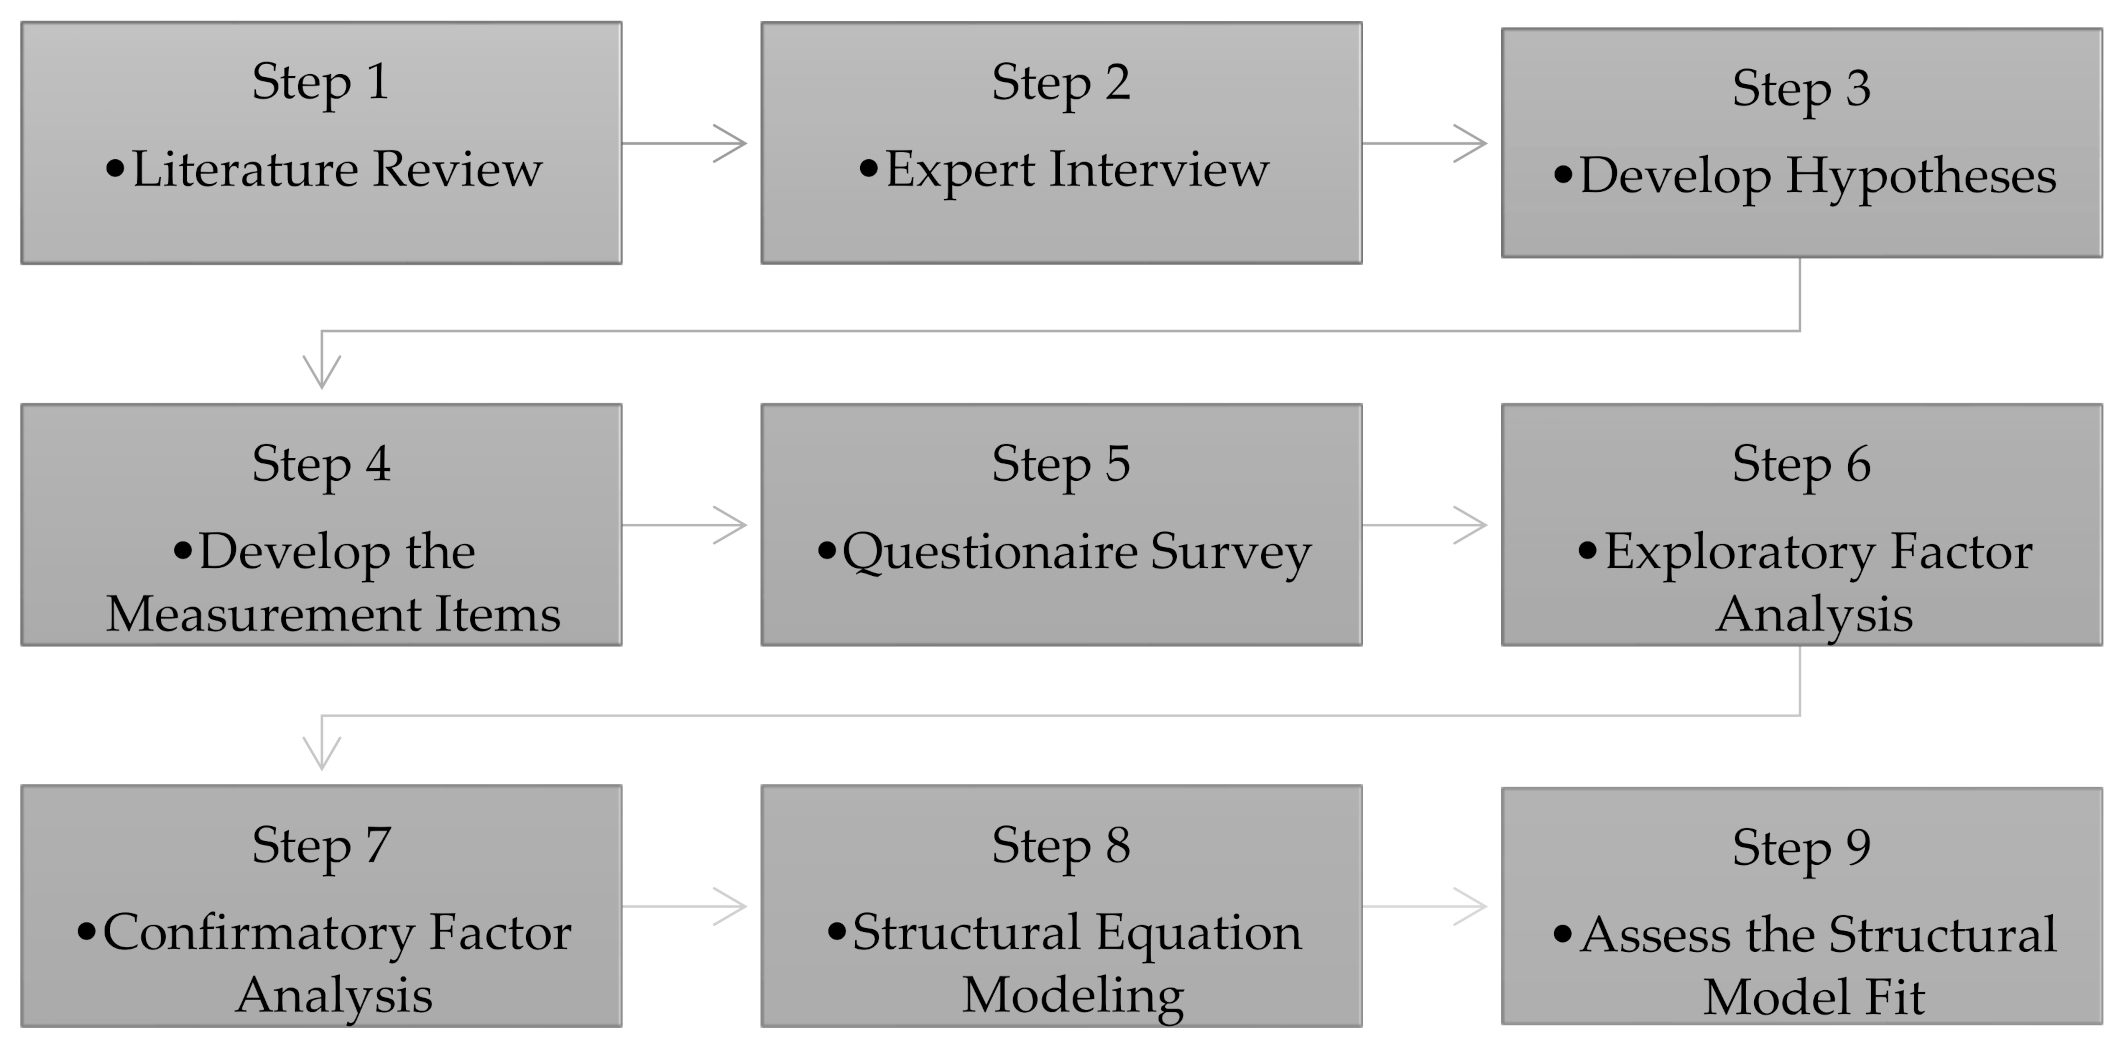
It was found that the citizens’ perceptions of TOD benefits have a significant effect on their willingness to walk to the transit station [24]. A greater number of commuters would be attracted to a transit area with a compact and diverse use of land with access to a completed pedestrian path [25]. Regional market structure also has a significant influence on travel behaviour [26]. Further, the implementation of interchange stations and the distance to midtown would have an effect in daily railway use of citizens [27]. There is a strong connection between the citizens’ perceiving usefulness of public transit and intention to use smart and sustainable transport systems. Focusing on user satisfaction at the mass transit station, the security and safety were the most important features in users’ determination to choose public transit [28]. It was reported that perceived quality, perceived convenience, perceived value contribute to higher willingness to use public bicycles [29]. The combination of the good quality of TOD and the good quality of transit plays a positive role in increasing the mode share of transit [30]. The higher the perception of the system’s benefits, the greater the willingness of users to engage with the system. Besides, to convince citizens to use public transportation instead of private vehicles, the system has to be plentiful, reliable, comfortable, safe, and affordable [31,32]. The quality of service affects the demand for public transport use [33].

3. Methodology

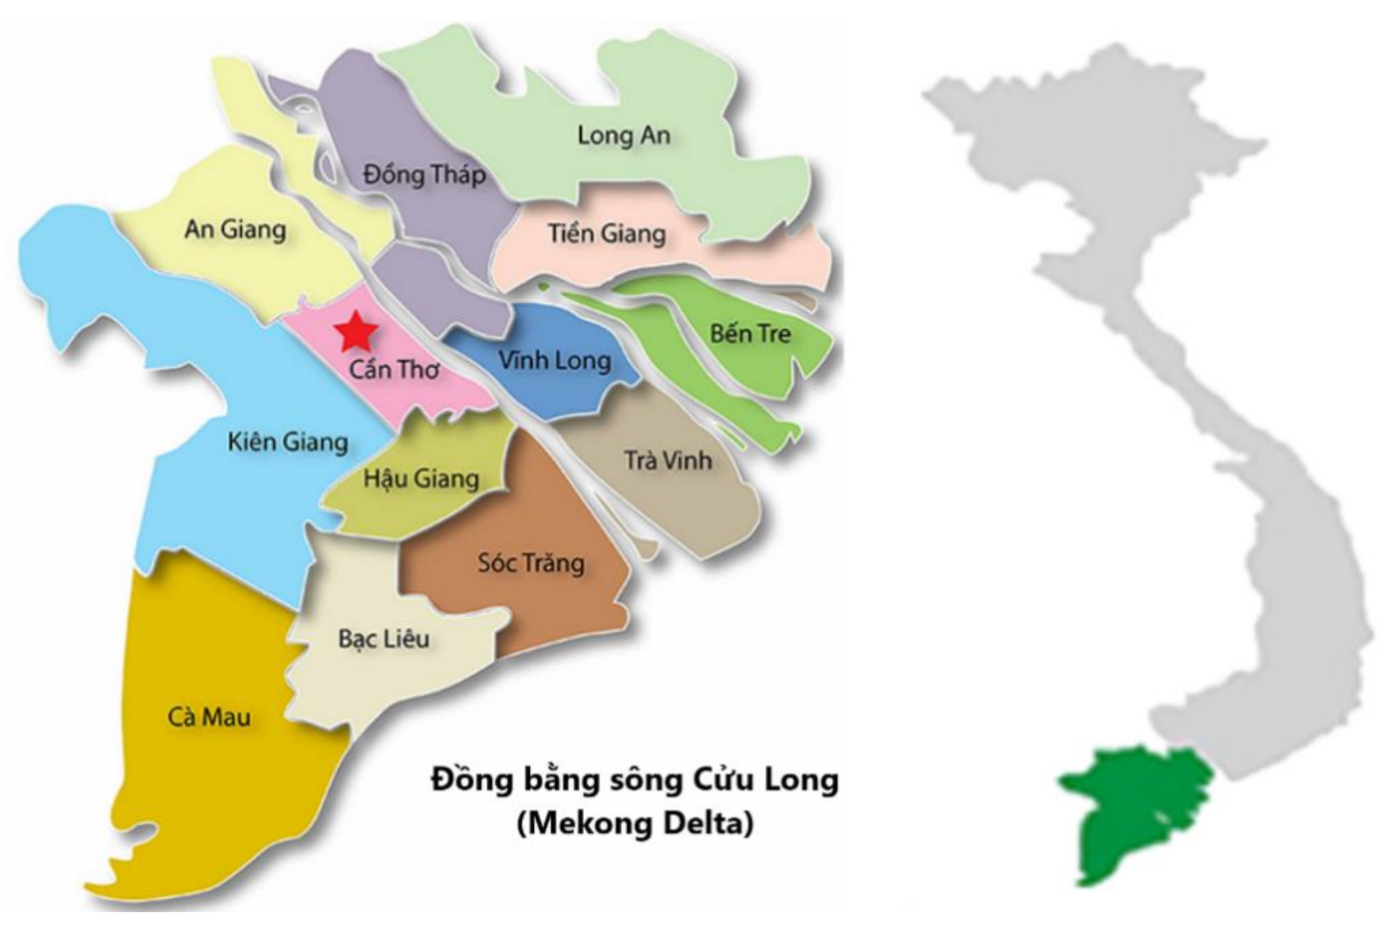
3.1. Can Tho City Context

Can Tho City is one of the five biggest cities in Vietnam, with a population of 1,236,000 and a population growth rate of 0.67 [34]. It is a typical city in the Southeast Asian area meaning that more than 80% of the vehicles on the street are private motorbikes. This in turn leads to traffic congestion, degradation of infrastructure, environmental pollution, and many other negative impacts. Without a model or plan to decrease the number of private vehicles, sustainable development is not feasible. In addition, the population of Can Tho is expected to reach 1.57 million by 2039 [35]. In order to respond to this growth, the City is pursuing more options for sustainable development, including transit-oriented development. In 2015, the City’s People Committee approved “The adjustment of transportation planning of Can Tho City towards 2030” [36]. The planning defined that mass rapid transit will become the “backbone” of the City. With the advantage of its location in the heart of the Mekong Delta (Figure 2), Can Tho is an ideal city to promote TOD. In addition, the approval of the scheme “Building mechanisms and policies to encourage and develop public transportation in Can Tho city in the period of 2016–2020 and orientation after 2020” shows the determination of Can Tho to pursue TOD development [37]. However, how to make residents adopt and accept the new transportation system in the context of riding scooters as a habit is a challenge for the City. Therefore, exploring the factors that affect the willingness of citizens to engage in public transport in the TOD environment is crucial.

3.2. Expert Interviews

The in-depth interviews were conducted in Vietnam. An expert is defined as a person who has a professional license, titled role, formal organizational position, or work experience in this field [38]. Altogether 12 experts and scholars were invited to the interview. Based on predefined interview information, the interviews were semi-structured and took an average of 30 min. The purpose of this discussion was to explore the list of factors from the literature review and the specific factors in the context of a developing country. The focus was on the factors influencing the willingness of citizens to engage in public transport in TOD situation. The interviewers concentrated on the use of public transit and private vehicles, as the two major transport options available in this metropolitan area. The attitudes towards TOD were discussed, as well as how people might be attracted to use public transportation. Regarding the evaluation of TOD’s utility and citizens’ overall perception of public transport services, all experts agreed with the list of measurement items. Additionally, they suggested that the perceived capacity of local government may also affect citizens’ intention to adopt a new system (See S1 in Supplementary Materials for the full expert interview instrument). The trust in the capacity of local government through policies and prioritizing actions to execute TOD may enhance the possibility to engage a new transportation system of residents. Table 1 shows the aspects and measurement items that may influence the citizens’ perception of engaging public transport in the TOD environment.
After a literature review and expert interview, the 3 hypotheses were developed as follows:
Hypothesis 1 (H1).
The citizens’ perception of the local government’s capacity may have a significant effect on the engagement of citizens in public transport.
Hypothesis 2 (H2).
The citizens’ perception of the usefulness of TOD may influence the engagement of citizens in public transport.
Hypothesis 3 (H3).
The citizens’ perception of the usefulness of public transport may affect the engagement of citizens in public transport.

3.3. Questionnaire Surveys

Random sampling method was used in which all members of the population have an equal chance of being chosen for the survey [39]. The items on the questionnaire were rated on a five-point Likert scale with 1 indicating “strongly disagree” and 5 being “strongly agree”. Both hard copy and online surveys were used for questionnaire data collection. The questionnaires were distributed to participants living in different geographical locations in the urban area of Can Tho City with a mix of ages ranging from 20 to 70 and a similar number of male and female participants (See S2 in Supplementary Materials for the full questionnaire survey instrument).
There were 1000 questionnaires collected in two months. After deleting 251 invalid questionnaires, 749 valid copies remained for analysis. The effective sample recovery rate was 74.9%. A sample size of more than 200, or more than the number of items multiplied by five, is necessary for the survey to meet the minimum criteria for sample size [40]. Approximately 57 percent of 749 respondents were male. The majority of the respondents (49%) were between 20 and 25 years of age. More than 40 percent of respondents held a bachelor’s degree. And the majority of the respondents (53%) were white-collar laborers. Table 2 shows the characteristics of the respondents.
The reliability of the study was first measured by taking the Cronbach’s α coefficient using the SPSS statistical software as a measure of reliability. To explore the consistency of each factor, the Cronbach’s α coefficient was used to calculate the reliability of the questionnaire with a higher Cronbach’s α coefficient showing better reliability. Cronbach’s α coefficient must be greater than 0.7 to be considered highly reliable. In the first analysis, question A1 was deleted due to not satisfying the condition. There was thus a total of 30 items in the questionnaire, and the reliability of the variables was between 0.841 and 0.892. Therefore, as shown in Table 3, the questionnaire in this study is considered highly reliable as a whole.
The validity of the questionnaire was tested based on the criteria of Kaiser-Meyer-Olkin (KMO) and Bartlett’s Test. That is, the number of KMO samples for each factor is between 0 and 1. The closer it is to 1, the higher the correlation between the variables. Bartlett’s spherical test significance (Sig) should be less than 0.05, which means the data are suitable for factor analysis. The KMO result was 0.905, which indicates the suitability of the data. The results are shown in Table 4.

3.4. Exploratory Factor Analysis (EFA)

To identify the factor structure of the perception of the capacity of local government as well as the usefulness of TOD and public transport, EFA was used. There were 8 factors identified after doing EFA. Table 5 shows the factors after rotating the axis.

3.5. Confirmatory Factor Analysis (CFA)

CFA was used to confirm the measurement theory. The number of factors involved in the data, and which measured variable is related to which latent variable, can be defined in CFA. The name of factors defined by CFA is shown in Table 6.

4. Results and Discussion

4.1. The Discriminant Validity

The discriminant validity of each variable was tested by taking into consideration the composite reliability and the average variance extracted.
Composite Reliability (CR): A higher CR for a latent variable allows easier detection. As noted above its value must be greater than 0.7 [41]. The confirmatory factor analysis results are shown in Table 5; Table 6. The reliability of the first-order variable combinations all reached the threshold of 0.7, which shows the good internal consistency of the factors.
Average Variance Extracted: The measurement model was based on convergent validity and discriminant validity in the assay mode. The average variance extracted (AVE) can not only be used to judge the reliability but also represents the validity of the convergence. The suggested standard value is 0.5 [42]. The average variation of the first-order variables in this study also exceeded the threshold of 0.5, and the loading of the first-order variables were all above 0.7, both of which showed good convergence (Table 7).
For discriminant validity, as shown in Table 8 and Table 9, the square root of the average variation of the first-order and the second-order variance is greater than the correlation coefficient of the variable with other variables, which shows that the discriminant validity is good.

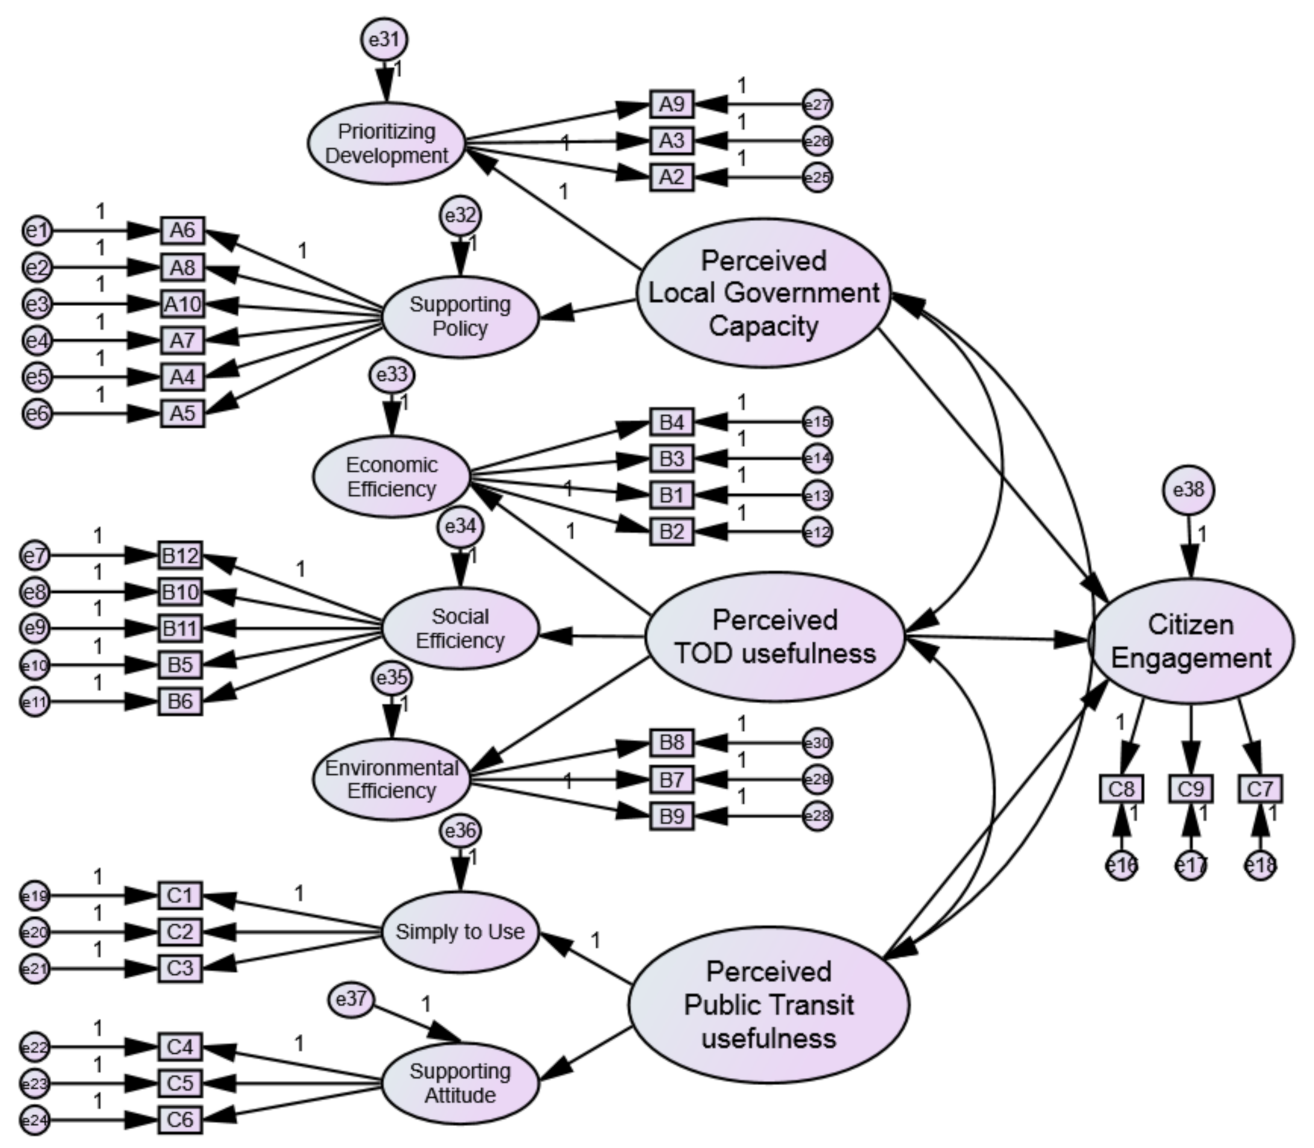
4.2. Structural Equation Modeling (SEM)

Structural equation modeling (SEM) was used as a tool to verify the hypotheses set in the research framework. After grouping of the measurement items, a hypothesized model was built to test the relationship between factors and the engagement of citizens. A structural model is shown in Figure 3.
The t-test values and path coefficient results were used to verify whether the three aspects of “Perceived Capacity of local government”, “Perceived TOD usefulness” and “Perceived public transport usefulness” have effects on the citizens engagement in TOD planning (Table 10). T-value > 1.96 and p < 0.05 are defined as satisfying conditions [43].
For Hypothesis 1, The t-test result for perceived Local Government capacity is 3.773, which is greater than the standard of 1.96, and the path coefficient is significant (p < 0.05), indicating that the perceived local government capacity has a significant impact on the citizens’ willingness to use the public transportation system. Therefore, H1 is established, the capacity of local government has a significant effect on the engagement of citizens to TOD. The secondary factors have the following order: Prioritizing sustainable development, Supporting policy.
For Hypothesis 2, The t-test result for the perceived TOD factor is 3.153, which is greater than the standard of 1.96, indicating a significant and positive correlation between the citizens’ perception of the usefulness of TOD and the citizens’ willingness. Therefore, H2 is established. The p-value is 0.002 significant (p < 0.05), which means that the citizens’ perception of TOD usefulness is an important factor in the engagement of citizens to TOD which is shown by Economic Efficiency, Social Efficiency, and Environmental Efficiency.
For Hypothesis 3, The t-test result for perceived public transport is 4.843, which is greater than the standard of 1.96, indicating that the perception of public transport usefulness positively affects the citizens’ willingness to use the system. This means that H3 is established. The p-value (p < 0.05) shows that the perception of the usefulness of public transport has a significant impact on the engagement of citizens to TOD. Therefore, the perception of public transport usefulness is an important influencing factor.

4.3. Model Fit

A good model fit is measured by the set of fit statistics including the root mean square error of approximation (RMSEA), the goodness of fit index (GFI), the Tucker-Lews index (TLI), and the confirmatory fit index (CFI) [44]. A good fit for RMSEA should have a value below 0.5. Generally, GFI, TLI, and CFI values in the 0.90s are accepted as the standard for the appropriate fit. The results are shown in Table 11.

4.4. Discussions

The results of this study highlight the relationship between the engagement of citizens with public transport in the TOD environment and the perception of citizens about the capacity of local government as well as the usefulness of TOD and public transit. It is determined that the citizens’ perceptions of the capacity of local authorities and the usefulness of TOD and public transit have an important effect on the citizens’ intention to use public transport. According to the results of the study, there are 8 factors influencing the engagement of citizens with the public transportation system. When citizens appreciate the priority of policy making by the local government, and can see the advantages of public transit in terms of economic development, social development, and environmental protection, they are willing to use the system. In previous studies, the capacity of local government and policies were identified as one of the most important factors for TOD success in developed countries [45,46,47]. However, this study found that the concern of citizens about the capacity of local government is also significant. It fills a gap in the research regarding citizens’ perceptions and engagement by contributing evidence from Vietnam. Also, this study has significant and readily transferable implications for urban and transportation planning policies by identifying which factors should be focused on in a given city-region. It may create a reference for the possibility of TOD in a developing country to achieve the sustainable mobility target. Local Government may need to prioritize development policies and system/service improvement to enhance the engagement of residents. Policymakers could try to strengthen citizens’ perception of the usefulness of TOD and public transit to achieve a higher possibility of success in TOD implementation.

5. Conclusions

This study focuses on the factors which determine the willingness of citizens to use public transport in TOD planning in a developing country. The study results show that all three hypotheses are valid. This shows that the citizens’ perceptions of the local government’s competency as well as the perceptions of the TOD and public transport’s usefulness play an important role in citizen engagement with public transport. Sustainable transportation development is an essential trend in every city all over the world. However, transit-oriented development is a complex, long-term process. It requires the engagement of many sectors and the determination of both city authorities and citizens. The capacity of local government and citizen participation are key concepts in many development frameworks. Citizens can become active users and engage with the smart system, to the extent that they can influence whether the efforts succeed or fail in both the adoption and use of services. In other words, the success of TOD planning may be achieved if the citizens have a high perception of the usefulness of TOD and public transportation. The findings of the research may provide local government, urban administrators, city planners, and practitioners the measurement indicators for TOD decision-making. The study results can be used as a reference for other cities for the application of TOD in developing countries. This study suffers from a few limitations. First, the students who were invited to participate included both full-time and part-time students (studying for Bachelor’s and Master’s degrees) and they were asked to invite their families, colleagues, friends, and relatives to do the survey. Judging from the demographic profiles, most respondents were aged between 20 and 25 years old and had a Bachelor’s and/or Master’s degree. This group of respondents might be more interested in sustainable development than others. Thus, the sampling technique could affect the representativeness of our sample. Second, the study was conducted in Can Tho City, Vietnam, which may have differences in the political, social, and cultural contexts from other cities. Therefore, the importance ratings of sustainable development and smart transportation features should be noted if generalizing to other cities or regions.
Naturally, smart systems will continue to develop rapidly within the area of technological utility. The incorporation of user feedback into the process of development may be useful in improving and optimizing the utility of the system. The follow-up research could therefore include a before and after study on the system’s actual benefits and impacts and the expectations of the users.

Supplementary Materials

The following are available online at https://0-www-mdpi-com.brum.beds.ac.uk/2071-1050/13/3/1370/s1, S1: Interview questions for TOD, Can Tho, S2: Questionnaire.

Author Contributions

Conceptualization J.-H.C.; Methodology, J.-H.C. and H.T.T.N.; Validation, H.T.T.N.; Resources, H.T.T.N.; Writing—original draft preparation, H.T.T.N., C.-C.C., J.-P.W. and T.-K.W.; writing—review and editing, J.-H.C., H.T.T.N., C.-C.C., J.-P.W. and T.-K.W. All authors have read and agreed to the published version of the manuscript.

Funding

This paper was partly supported by the Ministry of Science and Technology (MOST), Taiwan, for promoting academic excellent of universities under grant numbers of [MOST 109-2622-E-008-018-CC2]; [MOST 108-2221-E-008-002-MY3].

Institutional Review Board Statement

Not applicable.

Informed Consent Statement

Not applicable.

Data Availability Statement

The data presented in this study are available on request from the corresponding author. The data are not publicly available due to the sponsored investigation.

Conflicts of Interest

The authors declare no conflict of interest.

References

  1. Renne, J.L. Transit-Oriented Development: Developing a Strategy to Measure Success; Transportation Research Board: Washington, DC, USA, 2005. [Google Scholar]
  2. Knowles, R.D. Transit oriented development in Copenhagen, Denmark: From the finger plan to Orestad. J. Transp. Geogr. 2012, 22, 251–261. [Google Scholar] [CrossRef]
  3. Acampa, G.; Contino, F.; Grasso, M.; Ticali, D. Evaluation of Infrastructure: Application of TOD to Catania Underground Metro Station. AIP Conf. Proc. 2019, 2186, 160010. [Google Scholar]
  4. Newman, P. Planning for Transit-Oriented Development: Strategic Principles. In Transit-Oriented Development–Making it Happen; Curtis, C., Renne, J.L., Bertolini, L., Eds.; Ashgate: Farnham, UK, 2009; Chapter 2. [Google Scholar]
  5. Curtis, C. Delivering the ‘D’ in transit-oriented development: Examining the town planning challenge. J. Transp. Land Use 2012, 5, 83–99. [Google Scholar] [CrossRef] [Green Version]
  6. World Bank. Vietnam 2035: Toward Prosperity, Creativity, Equity, and Democracy; World Bank Group: Washington, DC, USA, 2016. [Google Scholar]
  7. Staricco, L.; Brovarone, E.V. Promoting TOD through regional planning. A comparative analysis of two European approaches. J. Transp. Geogr. 2018, 66, 45–52. [Google Scholar] [CrossRef]
  8. Torrisi, V.; Garau, C.; Ignaccolo, M.; Inturri, G. Sustainable Urban Mobility Plans: Key Concepts and a Critical Revision on SUMPs Guidelines. In Proceedings of the International Conference on Computational Science and Its Applications ICCSA 2020, Cagliari, Italy, 1–4 July 2020; Springer: Cham, Switzerland, 2020; pp. 613–628. [Google Scholar]
  9. Campisi, T.; Akgün, N.; Ticali, D.; Tesoriere, G. Exploring public opinion on personal mobility vehicle use: A case study in Palermo, Italy. Sustainability 2020, 12, 5460. [Google Scholar] [CrossRef]
  10. Tesoriere, G.; Campisi, T. The Benefit of Engage the “Crowd” Encouraging a Bottom-Up Approach for Shared Mobility Rating. In Proceedings of the International Conference on Computational Science and Its Applications ICCSA 2020, Cagliari, Italy, 1–4 July 2020; Springer: Cham, Switzerland, 2020; pp. 836–850. [Google Scholar]
  11. Nikolaidou, A.; Papaioannou, P. Utilizing social media in transport planning and public transit quality: Survey of literature. J. Transp. Eng. Part A Syst. 2018, 144, 04018007. [Google Scholar] [CrossRef]
  12. Hair, J.F.; Black, W.C.; Babin, B.J.; Anderson, R.E. Multivariate Data Analysis: Pearson New International Edition; Pearson: London, UK, 2014. [Google Scholar]
  13. Rossetti, S.; Tiboni, M. How do citizens perceive road safety and mobility? The role of opinion surveys and examples from the ROSEE project. WIT Trans. Ecol. Environ. 2014, 191, 571–582. [Google Scholar]
  14. Calthorpe, P. The Next American Metropolis: Ecology, Community, and the American Dream; Princeton Architectural Press: New York, NY, USA, 1993. [Google Scholar]
  15. Bernick, M.; Cervero, R. Transit Villages in the 21st Century; McGraw Hill: New York, NY, USA, 1997. [Google Scholar]
  16. TransLink. Transit-Oriented Communities Guidelines. Creating More Livable Places Around Transit in Metro Vancouver; TransLink: Vancouver, BC, Canada, 2012. [Google Scholar]
  17. Cervero, R. Transit-Oriented Development in the United States: Experiences, Challenges, and Prospects; Transportation Research Board: Washington, DC, USA, 2004; Volume 102. [Google Scholar]
  18. Duncan, M. The impact of transit-oriented development on housing prices in San Diego, CA. Urban Stud. 2011, 48, 101–127. [Google Scholar] [CrossRef] [PubMed]
  19. Hess, D.B.; Lombardi, P.A. Policy support for and barriers to transit-oriented development in the inner city: Literature review. Transp. Res. Rec. 2004, 1887, 26–33. [Google Scholar] [CrossRef] [Green Version]
  20. Nasri, A.; Zhang, L. The analysis of transit-oriented development (TOD) in Washington, D.C. and Baltimore metropolitan areas. Transp. Policy 2014, 32, 172–179. [Google Scholar] [CrossRef]
  21. Jacobson, J.; Forsyth, A. Seven American TODs: Good practices for urban design in transit-oriented development projects. J. Transp. Land Use 2008, 1, 51–88. [Google Scholar] [CrossRef] [Green Version]
  22. Kimball, M.; Chester, M.; Gino, C.; Reyna, J. Assessing the potential for reducing life-cycle environmental impacts through transit-oriented development infill along existing light rail in Phoenix. J. Plan. Educ. Res. 2013, 33, 395–410. [Google Scholar] [CrossRef]
  23. Dittmar, H.; Poticha, S. Defining transit-oriented development: The new regional building block. In The New Transit Town: Best Practices in Transit-Oriented Development; Island Press: Washington, DC, USA, 2004; pp. 19–40. [Google Scholar]
  24. Pongprasert, P.; Kubota, H. TOD residents’ attitudes toward walking to transit station: A case study of transit-oriented developments (TODs) in Bangkok, Thailand. J. Mod. Transp. 2019, 27, 39–51. [Google Scholar] [CrossRef] [Green Version]
  25. Taki, H.M.; Maatouk, M.M.H.; Qurnfulah, E.M.; Aljoufie, M.O. Planning TOD with land use and transport integration: A review. J. Geosci. Eng. Environ. Technol. 2017, 2, 84–94. [Google Scholar] [CrossRef] [Green Version]
  26. Niles, J.; Nelson, D. Measuring the Success of Transit-Oriented Development: Retail Market Dynamics and Other Key Determinants. In Proceedings of the 1999 APA National Planning Conference, Seattle, WA, USA, 24–28 April 1999; p. 2003. [Google Scholar]
  27. Loo, B.P.; Chen, C.; Chan, E.T. Rail-based transit-oriented development: Lessons from New York City and Hong Kong. Landsc. Urban Plan. 2010, 97, 202–212. [Google Scholar] [CrossRef]
  28. Iseki, H.; Taylor, B.D. Style versus service? An analysis of user perceptions of transit stops and stations. J. Public Transp. 2010, 13, 2. [Google Scholar] [CrossRef]
  29. Hazen, B.T.; Overstreet, R.E.; Wang, Y. Predicting public bicycle adoption using the technology acceptance model. Sustainability 2015, 7, 14558–14573. [Google Scholar] [CrossRef] [Green Version]
  30. Hendricks, S.J.; Winters, P.; Wambalaba, F.; Barbeau, S.; Catala, M.; Thomas, K.; Goodwill, J. Impacts of Transit Oriented Development on Public Transportation Ridership; National Center for Transit Research, University of South Florida: Tampa, FL, USA, 2005. [Google Scholar]
  31. Shiftan, Y.; Outwater, M.L.; Zhou, Y. Transit market research using structural equation modeling and attitudinal market segmentation. Transp. Policy 2008, 15, 186–195. [Google Scholar] [CrossRef]
  32. Abdallah, T. Sustainable Mass Transit: Challenges and Opportunities in Urban Public Transportation; Elsevier: Amsterdam, The Netherlands, 2017. [Google Scholar]
  33. Paulley, N.; Balcombe, R.; Mackett, R.; Titheridge, H.; Preston, J.; Wardman, M.; Shires, J.; White, P. The demand for public transport: The effects of fares, quality of service, income and car ownership. Transp. Policy 2006, 13, 295–306. [Google Scholar] [CrossRef] [Green Version]
  34. General Statisics Office. Statistical Yearbook of Vietnam 2019; Statistical Publishing House: Hanoi, Vietnam, 2020; p. 1034. [Google Scholar]
  35. General Statisics Office. Population Projections for Vietnam 2009–2049; Ministry of Planning and Investment: Hanoi, Vietnam, 2011.
  36. Can Tho City People’s Committee. Decision No. 3522/QD-UBND of 24 November 2015 Approving “The Adjustment of Transportation Planning of Can Tho City Towards 2030”. 2015. [Google Scholar]
  37. Can Tho City People’s Committee. Decision No. 1254/QD-UBND of 16 May 2018 Approving the Scheme “Building Mechanisms and Policies to Encourage and Develop Public Transportation in Can Tho City in the Period of 2016–2020 and Orientation After 2020”. 2018. [Google Scholar]
  38. Poleacovschi, C.; Javernick-Will, A. Who are the experts? Assessing expertise in construction and engineering organizations. J. Constr. Eng. Manag. 2017, 143, 04017033. [Google Scholar] [CrossRef]
  39. Cochran, W.G. Sampling Techniques; John Wiley & Sons: Hoboken, NJ, USA, 2007. [Google Scholar]
  40. Chen, J.-H.; Hsu, S. Quantifying impact factors of corporate financing: Engineering consulting firms. J. Manag. Eng. 2008, 24, 96–104. [Google Scholar] [CrossRef]
  41. Hair, J.F.; Babin, B.J.; Krey, N. Covariance-Based Structural Equation Modeling in theJournal of Advertising: Review and Recommendations. J. Advert. 2017, 46, 163–177. [Google Scholar] [CrossRef] [Green Version]
  42. Fornell, C.; Larcker, D.F. Evaluating structural equation models with unobservable variables and measurement error. J. Mark. Res. 1981, 18, 39–50. [Google Scholar] [CrossRef]
  43. Kline, R.B. Principles and Practice of Structural Equation Modeling; Guilford Press: New York, NY, USA, 2015. [Google Scholar]
  44. Lei, P.W.; Wu, Q. Introduction to structural equation modeling: Issues and practical considerations. Educ. Meas. Issues Pract. 2007, 26, 33–43. [Google Scholar] [CrossRef]
  45. Plant, J. Handbook of Transportation Policy and Administration; CRC Press: Boca Raton, FL, USA, 2007. [Google Scholar]
  46. Renne, J.L. Measuring the success of transit oriented development. In Transit Oriented Development; Routledge: Abingdon, UK, 2016; pp. 261–276. [Google Scholar]
  47. Renne, J.L. Transit Oriented Development: Making it Happen; Routledge: Abingdon, UK, 2016. [Google Scholar]
Figure 1. Research steps.
Sustainability 13 01370 g001
Figure 3. Citizen engagement structural model.
Sustainability 13 01370 g003
Table 1. Aspects and measurement items for TOD.
AspectsMeasurement ItemsItem No.
Local Government CapacitySmart growth is very important for Can ThoA1
Can Tho places priority on investing in smart mobility and infrastructureA2
The value which is attached to Can ThoA3
Can Tho incorporates sustainable energy consumptionA4
Can Tho incorporates accessible public transportA5
Can Tho has a specific TOD precinct plan A6
Can Tho coordinates land use planning to provide incentives for TOD investmentsA7
Can Tho encourages TOD by an active public-private partnershipA8
Can Tho is acting towards sustainable developmentA9
Can Tho offers policies relate to sustainable developmentA10
TOD UsefulnessTOD provides mobility choicesB1
TOD can help increase disposable income B2
TOD can help save time because it eases traffic congestionB3
TOD can contribute to more affordable housingB4
TOD can offer a safer means by public transportB5
TOD can help release the stress from not needing to find a parking slotB6
TOD can help reduce air pollution B7
TOD can help reduce oil consumption ratesB8
TOD can help conserve land resources and open spacesB9
TOD can provide a comfortable tripB10
TOD can help the users having more time to enjoy life (reading a book, listening to music, chatting...) while traveling by public transport B11
TOD can help the users having a healthier life by walking as an exercise from the stations to the destinationsB12
Public TransportPublic transport is an easy-to-use system C1
The process to use public transport is simpleC2
The payment method is simpleC3
Using public transport is a status symbol for modern citizens.C4
It is a wise choice to use public transport C5
Public transport is suitable for everyoneC6
I will continue to use public transport in the futureC7
I will encourage friends and relatives to use public transportC8
Public transport is the top-of-mind service when I need to travelC9
Table 2. Characteristics of respondents.
CharacteristicCategoryQuantityPercentage
GenderMale42857%
Female32143%
Age20–2536949%
26–3517323%
36–4512016%
46–55567%
>55314%
EducationHigh school and under 31642%
Bachelor’s 30040%
Master’s and above13318%
OccupationWhite-collar39953%
Blue-collar18224%
Freelance10113%
Retired/Others679%
Table 3. Reliability through Cronbach’s α testing.
AspectsVariablesCronbach’s α
Local Government capacity A2, A3, A4, A5, A6, A7, A8, A9, A100.892
TOD usefulnessB1, B2, B3, B4, B5, B6, B7, B8, B9, B10, B11, B120.873
Public transportC1, C2, C3, C4, C5, C6, C7, C8, C90.841
Table 4. Kaiser-Meyer-Olkin (KMO) and Bartlett’s Test.
Kaiser-Meyer-Olkin of Sampling Adequacy0.905
Bartlett’s TestApprox. Chi-Square10,518.057
df435
Sig.0.000
Table 5. Factors after rotating the axis.
Factor
12345678
A60.777
A80.769
A100.748
A70.734
A40.729
A50.719
B12 0.811
B10 0.763
B11 0.760
B5 0.755
B6 0.569
B2 0.750
B1 0.741
B3 0.695
B4 0.608
C8 0.813
C9 0.798
C7 0.772
C1 0.888
C2 0.790
C3 0.668
C4 0.810
C5 0.716
C6 0.627
A2 0.775
A3 0.772
A9 0.760
B9 0.791
B7 0.693
B8 0.688
Table 6. Factors affect the engagement of citizens.
FactorsMeasurement Items
Prioritizing sustainable developmentA2, A3, A9
Supporting policyA4, A5, A6, A7, A8, A10
Economic efficiencyB1, B2, B3, B4
Social efficiencyB5, B6, B10, B11, B12
Environmental efficiencyB7, B8, B9
Simple to useC1, C2, C3
Supporting attitudeC4, C5, C6
Citizen Engagement C7, C8, C9
Table 7. Reliability and validity of variables for the first-order model.
CRAVE
Supporting Attitude0.7650.521
Supporting Policy0.8840.560
Prioritizing Sustainable Development0.8410.638
Environment Efficiency0.7690.527
Economic Efficiency0.8160.526
Social Efficiency0.8610.554
Simple to Use0.8470.650
Citizen Engagement 0.8380.634
Table 8. Relevance and discrepancy between factors for the first-order model.
EnvPolSocEcoSimEngPriSup
Environment (Env)0.722
Policy (Pol)0.2240.748
Social (Soc)0.1060.6470.799
Economic (Eco)0.3500.2990.1210.726
Simple to use (Sim)0.3100.3430.2420.5560.725
Engagement (Eng)0.2460.1650.1770.4350.6240.745
Priority (Pri)0.4890.2450.2400.2730.4500.5400.806
Support (Sup)0.4090.3280.3680.3600.4930.5180.5760.796
Table 9. Relevance and discrepancy between factors for the second-order model.
Citizen EngagementLocal GovernmentTOD UsefulnessTransit Usefulness
Citizen Engagement 0.796
Local Government0.4280.805
TOD Usefulness 0.6270.3800.740
Transit Usefulness 0.6850.3580.6940.725
Table 10. Results of SEM analysis.
Path Path CoefficientT-ValueHypothesis Verification
Local Government → Citizen engagement0.0003.773H1 is supported
TOD usefulness → Citizen engagement0.0023.153H2 is supported
Transit usefulness → Citizen engagement0.0004.843H3 is supported
Local Government → Prioritizing SD
Local Government → Supporting Policy0.0008.610
TOD usefulness → Economic Efficiency
TOD usefulness → Social Efficiency0.00012.456
TOD usefulness → Environmental Efficiency0.00010.784
Transit usefulness → Simple to use
Transit usefulness → Support attitude0.0009.057
Table 11. Model fit statistics.
Value
Root mean square error of approximation (RMSEA)0.035
Goodness of fit index (GFI)0.939
Tucker-Lews index (TLI)0.962
Confirmatory fit index (CFI)0.966
Publisher’s Note: MDPI stays neutral with regard to jurisdictional claims in published maps and institutional affiliations.

