
Quantitative Assessment of Energy Supply Security: Korea Case Study


1
Division of Electrical and Biomedical Engineering, Hanyang University, Seoul 04763, Korea
2
Department of Electrical Engineering, Hanyang University, Seoul 04763, Korea
*
Author to whom correspondence should be addressed.
Sustainability 2021, 13(4), 1854; https://0-doi-org.brum.beds.ac.uk/10.3390/su13041854
Submission received: 16 December 2020
/
Revised: 28 January 2021
/
Accepted: 1 February 2021
/
Published: 8 February 2021
(This article belongs to the Collection Secure and Sustainable Energy System)
Abstract
:Ensuring energy supply security has become one of the most important purposes for many countries. To make the strategies for ensuring the energy supply security of a country, it is essential to quantitatively assess the security. This paper aims to present a methodology to evaluate the energy supply security of a country by using different indices of energy dependence and energy diversity, which have been raised as two main paradigms of energy supply security. This study also proposes two indices reflecting the correlation between a country’s energy diversity and energy import dependence to evaluate its energy supply security based on easily accessible data. The presented methodology and indices were applied to the evaluation of the primary energy supply security of Korea from 1991 to 2018. The results show that a country highly dependent on energy imports is not evaluated as secure enough in terms of energy supply even if it obtains higher energy diversity. This finding supports the importance of the correlation of energy dependence and energy diversity of a country to ensure its energy supply security. This approach could be further adapted to other countries and help them to make their energy policy and strategies.
1. Introduction
The increase in population and social growth has accelerated energy consumption, bringing concerns over energy security [1]. Most countries have set their energy policies and strategies to ensure energy security for sustainable development and growth [2,3,4]. However, because of the geographical inequality of energy resources and resource depletion, many countries have difficulty in lowering their dependence on energy imports and ensuring their energy supply security. Moreover, energy supply security is exposed by exterior risks, such as energy price fluctuations, supply disruption, and geopolitical uncertainty.
To reduce the risk of energy supply security related to energy import dependence, Månsson et al. [5] listed solutions such as improving diversity, financial portfolios, and reliable supply and transit routes. Chalvatzis and Ioannidis [6] also focused on energy dependence and diversity as two main paradigms of energy supply security and insisted that energy dependence has raised the importance of diversity in energy security paradigms. They categorized the primary energy import dependence of different countries and analyzed their primary energy diversity to provide reference benchmarks among countries. Matsumoto et al. [7] also classified the overall improvement of primary energy diversity in EU countries using a clustering method.
Moreover, countries that are highly dependent on energy imports such as Singapore, Taiwan, Japan, and Korea have also put great effort into diversifying energy resources to reduce their energy security vulnerability. These countries have perceived the importance of energy diversification and formulated policy concepts in the direction of diversifying energy resources [8,9]. Chuang and Ma [10] evaluated the diversity of primary energy in the energy supply structure of Taiwan through the most commonly used diversification indices: the Shannon-Wiener Index (SWI) and the Herfindahl-Hirschman Index (HHI). In another case study, Matsumoto conducted a socioeconomic study of the primary energy security performance of Japan considering the diversity of primary energy based on the SWI [11]. These research works provided quantifiable indices and helped to compare the given values to that of other countries.
However, as the SWI and HHI only deal with the number and proportion of energy resources, there is no information on the origin of energy resources. The results have thus led to demonstrate the diversity of already available energy resources in the county. To express the diversity and other factors related to energy resources simultaneously, a few researchers have proposed a diversity index weighted by the dependence on energy suppliers and their political stability [5,7,10,11], the diversity and reliability index [10], and the diversity and reliability variance index [10] based on the SWI and the HHI. However, these indices mostly require more specific data that are not easily accessible, nor available to the public. In addition, there has been a lack of study on the direct relationship between energy dependence and diversity.
This study thus suggests modified indices of energy diversity based on the SWI and HHI, which are weighted by import dependence-related parameters, as supplementary data to assess the energy supply security of a country. As these indices basically stem from the preliminarily obtained import dependence and primary energy diversity, the results are relatively easily obtained and compared with the reference values. The suggested indices are applied to evaluate the energy supply security of any country. In order to validate the effectiveness of the indices, this study adapted the indices to the case of Korea, a country highly dependent on energy import and making an effort to ensure their energy supply security, and compared the results with that of the conventional metrics.
The main contributions of this study are summarized as follows:
- This study suggests modified indices of energy diversity considering a weighted factor stemming from energy import dependence. Most previous studies have analyzed energy dependence and diversity separately. These studies seem to lack a fundamental factor indicating the import dependence of the target energy source. Therefore, the modified indices of energy diversity weighted by import dependence-related parameters are proposed in this study. These indices reflect the correlation between a country’s energy diversity and energy import dependence to evaluate its energy supply security.
- This study performs a comprehensive case analysis of the energy supply security in Korea and introduces the energy transition of the country based on the proposed indices as well as conventional metrics of energy dependence and diversity, using a relevant historical dataset from 1991 to 2018. The proposed approach could be adapted in other countries to evaluate their energy supply security regarding energy diversity and energy import dependence as well as help them to make their energy policy and strategies.
The remainder of this paper is organized as follows: Section 2 introduces a literature review on global, regional, and national analysis of energy security. Section 3 presents the analysis methodology of energy supply security, including indices of energy dependence and energy diversity, proposed energy diversity indices, and data for evaluating the energy supply security of Korea. Section 4 describes the results and discussion on the case study of Korea. Section 5 provides the main conclusions and suggestions.
2. Literature Review
2.1. Global Level Analysis of Energy Supply Security
The main themes of energy supply security have changed slightly as the interests of society, technology trends, and geopolitical and economic situations change. The definition of energy supply security has been represented by a number of factors such as availability [12,13], infrastructure [13], energy price [12,14,15], environment [15,16,17], efficiency [15,18,19], social effects [17], and governance [19]. These definitions have even varied depending on the target application domains and their detailed subjects. While “reliable supplies of energy at reasonable prices to support the economy and industry” has been used broadly in the literature as the definition of energy supply security [14], other researchers have extended the definition to social welfare and socio-cultural effects [15,17]. Therefore, researchers, policymakers, and stakeholders have faced difficulty in establishing a global definition of energy security and its measuring method.
A number of studies have tried to integrate these concepts of energy supply security. Winzer [20] listed the definition of energy supply security by reviewing papers published in different domains in order to map the conceptual boundaries of energy security. Kruyt et al. [19] classified energy security indicators incorporating regionalization, globalization, economic efficiency, and environmental acceptability. Based on these factors, several frameworks for defining and methodologies for evaluating energy security have been suggested at the international, regional, and national levels. The analyses at the international level have provided the position, direction, and strengths and weaknesses of energy security in different countries [9,21,22,23]. These investigations have recommended policy prescriptions based on the evaluation results of energy security and have served as a reference for energy security among countries with differing conditions.
2.2. Regional and National Level Analysis of Energy Supply Security
From a more specific and comparative perspective, many studies have been conducted at regional and national levels [13,24,25,26,27,28,29,30]. Le et al. [24] reported the different levels of energy insecurity in Asia, focusing on 12 variables such as CO2 emissions, CO2 intensity, energy imports, energy intensity, energy use, fossil fuel energy consumption, and renewable energy consumption. Erahman et al. [25] presented the energy situation of Indonesia and 14 indicators for measuring energy security in the five dimensions of availability, affordability, accessibility, acceptability, and efficiency. Glynn et al. [26] provided a method to assess energy security considering sovereignty, infrastructural robustness, and market resilience for a future Irish energy system. Geng and Ji [27] presented China’s energy supply security and its evolutionary characteristics by analyzing external availability, affordability, technologies, efficiency, and resource reserves. Narula et al. [28] introduced India’s multi-dimensional sustainable energy security using 23 metrics considering availability, affordability, efficiency, and acceptability. Zhao and Yang [13] introduced a regional energy security assessment focusing on integrated systems with renewables in China. Malik et al. [29] analyzed Pakistan’s energy security under the 4-A framework, namely availability, applicability, acceptability, and affordability over the six years. Gopal et al. [30] examined the energy security of the Indian electricity sector over a decade. They suggested 11 indicators representing economic, environmental, and social dimensions for their analysis. These researchers have attempted to determine commonly-used indicators assessing the energy supply security of each country and identified its unique characteristics for addressing the appropriate energy security of the target countries.
2.3. Energy Supply Security Analysis: Korea Case Study
Several research works on the evaluation of the energy supply security of Korea have also been conducted during the past decade. Their purpose is to understand the position and characteristics of energy supply security in Korea and to suggest energy policy prescriptions. Due to insufficient natural resources alongside economic and geopolitical uncertainty, the accessibility and availability of energy have been concerns for Korea. The top priority in energy supply security has thus been to avoid any disruption of the energy supply [9]. Jun et al. [23] presented the energy security costs for energy sources contained within the Korean electricity market. The minimum cost of ensuring energy supply security was measured as a supply disruption in the case of electricity generation and an energy portfolio with the lowest cost is suggested. Ryu et al. [31] investigated three scenarios with different levels of carbon emission, energy security, and electricity generation costs in Korea. Through these scenarios, the appropriate portions of specific energy resources for electricity generation were given for executing national energy policy strategies. Ahn et al. [32] also suggested the optimal allocation of energy resources for electricity generation by scenario-based analysis for sustainable development and lessened external risks to energy security in Korea. These studies have mostly concentrated on the energy mix for electricity as a form of final energy. Although there have been many attempts to analyze secure electricity generation in the country, there is a lack of research that investigates the primary energy supply. As energy resources have recently become more diverse than ever before with the development of energy conversion technologies and applications, this study includes various resources, including fossil fuels, nuclear, and renewable energy.
3. Methodology
To evaluate energy supply security, different analytical approaches and indicators, such as energy resource reserves [19], cost of energy security [23], energy dependence [6], energy diversity [6,7,10,11,19], and energy market concentration [33] have been presented in the literature. Amongst them, energy dependence and diversity have been regarded as the two main paradigms for evaluating energy supply security [6]. This study applied these two indicators and proposed modified indices of energy diversity to quantitatively assess the energy supply security of Korea, a country highly dependent on energy imports.
3.1. Energy Dependence
3.1.1. Energy Import Ratio
Most countries are engaged in the import and export of resources and products. The energy import ratio can be used as a simple index to estimate the energy dependence of a country. It describes the ratio between energy imports and the total imports of the country established as follows:
where D1 is the energy import ratio, AIT represents the total of all imports, and EIT is the primary energy import total obtained by the sum of each energy import total. The value of i denotes the index of the types of energy sources, N is the number of the types of energy sources, and EIi is the amount of the ith primary energy import.
3.1.2. Energy Import Dependence
Energy import dependence is one of the most used metrics for assessing energy supply security. It describes the percentage of total energy imports over the total energy supply of a country. Fossil fuels, such as oil, coal, gas, and uranium, are the energy sources that this index evaluates across different regions and countries [6,19]. It is expressed as follows:
where D2 is the energy import dependence, and EST and ESi represent the total amounts of all types of primary energy supply and the ith primary energy supply, respectively. In this term, EIT and EST use the same monetary or physical unit.
3.2. Energy Diversity Indices
As one of the types of indices interrelated with energy dependence, the energy supply diversity indices have been quantified by several analytical approaches [34]. Stirling presented research focusing on diversity in the energy sector and suggested three important elements: variety, balance, and disparity [35,36]. As the disparity of energy options is not easily quantified, indices without consideration of disparity are widely applied in the measurement of diversity [6,10,34]. Hill identified an entire family of possible quantitative assessments of diversity in terms of proportional abundances of the species in a sample [37]. As the Hill index family, the SWI and HHI are the most commonly used indices in the energy sector. These two indices are applied in this study to evaluate energy diversity, especially the balance and variety of energy options in Korea.
3.2.1. The Shannon-Wiener Index (SWI)
The SWI is expressed by accounting for the share of each primary energy source as follows:
where pi is the share of primary energy supply by the ith energy source ESi in the total primary energy supply EST. The smallest value of the SWI is zero in the case where there is only one primary energy supply option in the country. It means the sole option takes 100% of the total primary energy supply. Then, the share of this energy source pi becomes one. Consequently, ln (1) equals zero, and the SWI thus becomes zero. By contrast, the theoretical maximum value of the SWI may be obtained when the shares of primary energy sources are even, which means that pi equals 1/N and that the number of types of energy sources becomes larger. If the share of each option is uneven, the value of the SWI is less than its theoretical maximum value, SWIMax.
3.2.2. The Herfindahl-Hirschman Index (HHI)
The HHI shows the concentration of the individual share of energy options. It is expressed by the sum of the square of the proportion of each energy source as follows:
where Pi is the percentage of the primary energy supply by the ith energy source ESi in the total primary energy supply EST. As this index uses the square of the percentage of each energy source, the index highlights quantitatively bigger energy resources rather than smaller ones in whole options. This means that the HHI emphasizes abundant energy resources. Opposite to the SWI, the lower the value of the HHI, the higher the diversity. The theoretical minimum value of HHI is expressed as follows:
3.3. Energy Diversity Weighted by Energy Import Dependence
The presented diversity indices, such as the SWI and HHI, only depend on the quantity and the proportion of each energy resource, considering the proportion of each energy resource is effective when energy resources are less dependent on other countries in the energy supply security of a country. However, its effectiveness could be reduced in a country highly dependent on energy imports. This country could not be evaluated as a secure country in terms of energy supply security, even though the country obtains a higher value of the SWI and a lower value of the HHI. In other words, these indices seem to lack a fundamental factor indicating the dependence of the target energy source on imports. Therefore, this study proposed modified indices of energy diversity by weighting the import dependence-related parameters. The main concept of these indices is to imply energy import dependence into the diversity indices. Weighted factors stemming from the import dependence of each energy type are multiplied into the energy diversity indices, the SWI and HHI. The proposed indices are expressed below:
where the D_SWI and the D_HHI demonstrate the modified SWI and HHI, which imply energy import dependence. In the case of the D_SWI, (1 − EIi/ESi) is the inverse weight obtained by the share of ith energy source imports in supply. Its range is from 0 to 1 and reflects how much the ith energy type is self-sufficiently supplied to the country. The theoretical maximum value of the D_SWI may be obtained when the number of types of energy sources is higher and that the quantity of each source is even. In addition, all the considered energy sources should be self-sufficient which means (1 − EIi/ESi) equals 1. By contrast, the D_SWI becomes smaller when the share of energy imports increases (EIi/ESi > 0), even though the value of the SWI is the SWIMax. In the case of D_HHI, however, its theoretical minimum value could be obtained when the share of ith energy source imports in supply EIi/ESi is zero and the HHI reaches the HHImin simultaneously. As the weighting is a process to assign a relatively important factor in each index [38,39], these proposed indices can be effective, especially to evaluate the primary energy supply security of the countries highly dependent on energy imports such as Singapore, Taiwan, Japan, and Korea.
3.4. Data for Evaluation
In this study, time series data were obtained from a dataset from the Korea Energy Economics Institute [40]. The assessment was conducted with 10 primary energy sources, including anthracite coal, bituminous coal, petroleum for energy use, LPG, petroleum for non-energy use, LNG, general and micro-hydro, pumped hydro, nuclear, and renewables for the period from 1991 to 2018. The data were used for measuring four indices which are the import ratio of energy, energy import dependence, energy diversity represented by the SWI and HHI, and the mixed indices of energy import dependence and energy diversity.
4. Results and Discussion
4.1. Energy Dependence
Korea’s energy dependence was first evaluated by quantitatively measuring the energy import ratio and energy import dependence. Figure 1 shows the trend of Korea’s energy import ratio, as expressed in Equation (1). The units of EIT and AIT are both USD. Korea’s energy imports account for over 14% of total imports during the period between 1991 and 2018. From 1991 to 2012, the energy import ratio increased globally by 35.6% with fluctuations. From 2013 to 2016, the ratio decreased significantly by 19.9%. Then the value rebounded, respectively, to 22.9% and 27.3% in 2017, 2018. Slight increases and decreases in the import ratio appeared in the periods 1999–2000, 2004–2005, 2007–2008, 2008–2009, 2010–2011, 2014–2016, and 2016–2018.
It is worth noting that these trends match well enough to the oil price fluctuations in Korea as shown in Figure 2. As oil imports are a large share of Korea’s total energy imports, it is reasonable that the energy import ratio in monetary terms is significantly influenced by the oil price. The ratio drops with a decrease in oil prices after 2013, even though the amount of oil imports increases in this period [41]. As this situation may not be stable, Korea needs a buffer system against the surge of oil prices to ensure its energy supply security and a stable domestic economy.
Under these conditions, the oil stock levels of net imports in Korea have consistently been recorded above 180 days since September 2009. This is double the value of the IEA 90-day requirements. According to historical data, the oil stock levels of Korea hit 309 days in March 2016. Figure 3 shows the oil stock levels in days of net imports given by the International Energy Agency [42].
Compared with the average value of total IEA countries, including net exporters such as Canada, Denmark, and Norway, Korea reserved more oil than other IEA countries until 2015. This indicator shows Korea’s awareness of the importance of both the accessibility and availability of energy. However, the oil stock levels of Korea decreased by 184 days in 2018. This value is lower than that of the average value of total IEA net importers in the same period.
Figure 4 illustrates Korea’s energy import dependence. A physical term of primary energy imports rather than a monetary term was used to remove the influence of oil price on the dependence as shown in Figure 1. The value of energy import dependence has been greater than 90% since 1991. From 1991 to 1997, energy dependence increased from 91.20% to 97.79% with the economic development of the country. After the liquidity crisis in 1997, the dependence moderately decreased because of the drop in domestic consumption. After 2012, the value decreased more visibly to 94.5%.
Amongst the primary energy sources supplied to Korea, almost all fuels have been imported from foreign countries. For example, the entire quantities of bituminous coal, crude oil, and uranium are imported from outside of the country. Energy resources such as anthracite coal and LNG are partially produced in Korea, but the quantity is very small. In the case of anthracite coal, its import dependence was approximately 10% in the early 1990s. However, because of anthracite coal reserve limits, the import dependence gradually increases, reaching 89.19% in 2018. Besides, although the Korea Gas Corporation produced LNG, the amount of LNG is less than 2% of the total supply in the country. To lower energy import dependence, the proportion of energy produced in Korea should be increased. This does not only mean the use of reserved fossil fuel but also the gradual increase of renewable energy such as hydro energy, solar energy, wind energy, and bioenergy, among others. In line with this, Korea is planning a scenario 2030, aiming to achieve 20% of the total amount of electricity generation from renewables by 2030 [43,44].
4.2. Energy Diversity
The energy diversity of Korea was quantitatively evaluated by using the SWI and the HHI. The considered primary energy sources were anthracite, bituminous coal, petroleum for energy use, LPG, petroleum for non-energy use, LNG, general hydro, pumped hydro, nuclear, and renewables. There are ten primary energy sources (n = 10). Figure 5 shows the Korean Total Primary Energy Supply (TPES) and its composition during the period between 1991 and 2018 [40]. Except in the years 1998 and 2009 when the economic crises occurred, primary energy supply increases continuously, reaching 307.5 million tons of oil equivalent (Mtoe) in 2018, and energy shares are more balanced.
Figure 6and Figure 7 show the overall energy diversity of Korea represented by the SWI and HHI during the period between 1991 and 2018. From the calculation results of the SWI, the SWI gradually decreases from 1991 to 1995, as shown in Figure 6. The lowering of this value during this period is due to the more unbalanced composition of primary energy. Korean economic growth was promoted in the 1990s before the economic crisis occurred in 1997. During this period, energy consumption, especially driven by oil consumption, increases. Simultaneously, the consumption of imported bituminous coal increases, whereas the anthracite coal reserve reduces. Hence, the energy supply structure is concentrated in petroleum, and bituminous coal accounts for 74.7% in 1995. In consequence, the minimum value of the SWI is obtained as 1.629 in 1995. The lowest value means the lowest energy diversity because of the unevenness of energy shares of the year. Later, the value follows an increasing trend with small fluctuations from 1996 to 2018. In this period, there is a significant increase in the SWI in 1998. This globally increasing trend is explained first by the decrease in oil consumption due to the economic crisis in Korea. Second, there was a structural transition of energy supply from crude oil to nuclear energy, LNG, and renewables. The share of nuclear energy increases by 125%, whereas the portion of petroleum for energy use decreases by 79% in 1998. Third, the national energy policy has promoted the use of other types of primary energy rather than oil. After 2004, the SWI reaches a value higher than 81% of the theoretical maximum value of the SWI, which is about 2.302 as obtained by Equation (5). In 2016, the highest diversity is obtained as 1.877, whereas the value drops again in 2017 to 1.862. Thereafter, the value reaches 1.864 in 2018.
The evolution of the HHI is shown in Figure 7. The HHI seems to be a scaled reflection of the SWI in the x-axis. This trend is explained by the fact that these two indicators oppositely represent energy diversity. As mentioned, the higher value of the SWI and the lower value of the HHI indicate the higher diversity. As inversely following the trend of the SWI, the HHI increases by 2710 in 1995 and decreases by 1736 in 2016. The value rebounded by 1787 in 2017 and decreased again by 1781 in 2018. These similar diversity trends between the SWI and HHI are shown from 1991 to 2010 and from 2013 to 2018.
However, the diversity trends obtained by the SWI and HHI for 2010–2011 and 2011–2012 are unmatched. In 2011, the diversity shown by the SWI increases, whereas the diversity given by the HHI decreases. Similarly, the diversity obtained by the SWI drops, whereas the diversity calculated by the HHI increases in 2012. These unmatched diversity trends, of which phenomena were similarly presented by Chuang and Ma [10], were led by the relative abundance perspective. The primary energy option which takes a smaller quantity is emphasized in the SWI, and the more abundant is underlined in the HHI. In 2011, the shares of rare resources and abundant resources increase simultaneously except for petroleum for energy use, LPG, and nuclear energy. This implies higher diversity through the increase in the shares of rare resources in the SWI and the lower diversity induced by the increase in the shares of abundant resources in the HHI. On the contrary, the shares of rare resources such as anthracite, LPG, petroleum for non-energy use, and general hydro decreases, whereas that of abundant resources like bituminous coal, petroleum for energy use, and nuclear energy increases in 2012. This shows the decreased diversity led by rare resources in the SWI and increased diversity caused by abundant resources in the HHI.
With the fixed number of the types of energy sources in this study, the proportion of each energy source only affects the SWI and HHI. The share of each energy resource is an effective factor to evaluate energy security when energy resources are less dependent on other countries. However, its effectiveness could not be ensured in a country highly dependent on energy imports such as Korea. It means that these indices overlook how safely the energy resources are supplied to the country. The energy import dependence-related index should thus be considered for the more accurate evaluation of energy supply security and policy suggestions in more detail.
4.3. Energy Diversity Weighted by Energy Import Dependence
The energy diversity of Korea was quantitatively evaluated by using the proposed energy dependence-related indices, the D_SWI and D_HHI. Figure 8 describes the D_SWI. The theoretical maximum value of the D_SWI is approximately 2.302. As expected, a different trend is shown in the D_SWI compared with that of the SWI. The maximum value of the D_SWI is found in 1991 when the import dependence reaches the lowest level. Then, the D_SWI drops continuously by 0.122 until 1997 when the country strongly relies on energy imports. The global trend of the D_SWI from 1998 to 2010 tends to recover with fluctuation. Then, the value continuously increases from 2011 and finally reaches 0.181 in 2018. This increasing trend is linked to the country’s energy dependence that has decreased since 2011 as shown in Figure 4.
However, this diversity index does not improve significantly compared with the past. The latest obtained value is even lower than that of the early 1990s (1991–1993) when the import dependence of the country was lower than 95%. This result shows the important role of the use of indigenous energy resources to improve energy supply security evaluated by the given index. This result implies the need to use indigenous energy resources and the challenges to promote self-sufficient energy such as anthracite coal and LNG. In addition, R&D on energy-efficient systems and energy systems driven by renewable energy should be supported to improve the energy supply security of the country in the long term.
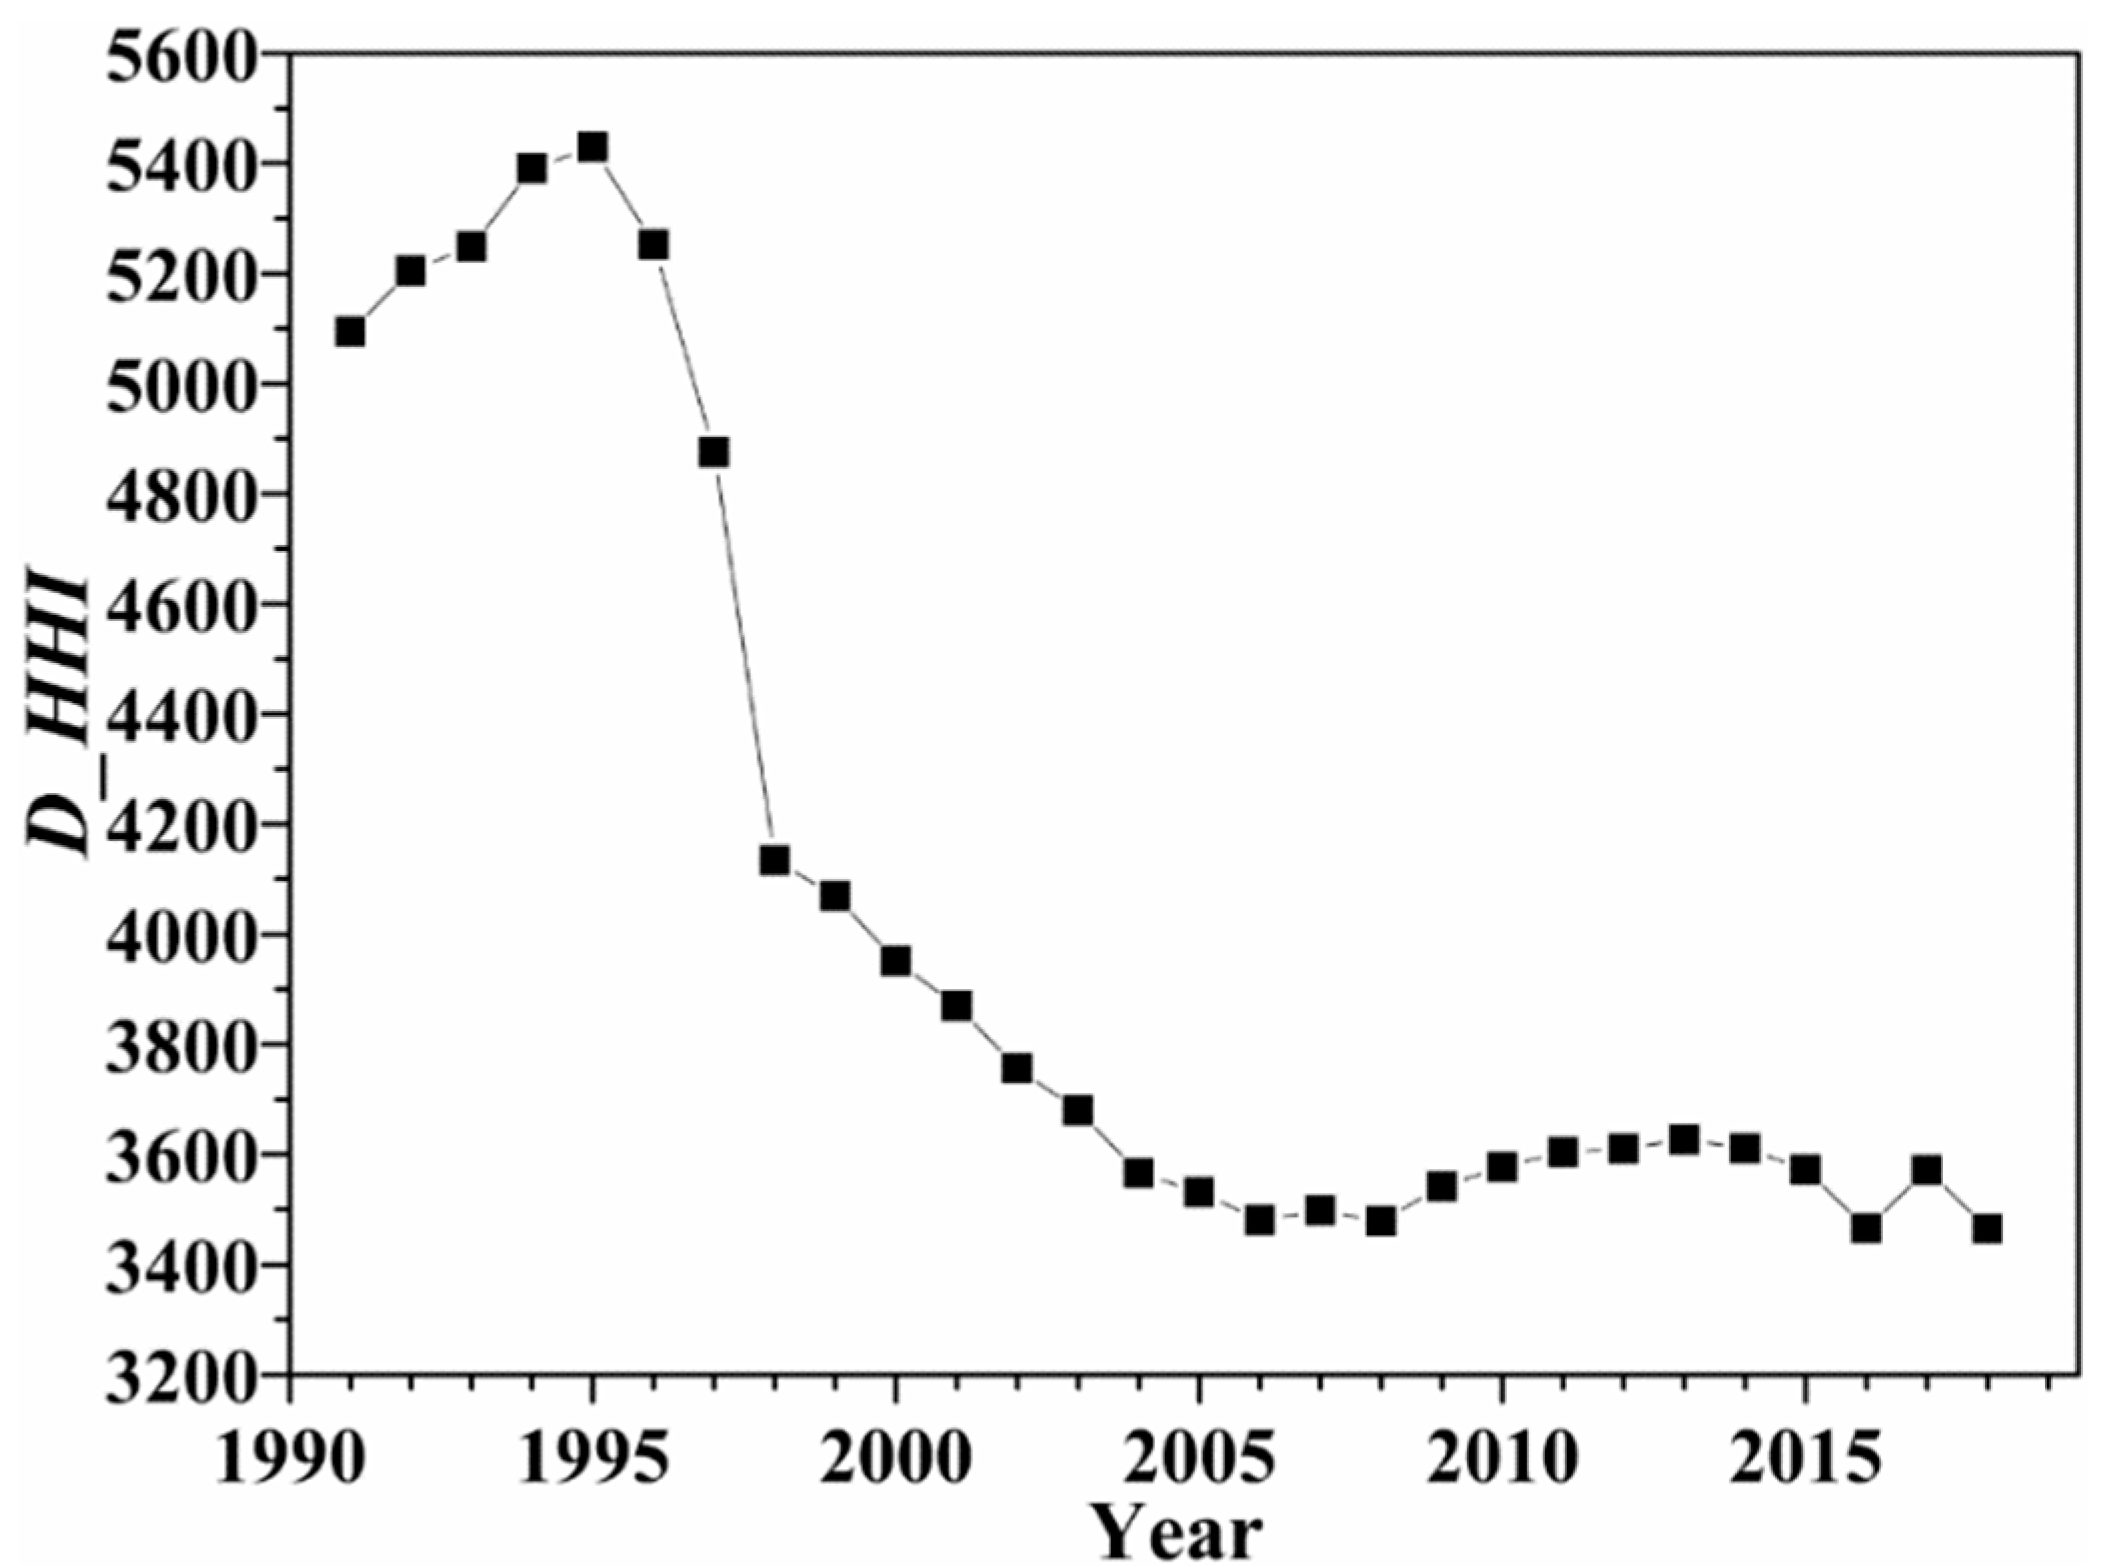
Figure 9 illustrates the D_HHI. The theoretical minimum value of the D_HHI is 1000 when the energy import dependence is the minimum, which is zero. However, because the import dependence of Korea is far from zero, rather close to one, the D_HHI is nearly doubled by the HHI. This value follows the trend of HHI. As the share of oil imports has been over 40% for the period from 1991 to 1997, the effect of oil import on the D_HHI as well as on the HHI is comparatively high, whereas its effect on the SWI and the D_SWI is reduced. This means that the D_HHI and HHI still retain the importance of abundant resources despite the high weight of energy import dependence. It indicates that avoiding any abundant energy resources could lower the D_HHI more effectively than lowering their import dependence.
In summary, the SWI and HHI showed a similar trend of energy diversity of the country as referring to other research on energy supply security [6,7,10,11,45]. In more detail, the SWI focuses on rare energy resources, while the HHI highlights the abundance of any energy resources. However, these two indices overlooked the energy import dependence of the target country. As introducing the energy import dependence as a weighting factor in the D_SWI and D_HHI, the correlation between the country’s energy diversity and energy import dependence could be accounted for in the evaluation of energy supply security. Based on the import ratio of each energy source, the SWI is scaled from 0 to 1 for the D_SWI, whereas the HHI is multiplied by the value from 1 to 2 for the D_HHI.
Moreover, the overall evaluation of the energy supply security of Korea infers that the country should attempt to balance the use of different types of primary energy resources because they cannot liberalize its energy imports. To reduce the concentration of abundant import resources such as oil and coal, and increase the use of rare resources, electrification in the energy sector and a higher proportion of renewable energy in electricity generation could be alternative solutions to improve its energy supply security regarding the scenario 2030. Green financing and investment in renewable energy projects are recommended as practical solutions to promote a higher proportion of renewable energy and sustainable technologies, including hydrogen and electric vehicles [46,47]. Besides, the energy policy focusing on demand-side management should strongly be applied to the country for effective and efficient use of limited resources [24].
5. Conclusions
This study presented a methodology to evaluate the energy supply security of a country by using different indices of energy dependence and energy diversity. The considered indicators were energy import ratio and energy import dependence as the indices of energy dependence and the SWI and HHI as those of energy diversity. This study also proposed two indices, the D_SWI and D_HHI, that reflect the correlation between a country’s energy diversity and energy import dependence.
The presented methodology and indices were applied to quantitatively assess Korea’s energy supply security. Korea’s energy imports were over 14% of total imports during the period between 1991 and 2018. The energy import dependence increased from 91.20% to 97.79% with the economic development of the country for the period from 1991 to 1997. After the liquidity crisis in 1997, the dependence gradually decreased and reached 94.49% in 2018. The energy diversity of Korea in terms of the SWI and HHI was also measured. The primary energy sources considered were anthracite, bituminous, petroleum, LPG, LNG, general hydro, pumped hydro, nuclear, and renewables. From the measurement of energy diversity, it was found that the energy transition from petroleum to nuclear and renewable energy contributed to increasing the diversity of primary energy.
From the calculation results of the SWI and HHI, similar diversity trends were obtained in the given periods from 1991 to 2010 and from 2013 to 2017. Diversity gradually decreased because of the concentration of oil consumption until 1995. Since then, diversity has globally improved with fluctuations. In addition, unmatched trends between the SWI and HHI appeared for 2010–2011 and 2011–2012 because of the emphasis of the SWI on rare resources and the HHI on abundant resources in the shares of energy.
However, a country highly dependent on energy imports cannot be evaluated as a secure country in terms of energy supply security, even if it obtains higher energy diversity. As Korea is highly dependent on energy imports because of its high energy consumption and insufficient energy resources, the analysis of the energy supply security of Korea should consider the types and the proportion of available energy resources and their import dependence. By focusing on the correlation between Korea’s energy diversity and import dependence, this study also suggested modified indices of energy diversity based on the SWI and HHI, which are weighted by import dependence-related parameters. As a result, the D_SWI showed lower values of energy diversity, even in recent years, because of higher energy import dependence. The D_HHI almost doubled compared with the value of the HHI because of the higher energy import dependence of the country and followed the trend of the HHI which emphasizes abundant resources. This result implies that the correlation of energy dependence and energy diversity of a country should also be considered as an important factor to evaluate energy supply security and to make energy policy strategies.
In focusing on the correlation between energy diversity and import dependence, the national energy policy should promote renewable energy because its use could mitigate the environmental effects and energy dependence. It might permit more diversified energy options in the transition of electricity-driven transport and industry. In practice, the automotive industry and R&D of electric vehicles and renewable hydrogen vehicles could be boosted from several perspectives. Policy-supported R&D investment and infrastructure in renewable energy and energy-efficient technologies with demand-side management should be implemented to stabilize the energy supply security of the country in the long term. Comparative study on energy dependence and diversity at the international level should be conducted to further analyze the characteristics of energy security of each country and classify them to suggest referable policies as well.
Author Contributions
All the authors have been involved in the preparation of the manuscript. All the authors have read and agreed to the published version of the manuscript.
Funding
This research was funded by Basic Science Research Program through the National Research Foundation of Korea (NRF) funded by the Ministry of Education, grant numbers 2017R1D1A3B03035693 and 2020R1I1A1A01073797. This work was also supported by the Korea Institute of Energy Technology Evaluation and Planning (KETEP) grant funded by the Korea government (MOTIE), grant number 20192010107050.
Institutional Review Board Statement
Not applicable.
Informed Consent Statement
Not applicable.
Data Availability Statement
Not applicable.
Conflicts of Interest
The authors declare no conflict of interest.
References
- Kafle, S.; Parajuli, R.; Bhattarai, S.; Euh, S.H.; Kim, D.H. A review on energy systems and GHG emissions reduction plan and policy of the Republic of Korea: Past, present, and future. Renew. Sustain. Energy Rev. 2017, 73, 1123–1130. [Google Scholar] [CrossRef]
- Proskuryakova, L. Updating energy security and environmental policy: Energy security theories revisited. J. Environ. Manag. 2018, 223, 203–214. [Google Scholar] [CrossRef] [PubMed]
- Vivoda, V. LNG import diversification and energy security in Asia. Energy Policy 2019, 129, 967–974. [Google Scholar] [CrossRef]
- Song, Y.; Zhang, M.; Sun, R. Using a new aggregated indicator to evaluate China’s energy security. Energy Policy 2019, 132, 167–174. [Google Scholar] [CrossRef]
- Månsson, A.; Johansson, B.; Nilsson, L.J. Assessing energy security: An overview of commonly used methodologies. Energy 2014, 73, 1–14. [Google Scholar] [CrossRef] [Green Version]
- Chalvatzis, K.J.; Ioannidis, A. Energy supply security in the EU: Benchmarking diversity and dependence of primary energy. Appl. Energy 2017, 207, 465–476. [Google Scholar] [CrossRef]
- Matsumoto, K.; Doumpos, M.; Andriosopoulos, K. Historical energy security performance in EU countries. Renew. Sustain. Energy Rev. 2018, 82, 1737–1748. [Google Scholar] [CrossRef]
- Li, Y.; Shi, X.; Yao, L. Evaluating energy security of resource-poor economies: A modified principle component analysis approach. Energy Econ. 2016, 58, 211–221. [Google Scholar] [CrossRef]
- Yao, L.; Shi, X.; Andrews-Speed, P. Conceptualization of energy security in resource-poor economies: The role of the nature of economy. Energy Policy 2018, 114, 394–402. [Google Scholar] [CrossRef]
- Chuang, M.C.; Ma, H.W. Energy security and improvements in the function of diversity indices—Taiwan energy supply structure case study. Renew. Sustain. Energy Rev. 2013, 24, 9–20. [Google Scholar] [CrossRef]
- Matsumoto, K.; Shiraki, H. Energy security performance in Japan under different socioeconomic and energy conditions. Renew. Sustain. Energy Rev. 2018, 90, 391–401. [Google Scholar] [CrossRef]
- Asia Pacific Energy Research Centre. Quest for Energy Security in the 21st Century: Resources and Constraints; Asia Pacific Energy Research Centre: Tokyo, Japan, 2007. [Google Scholar]
- Zhao, Z.; Yang, H. Regional Security Assessment of Integrated Energy Systems with Renewables in China: A Grid-Connected Perspective. Sustainability 2020, 12, 10299. [Google Scholar] [CrossRef]
- Yergin, D. Energy Security in the 1990s. Foreign Aff. 1988, 67, 110. [Google Scholar] [CrossRef]
- Dorian, J.P.; Franssen, H.T.; Simbeck, D.R. Global challenges in energy. Energy Policy 2006, 34, 1984–1991. [Google Scholar] [CrossRef]
- Hughes, L. A generic framework for the description and analysis of energy security in an energy system. Energy Policy 2012, 42, 221–231. [Google Scholar] [CrossRef]
- Vivoda, V. Evaluating energy security in the Asia-Pacific region: A novel methodological approach. Energy Policy 2010, 38, 5258–5263. [Google Scholar] [CrossRef] [Green Version]
- Martchamadol, J.; Kumar, S. Thailand’s energy security indicators. Renew. Sustain. Energy Rev. 2012, 16, 6103–6122. [Google Scholar] [CrossRef]
- Kruyt, B.; Van Vuuren, D.; De Vries, H.; Groenenberg, H. Indicators for energy security. Energy Policy 2009, 37, 2166–2181. [Google Scholar] [CrossRef]
- Winzer, C. Conceptualizing energy security. Energy Policy 2012, 46, 36–48. [Google Scholar] [CrossRef] [Green Version]
- Sovacool, B.K.; Mukherjee, I. Conceptualizing and measuring energy security: A synthesized approach. Energy 2011, 36, 5343–5355. [Google Scholar] [CrossRef]
- Wang, Q.; Zhou, K. A framework for evaluating global national energy security. Appl. Energy 2017, 188, 19–31. [Google Scholar] [CrossRef]
- Jun, E.; Kim, W.; Chang, S.H. The analysis of security cost for different energy sources. Appl. Energy 2009, 86, 1894–1901. [Google Scholar] [CrossRef]
- Le, T.-H.; Chang, Y.; Taghizadeh-Hesary, F.; Yoshino, N. Energy insecurity in Asia: A multi-dimensional analysis. Econ. Model. 2019, 83, 84–95. [Google Scholar] [CrossRef]
- Erahman, Q.F.; Purwanto, W.W.; Sudibandriyo, M.; Hidayatno, A. An assessment of Indonesia’s energy security index and comparison with seventy countries. Energy 2016, 111, 364–376. [Google Scholar] [CrossRef]
- Glynn, J.; Chiodi, A.; Ó Gallachóir, B. Energy security assessment methods: Quantifying the security co-benefits of decarbonising the Irish Energy System. Energy Strategy Rev. 2017, 15, 72–88. [Google Scholar] [CrossRef]
- Geng, J.-B.; Ji, Q. Multi-perspective analysis of China’s energy supply security. Energy 2014, 64, 541–550. [Google Scholar] [CrossRef]
- Narula, K.; Reddy, B.S.; Pachauri, S. Sustainable Energy Security for India: An assessment of energy demand sub-system. Appl. Energy 2017, 186, 126–139. [Google Scholar] [CrossRef]
- Malik, S.; Qasim, M.; Saeed, H.; Chang, Y.; Taghizadeh-Hesary, F. Energy security in Pakistan: Perspectives and policy implications from a quantitative analysis. Energy Policy 2020, 144, 111552. [Google Scholar] [CrossRef]
- Sarangi, G.K.; Mishra, A.; Chang, Y.; Taghizadeh-Hesary, F. Indian electricity sector, energy security and sustainability: An empirical assessment. Energy Policy 2019, 135, 110964. [Google Scholar] [CrossRef]
- Ryu, H.; Dorjragchaa, S.; Kim, Y.; Kim, K. Electricity-generation mix considering energy security and carbon emission mitigation: Case of Korea and Mongolia. Energy 2014, 64, 1071–1079. [Google Scholar] [CrossRef]
- Ahn, J.; Woo, J.; Lee, J. Optimal allocation of energy sources for sustainable development in South Korea: Focus on the electric power generation industry. Energy Policy 2015, 78, 78–90. [Google Scholar] [CrossRef]
- Jansen, J.C.; Seebregts, A.J. Long-term energy services security: What is it and how can it be measured and valued? Energy Policy 2010, 38, 1654–1664. [Google Scholar] [CrossRef] [Green Version]
- Bazilian, M.; Roques, F. Analytical Methods for Energy Diversity & Security; Elsevier: Amsterdam, The Netherlands, 2008. [Google Scholar]
- Stirling, A. Diversity and ignorance in electricity supply investment: Addressing the solution rather than the problem. Energy Policy 1994, 22, 195–216. [Google Scholar] [CrossRef]
- Stirling, A. On the Economics and Analysis of Diversity; Science Policy Research Unit, Centre for the Study of Evolution, University of Sussex: Brighton, UK, 1998; pp. 1–134. [Google Scholar]
- Hill, M.O. Diversity and Evenness: A Unifying Notation and Its Consequences. Ecology 1973, 54, 427–432. [Google Scholar] [CrossRef] [Green Version]
- Rowley, H.V.; Peters, G.M.; Lundie, S.; Moore, S.J. Aggregating sustainability indicators: Beyond the weighted sum. J. Environ. Manag. 2012, 111, 24–33. [Google Scholar] [CrossRef]
- Gasser, P. A review on energy security indices to compare country performances. Energy Policy 2020, 139, 111339. [Google Scholar] [CrossRef]
- Korea Energy Economics Institute. KEEI Yearbook of Energy Statistics 2019; Korea Energy Economics Institute: Ulsan, Korea, 2020. [Google Scholar]
- OECD Organisation for Economic Co-Operation and Development, OECD Data Crude Oil Import Prices. Available online: https://data.oecd.org/energy/crude-oil-import-prices.htm (accessed on 7 February 2021).
- IEA International Energy Agency, Closing Oil Stock Levels in Days of Net Imports. Available online: http://www.iea.org/netimports/ (accessed on 7 February 2021).
- Kim, S.; Lee, H.; Kim, H.; Jang, D.-H.; Kim, H.-J.; Hur, J.; Cho, Y.-S.; Hur, K. Improvement in policy and proactive interconnection procedure for renewable energy expansion in South Korea. Renew. Sust. Energ. Rev. 2018, 98, 150–162. [Google Scholar] [CrossRef]
- MOTIE Ministry of Education, Science & Technology’s (MOTIE). MOTIE Notice #2017-611, The 8th Basic Plan for Long-Term Electricity Supply and Demand (2017–2031); Ministry of Trade, Industry and Energy: Sejong-si, Korea, 2017.
- Li, M.; Li, L.; Strielkowski, W. The Impact of Urbanization and Industrialization on Energy Security: A Case Study of China. Energies 2019, 12, 2194. [Google Scholar] [CrossRef] [Green Version]
- Taghizadeh-Hesary, F.; Yoshino, N. Sustainable Solutions for Green Financing and Investment in Renewable Energy Projects. Energies 2020, 13, 788. [Google Scholar] [CrossRef] [Green Version]
- He, W.; Abbas, Q.; Abbas, Q.; Mohsin, M.; Hanif, I.; Vo, X.V.; Taghizadeh-Hesary, F. Integration of renewable hydrogen in light-duty vehicle: Nexus between energy security and low carbon emission resources. Int. J. Hydrog. Energy 2020, 45, 27958–27968. [Google Scholar] [CrossRef]
Figure 1.
Energy import ratio.

Figure 2.
Oil price trend in Korea.

Figure 3.
Closing oil stock levels of net imports.

Figure 4.
Korea’s energy import dependence.

Figure 5.
Korean total primary energy supply and its composition.

Figure 6.
The SWI (Shannon-Wiener Index) of Korea from 1991 to 2018.

Figure 7.
The HHI (Herfindahl-Hirschman Index) of Korea from 1991 to 2018.

Figure 8.
The D_SWI of Korea from 1991 to 2018.

Figure 9.
The D_HHI of Korea from 1991 to 2018.

Publisher’s Note: MDPI stays neutral with regard to jurisdictional claims in published maps and institutional affiliations. |
© 2021 by the authors. Licensee MDPI, Basel, Switzerland. This article is an open access article distributed under the terms and conditions of the Creative Commons Attribution (CC BY) license (http://creativecommons.org/licenses/by/4.0/).
Share and Cite
MDPI and ACS Style
Park, H.; Bae, S. Quantitative Assessment of Energy Supply Security: Korea Case Study. Sustainability 2021, 13, 1854. https://0-doi-org.brum.beds.ac.uk/10.3390/su13041854
AMA Style
Park H, Bae S. Quantitative Assessment of Energy Supply Security: Korea Case Study. Sustainability. 2021; 13(4):1854. https://0-doi-org.brum.beds.ac.uk/10.3390/su13041854
Chicago/Turabian StylePark, Herie, and Sungwoo Bae. 2021. "Quantitative Assessment of Energy Supply Security: Korea Case Study" Sustainability 13, no. 4: 1854. https://0-doi-org.brum.beds.ac.uk/10.3390/su13041854
Note that from the first issue of 2016, this journal uses article numbers instead of page numbers. See further details here.