An Analysis of Renewable Energy Usage by Mobile Data Network Operators


1
Department of Software Engineering, NED University of Engineering and Technology, Karachi 75270, Pakistan
2
National Center for Cyber Security, Department of Computer and Information Systems Engineering, NED University of Engineering and Technology, Karachi 75270, Pakistan
3
National Center for Robotics and Automation, Department of Electrical Engineering, NED University of Engineering and Technology, Karachi 75270, Pakistan
4
Enterprise Computing Research Lab, University of East London, London E16 2RG, UK
*
Author to whom correspondence should be addressed.
Sustainability 2021, 13(4), 1886; https://0-doi-org.brum.beds.ac.uk/10.3390/su13041886
Submission received: 17 December 2020
/
Revised: 4 February 2021
/
Accepted: 4 February 2021
/
Published: 9 February 2021
(This article belongs to the Section Energy Sustainability)
Abstract
:The exponential growth in mobile data traffic has resulted in massive energy usage and therefore has increased the carbon footprint of the Internet. Data network operators have taken significant initiatives to mitigate the negative impacts of carbon emissions (CE). Renewable Energy Sources (RES) have emerged as the most promising way to reduce carbon emissions. This article presents the role of renewable energy (RE) in minimizing the environmental impacts of mobile data communications for achieving a greener environment. In this article, an analysis of some selected mobile data network operators’ energy consumption (EC) has been presented. Based on the current statistics of different mobile network operators, the future energy values are estimated. These estimations of carbon emissions are based on the predicted data traffic in the coming years and the percentage consumption of energy from renewable sources by the network operators. The analysis presented in this article would be helpful to develop and implement energy policies that accelerate the process of increasing the renewable shares in total energy requirements. Incrementing the share of renewable energy in total energy requirements can be a way forward to reach Goal 7 of the United Nations Sustainable Development Goals (SDGs).
1. Introduction
The enormous growth rate in mobile data communications has amplified its contribution to global carbon emissions. The exponential increase in the energy requirements of network operators is evident in [1,2]. Mobile data traffic is expected to be sevenfold in the year 2022 from the year 2017 as per the estimates of the Cisco Visual Networking Index (VNI) [3]. Table 1 shows the list of acronyms and symbols used in this paper. The annual mobile traffic run rate in 2022 is expected to exceed 929.9 exabytes from 138.1 exabytes in 2017. The Compound Annual Growth Rate (CAGR) of mobile traffic will be 46.4%, which will be double fixed IP traffic CAGR. According to the forecast, the mobile data traffic in 2022 will be 113 times that of 2012. It is also estimated that the mobile data traffic share of Global IP traffic in 2022 will be increase to 20% from 9% in 2017. The monthly mobile traffic increment in 2022 concerning the total number of mobile end-user devices is expected to reach 9.0 Gigabytes from the 1.5 Gigabytes in the year 2017. Similarly, per month mobile traffic per mobile connection is expected to increase until 6.3 Gigabytes in the year 2022 from the monthly traffic of 1.3 Gigabytes in the year 2017. The difference between the monthly traffic has been shown in Figure 1. The expected monthly traffic rise per user and per head in the year 2022 from the year 2017 is also illustrated in the figure. It is estimated that the monthly mobile traffic per user will increase to 13.3 Gigabytes from 2.3 Gigabytes in the year 2017. Monthly traffic per head from 1.5 Gigabytes in the year 2017 is also expected to reach 9.7 Gigabytes in the year 2022. It is a known fact that base stations are the most energy-consuming component of the mobile network [4]. Base stations contribute around 70% to the total energy usage of mobile networks [5]. The rise in mobile data traffic results in the growth of mobile base stations energy consumption. The rise in mobile data traffic results in the growth of mobile base station energy consumption. Therefore, the huge energy requirements and its subsequent carbon footprint for the anticipated data traffic statistics in 2022 can easily be imagined. Thus, energy efficiency has become one of the critical factors of mobile communication for ensuring sustainable use of energy. The use of RE is considered one of the promising solutions to a way forward towards the efficient use of energy.
A large amount of energy usage and its consequent harmful carbon emissions stimulate the mobile data network operators to apply energy efficiency techniques in mobile communications. Network operators are focused to reduce carbon footprints. Renewable energy is considered one of the most promising techniques to reduce the carbon footprints of mobile data communications. The use of renewable energy is assisting mobile data network operators in attaining sustainable energy usage [7,8]. The current status of the network operators using renewable energy to reduce harmful emissions and their future targets are summarized in Table 2. The data in Table 2 have been compiled from the most recent available sustainability reports of network operators. The table shows the current usage status of RE by different mobile data network operators. The table also specifies the carbon footprints of the mobile data network operators. The targets of the mobile data network operators related to the incremental use of RE and reduction in CE according to the years are also specified in the table. From the table, it can be observed that most of the network operators are aiming to attain all their energy requirements through renewable energy sources.
The importance of estimating future energy requirements and their consequent carbon emissions cannot be ignored when developing an effective energy policy for the future. In [16], the energy policy forum emphasized the importance of policy creation to achieve the targeted energy efficiency. The forum also stressed the importance of data collection for reliable energy predictions to make realistic and successful energy usage plans. The forum has highlighted that consistent estimates are necessary so that policymakers can make useful energy policies accordingly.
The main contribution of this article is the forecasting of future carbon footprints of the network operators through the statistical analysis of current strategies followed by the operators. The statistics are gathered from the sustainability reports of operators. The analysis performed in this article is unique in the way that these estimations are based on the extensive exploration of the sustainability reports of the mobile data network operators. To the best of our knowledge, the predictions for the carbon emissions by the mobile data network operator using the thorough analysis of their sustainability and annual reports is first of its kind. Some literature is available in which the generic sort of analysis using the available data of the few mobile network data operators is performed [17,18]. Energy consumption and carbon emission values are considered and evaluated in [17]. In [19], the comparison of Corporate Social Responsibility (CSR) among telecommunication companies like Vodafone, Telefonica, O2 and T-Mobile is performed. The comparison in [19] is done through the use of sustainability reports published by these operators. In this article, we have extensively discussed the current energy sustainability state of the mobile data network operators. The impact of renewable energy utilization over carbon emissions has been evaluated through the present values and based on these observations, future sustainability states of the network operators are forecasted. The objective of our analysis is that it will help the mobile data network operators to reassess or reorganize their plans for attaining their set targets. Additionally, the policymakers for achieving energy sustainability can also be benefited by the analysis. However, due to the limited availability of data, our analysis is limited to only a few mobile data network operators. Our methodology is restrained to forecast the carbon emissions of a few mobile data network operators as the complete data of many operators is unavailable.
The remainder of the paper is organized as follows. Section 2 presents the related work emphasizing the importance of renewable energy sources in minimizing the harmful emissions of network communication. In Section 3, the methodology for estimating the expected carbon footprints by network operators in the future is presented. Results of the estimations are shown in Section 4. The impact of renewable energy usage on carbon emissions is evaluated through the predicted values. The discussion over the estimated results and the gap between the targets of network operators and our forecasts are performed in Section 5. In Section 6, the precision of estimations has been evaluated. Section 7 has addressed the impact on data usage of network operators due to the unforeseen coronavirus pandemic. Section 8 concludes the articles with a discussion on future research directions.
2. Related Work
Renewable energy has the potential to reduce the harmful environmental impacts of emissions from ICT. From the literature review, it can be seen that most of the countries are taking the benefits of renewable energy to tackle the electricity crisis and diminishing the destructive environmental impacts. The importance of renewable energy in minimizing carbon emissions is discussed in [20]. Vital renewable energy sources include wind, solar, biomass, hydropower and geothermal and they are contributing to energy sustainability [21]. The potential of renewable energy generation is not equal geographically. However, each country is making all its efforts to generate renewable energy from the pool of available sources. Hydropower development has a substantial environmental impact that goes beyond region [22]. The authors in [23] have analyzed the contribution of lakes and reservoirs in the SDGs. Hydropower is getting attention as a key renewable energy source due to its role in energy sustainability.
The use of renewable energy is also gaining popularity in a dense network of small base stations [24]. To cope with the expected traffic requirements of mobile networks, a network of small base stations is being immensely deployed. Although such solutions are capable of handling huge future traffic requirements, due to the increased quantity of base stations such solutions consume a huge amount of energy. Therefore, the utilization of renewable energy in these small base stations is found to be an appropriate solution for reducing the energy requirements. In [25], the concept of Multi-Access Edge Computing (MEC) is also discussed which adds cloud computing abilities to base stations. The incorporation of renewable energy in MEC has also been discussed by the authors in [25].
Due to the higher installation cost of renewable energy sources and higher operating cost of non-renewable energy sources, hybrid use of both techniques is suggested as an optimized solution. Solar or wind-based renewable energy systems are a feasible choice for minimizing carbon emissions from network base stations. A Hybrid Renewable Energy System (HRES) is presented in [26], which is used for energy generation. The system is a combination of renewable energy sources, including photovoltaic (PV) and Wind and fuel cells with hydrogen storage. Due to high conversion efficiency and cheap maintenance cost, fuel cells are considered a prominent programmable source [27]. The system has been assessed through numerous sites over the observational period of one year. Simulations are performed through a voltage based numerical method. In the voltage-based process, voltage thresholds are maintained by setting rules in control logic. The procedure is validated on a daily and annual basis. Total energy flux of 4% is observed in validation representing excellent results. The method proves to be a sustainable solution as compared to diesel generators for powering base stations. The impact on the performance of HRES by the relocation of base stations was also evaluated. It was observed that the area with better Renewable Energy Sources (RES) availability performed better than other zones.
In [28], the emergence of the Internet of Things (IoT) in wireless networks is discussed. The authors argued that the reduction in energy consumption of base stations is considered mandatory to make the deployment of IoT successful. A system model is developed to minimize the energy consumption of networks comprises of hybrid energy sources containing conventional and renewable sources. The network consists of macro and pico base stations. The solution is constituted by different algorithms that are established based on renewable energy distribution, user distribution, traffic statistics and energy usage prediction at each base station at other time slots. The purpose of dividing the solution into multiple algorithms is to minimize the energy costs along with consumptions. The simulations are then compared with the nearest association and the Maximum Green Energy Utilization (MGEU) algorithms and proven to be promising.
In rural areas, the non-availability of consistent grid power is the most dominant factor for using renewable energy. Also, the use of renewable energy is more prevalent in rural areas of the world because renewable energy resources, including Solar and Wind, are readily available and usable in less congested areas [29]. In [5], the impact of renewable energy usage in rural areas of Congo is examined. The energy usage comparison of diesel, Wind and solar, and hybrid sources is performed by powering base stations through these techniques. The comparison is accomplished using the Hybrid Optimization Model for Electric Renewable (HOMER). Using HOMER, technical and economic aspects of diversified alternatives can be compared. From the analysis of the mentioned energy sources, it is observed that pure renewable solutions are viable where these sources are widely available. In other areas, the combination of renewable and conventional sources is cost-effective as compared to a diesel generator.
In [30], it is claimed that solar power is a promising solution for reducing energy consumption in areas where electricity is not abundantly accessible. The authors also argued that the exponential growth of base stations in developing countries of Asia and Africa had enhanced the use of renewable energy sources. The reason for this is the unavailability of reliable power in these countries. A case study of an African country, Ghana, is also presented. Until 2012, 60% of Ghana’s population had no cellular access because of the absence of grid power infrastructure. In 2012, a telecom manufacturer deployed ten solar base stations in that area. Low power usage has been observed in these base stations as compared to the conventional base stations. Each cell site of the solar base station consumes 40 W lesser power than traditional base station cell sites. It is argued that although there are few challenges in deploying renewable energy sources in some areas, these problems can be mitigated. Renewable energy sources can play a vital role in future environmental sustainability. In [31], a scenario is presented, which is implemented on the base stations of a European network operator. A switch-off algorithm is proposed which uses stored renewable energy. Utilization of allocated renewable energy by the powered-on base stations results in the saving of electricity bills. The authors claimed that 20% of the total required energy obtained from renewable energy saves 51% of the electricity bill.
A policy-driven tool [32] developed in China shows the positive impact of renewable energy in reducing environmental deprivation. Through the model, it is observed that the use of fossil fuels increases harmful emissions by 1.58%, while the use of renewable energy reduces emissions by 0.38%. The authors claimed that the model is applicable if the policies favor its implementation. A prediction model [33] has been developed for calculating the impact of renewable energy in China. The model is formed based on the grey prediction model. The percentage of renewable energy in total energy consumption is forecasted.
3. Materials and Methods
The negative environmental impacts of massive energy consumption have stimulated the network operators to control energy use. Therefore, several approaches are being used by the operators to mitigate the harmful climatic effects. The network operators are quantifying their efforts by stating their results in annual and sustainability reports. The operators’ goal is to save the environment and reduce carbon emissions by applying sustainable energy usage techniques. In this research work, an extensive analysis is performed by a detailed study of network operators’ sustainability reports. It is observed that almost all the operators are targeting to take benefits from renewable energy sources for reducing the footprints. We have selected three of the network operators who are working on multiple continents for the estimation of their future emissions. The chosen network operators include Vodafone, Telstra, and Telefonica. Vodafone has been operating in 25 countries. Telstra is the leading telecom operator in Australia. However, Telstra is operating in 20 countries worldwide. The third data network operator, Telefonica, has also been working in 25 countries. The reason for selecting these three operators is that Vodafone, Telstra and Telefonica are among the world’s top ten telecommunication networks. These companies have subscribers from all over the world. Some of the leading telecommunication companies are working in numerous countries. However, their significant share is from one country, like AT&T, which generates more than 90% of its capital share from the USA only. The reason for the inclusion of Telstra is to check the status of relatively smaller network operators regarding energy efficiency. The secondary reason for considering these three network operators is that the operators’ most current and comprehensive data is also available, through which analysis can be performed.
The energy consumption growth of mobile networks is reasonable due to the rapid escalation in mobile data usage. The network operators are motivated to reduce the harmful effects of energy use; that is, the harmful carbon emissions are required to be diminished. These emissions can be controlled by applying energy-efficient techniques, including renewable energy. Table 3 shows the Energy Consumption (EC) of the selected network operators in the last thirteen years. The article has discussed the reductions in emissions due to the use of renewable energy sources. In this article, we are calculating the expecting growth rate of data and its resultant energy consumption. The trends of renewable energy share in whole energy use and carbon emissions are then predicted as per the estimated expansion in energy requirements. In the case of forecasting growth rate from the historical data with regular intervals, Time Series Analysis was found to be a reliable statistical method. Forecasting methods through Time Series are evolved over 50 years. The estimations using Time Series are considered to be highly accurate in normal situations because multiple parameters are considered in the forecasting [34]. Therefore, we have chosen Time Series Analysis in this article for estimating the future CE against expected Data Usage (DU). Our analysis aims to determine the contribution of renewable energy usage in reducing the mobile data network operators’ CE despite the huge data usage. The data in time series can be analyzed through three different models. We have chosen a trend-based autoregressive model [35] of time series analysis which is the appropriate analytical method in our case. We have collected the data on yearly basis and the predictions are to be made for future years. We have estimated the values for the next 6 years only as the trend analysis has to be cautiously applied over short periods [35]. The generic formula for a trend-based autoregressive model can be represented as
where is variable to be predicted, is the independent variable, is a period of prediction, and are the coefficients.
4. Results
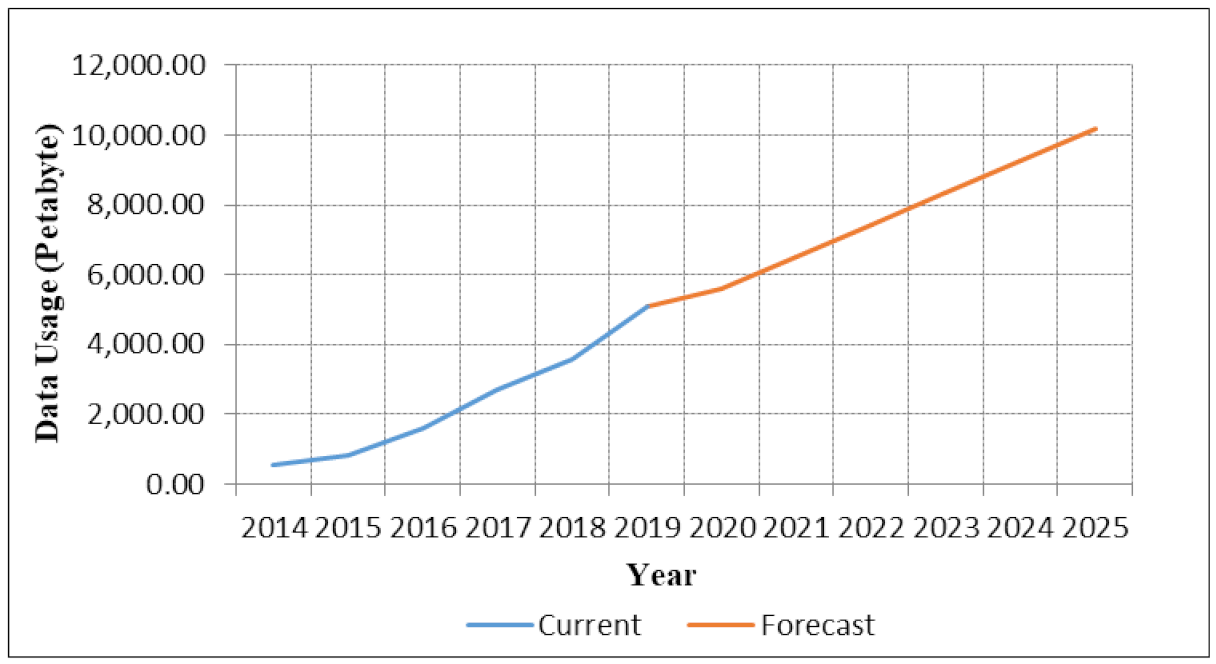
The data from the year 2014 to 2019 is taken for estimation. The DUs of the selected operators are estimated using Equation (1). For Vodafone, Equation (1) can be re-written as
where is the Data Usage in Petabytes of the Vodafone and is the corresponding year of forecasting the Data Usage values. The values of and are determined through the regression analysis of known values. The predicted values from the year 2020 to 2025 are calculated using Equation (2). Figure 2 shows the known values used in regression analysis as Blue and predicted values as Red. The DU prediction equation for Telefonica is as follows;
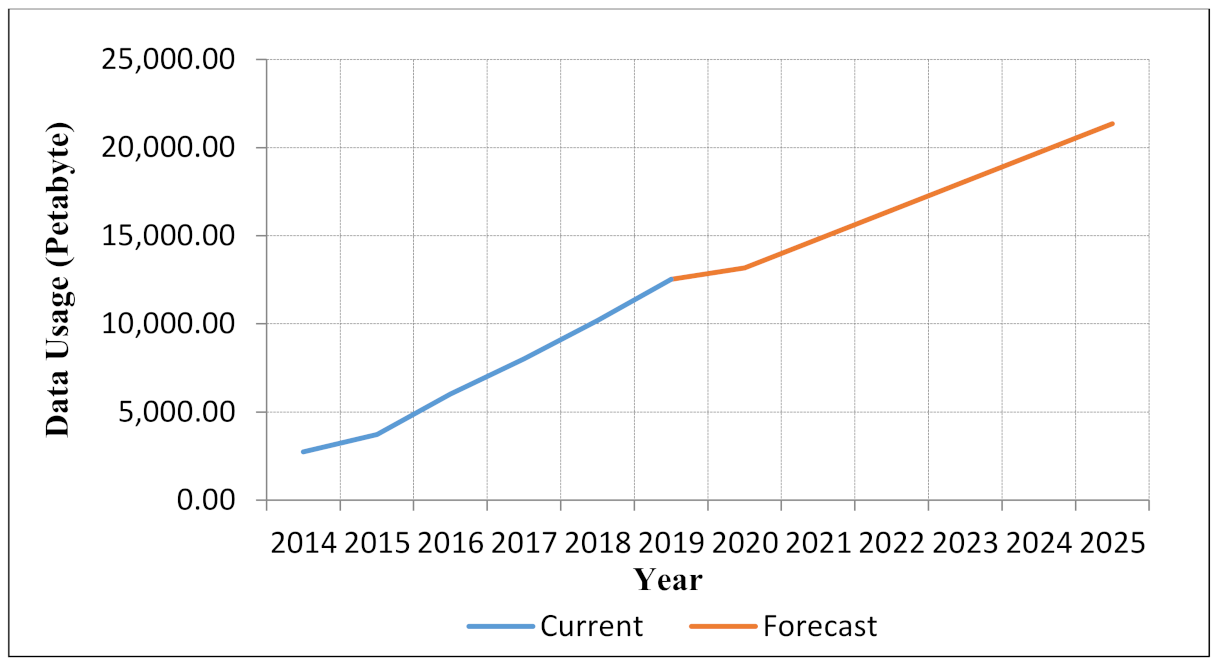
where is the Data Usage in Petabytes of the Telefonica and is the corresponding year of forecasting the Data Usage values. The known and estimated values of data usage by Telefonica can be seen in Figure 3. The estimated values have been calculated through Equation (3). Equation (4) shows the data usage prediction formula, and Figure 4 shows the current and predicted data usage by Telstra.
where is the Data Usage in Petabytes of the Telstra and is the corresponding year of forecasting the Data Usage values.
The growth rate in traffic can be seen from Figure 2, Figure 3 and Figure 4. The DU of Vodafone is expected to reach 10 Exabytes in 2025. Telefonica data usage is also expected to reach 8 Exabytes. The expected growth rate of Telstra is threefold from the year 2017. The energy utilization is also measured using the same statistical procedure through which DU is predicted. Using the TREND function, the percentage of renewable energy is calculated using the estimated total energy requirements. Equations (5)–(7) represent the prediction formula of renewable energy usage for Vodafone, Telefonica and Telstra, respectively.
where and are the Renewable Energy in Gigawatt hours (GWh) of the Vodafone, Telefonica and Telstra respectively and , and are the Energy Consumption in Gigawatt hours of the Vodafone, Telefonica and Telstra respectively (GWh) for the corresponding year of forecasting the Renewable Energy values.
The forecasted values obtained from the equations can be seen in Figure 5, which shows the impact of renewable energy use over carbon emissions. Figure 5 shows that, despite the increase in total energy utilization, carbon emissions are expected to decrease with the increased renewable energy usage. From Figure 5a, it can be observed that the percentage of renewable energy usage in total energy requirements by Vodafone is expected to decrease. Vodafone has planned to do agreements with few firms to attain 100% of energy from renewable energy sources by 2025. However, no technical and quantitative details of these agreements are mentioned. Therefore, these prospected agreements cannot be included in forecasting.
The contribution of renewable energy from recent years in Vodafone estimates that the percentage of renewable energy in total energy requirements will decrease in the future. The targets of Telefonica appear to be well assessed, as evident from the calculated values in Figure 5b. It can be witnessed from the forecast that by 2030, Telefonica expects to fulfill all energy requirements from renewable energy sources. From the analysis, it is noticed that initially, the share of renewable energy usage is likely to decline as compared to its current use, due to the enormous increase in data usage. Despite the initial reduction, the use of renewable energy sources is estimated to increase afterward. From the analysis of Figure 5c, it is clear that the percentage of renewable energy use by Telstra appears to be constant. Telstra has not specified any target for achieving any specific range of renewable energy sources; however, Telstra supports the incremental use of renewable energy sources.
The inclusion of renewable energy sources in overall energy consumption impacts the growth of carbon emissions. The use of renewable energy makes network operators able to contribute a large share in sustainability. The reduction in carbon emissions concerning the use of anticipated renewable energy is also forecasted through our analysis. Figure 5 shows the estimated values of carbon emissions. These values are calculated using the following formulas;
where , and are the Carbon Emissions in million tons of the Vodafone, Telefonica and Telstra respectively and , and are the Renewable Energy Consumption in Gigawatt hours (GWh) of the Vodafone, Telefonica and Telstra respectively for the corresponding year of forecasting the Carbon Emissions values.
Equations (8)–(10) are the formulas for forecasting the values of carbon emissions by Vodafone, Telefonica and Telstra, respectively. From the estimated costs shown in Figure 5, it can be observed that renewable energy is a handy tool for achieving sustainability. From the analysis of Figure 5a, it is noticeable that the carbon emissions are anticipated to rise concerning the expected decrease in renewable energy utilization. From the analysis, it can be perceived that reducing carbon emissions can only be achieved if the target of increasing renewable energy utilization is accomplished. The target of reducing carbon emissions to 50% in 2025 in comparison to the year 2017 can only be realized if renewable energy use would reach 23% of the total required energy. From the analysis of carbon emissions of Telefonica in Figure 5b, the attainment of the target can be observed. It is worth noticing that the accomplishment of renewable energy utilization targets results in the realization of targeted sustainability too. After analyzing carbon emissions, it was determined, as Figure 5c shows, that the overall carbon emissions of Telstra are also expected to rise. This is because the use of renewable energy by Telstra is predicted to be constant despite the increase in total energy requirements for managing the incremented data usage.
5. Discussion
From the detailed analysis of the selected network operators, it is clear that renewable energy plays a significant role in creating a sustainable environment. From the study, it can be seen that the network operators using a tremendous amount of energy from renewable sources are more rapidly decreasing the carbon footprints than other methods. It is observed that due to the enormous data growth, the emissions of all selected network operators are expected to rise, although the emission intensity would decrease. The analysis proves that the total emissions will start to decline only with the incremental use of renewable energy. From the current statistics, it can be observed that despite the huge increase in data usage, carbon emissions will ultimately reduce with the incremental usage of renewable energy. The data usage of Vodafone increased by 29% from 2018 to 2019. However, the percentage increment in the use of renewable energy is only 1%–2%. Therefore, the decrement in carbon emissions will be only 3% from 2018 to 2019. Similarly, the data usage of Telstra from 2018 to 2019 is increased by 19% with the 5% incremental use of renewable energy. The resultant reductions in carbon emissions are only 4%. In the case of Telefonica, the data usage has been increased by 21% from 2018 to 2019 with a 27% increase in renewable energy usage. The huge increase in the percentage use of renewable energy causes the carbon emissions to be reduced by 22%. The same trend is expected to be followed in the future as per our analysis. It can be easily noticed that Telefonica is expected to reduce the huge percentage of carbon emissions due to the significant percentage of renewable energy use. However, the reductions in the carbon emissions of Vodafone and Telstra are expected to occur at a very lethargic pace verifying the significance of renewable energy use. In Table 4, the comparative study in the rate of change of emissions also signifies that fact. From Table 4, it can be observed that except Telefonica, the carbon emissions of the other two networks are expected to rise. Negative values in Table 4 imply an increase in emissions rather than a reduction. The factor that involves the growth of emissions of Vodafone and Telstra is the decrement in the share of renewable energy. From the analysis, it can be noticed that the use of renewable energy by Vodafone is estimated to decrease, which causes a considerable percentage increase in carbon emissions of Vodafone.
6. Validation
The estimation results are validated through two different methods. In the first technique, the available data of the mobile network operators is for the years before 2014. In this technique, we take the difference between the actual value and the obtained value as per Equations (8)–(10) for respective operators. In the next step, the ratio of the difference to the actual value will give the percentage error in the estimation. The percentage error in the estimated values has been calculated for validating the precision of the forecast. The percentage error in the prediction is shown in Table 5. It can be observed that for Telefonica and Telstra, the results are very precise, and they are within 5% of the error margin. The results of Vodafone are also acceptable as the error margin is within 10%.
The second method used for the validation of the results is the calculation of the confidence interval value. In this method, the confidence level of 95% has been taken. The confidence interval is obtained by calculating the standard deviation and mean of the population. Table 6 shows the results of the confidence interval for each of the operators. It can be observed that the resultant confidence interval represents the highly precise estimation outcomes.
7. Covid-19 Impacts on Network Data Usage and Its Carbon Emissions
The current Covid-19 pandemic has impacted human lives to a large extent, and the norms of life have changed. The lockdown situation has turned non-internet users into internet users. This has raised 30% to 40% of the total network traffic [36]. The location of data usage and the peak usage hours are also changed. The increase in data usage and change of sites has led the network operators to invest in more capacity and provision of satisfactory services in public areas. The importance of renewable energy has also been observed in lockdown days. As per the GSMA press release at the end of May 2020 [37], mobile data traffic had marginally decreased in the initial days of Covid-19 but then after some time, mobile data traffic continued to increase. According to the report, the UK operator BT and Nordics operator Telia have experienced a 20% increase in mobile data traffic. Telefonica has also experienced a 48% increase in mobile data during Covid-19. Telefonica has claimed that its data usage growth exceeds the total cumulative growth rate of the year [38]. From the last 12 months, data growth of 30% was observed. However, a month after COVID-19 began, the overall data growth rate had reached 35% (in which 48% is mobile data traffic and 26% is fixed data traffic) [37,38]. Though all these mentioned mobile data operators have experienced incremental data traffic, the electricity consumption has not been changed or differs negligibly. The reason for unchanged electricity is the use of renewable energy by these mobile data network operators. BT accomplishes 100% of its energy requirements from renewable sources [37]. Similarly, Telefonica also fulfills almost 100% of its energy requirements from renewable sources in Europe. As per our analytical results in Equation (3), the DU of Telefonica in 2020 was expected to reach 7776 Petabytes, but due to the corona pandemic, it has already reached 9741 Petabytes. If we use this DU to calculate the percentage of RE in total energy requirements, the proportion of RE would rise to around 97% as per Equation (6) due to which CE values are also under control. Our analytical results are satisfying the fact presented in the GSMA report that Telefonica mobile DU has been increased in Europe including in the UK, Germany and Spain. According to the reports, Telefonica uses renewable sources for almost 100% of its operations in Europe.
According to the reports, Vodafone data usage has increased by 15% [39]. The mobile data of Vodafone in Italy and Spain has enlarged by 30%. According to our analysis and as per Equation (2), the increase in the DU of Vodafone from the year 2019 to 2020 was expected to be between 16% to 18%. However, the corona pandemic has already made the DU of Vodafone increase by 15%. As per our analysis, with the increase in DU of Vodafone, the EC is expected to increase. The share of renewable energy is anticipated to decrease with the incremental energy requirements of Vodafone. Consequently, the CE of Vodafone is predicted to reach a higher value as per Equation (8). Vodafone has been committed to using 100% of renewable sources in its operations, but our analysis indicates that it will take more time. Vodafone recently has also made some new commitments to make its all operations through renewable sources by mid-2021 [40]. As per the Environmental, Social, and Governance (ESG) Addendum [41], the renewable energy source contribution by Vodafone has been increased to 25% in 2020. However, that report is not comprising of the complete year of 2020. Therefore, due to the Covid-19, the percentage of renewable energy may decrease.
8. Conclusions
The article has discussed the role of renewable energy sources in the energy efficiency of network operators. Renewable energy sources have been very effective in reducing carbon emissions. More and more telecom data network operators are migrating to renewable energy sources. We have presented a predictive analysis of carbon emissions and percentage use of renewable energy of three large international data network operators following their current state. The analysis indicates that the carbon footprints can be easily controlled with the incremental use of renewable energy. The forecasted values indicate the greener impact of the network operators using more energy from renewable sources. Our predictive analysis and case study can help in formulating a global and regional renewable energy usage policy for mobile data network operators and related services. In the future, the analysis can be extended to the regional level provided the data of the majority of the mobile data network operators in the same region will be available.
Author Contributions
Conceptualization, A.A.; methodology, A.A., S.S. and U.H.; formal analysis, S.S.; resources, U.H. and R.U.; data curation, S.S.; writing—original draft preparation, S.S.; writing—review and editing, A.A., U.H and R.U.; supervision, A.A.; project administration, A.A., U.H., and R.U.; All authors have read and agreed to the published version of the manuscript.
Funding
This research work is partially funded by NED University of Engineering and Technology.
Institutional Review Board Statement
Not applicable.
Informed Consent Statement
Not applicable.
Data Availability Statement
Data available in a publicly accessible repository.
Conflicts of Interest
The authors declare no conflict of interest.
References
- Jahid, A.; Islam, M.S.; Hossain, M.S.; Hossain, M.E.; Monju, M.K.H.; Hossain, M.F. Toward Energy Efficiency Aware Renewable Energy Management in Green Cellular Networks With Joint Coordination. IEEE Access 2019, 7, 75782–75797. [Google Scholar] [CrossRef]
- Bolla, R.; Bruschi, R.; Davoli, F.; Cucchietti, F. Energy efficiency in the future internet: A survey of existing approaches and trends in energy-aware fixed network infrastructures. IEEE Commun. Surv. Tutor. 2011, 13, 223–244. [Google Scholar] [CrossRef]
- Cisco Visual Networking Index. Available online: https://www.cisco.com/c/en/us/solutions/service-provider/visual-networking-index-vni/index.html (accessed on 17 March 2020).
- Wu, J.; Zhang, Y.; Zukerman, M.; Yung, E.K.-N. Energy-efficient base-stations sleep-mode techniques in green cellular networks: A survey. IEEE Commun. Surv. Tutor. 2015, 17, 803–826. [Google Scholar] [CrossRef]
- Ahmed, F.; Naeem, M.; Iqbal, M. ICT and renewable energy: A way forward to the next generation telecom base stations. Telecommun. Syst. 2017, 64, 43–56. [Google Scholar] [CrossRef]
- Index, C.V.N. Global mobile data traffic forecast update, 2017–2022. White Pap. 2019. [Google Scholar]
- Piro, G.; Miozzo, M.; Forte, G.; Baldo, N.; Grieco, L.A.; Boggia, G.; Dini, P. Hetnets powered by renewable energy sources: Sustainable next-generation cellular networks. IEEE Internet Comput. 2012, 17, 32–39. [Google Scholar] [CrossRef]
- Hassan, H.A.H.; Singh, K.D.; Nuaymi, L. Grid energy consumption of mixed-traffic cellular networks with renewable energy sources. In Proceedings of the 2016 IEEE Online Conference on Green Communications (OnlineGreenComm), Piscataway, NJ, USA, 14 November–17 December 2016; pp. 1–6. [Google Scholar]
- Deutsche Telecom Annual Reports 2013–2018. Available online: https://www.annualreport.telekom.com/site0218/fileadmin/GB17/EN/PDF/20180309_GB2017_EN_COMPLETE.pdf (accessed on 4 March 2019).
- Telefonica Annual Reports 2013–2019. Available online: https://www.telefonica.com/en/web/shareholders-investors/financial_reports/annual-report (accessed on 24 February 2020).
- Telstra Annual and Sustainability Reports 2013–2019. Available online: https://www.telstra.com.au/content/dam/tcom/about-us/investors (accessed on 23 February 2020).
- T-Mobile Sustainability Report. Available online: https://www.t-mobile.nl/Company/media/pdf/sustainability-report-2018.pdf (accessed on 1 April 2020).
- Verizon Sustainability Report. Available online: https://www.verizon.com/about/sites/default/files/corporate-responsibility-report/2018/2018-Corporate-Responsibility-Report.pdf (accessed on 23 April 2020).
- Virgin Media Annual Report. Available online: https://assets.virginmedia.com/resources/pdf/how-we-did-2018.pdf (accessed on 2 April 2020).
- Vodafone Annual and Sustainability Reports, 2013–2019. Available online: http://www.vodafone.com/content/annualreport (accessed on 23 February 2020).
- Masanet, E.; Shehabi, A.; Lei, N.; Smith, S.; Koomey, J. Recalibrating global data center energy-use estimates. Science 2020, 367, 984–986. [Google Scholar] [CrossRef]
- Sutherland, E. Corporate social responsibility: The case of the telecommunications sector. Info 2016, 18, 24–44. [Google Scholar] [CrossRef]
- Radonjič, G.; Tompa, S. Carbon footprint calculation in telecommunications companies–The importance and relevance of scope 3 greenhouse gases emissions. Renew. Sustain. Energy Rev. 2018, 98, 361–375. [Google Scholar] [CrossRef]
- Johnová, I. The comparison of the publication of reports on corporate social responsibility in the area of telecommunications services. Sci. Pap. Univ. Pardubice Ser. Fac. Econ. Adm. 2011, 21, 32011. [Google Scholar]
- Ahmed, F.; Naeem, M.; Ejaz, W.; Iqbal, M.; Anpalagan, A. Resource management in cellular base stations powered by renewable energy sources. J. Netw. Comput. Appl. 2018, 112, 1–17. [Google Scholar] [CrossRef]
- Herzog, A.V.; Lipman, T.E.; Kammen, D.M. Renewable energy sources. Encycl. Life Support. Syst. EOLSS Forerunn. Vol. Perspectives Overv. Life Support. Syst. Sustain. Dev. 2001, 76, 505–36. [Google Scholar]
- Liu, J.; Zuo, J.; Sun, Z.; Zillante, G.; Chen, X. Sustainability in hydropower development A case study. Renew. Sustain. Energy Rev. 2013, 19, 230–237. [Google Scholar] [CrossRef]
- Ho, L.T.; Goethals, P.L. Opportunities and challenges for the sustainability of lakes and reservoirs in relation to the Sustainable Development Goals (SDGs). Water 2019, 11, 1462. [Google Scholar] [CrossRef] [Green Version]
- Piovesan, N.; López-Pérez, D.; Miozzo, M.; Dini, P. Joint Load Control and Energy Sharing for Renewable Powered Small Base Stations: A Machine Learning Approach. IEEE Trans. Green Commun. Netw. 2020. [Google Scholar] [CrossRef]
- Temesgene, D.A.; Miozzo, M.; Gunduz, D.; Dini, P. Distributed Deep Reinforcement Learning for Functional Split Control in Energy Harvesting Virtualized Small Cells. IEEE Trans. Sustain. Comput. 2020, 1–1. [Google Scholar] [CrossRef]
- Bartolucci, L.; Cordiner, S.; Mulone, V.; Pasquale, S. Fuel cell based hybrid renewable energy systems for off-grid telecom stations: Data analysis and system optimization. Appl. Energy 2019, 252, 113386. [Google Scholar] [CrossRef]
- Cordiner, S.; Mulone, V.; Giordani, A.; Savino, M.; Tomarchio, G.; Malkow, T.; Tsotridisc, G.; Pilenga, A.; Karlsen, M.L.; Jensen, J. Fuel cell based Hybrid Renewable Energy Systems for off-grid telecom stations: Data analysis from on field demonstration tests. Appl. Energy 2017, 192, 508–518. [Google Scholar] [CrossRef]
- Wang, B.; Yang, Q.; Yang, L.T.; Zhu, C. On minimizing energy consumption cost in green heterogeneous wireless networks. Comput. Netw. 2017, 129, 522–535. [Google Scholar] [CrossRef]
- Hassan, H.A.H.; Nuaymi, L.; Pelov, A. Classification of renewable energy scenarios and objectives for cellular networks. In Proceedings of the 2013 IEEE 24th Annual International Symposium on Personal, Indoor, and Mobile Radio Communications (PIMRC), London, UK, 8–11 September 2013; pp. 2967–2972. [Google Scholar]
- Chamola, V.; Sikdar, B. Solar powered cellular base stations: Current scenario, issues and proposed solutions. IEEE Commun. Mag. 2016, 54, 108–114. [Google Scholar] [CrossRef]
- Hassan, H.A.H.; Ali, A.; Nuaymi, L.; Elayoubi, S.E. Renewable energy usage in the context of energy-efficient mobile network. In Proceedings of the 2015 IEEE 81st Vehicular Technology Conference (VTC Spring), Glasgow, UK, 11–14 May 2015; pp. 1–7. [Google Scholar]
- Sarkodie, S.A.; Adams, S.; Owusu, P.A.; Leirvik, T.; Ozturk, I. Mitigating degradation and emissions in China: The role of environmental sustainability, human capital and renewable energy. Sci. Total Environ. 2020, 719, 137530. [Google Scholar] [CrossRef] [PubMed]
- Tsai, S.-B.; Xue, Y.; Zhang, J.; Chen, Q.; Liu, Y.; Zhou, J.; Dong, W. Models for forecasting growth trends in renewable energy. Renew. Sustain. Energy Rev. 2017, 77, 1169–1178. [Google Scholar] [CrossRef]
- Sabry, M.; Abd-El-Latif, H.; Badra, N. Comparison between regression and ARIMA models in forecasting traffic volume. Aust. J. Basic Appl. Sci. 2007, 1, 126–136. [Google Scholar]
- Woodward, W.A.; Gray, H.L. Global warming and the problem of testing for trend in time series data. J. Clim. 1993, 6, 953–962. [Google Scholar] [CrossRef] [Green Version]
- Branscombe, M. The Network Impact of the Global COVID-19 Pandemic. New Stack 2020. [Google Scholar]
- COVID-19 Network Traffic Surge Isn’t Impacting Environment Confirm Telecom Operators, GSMA Press Release. Available online: https://www.gsma.com/newsroom/press-release/covid-19-network-traffic-surge-isnt-impacting-environment-confirm-telecom-operators (accessed on 31 July 2020).
- Telefonica Data Usage during COVID-19. Available online: https://www.fiercetelecom.com/telecom/during-one-month-covid-19-telefonica-s-data-traffic-growth-exceeds-yearly-total (accessed on 11 May 2020).
- An update on Vodafone’s networks. Available online: https://www.vodafone.com/covid19/news/update-on-vodafone-networks (accessed on 12 May 2020).
- Vodafone EU networks to go green by 2021. Available online: https://www.mobileworldlive.com/featured-content/top-three/vodafone-eu-network-to-go-green-by-2021 (accessed on 25 July 2020).
- Vodafone ESG Addendum. Available online: https://investors.vodafone.com/sites/vodafone-ir/files/vodafone/esg-addendum2020.pdf (accessed on 7 December 2020).
Figure 1.
Anticipated Mobile Data Traffic per Month from 2017 to 2022 by Cisco VNI [6].
Figure 1.
Anticipated Mobile Data Traffic per Month from 2017 to 2022 by Cisco VNI [6].

Figure 2.
Vodafone Data Usage (DU) Statistics showing Current and Forecast Values.

Figure 3.
Telefonica Data Usage (DU) Statistics showing Current and Forecast Values.

Figure 4.
Telstra Data Usage (DU) Statistics showing Current and Forecast Values.

Figure 5.
Carbon Emissions Reduction with the Incremental Renewable Energy Share in Total Energy Consumption: (a) Vodafone; (b) Telefonica; (c) Telstra.
Figure 5.
Carbon Emissions Reduction with the Incremental Renewable Energy Share in Total Energy Consumption: (a) Vodafone; (b) Telefonica; (c) Telstra.


Table 1.
List of used Acronyms and Symbols.
| CE | Carbon Emissions |
|---|---|
| CAGR | Compound Annual Growth Rate |
| CSR | Corporate Social Responsibility |
| DU | Data Usage |
| EC | Energy Consumption |
| GWh | Gigawatt hours |
| HOMER | Hybrid Optimization Model for Electric Renewable |
| HRES | Hybrid Renewable Energy Systems |
| IoT | Internet of Things |
| MGEU | Maximum Green Energy Utilization |
| MEC | Multi-access Edge Computing |
| PV | PhotoVoltaic |
| RE | Renewable Energy |
| RES | Renewable Energy Sources |
| SDGs | Sustainable Development Goals |
| VNI | Visual Networking Index |
Table 2.
Current Status and Future Targets of Network Operators related to Renewable Energy Utilization and Carbon Emissions.
Table 2.
Current Status and Future Targets of Network Operators related to Renewable Energy Utilization and Carbon Emissions.
| Network Operator | Current Status | Future Targets | Target Year | Baseline Year | ||
|---|---|---|---|---|---|---|
| Renewable Energy Utilization (%) | Reduction in Emissions (%) | Renewable Energy Utilization (%) | Reduction in Emissions (%) | |||
| Deutsche [9] | 52% | 2% | 100% | 90% | 2021 1, 2030 2 | 2017 |
| Telefonica [10] | 81% | 18% | 100% | 70% 3 | 2030 | 2015 |
| Telstra [11] | Negligible | 40% 4 | NOT Stated | 50% | 2030 | 2017 |
| T-Mobile [12] | 100% | 9% | Already 100% | NOT Stated | N/A | N/A |
| Verizon [13] | N/A | 28% 5 | 50% | 50% | 2025 | 2016 |
| Virgin Media [14] | 100% | 22% | Already 100% | NOT Stated | 2020 | 2014 |
| Vodafone [15] | 15% | 3% | 100% | 50% | 2025 | 2017 |
1 Targeting 100% renewable energy by 2021; 2 Targeting 90% reduction in emissions by 2030; 3 Targeting carbon-neutral environment by 2050; 4 Quantity shows the reduction in emission intensity (tons/petabyte) not in emissions; 5 Same as Telstra, quantity shows the reduction in emission intensity (tons/petabyte) not in emissions.
Table 3.
Energy Consumption (EC) of Network Operators.
| Network Operators | |||
|---|---|---|---|
| Energy Consumption (GWh) | |||
| Year | Vodafone [15] | Telefonica [10] | Telstra [11] |
| 2007 | 2690 | 4196 | 1625 |
| 2008 | 2996 | 4280 | 1685 |
| 2009 | 3044 | 4528 | 1630 |
| 2010 | 3278 | 5107 | 1695 |
| 2011 | 4117 | 5229 | 1653 |
| 2012 | 4454 | 5211 | 1692 |
| 2013 | 4723 | 6562 | 1663 |
| 2014 | 5222 | 6385 | 1656 |
| 2015 | 5735 | 7031 | 1669 |
| 2016 | 6077 | 6866 | 1635 |
| 2017 | 5561 | 6901 | 1617 |
| 2018 | 5569 | 6991 | 1594 |
| 2019 | 5582 | 6958 | 1635 |
Table 4.
Estimated Reduction in Carbon Footprints of International Telecom Operators.
| Reduction in Carbon Footprints | |||||
|---|---|---|---|---|---|
| Vodafone | Telstra | Telefonica | |||
| 2014–2019 (%) | 2020–2025 (%) | 2014–2019 (%) | 2020–2025 (%) | 2014–2019 (%) | 2020–2025 (%) |
| 22 | −31 | 12 | −04 | 46 | 9 |
Table 5.
Percentage Error in Carbon Emissions (CE) Estimations.
| Operator | Percentage Error in CE Estimations (%) |
|---|---|
| Vodafone | 7–9 |
| Telstra | 2–4 |
| Telefonica | 3–5 |
Table 6.
Validation of Results through Confidence Interval Calculation.
| Confidence Interval in CE Estimations (%) | |
|---|---|
| Operator | Mean ± Confidence Interval |
| Vodafone | 2.32 ± 0.009128 |
| Telstra | 1.50 ± 0.010806 |
| Telefonica | 0.34 ± 024 |
Publisher’s Note: MDPI stays neutral with regard to jurisdictional claims in published maps and institutional affiliations. |
© 2021 by the authors. Licensee MDPI, Basel, Switzerland. This article is an open access article distributed under the terms and conditions of the Creative Commons Attribution (CC BY) license (http://creativecommons.org/licenses/by/4.0/).
Share and Cite
MDPI and ACS Style
Syed, S.; Arfeen, A.; Uddin, R.; Haider, U. An Analysis of Renewable Energy Usage by Mobile Data Network Operators. Sustainability 2021, 13, 1886. https://0-doi-org.brum.beds.ac.uk/10.3390/su13041886
AMA Style
Syed S, Arfeen A, Uddin R, Haider U. An Analysis of Renewable Energy Usage by Mobile Data Network Operators. Sustainability. 2021; 13(4):1886. https://0-doi-org.brum.beds.ac.uk/10.3390/su13041886
Chicago/Turabian StyleSyed, Sheraz, Asad Arfeen, Riaz Uddin, and Umaima Haider. 2021. "An Analysis of Renewable Energy Usage by Mobile Data Network Operators" Sustainability 13, no. 4: 1886. https://0-doi-org.brum.beds.ac.uk/10.3390/su13041886
Note that from the first issue of 2016, this journal uses article numbers instead of page numbers. See further details here.