
Silk Road Heritage Branding and Polycentric Tourism Development


1
School of Economics, Aristotle University of Thessaloniki, 54124 Thessaloniki, Greece
2
School of Civil Engineering, Aristotle University of Thessaloniki, 54124 Thessaloniki, Greece
*
Author to whom correspondence should be addressed.
Sustainability 2021, 13(4), 1893; https://0-doi-org.brum.beds.ac.uk/10.3390/su13041893
Submission received: 31 December 2020
/
Revised: 1 February 2021
/
Accepted: 4 February 2021
/
Published: 9 February 2021
(This article belongs to the Special Issue City Marketing and Planning for Sustainable Development)
Abstract
:Cultural heritage, considered as a tool for sustainable tourism development and place branding, makes a destination appealing to visitors; hence, cultural heritage tourism can be a driving force for economic growth in cities and regions. Polycentricity is a useful multi-scalar concept in spatial theory that describes how adjacent urban centers can interact with each other, creating synergies and generating broader spatial networks. Cultural heritage and tourism, perceived as important factors of integration in a polycentric spatial structure, can further promote regional branding strategies. In this paper, a polycentricity index is introduced as a methodological tool for networking cultural heritage destinations, with an application to the Silk Road heritage. Silk Road cultural assets traced on the historical Silk Road routes linking East and West, can serve as tourist attraction poles and as an essential component for branding destinations through networking at various spatial scales. The Region of Eastern Macedonia and Thrace in Northern Greece, endowed with a plethora of Silk Road cultural assets, most of which are still untapped, is used to highlight the proposed methodology. The ultimate objective is the designation of polycentric destination networks based on Silk Road assets, in order to build regional branding opportunities over the Region.
1. Introduction
Cultural heritage—defined as the “legacy of physical artefacts and intangible attributes of a group or society that are inherited from past generations, maintained in the present and bestowed for the benefit of future generations” [1]—can be considered not only a legacy to be passed to posterity, but also a vital resource for activating local and global development processes [2]. Heritage, as part of the international sustainability agenda, is recognised as an integral resource of the local ecosystem [3], with a significant role in defining the distinctiveness of cities and regions and improving their competitiveness. The beneficial effects of cultural heritage on local communities include, among others, boosting local economies and contributing to job creation, helping build social capital, local identity and social cohesion, improving the quality of life of inhabitants and preserving the environment, enhancing the uniqueness of places and raising their attractiveness, thus providing narratives for cultural tourism [4].
Cultural assets are important for tourism development, as “history, culture and religion are elements that attract tourism” [5,6,7]. Cultural heritage tourism, due to its wide reach and international appeal, has grown to become a significant phenomenon in the travel and tourism industry and one of the most competitive segments of global tourism, facilitating cultural exchange and fostering local development. Worldwide, an increasing number of cities and regions rely, for their tourism development strategies, on the promotion of tangible and intangible cultural heritage, often used as place branding tools.
A brand is commonly known as, or is a combination of, a name, word, sign, symbol or design, intended to identify the products and services of one seller or group of sellers and to differentiate them from those of competitors [8]. Place branding can be viewed as a way of gaining competitive advantage through the development of the place image and reputation in order to attract investments and tourism [9], while also enhancing community development and local identity. The latter could set local social forces into motion to promote development activities and help cities and regions stand out among others [10,11].
Ashworth and Voogd [12] indicate that theoretical advances within the marketing discipline that paved the way for an understanding of marketing implications for urban planning and management, have encouraged place marketing and branding [13]. Place branding is now widely recognised as a powerful tool for local and regional development strategies, increasingly used by local governments to improve the image of the place, expand the local appeal and create a strong local identity [14,15].
Place branding is one of the topics on which cities and regions can collaborate developing synergies, also based on polycentric networking. Polycentricity indicates the connection of neighboring centres that have common characteristics and their integration in broader spatial networks. In the growing body of academic literature on spatial analysis, it is widely acknowledged that spatial structures are becoming increasingly polycentric [16,17,18]. Meijers [19] points out that polycentric urban regions may be characterised as club networks when cities having similar characteristics and common interests, or performing similar economic roles, i.e., port, industrial or tourist cities, join forces to achieve some kind of a common objective, on the basis that co-operation generates economies of scale. In this aspect, interactions within networks expressed through synergies among places that form stable relationships [20] are linked to the marketing and branding theory for networks. Consequently, place branding and polycentric networking seem to have clear ties, although academic research on the relationship between them tends to be still quite limited.
The term “polycentricity” officially appeared in the late 1990s as a fundamental concept of the European Spatial Development Perspective (ESDP), and gained widespread recognition in planning and territorial development strategies, though it remains a rather fuzzy concept with different meanings on different spatial scales [16,20,21,22,23,24]. In a narrow, literal sense, the term polycentricity refers to a spatial unit that consists of more than one centre [25,26,27]. On a regional scale, polycentricity is a concept that encourages regions and cities working with neighboring territories [28,29,30], to explore common characteristics and strengths and reveal potential complementarities [31,32,33]. In urban and regional planning, such polycentric, networked cities or regions are often seen as a strategy, a normative potential to support and maintain a high degree of agglomeration advantages without having to bear too much of the costs of overcrowding [27,34,35].
Polycentricity is expressed through two dimensions, the morphological dimension, referring to the size and distribution of cities in the networks, and the functional dimension, focusing on their interrelationships [26,36,37] and the spatial distribution of inter-dependencies between the urban centres [27], which may include “multidirectional flows”, such as economic, cultural interactions [38,39], as well as travel, social visits and leisure trips [40,41]. Focusing on morphological polycentricity on the regional scale, a region is considered polycentric if it has more than one concentration and if all concentrations are of roughly equal size and relevance. Furthermore, on the regional scale, the morphological dimension focuses on the characteristics of the nodes, mainly addressing the rank-size classification of the urban centres in the network, the territorial distribution or location of the urban centres within the network, and their connectivity [36,42,43]. Parr [17], referring to morphological polycentricity, points out the importance of the spatial and size distribution of cities in the region, while Batty [44], indicates that a city’s total centrality, for example in terms of population size, is a good proxy for more conventional attribute measurements of general urban stature.
In polycentric regions, distinct cities of similar size, none of which is dominant, may interact with each other in terms of cooperation in order to attract tourists, businesses and qualified workforce [17,45], for example through joint branding strategies. In this aspect, city branding strategies do not solely affect one city, but the entire region [45], and consequently, branding processes and their effects expand on the regional scale. The polycentric network analysis at the regional level could therefore be considered as a tool for policymakers and researchers in elaborating and implementing place branding strategies based on the cities’ identity [46]. A decisive factor in the process and implementation of place branding plans is local cultural heritage [13,47,48]. Local heritage assets can be described as an array of nodes on a network that appear near cultural facilities, providing spaces for cultural interaction, and may focus on a certain theme [49], considered to be an essential integration element within the urban spatial network.
This research explores the issue of networking cities on the basis of polycentricity, focusing on the Silk Road cultural heritage as a tool to build branding synergies for sustainable tourism development. Silk Road cultural heritage, identified over a large variety of regions and countries, can be used as an international branding and marketing tool for cultural tourism development in a wide range of destinations to further broaden local tourism strategies [50,51].
The historic Silk Road, the first global trade route in history linking East and West, had a scope and importance far greater than the simple exchange of goods, serving also as a vehicle for the exchange of arts, religion, cultures, ideas and technology. Dating back to 200 BC, Silk Road was in fact a vast network of routes, crossing numerous settlements with rich history and heritage. The term “Seidenstraße”, “Silk Road” was introduced in 1877 by the German geographer Ferdinand von Richthofen to describe the ancient network of routes spanning through Central Asia and linking the Mediterranean region with East Asia. Many cities were built along the Silk Routes, originally founded as small transportation gateways, then gradually turned into major trade and exchange centers [52]. In the present day, building upon a natural and cultural wealth over thousands of years, while also being one of the most seductive geocultural imaginaries of the modern era [53], the revival of the Silk Road legacy can create significant opportunities for cultural heritage tourism development used as a unique branding tool for tourism destinations and products.
Many initiatives and projects were launched on the “revival” of the Silk Road, acknowledging the interest on the Silk Road branding opportunities for tourism development (e.g., UNWTO/UNESCO Silk Road Heritage Corridors Tourism Strategy Project [54], UNWTO/EC Western Silk Road Initiative [50,55]). More specifically, tourism development focused on the Western Silk Road is considered to have significant potential for enriching and differentiating the tourism offer of Greece, as well as for providing opportunities for sustainable development in less developed regions. Therefore, the implementation of a Silk Road brand that can improve Greece’s position as part of the route and serve as a quality distinction between travellers, is considered a highly positive asset [56].
This paper aims to identify new opportunities for tourism destinations and develop a novel Silk Road brand name over the study area. The paper focuses on the polycentric regional networking potential in the Region of Eastern Macedonia and Thrace in Northern Greece, based on the Silk Road cultural heritage footprint. It is expected that the use of the Silk Road brand would bring considerable promotional value to the areas concerned, favoring the dispersal of tourists and the diversification of the thematic tourism bid. The study examines the existing footprint of the Silk Road legacy over the Region of Eastern Macedonia and Thrace in Northern Greece, to reveal untapped Silk Road heritage and “hidden” cultural assets related to the Silk Road culture, and develop a methodological framework for the polycentric organisation of destinations’ branding. For this goal, a new methodological tool is introduced, the Silk Road heritage Polycentricity Index, in order to better promote regional branding opportunities.
It is anticipated that this research will contribute to the field of polycentric development of cultural heritage destinations and, more specifically, to the Silk Road cultural heritage, still a rather untapped field. The networking of classified Silk Road assets can act as a useful tool for local authorities and stakeholders involved in tourism and cultural sectors. In addition, the index introduced and applied in the study area would highlight networking opportunities and potential synergies in cultural tourism over the study area. The proposed index is constructed to be applicable to various cultural tourism assets, while also at various spatial levels.
2. Materials and Methods
2.1. Methodological Framework
The key scientific proposal of this research is the polycentric analysis, not in spatial terms as found in the vast literature, but in cultural heritage terms, with an emphasis on Silk Road heritage. The research focuses on the morphological polycentricity, to investigate to what extent the urban agglomerations within a region can be organised in networks based on the Silk Road heritage, as a branding tool. For the estimation of morphological polycentricity, indexes related to the size and importance of centres based on demographic data are often used [57]. There are standard methods for assessing the morphological polycentricity of spatial systems based on Zipf’s rank-size rule, including the primacy rate [58].
The attempt to investigate morphological polycentricity departs from ESPON projects’ [34,59] methodological approach, as well as other studies including Meijers [22], Sandberg and Meijers [60], Brezzi and Veneri [26], Burgalassi [61], Gabaix and Ioannidis [62], etc. The morphological polycentricity aspect is based on the fundamental principle that polycentric regions include groups of urban centres relatively equal in terms of their importance [63,64]. According to academic literature, urban or regional polycentricity has most frequently been generated empirically by specific methods, one of which is the regression line of the “importance” of the various cities in a region on a rank-size distribution [65].
The “rank-size” rule was originally presented by Auerbach in 1913, who indicated that when the cities of modern industrial nations are ranked according to their population, their distribution is such that the largest city is twice the population of the second-ranked city, three times the population of the third-ranked city, etc. [66]. Rank-size rule (Equation (1)), was widely used in the 1960s in urban geography to rank cities according to their size in a region or country [67]:
where is the population of the city i, is its rank in size, and k is the population of the largest city in the region or country [67,68]. Size is considered as the most straightforward prerequisite of polycentricity, reflecting an even distribution of large and small cities [69]. Based on this rule of urban hierarchy (Equation (2)), the population of any city is equal to the population of the largest city, divided by the rank of the city within the urban hierarchy [61,62]:
Ranking the sizes of the area’s agglomerations: , the distribution is (Equation (3)):
where R is the rank of a given city by its size; S is the population; β is the slope of the regression line. Thus, it is preferred to convert rank and size into logarithms as a more precise method of identifying their relationship [70]. Urban centres are ranked by their population and the equation is calculated by taking logarithms of the last equation (Equation (4)):
where β is by construction negative and, the higher it is, the more polycentric is the region [61].
Another method, also applicable in polycentricity analysis, is to calculate the primacy rate, used in ESPON project (2007). In its nature, measuring “primacy” parallels with the basic notion that polycentricity is about the absence of a primate city [71]. The territorial spread of cities of different sizes throughout a region can be considered as the ratio of a city’s population over the total population of the region or country, as presented in Equation (5). The higher the primacy rate, the more monocentric the region, thus the primacy rate is also used as a basic and widely applied index to measure polycentricity:
The above methodological approach is used in this paper to rank cities according to their “size” in terms of Silk Road cultural footprint, where size is the quantum of Silk Road assets in each city, and can be calculated given that the city’s rank r and the size of the largest city k are known. Furthermore, the primacy rate could also be used supplementarily as the ratio of the number of Silk Road assets in a city, over the total number of Silk Road assets identified in a region. The morphological perspective is used to assess if the area is characterised by a balanced distribution of urban agglomerations with a Silk Road footprint, where greater balance is equal to higher levels of polycentricity.
In this paper, a new approach of morphological polycentricity analysis is introduced in terms of Silk Road cultural assets, on the basis that regions may often include not only urban agglomerations, but also rural, mountainous or distant settlements, with significant Silk Road footprint that tourists would be interested in visiting. Based on the polycentricity theory, within a polycentric network a city could extend its hinterland territory beyond its administrative boundaries, due to the relationships created with neighboring settlements. Within this framework, and for better branding opportunities, it is proposed to consider for each city a zone of extent or buffer zone as a wider area of the city’s interaction, often labelled as “city region” [29,30,31]. In the ESPON [59] methodology, “city” limits are not defined by administrative boundaries, but include all municipalities that form a contiguous built-up area, defined as Morphological Urban Areas (MUAs) [71]. In this paper, the potential MUAs are the buffer zones of cities that include both neighboring urban and rural settlements. Therefore, for each city, an area of potential interaction at a certain distance from the city centre is to be designated. The aim of establishing buffer zones is to incorporate as many settlements into the Silk Road tourism networks to be built. Consequently, a suggested delimitation is that the Silk Road assets’ concentrations in rural areas are to be incorporated in the nearest city (buffer zone).
The methodology is also based on Meijers’ [22] approach of the rank-size distribution, and more precisely on the regression line, considered as a representative indicator of mono/polycentricity. The polycentricity methodological approach for measuring the Silk Road footprint is adapted in terms of asset density per zone. In this sense, for example, a centre ranked third in the network hierarchy in terms of population size is of spatial importance in that zone, whereas, in terms of Silk Road assets, a smaller centre may be more important, and thus become a major node in the Silk Road tourism networks to be designated.
For the construction of the proposed Silk Road heritage Polycentricity Index (SiRoPI), the analysis follows the morphological polycentricity rank indicator (in terms of population), as a mono/polycentricity index, modified to consider the Silk Road assets spatial concentration (absolute number of Silk Road assets per zone). Within this context, the more Silk Road assets are equally present throughout the region, the more polycentric is the region in terms of Silk Road legacy. The size distribution of the Silk Road assets within the buffer zones should therefore be considered to be the most important indicator for resolving whether the region tends toward polycentricity or monocentricity, the morphological factor being the rank-size distribution, thus providing information on the hierarchy of the Silk Road nodes.
2.2. Study Area: The Region of Eastern Macedonia and Thrace, Greece
The study area selected to highlight the proposed methodology is the Region of Eastern Macedonia and Thrace, one out of the thirteen administrative regions (NUTS II) of Greece. This peripheral region, located on the northeastern border of Greece, is the EU’s external border, an area of strategic significance between the east and the west. Eastern Macedonia and Thrace’s geographical location, substantial transport infrastructure (two national and international ports and airports, Egnatia Motorway) and the fact that the Region’s northern boundaries are a commercial gateway for the Balkan market, are considered competitive advantages for the Region to be a services hub for Eastern European countries and a strategic crossroad between Europe and Asia.
The Region covers 14,158 km2 (10.7% of the total national surface area), while the permanent population is 608,182 (5.6% of Greece’s total population), based on the 2011 General Population Census [72]. The Region consists of five regional units (NUTS III), organised in 22 municipalities (LAU I), including five medium-sized urban centres seats of the regional units, namely, Alexandroupoli (57,812 inhabitants), Komotini (50,990), Xanthi (56,122), Kavala (54,027) and Drama (44,823), and smaller urban centres and rural settlements of less than 2000 inhabitants. The Region also includes two islands, Thassos and Samothrace with 13,770 and 2859 inhabitants, respectively, based on the 2011 Population Census.
In 2018, the Region accounted for 3.9% of the national GDP, ranking in the eighth place out of the 13 Greek Regions, and with GDP per capita in Purchasing Power Standards (PPS) of 14,600, ranked in the last place nationwide [73]. The Region’s economy is mainly based on agriculture and livestock farming, also including construction and industry, trade, transport, education and public administration. In the secondary sector, manufacturing is dominated by medium to low technology sectors, (i.e., food industry, textiles and clothing, tobacco products), while the services sector is mainly directed at trade, tourism and catering for regional needs [73]. The contribution of tourism in regional GDP was 6% in 2018, while revenue from tourism was 2% of total national revenue (443 mil. euros), very low compared to other regions (i.e., Crete, Aegean and Ionian islands) [74]. For the period 2018–2019, the Region had the highest increase nationwide in overnight stays from foreign countries, mainly from Bulgaria, Turkey and Romania [75]. During the same period, however, the Region recorded the lowest expenditure per visit compared to other regions, as well as the highest reduction, with the expenditure per visit being reduced from 167€ to 115€ [75]. Strong intra-regional disparities exist in tourism development, with the key destinations being the islands of Thassos and Samothrace and the port cities of Kavala and Alexandroupoli, while sea and sun summer holidays is the dominant form of tourism. However, the rich natural environment, the unique local traditional products and the rich (multi) cultural heritage give significant opportunities for sustainable tourism development.
The methodological steps of the research included the elaboration of the data and information collected in order to formulate a regional inventory of the Silk Road cultural heritage in the Region. Extensive secondary research (studies, books, published articles, official data sources, reports and statistical information, records given by regional and municipal administrations and local cultural associations, promotional material relating to local cultural heritage, historical documents and other relevant information obtained through extensive online research) was the basis for the identification and classification of the local Silk Road cultural assets [50,76,77]. In addition, primary field research was performed on selected locations endowed with Silk Road cultural footprint.
3. Results
3.1. Registration and Classification of Silk Road Assets in the Study Area
The secondary and primary research results revealed that the Region has rich tangible and intangible Silk Road assets, most of them still untapped. A total of 49 urban and rural settlements with Silk Road assets are identified in the Region and included in the proposed buffer zones, with 15 urban centres with population more than 2000 inhabitants as the major vertices. The tangible Silk Road cultural footprint within the study area includes unique typological built heritage assets, i.e., the cocoon houses which are distinctive domestic silk production sites; khans and caravanserais, places where traders and caravans rested; archaeological sites; settlements; museums; industrial heritage connected to silk, fabrics or other products; tobacco warehouses; traditional markets, “bazaars”, etc. Furthermore, sericulture was flourishing in the Region and the silk produced was of high quality.
The Silk Road assets’ inventory includes main characteristics of each tangible or intangible asset identified so far in the Region, based on cultural heritage classification frameworks provided by UNESCO, ICOMOS, UNWTO, etc. The various types of Silk Road assets identified in the Region are classified in the following categories and subcategories, which involve a clustering of themes as criteria:
- Built heritage: silk mills, textile factories, wineries, pottery factories, tobacco warehouses, waqfs buildings including mosques, hammams, imarets, caravanserai, inns/khans, fountains, bridges
- Traditional marketplaces of trading goods: traditional bazaars, trading goods’ places (mining, metal working, manufacturing and handicrafts, and other industrial and production sites)
- Military posts, garrison posts, fortresses, castles, towers, city walls
- Archaeological sites (including Monuments): Ancient Greek, Roman and Byzantine
- Museums: silk museums, folklore, archaeological, tobacco museums, other (i.e., ecclesiastical)
- Religious-Spiritual sites: monasteries, churches, spiritual locations
- Events and festivals
- Gastronomy: local products, recipes, local produce methods.
The majority of Silk Road assets identified in the Region are tangible: 138 (out of 187 in total), out of which 76 are included in the category Built Heritage. The second category is Archaeological Sites (28 assets), followed by the category Museums (25 assets), Gastronomy (25 assets), Military posts—garrisons—fortifications (22 assets), Religious-Spiritual Sites and Traditional markets—Places of trading goods (7 assets each) and Events and Festivals (4 assets). It should be noted that this is an ongoing research and, thus, the inventory is expected to be continuously enriched.
This classification not only categorises the local Silk Road assets, but is also a pioneer evaluation of the identified assets in terms of relation to the Silk Road essence. For example, in the first category, Built heritage, cultural assets with a “strong” relation to the Silk Road tradition are included, such as production and manufacturing sites of silk and other valuable tradeable goods, e.g., fabrics, tobacco, ceramics etc., transferred through the Silk Road routes. Of high relevance to the Silk Road are places of rest for the caravans and merchants travelling along the Silk Road routes (khans, caravanserais) or passages and traditional markets. This assessment attempt aims to integrate the most renowned Silk Road heritage assets, in order to highlight a broader and exclusive list of possible Silk Road branded destinations. To this end, this evaluation played an important role in setting the thresholds of the buffer zones, in order for the most important assets to be integrated into the Silk Road networks to be designed and the branding plans of the Region to be elaborated.
3.2. Spatial Distribution of Silk Road Assets in the Study Area
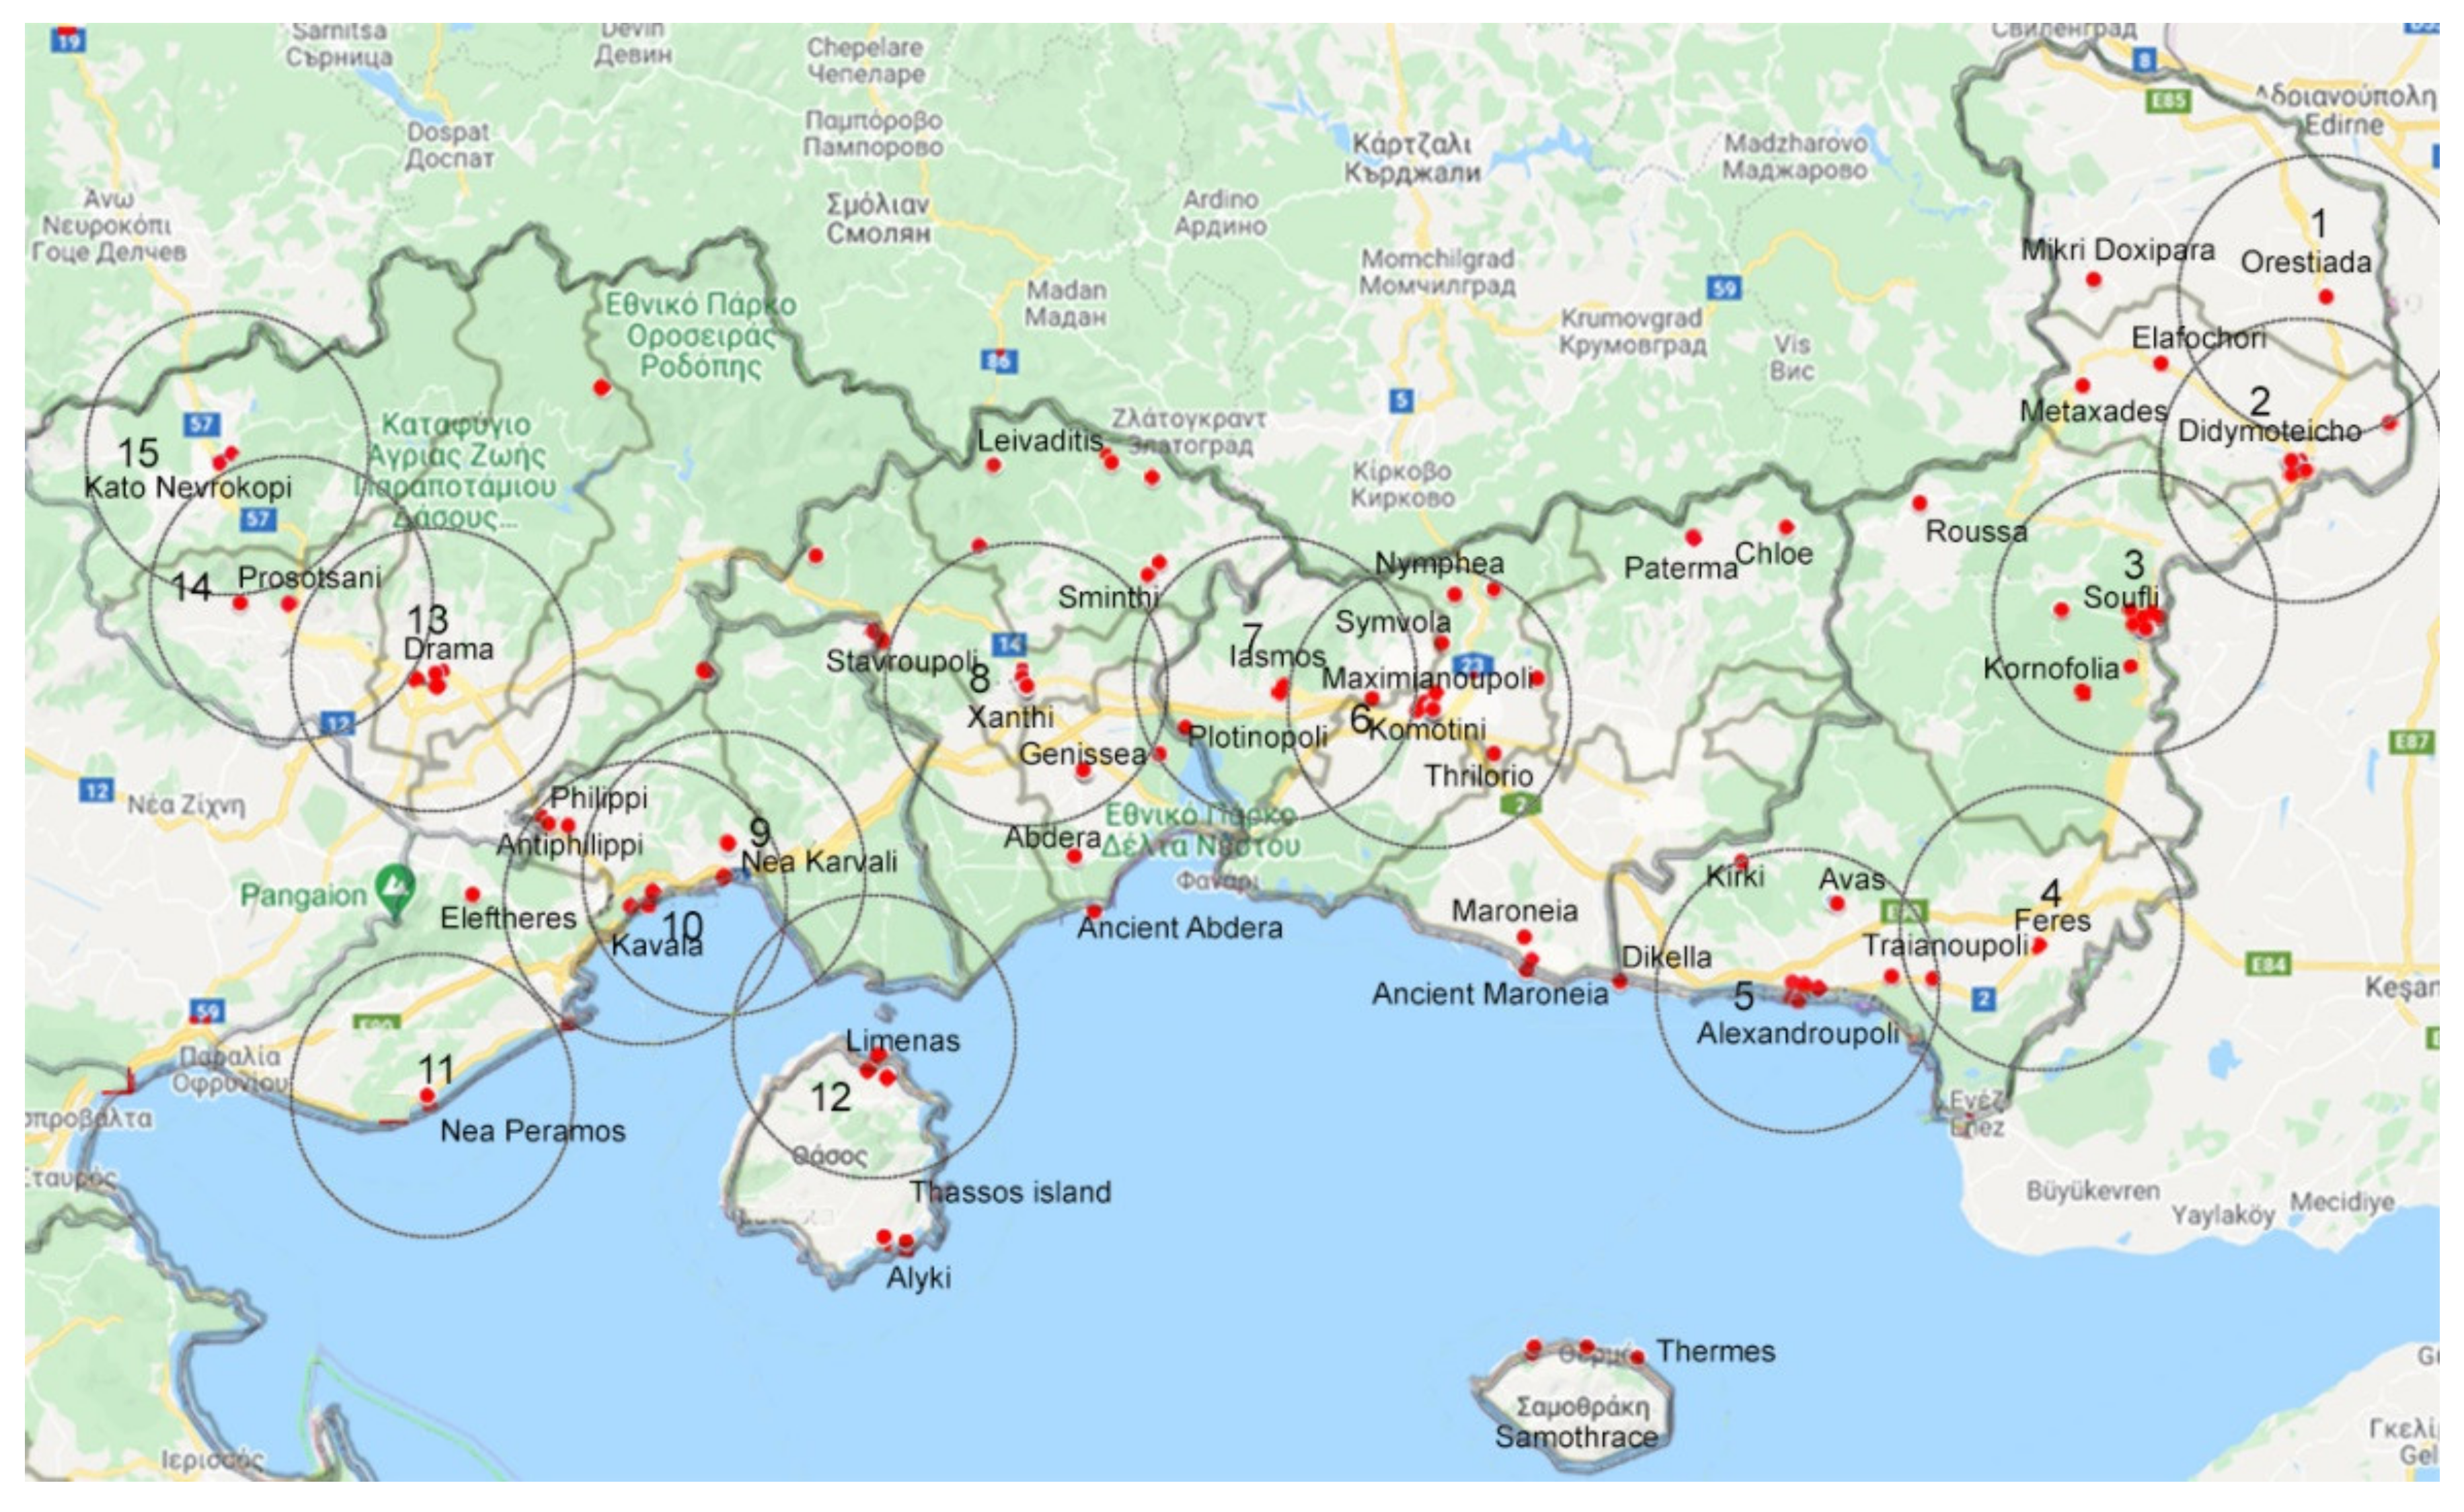
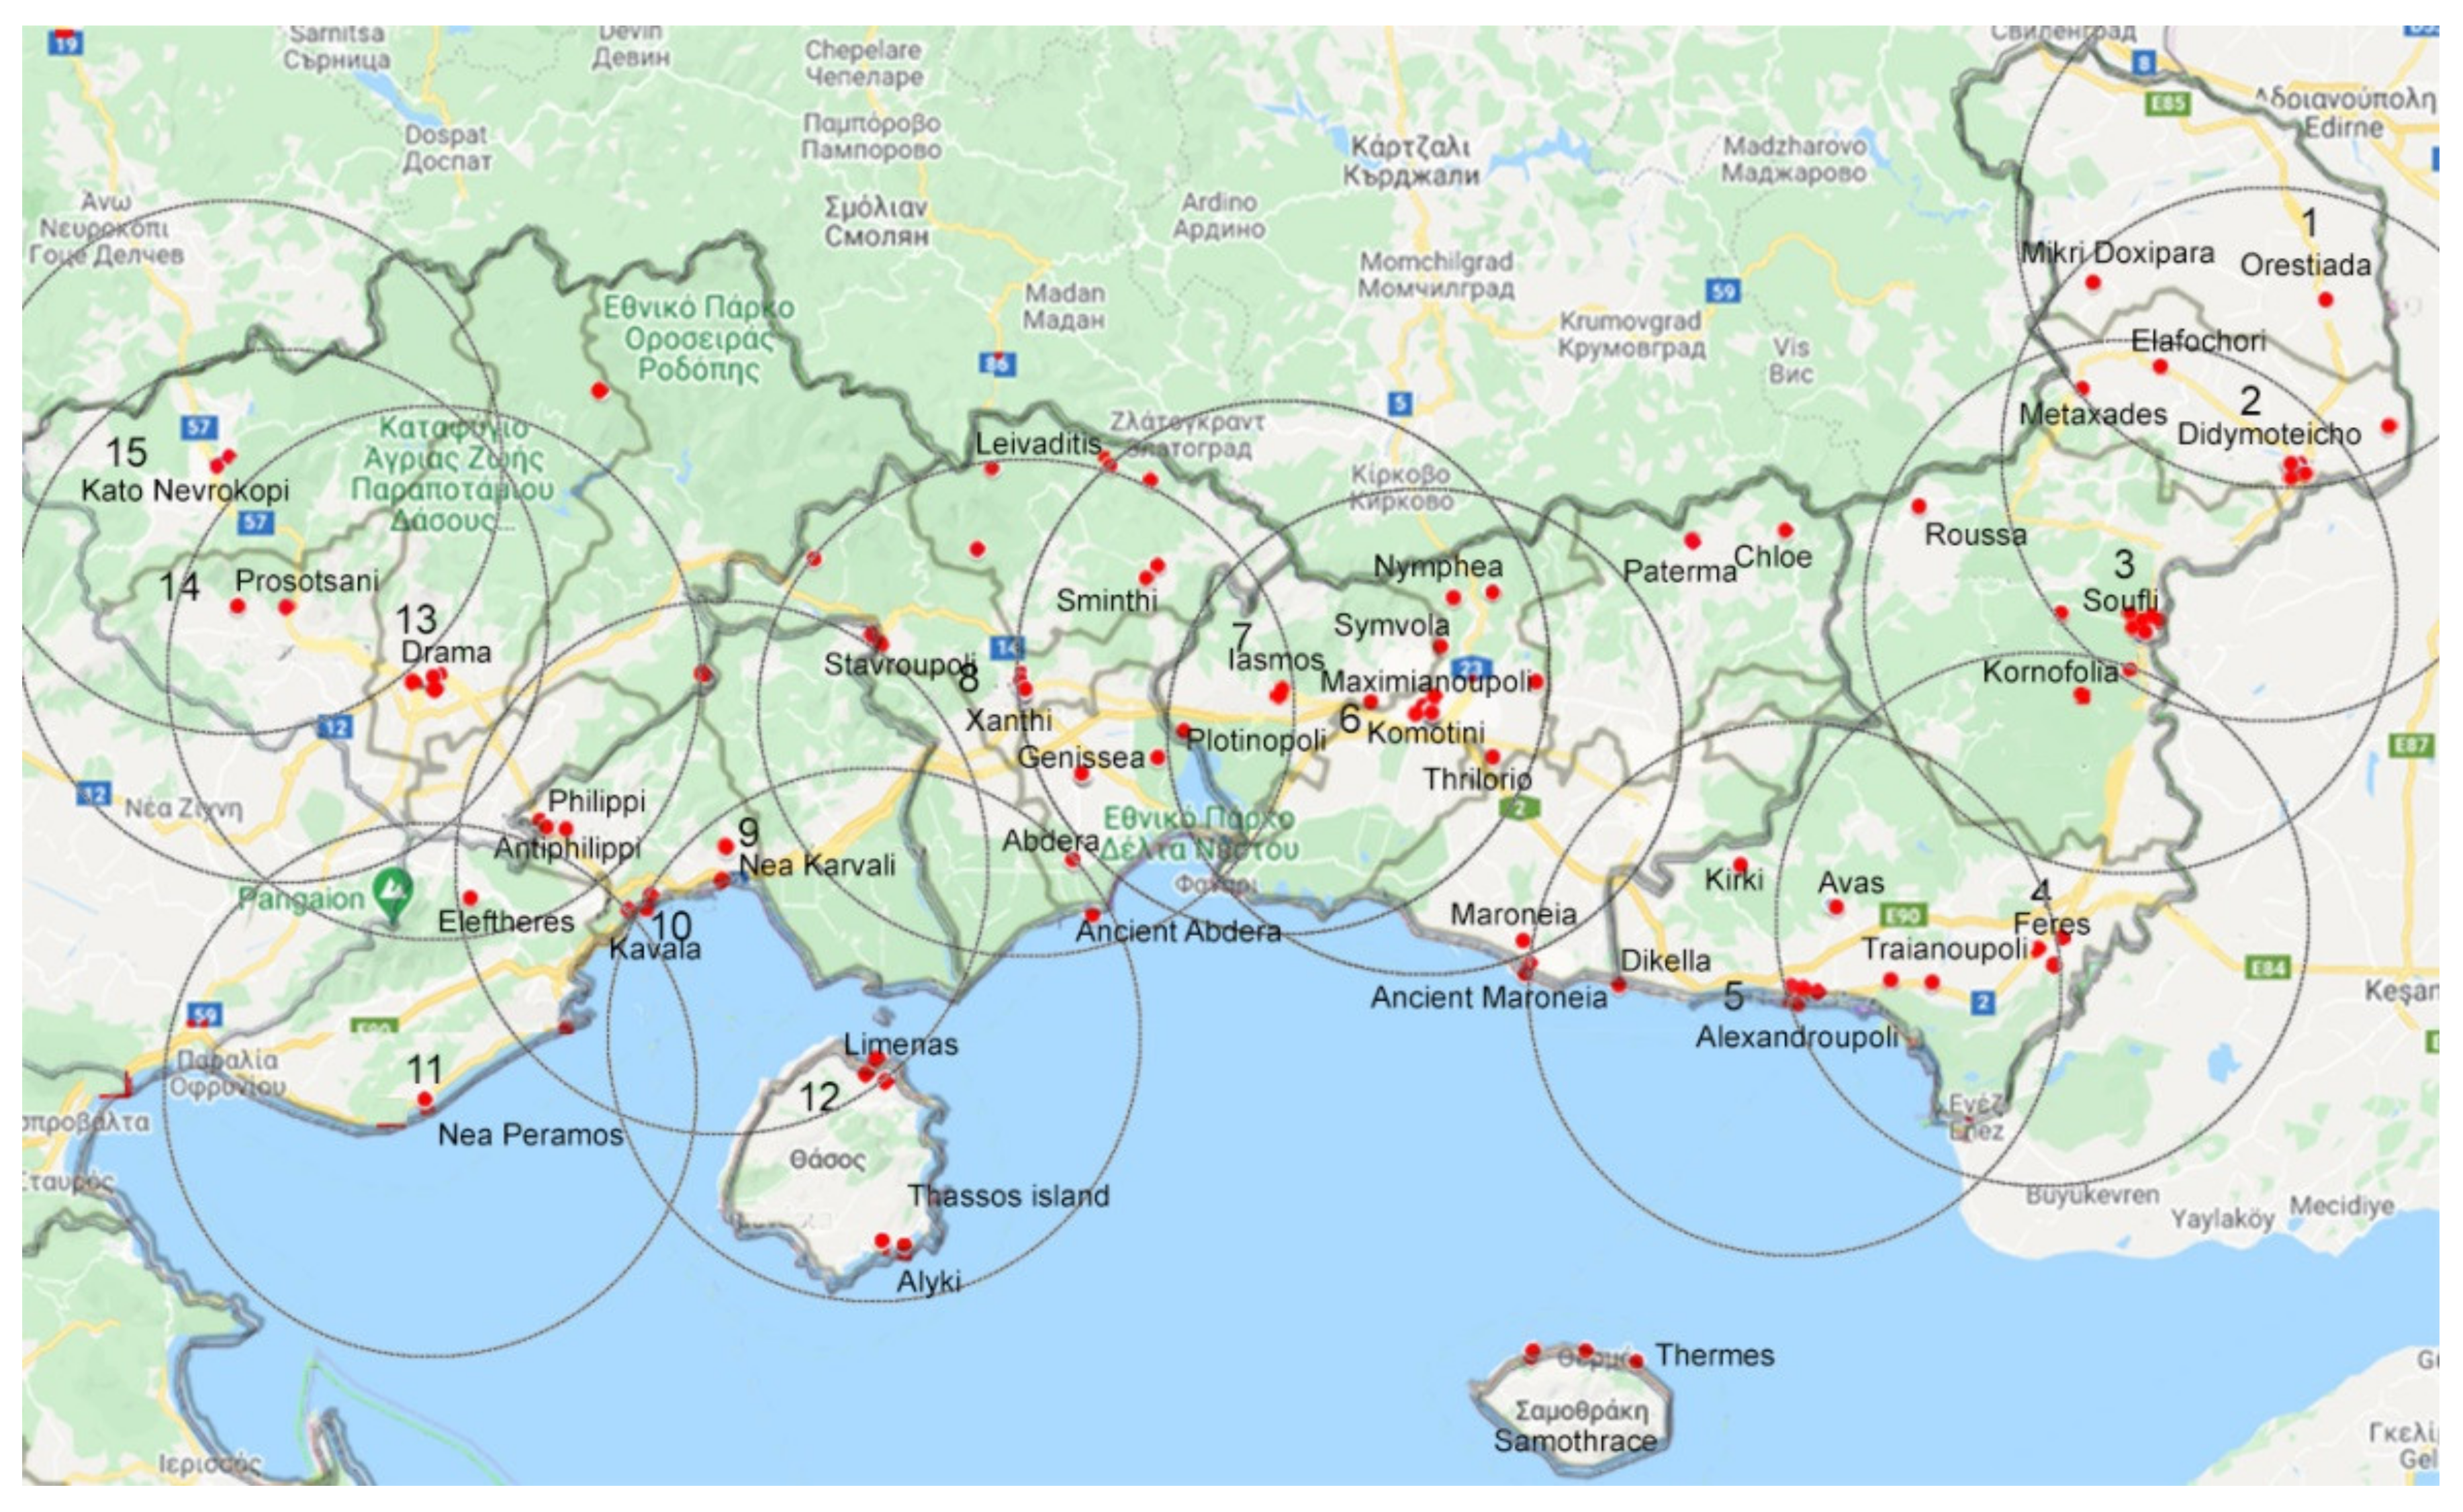
The methodology of buffer zoning to be elaborated in the study area is based on ESPON [34], and Egnatia Motorway Observatory [78] methodological approach of the 45 min isochrones or 50 km zones of influence, adjusted in the study area’s distances frame. Two scenarios are developed in order to investigate the application of the proposed index for Silk Road cultural tourism branding networking in the Region (Table 1). In the first scenario, a threshold of 15 km distance from the main city center is set as a buffer zone of potential short trips for tourism. These 15 km buffer zones are referred as primary zones, where the possibility to visit an asset within this radius is high. The networks developed within these zones are considered to be more cohesive and the nodes highly interconnected. The primary buffer zones include urban agglomerations and rural settlements with Silk Road assets identified in the Region (Figure 1). However, empirical research revealed that many Silk Road assets are located beyond the 15 km zones’ boundaries and, therefore, a more extended zoning category is introduced. A second scenario sets a radius of 30 km (Figure 2), which could be applicable, in order to include as many Silk Road settlements as possible. Assets included in overlapping zones are considered as well-connected nodes within the prospective Silk Road regional networks, while also of high importance for joint branding opportunities.
In the aspect of tourism development, the 15 km radius is considered to be suitable for developing short, half-day tourism excursions, branding the neighboring cities/villages as “Silk cup of coffee destinations”. The 30 km radius could be defined suitable for longer daily visits, branding the neighboring cities/villages as “Silk brunch destinations”. Connecting the nodes of neighboring buffer zones could prove to be suitable for longer Silk Road cultural routes (i.e., for 3–5 days travel) over the region, since there is a variety of accommodation facilities offered within the area (Table 2). It should also be noted that Samothrace in Evros Regional Unit is not included in the zoning, in terms of distance, transport accessibility and lack of urban centres, since there are only small rural settlements (with less than 2000 inhabitants) on the island.
As it can be observed, within the second scenario more Silk Road assets are included in the buffer zones, providing better regional branding opportunities. It should be noted that tangible cultural assets have a specific location, whereas intangible heritage is given the location of the asset, where provided, or in some cases (e.g., in the category gastronomy) where it is difficult to spot a specific geographical location, the wider area is recorded. For example, local products (i.e., nuts, wine, olives, etc.) cultivated in many rural areas are given the location of the closest settlement, and more specifically, the centre of the settlement. Additionally, an important Silk Road asset in the study area and over Northern Greece, is the historical Via Egnatia, registered in almost all the proposed zones due to the interregional character of this ancient road.
3.3. The Silk Road Heritage Polycentricity Index (SiRoPI)
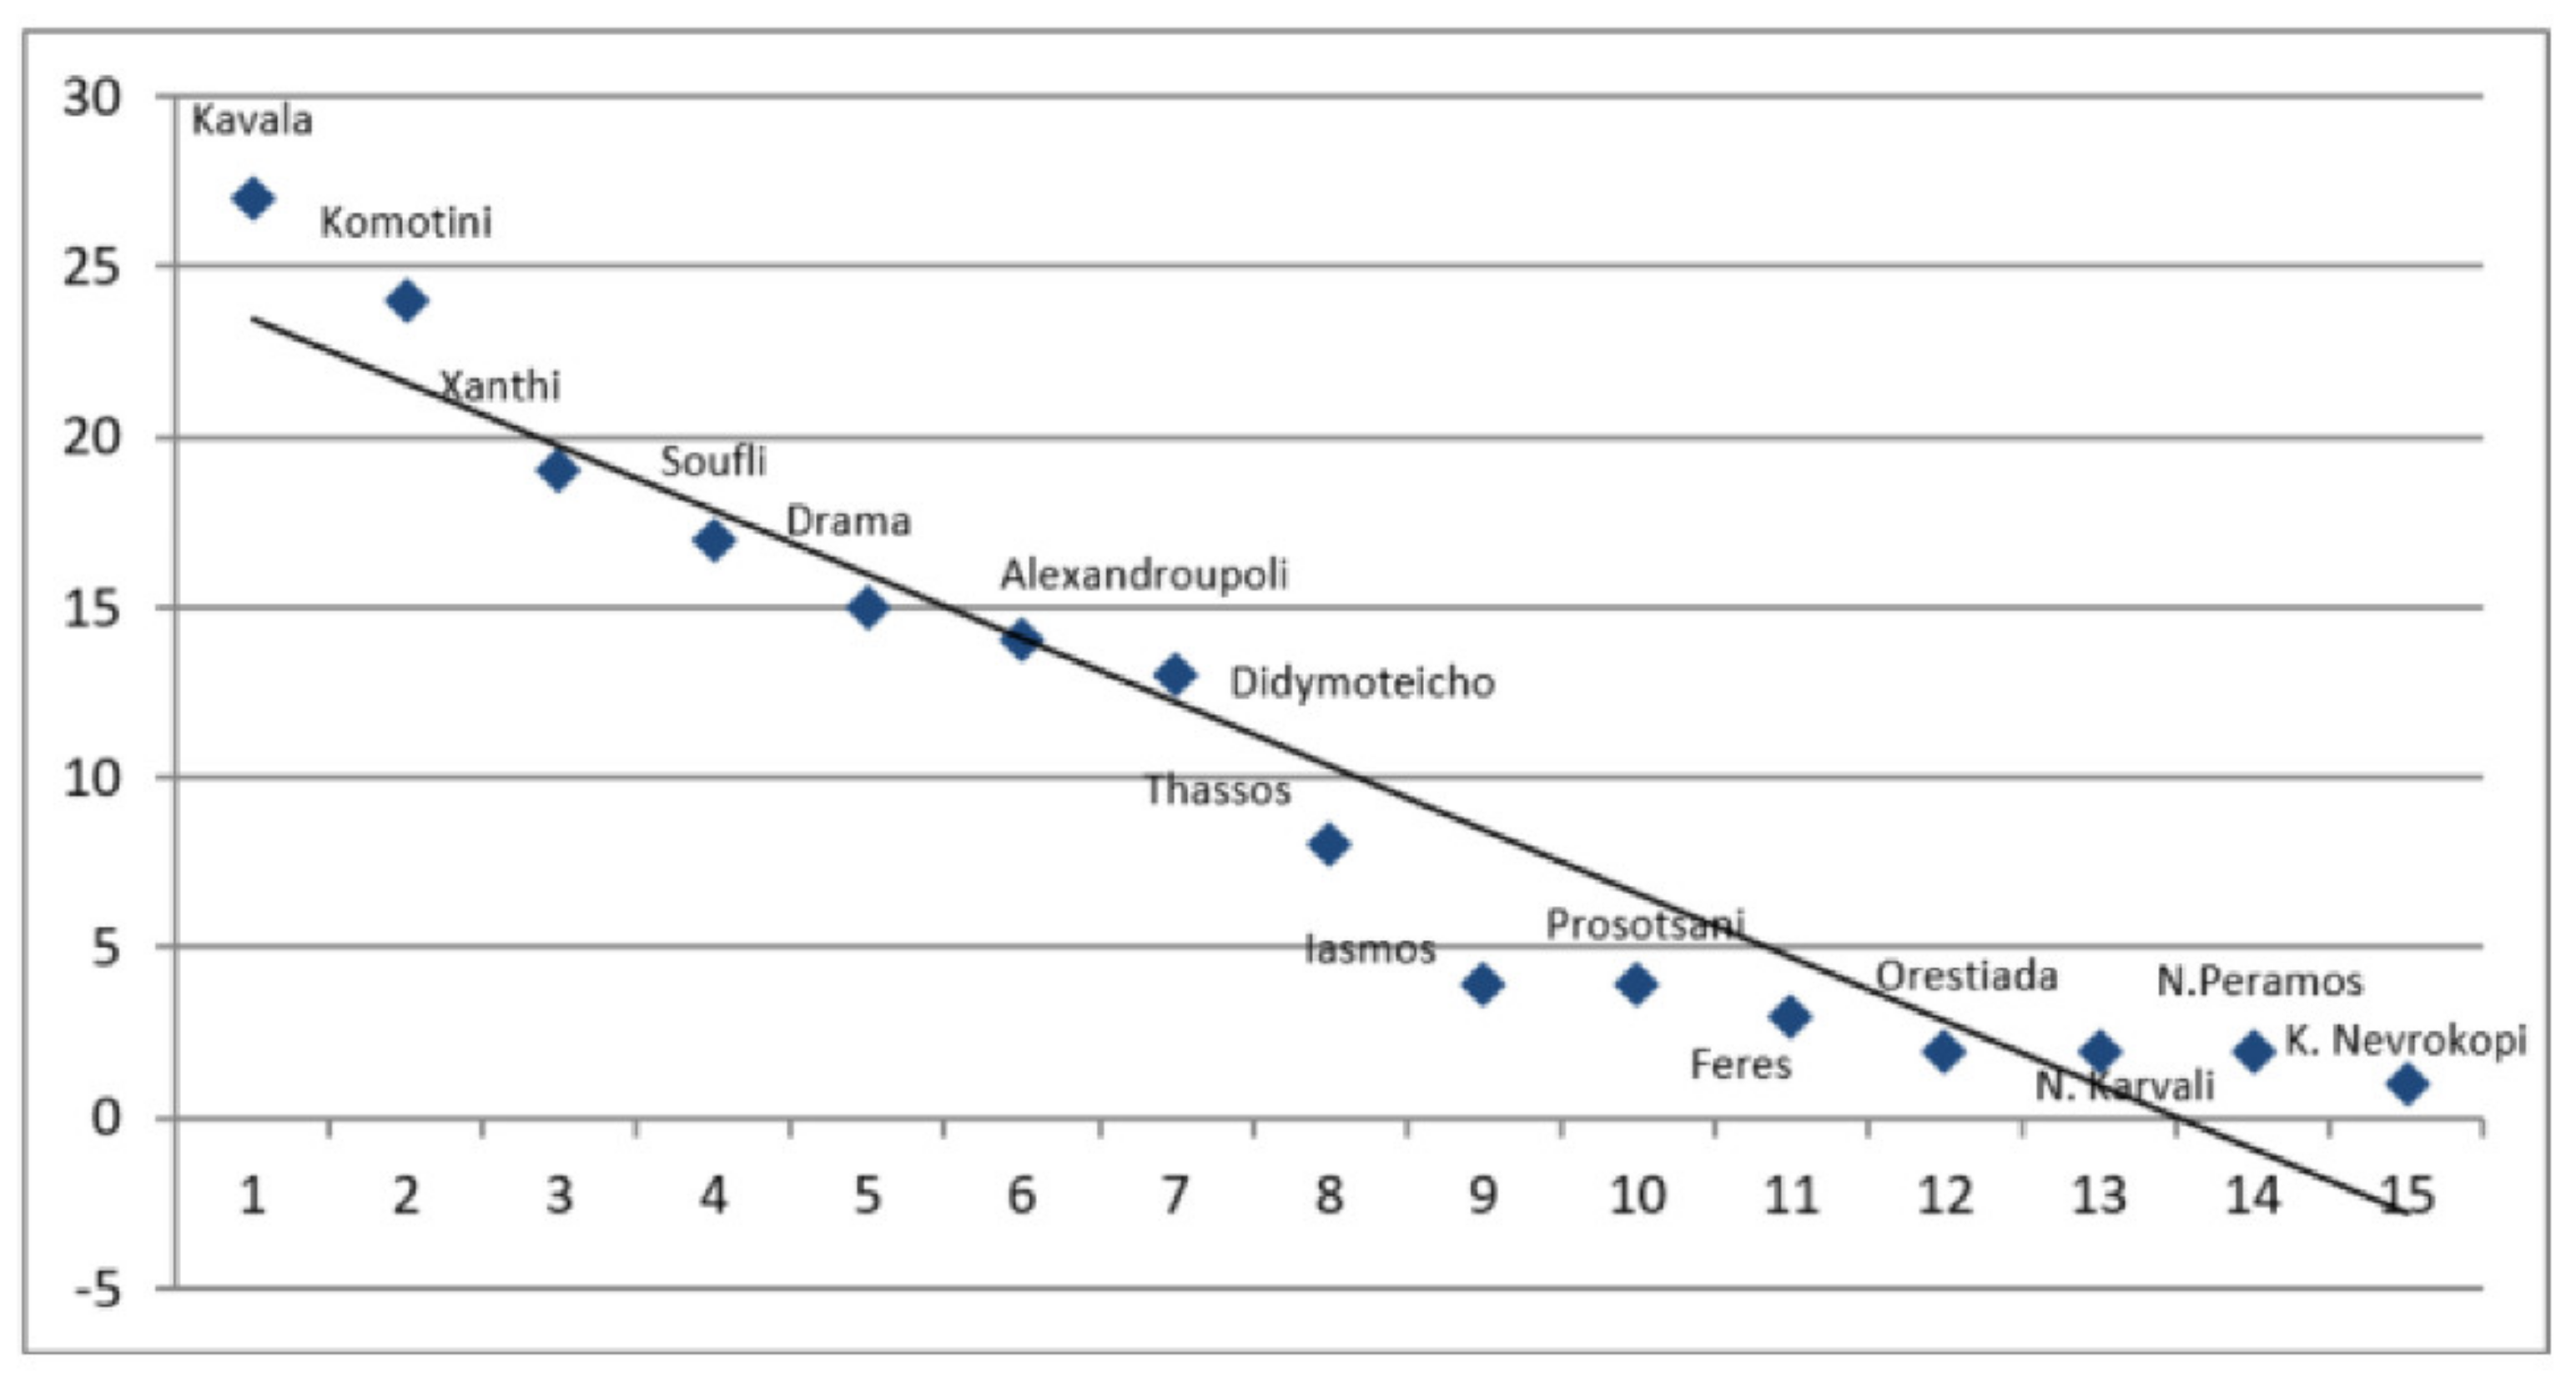
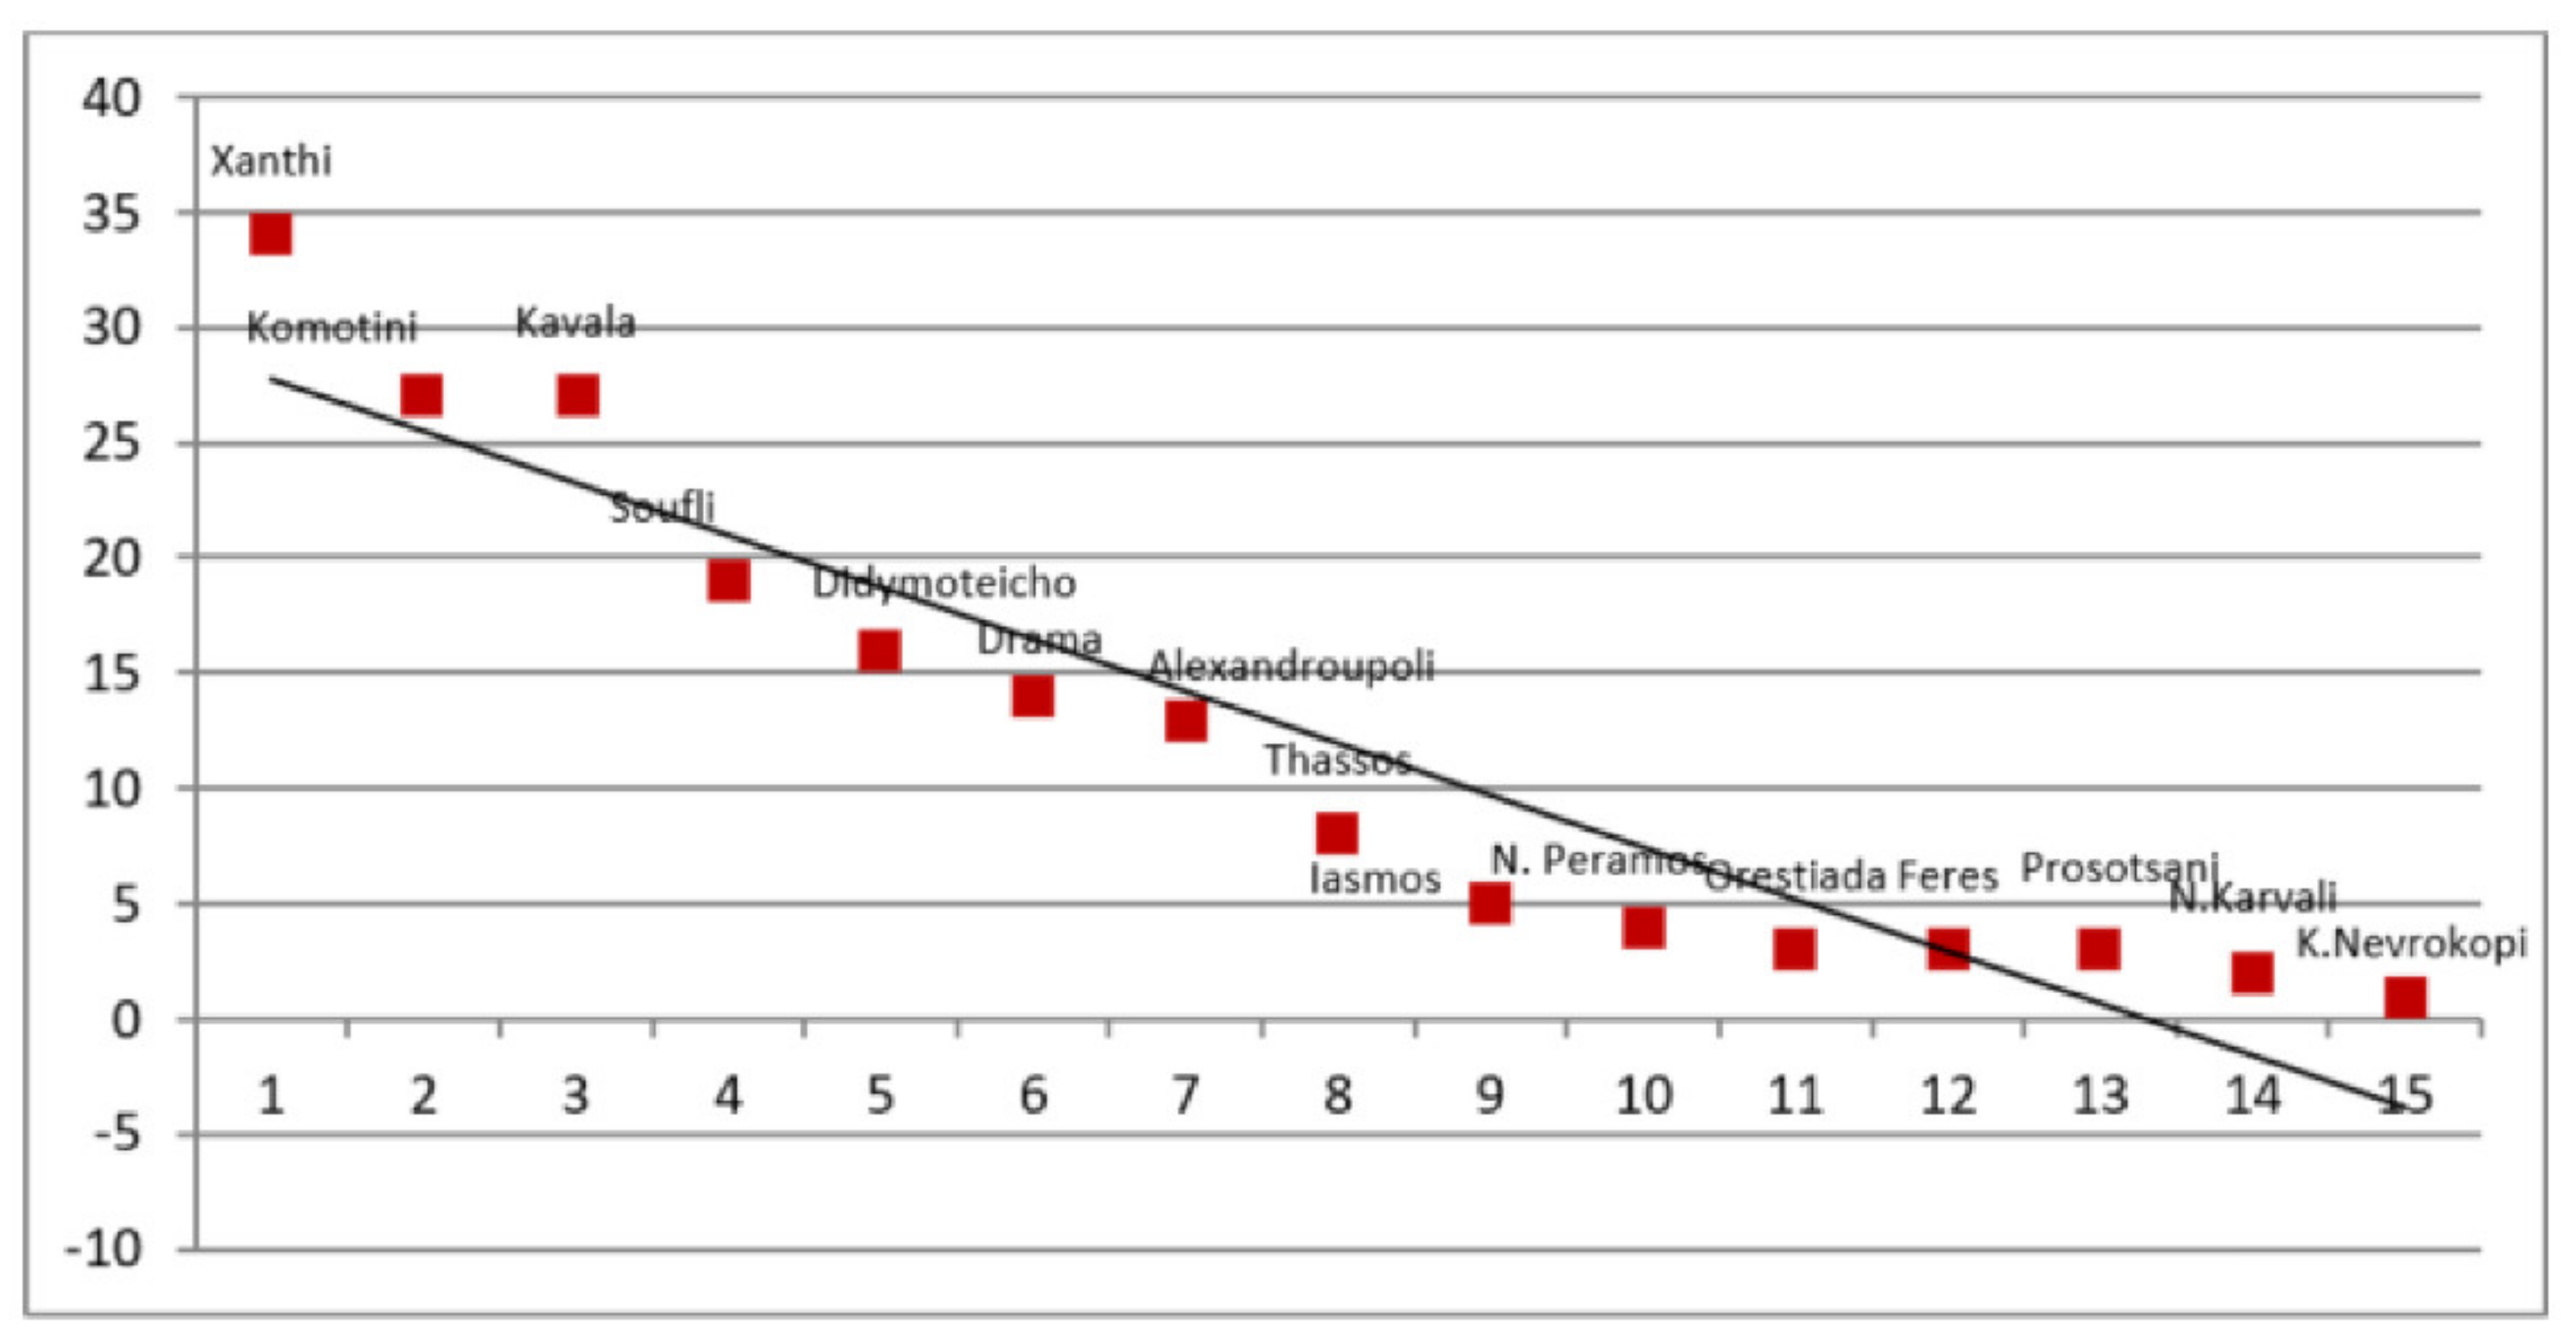
Following the methodological approach of Meijers [22] for the investigation of morphological mono/polycentricity, for each scenario the Silk Road zones are ranked hierarchically based on the spatial distribution of Silk Road assets, as shown in Table 3. This hierarchy will help compare the morphological polycentricity degree in each case. The concentration of Silk Road assets in each zone is estimated by the rank-size distribution.
Following the equation of the rank-size rule, which measures the concentration of observations in a specific area, Equations (2)–(4) calculate the density of Silk Road assets for the first and the second scenario distinctly. The value of the Silk Road heritage Polycentricity Index (SiRoPI) for the primary zones is −0.566 and for the secondary zones is −0.217. As the rank-size distributions are presented by the slope of the regression line, which gives information about the degree of polycentricity within a region, the higher the value of the estimated index means a flatter slope of the line that indicates a higher level of polycentricity [79]. Thus, in the first scenario, a more monocentric configuration is observed, in terms of Silk Road assets density near the urban cores, while in the second scenario the spatial distribution of the Silk Road assets is favoring a more polycentric networking. However, in both scenarios, the majority of Silk Road assets are located nearby the cities, so the network could be described as rather monocentric.
Accordingly, Figure 3 and Figure 4 present the 15 km zones’ and 30 km zones’ ranking, based on the distribution of Silk Road assets within the 15 zones for both scenarios. Since polycentricity indicates the lack of strong hierarchy in a given area and a more even distribution of nodes, the higher the rank-size score, the flatter the regression line and the more polycentric the Region. In the first scenario, the beta coefficient (Equation (4)), which expresses the slope of the regression line, is −3.528, while in the second scenario it is −1.672. The higher the beta, the more flat is the slope, confirming that, in the second scenario, the Region tends more toward polycentricity.
The same results derive from the primacy rate and Equation (5), which is used to calculate the ratio of Silk Road assets in the primate zones (the highest in hierarchy by Silk Road asset density zones) and the total number of Silk Road assets in the Region. For the first scenario, the primacy rate is 0.174 and in the second scenario is 0.147. As the primacy index describes the dominance of the prime concentration in relation to the area, the lower the primacy rate, the more polycentric the area. Consequently, in the second scenario the network tends more toward polycentricity.
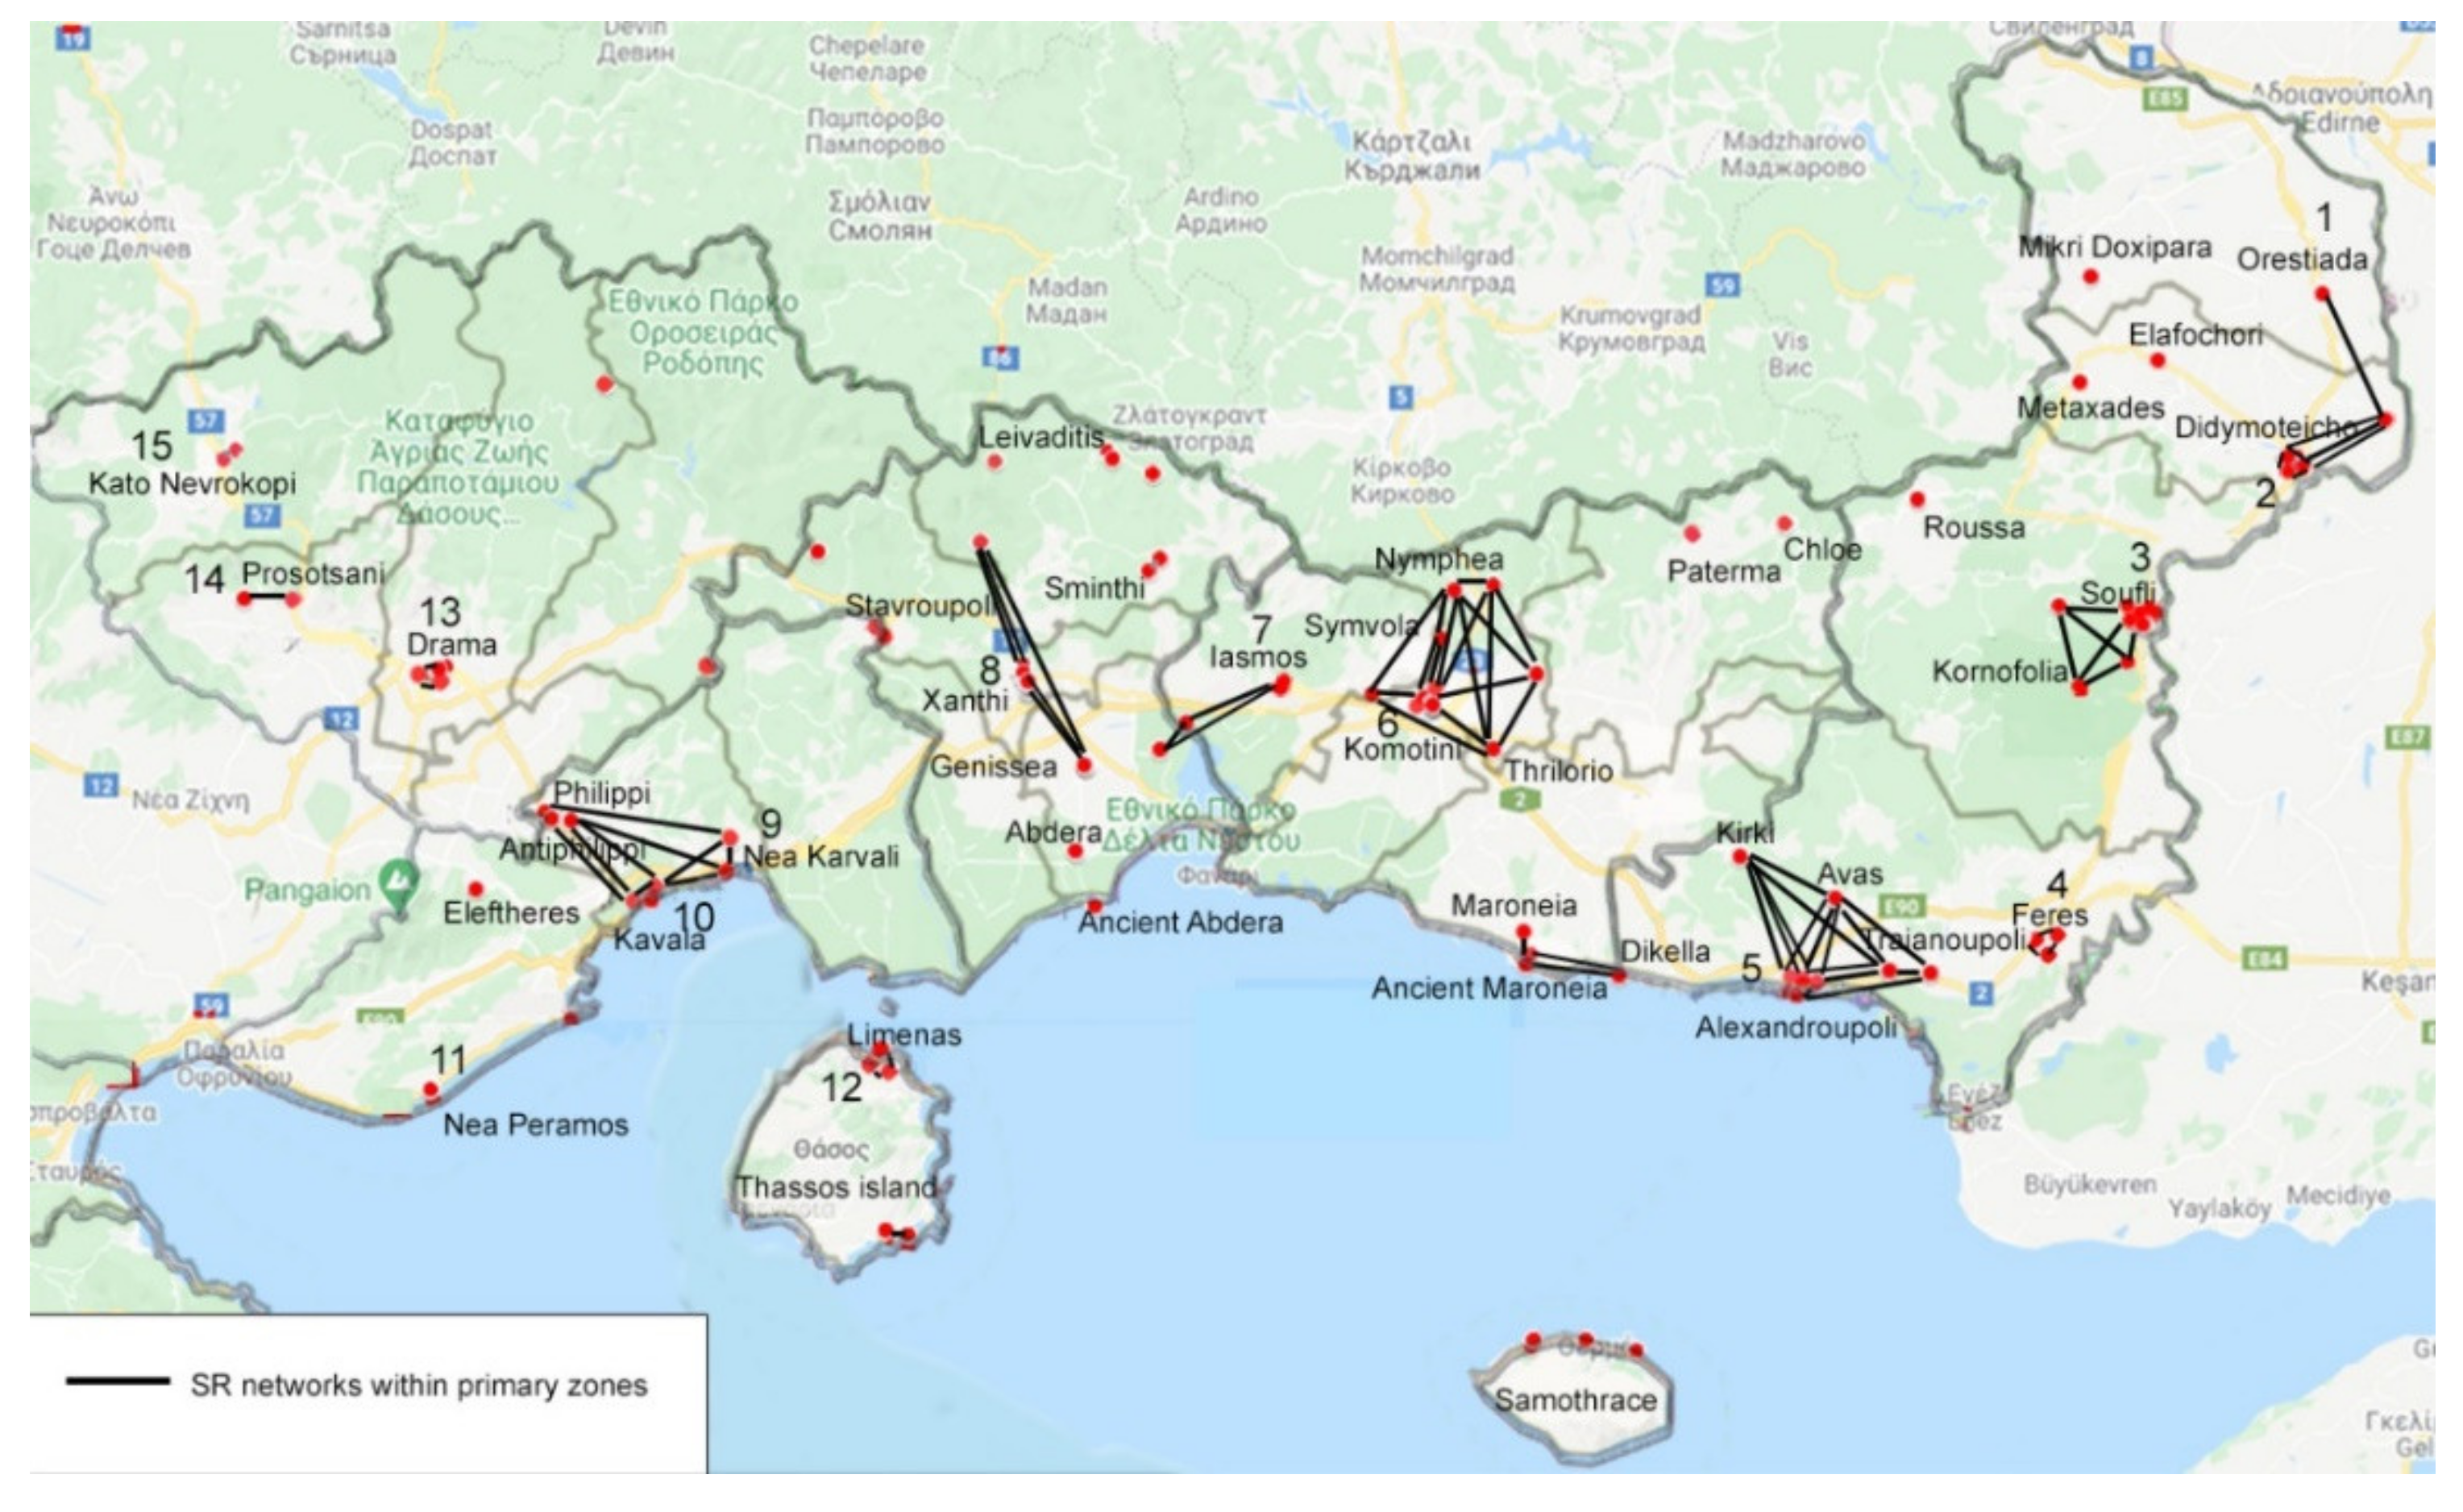
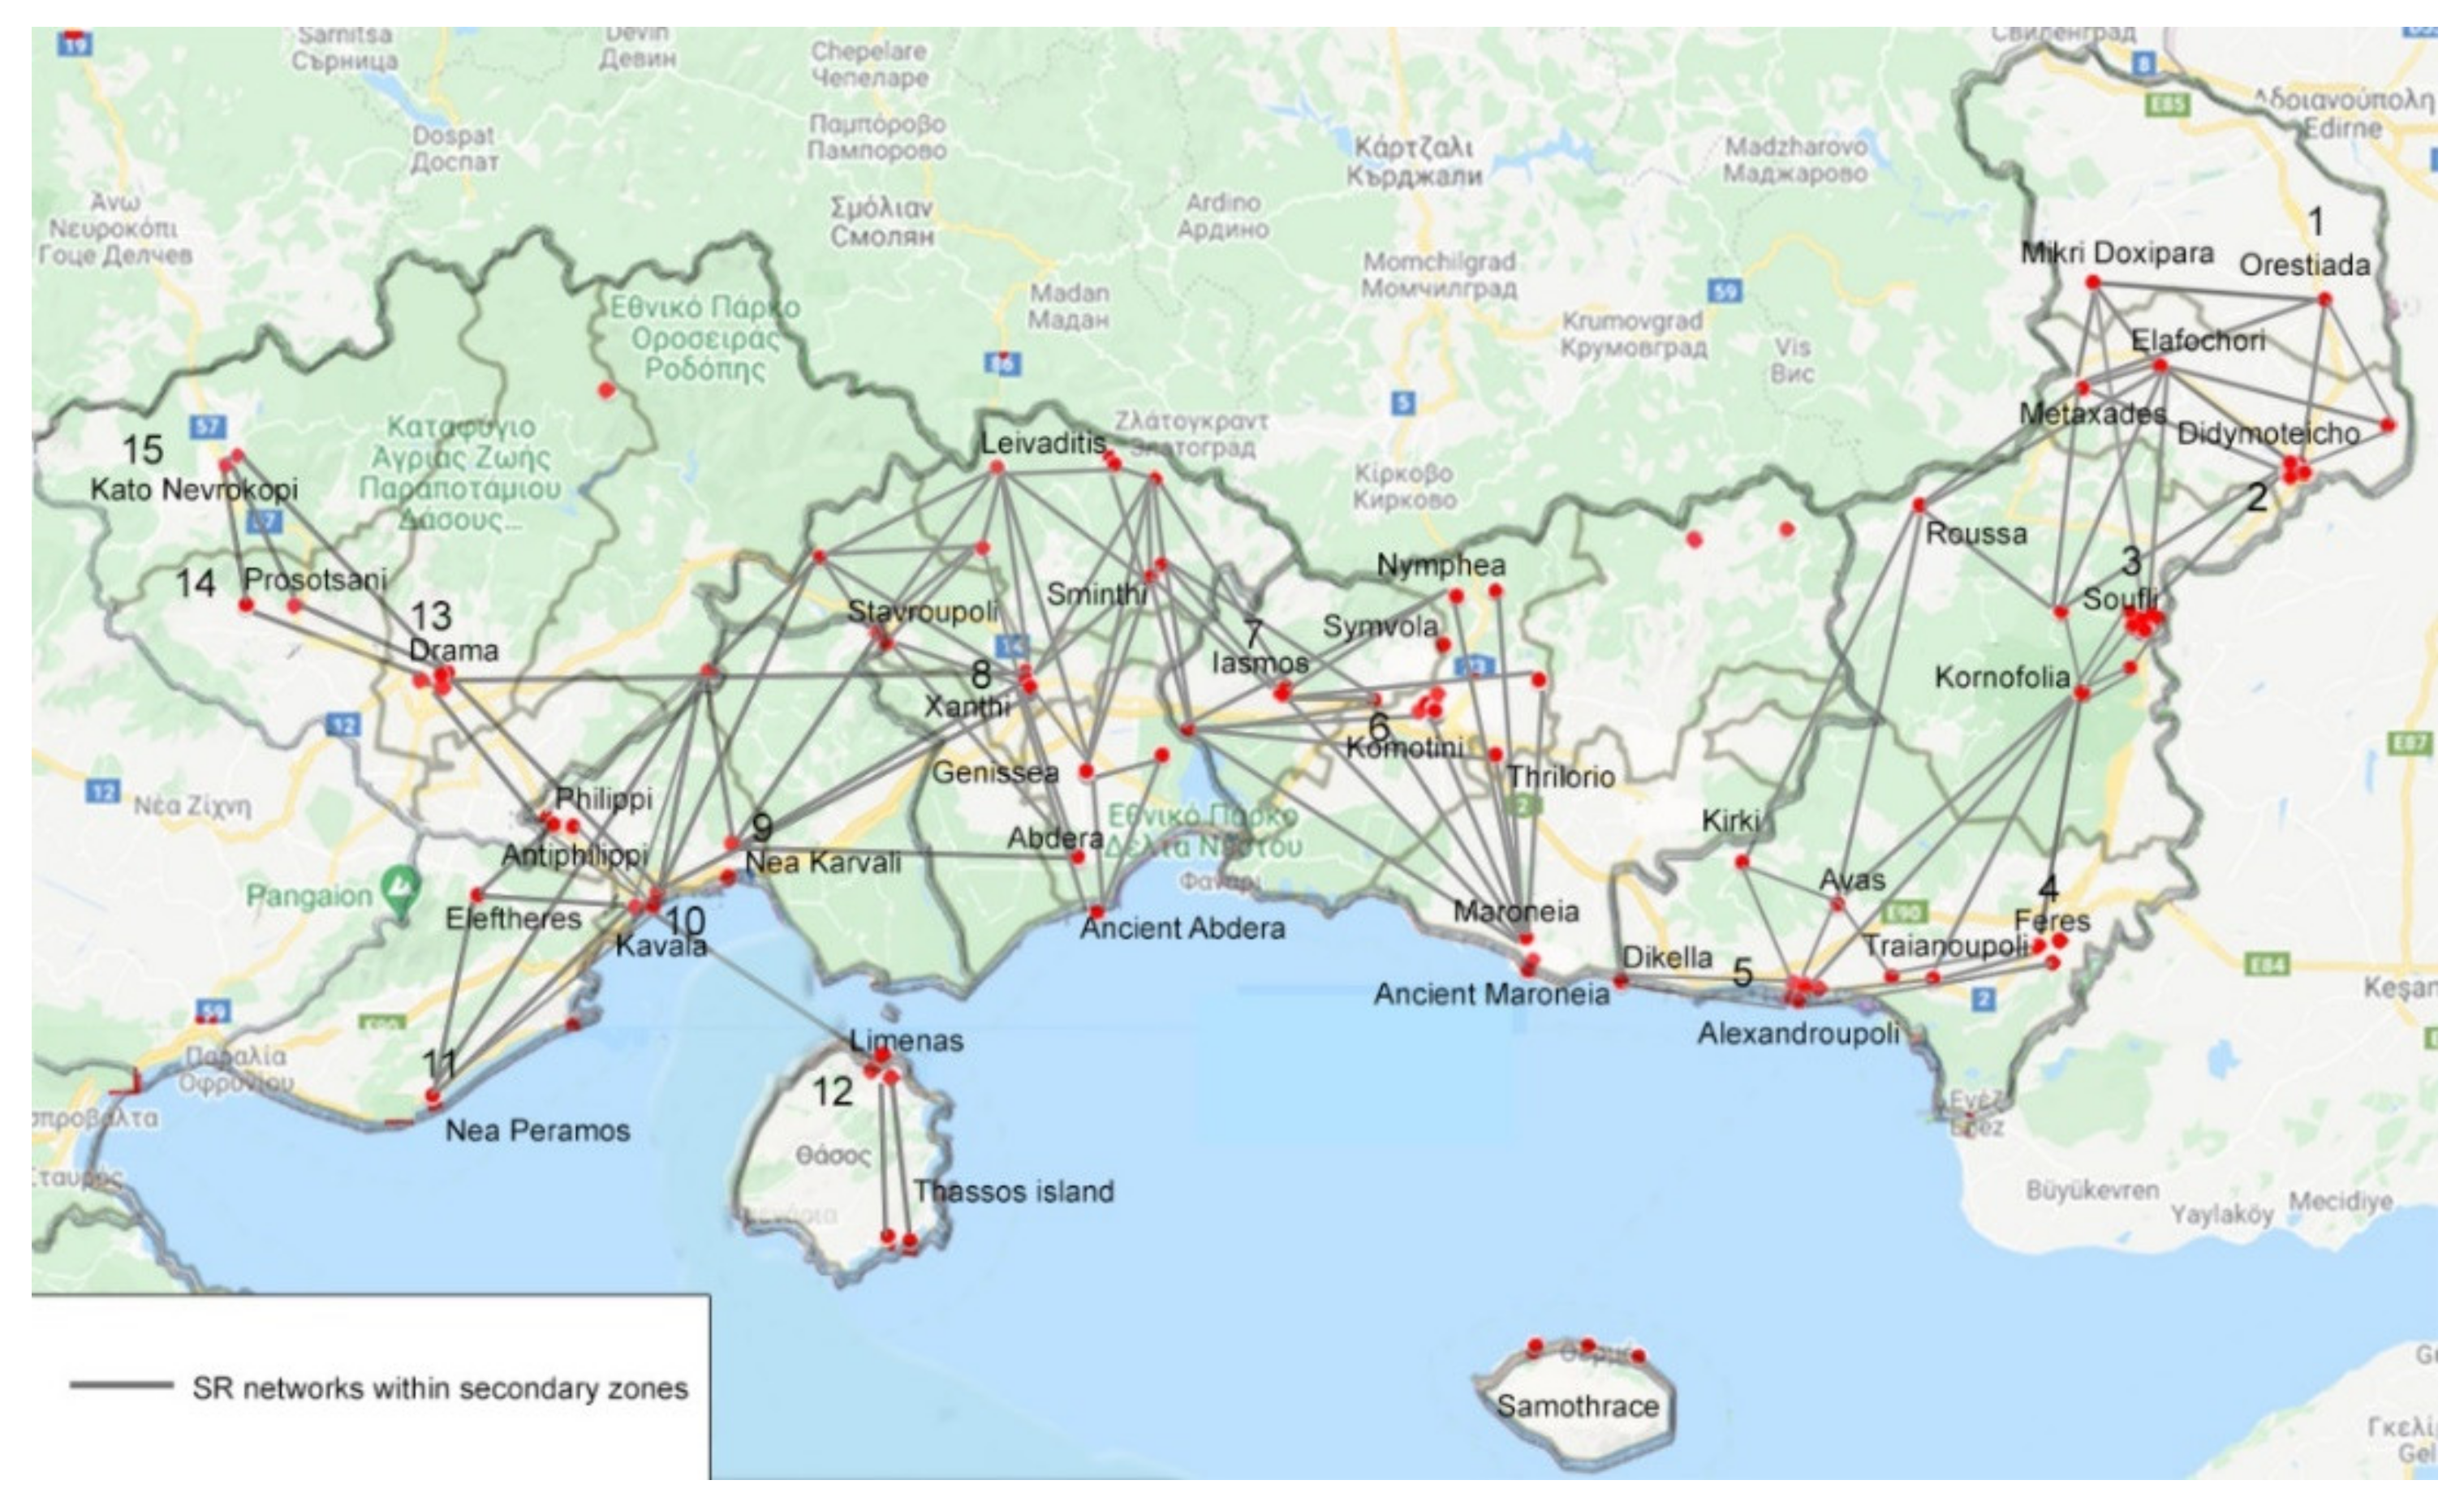
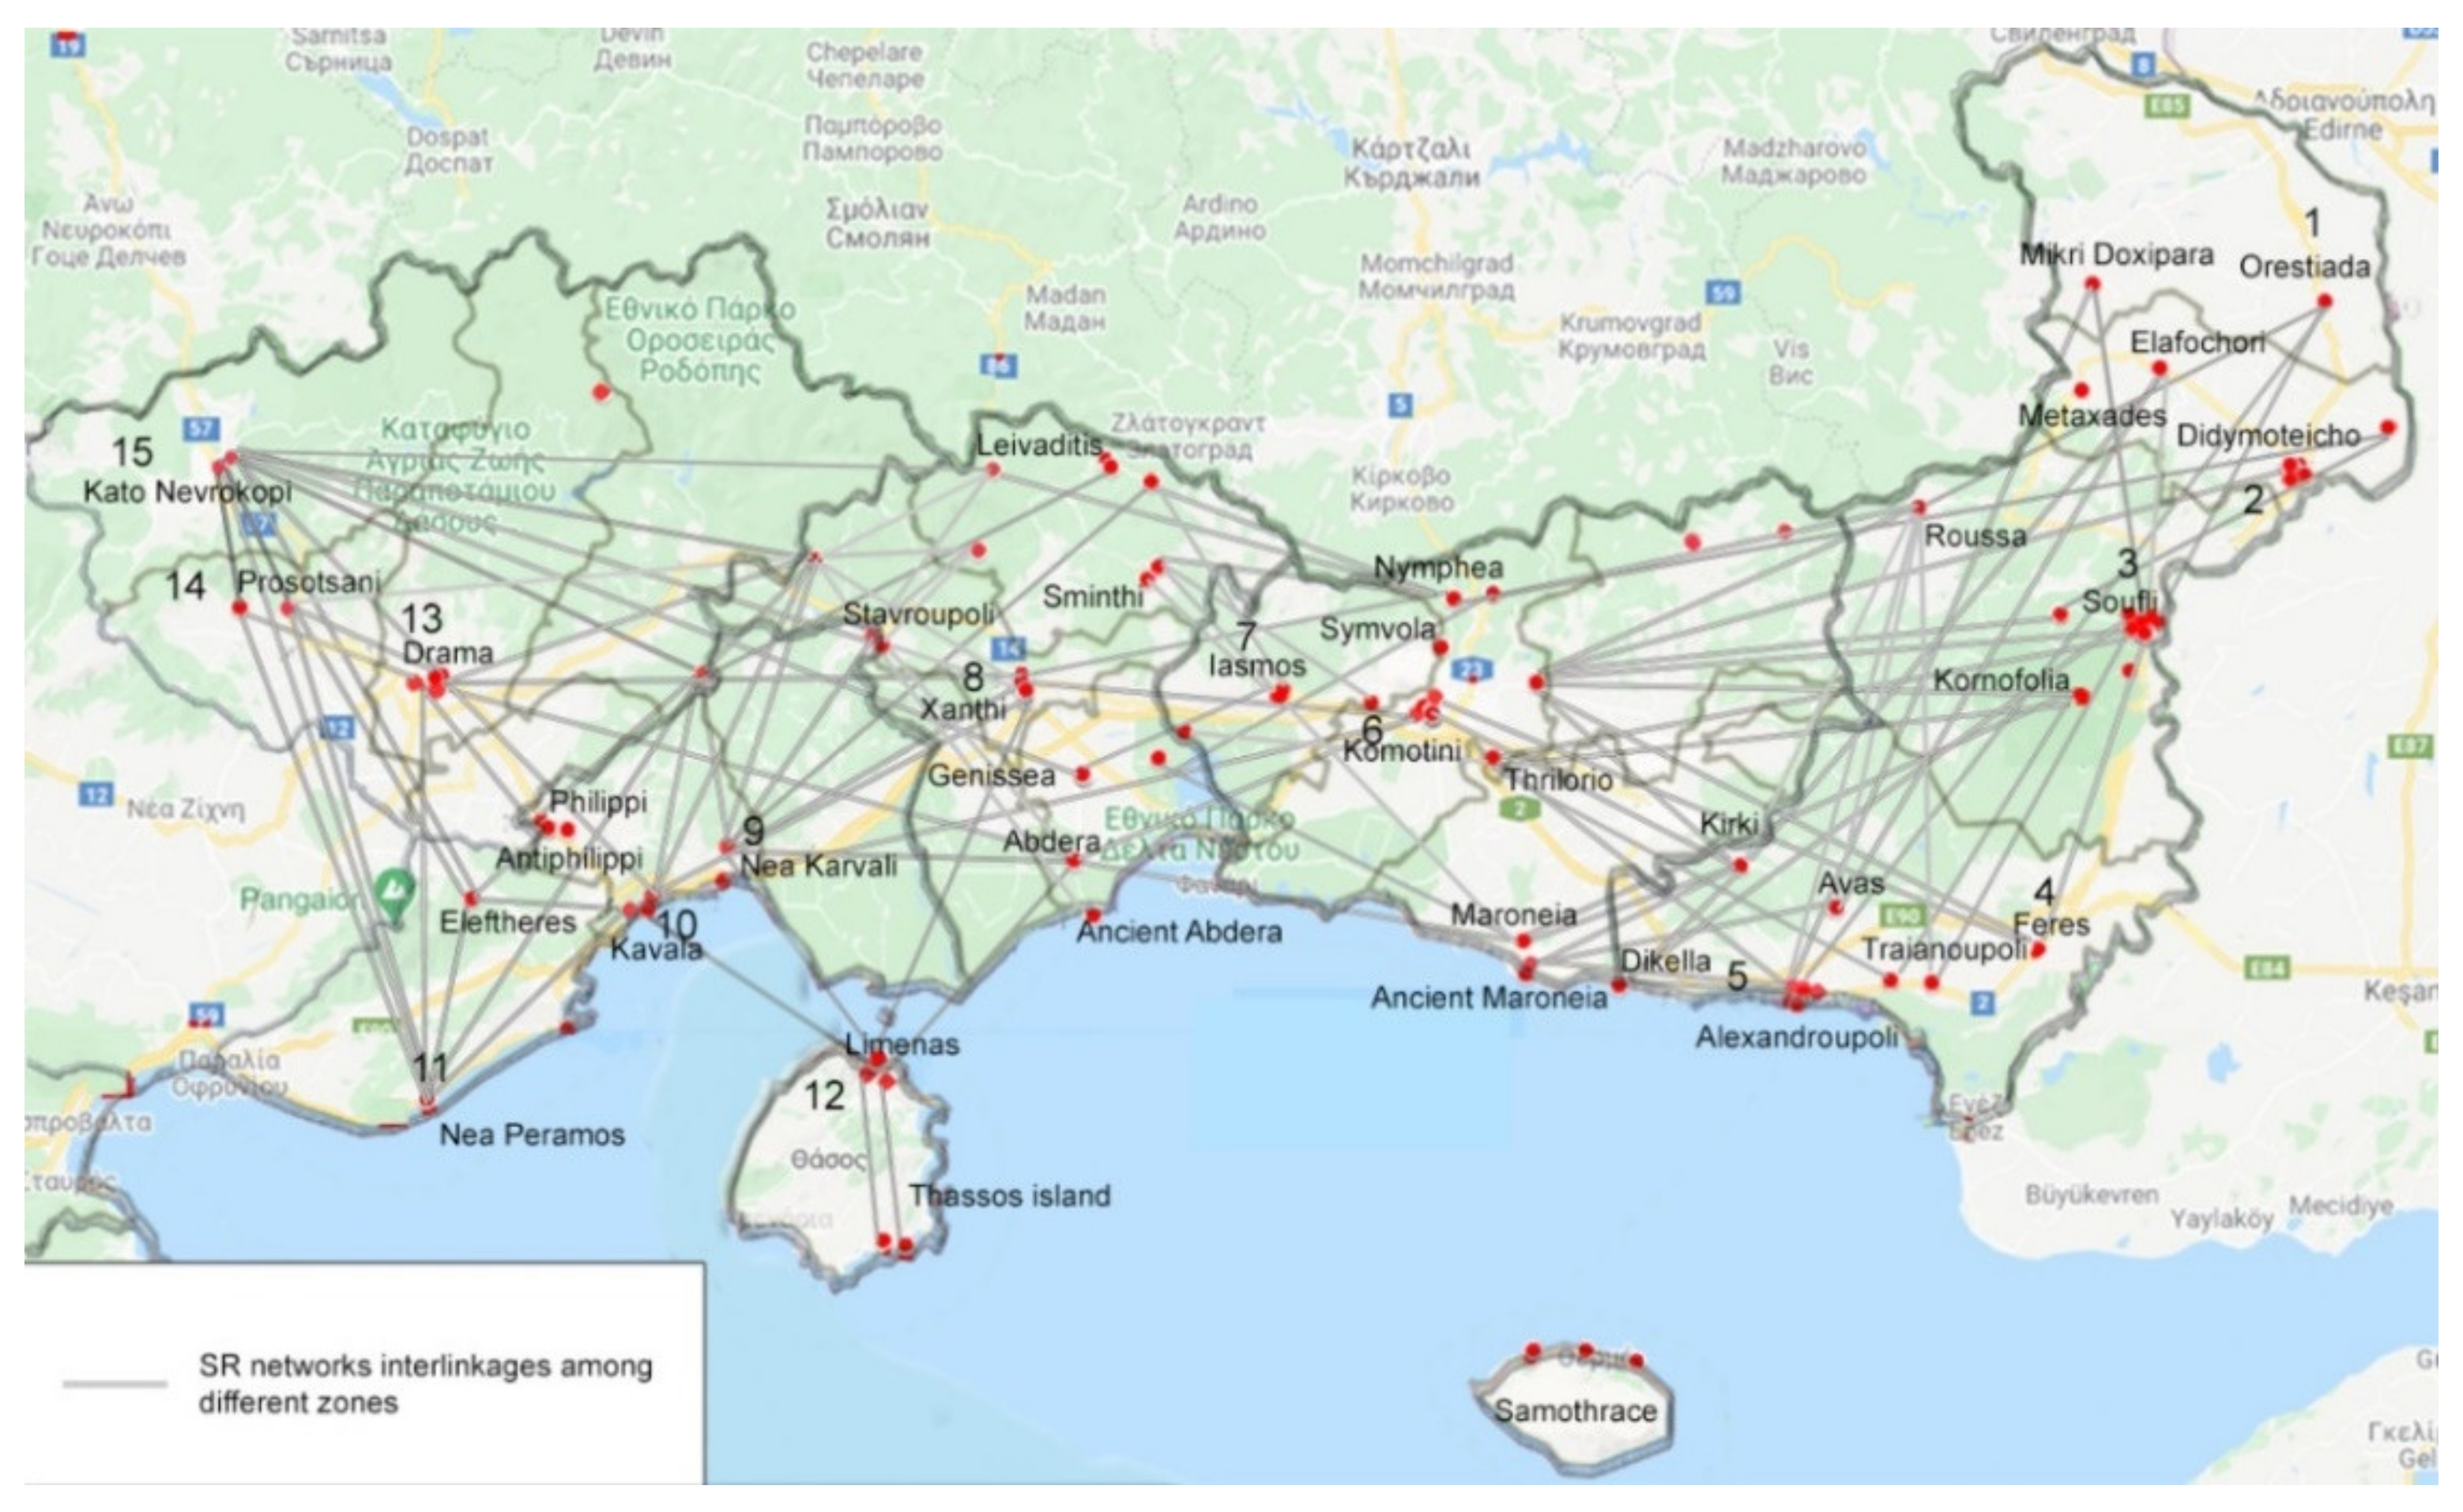
The classification of the Silk Road assets is considered as a useful tool for strategic planning in tourism and regional branding. Research results highlight the dynamic potential of Silk Road networking in the study area, as presented in Figure 5 and Figure 6. The proposed networks represent the potential interlinkages among Silk Road destinations for the first scenario (primary zones) in Figure 5 and the second scenario (secondary zones) in Figure 6. In Figure 7, the lines reflect the possibility of interconnection among nodes in different zones. These interlinkages are regarded here as the potential synergies of the Silk Road destinations (local authorities, culture and tourism stakeholders, branding and marketing planners), in order to develop common branding practices.
4. Discussion
The construction of the Silk Road heritage Polycentricity Index (SiRoPI) is introduced here as a methodological tool for the conflation of polycentricity and cultural heritage concepts, a topic where research is lacking. Silk Road cultural heritage is chosen for the methodology, since the revival of the Silk Road legacy reveals a dynamic of new tourism destinations and products. The Region of Eastern Macedonia and Thrace is selected as the study area to highlight the proposed methodology, due to the variety of Silk Road assets recorded. This effort to identify, record and classify Silk Road cultural heritage into categories and sub-categories, combined in an inventory of the key characteristics and mapping of assets over the study area, is a valuable tool for cultural heritage tourism development and regional branding.
The spatial distribution analysis for defining mono/polycentricity degree in the Region provides with very interesting results. The two developed scenarios attempt to investigate possible novel tourism products and routes related to the Silk Road. According to the findings for each scenario, these alternatives are supposed to highlight various destinations according to the Silk Road asset classification and distribution. Of great interest is the fact that, in terms of Silk Road asset distribution, the hierarchical classification of the nodes within the Region is different in each scenario. In the first scenario, Kavala, Komotini, Xanthi and Soufli are the prime nodes of Silk Road footprint concentration, while, in the second scenario, Xanthi takes the first position in the hierarchy, followed by Komotini—which is stable in both scenarios—Kavala and Soufli, which is also stable (Table 3). More precisely, in the first scenario, Kavala ranks first in the hierarchy, as many of the Silk Road assets of the broader area are located near the urban core. According to the Region’s Silk Road inventory, Kavala could be described as a Silk Road tobacco and ottoman architecture hub, as many of the assets are in the subcategory of tobacco warehouses. In the second scenario, Xanthi ranks first in the hierarchy, as many assets linked to the passages and routes of the Silk Road are found in the broader rural area. In fact, based on the field research findings, many of these assets are decaying, while their significance as Silk Road assets is quite unknown.
Furthermore, Soufli, a well-known Silk Road centre still actively involved in silk production and manufacturing, ranks fourth in both scenarios. In Soufli, there are ties to the Silk Road heritage not only focused on silk, but also on other items or sites. Therefore, there are also important prospects for enriching its Silk Road image and building a stronger brand name. It should be noted that, apart from Soufli as a well-known centre linked to silk, research results show that a plethora of other resources related to the Silk Road (not only silk, but a wider range of products and places connected to the Silk Road heritage), most of them still untapped, can create significant branding opportunities to promote Silk Road destinations in the Region. This gives other centres the opportunity to establish a regional Silk Road brand and to highlight a selection of Silk Road brand names, based on the specific assets identified (i.e., Kavala: a branded Silk Road destination of the Ottoman era, Xanthi: a branded destination of Silk Road khans, Komotini: a branded destination of Silk Road traditional market and bazaar, etc.).
It should be noted that, although the zoning methodology and SiRoPI index performed at a satisfactory level, including the majority of the assets identified in the Region, some assets in remote distant areas (i.e., in Samothrace island) were still excluded from the analysis, also because of accessibility constraints. Future research to deal with these constraints could direct research to formulate the methodology within set covering location-allocation problems, to include the accommodation facilities distribution as well.
5. Conclusions
Silk Road cultural heritage tourism is a rather untapped research topic, while polycentricity theory applied on the Silk Road culture can designate a new research field. The revival of the Silk Road heritage in its modern perspective is expected to encompass and encourage the creation of new tourism flows of independent travelers, seeking to experience diverse cultures and alternative forms of tourism. The Region of Eastern Macedonia and Thrace, endowed with rich cultural heritage resources connected with the Silk Road, can benefit from this revival and capitalise over a diversified cultural tourism product. These resources feature the potential of enhancing alternative and exclusive tourism destinations with a unified “Silk Road” brand name, on a regional and interregional scale. The research findings clearly illustrate the polycentric networking tourism potential based on the Silk Road cultural footprint across multiple opportunities for entrepreneurial synergies throughout the study area.
The implementation of the proposed methodology is significant for areas with a multitude of scattered Silk Road assets, which may not be properly exploited so far, due to the absence of labelling Silk Road as a new brand tourism product. The identification, classification and networking of the Silk Road cultural assets on the basis of the polycentricity methodology, highlight the resources recorded, facilitating the implementation of the appropriate branding strategies at regional level.
6. Practical Implications
Polycentric networking may be a key factor in determining at the regional level the branding strategy for the region or, if considered necessary, redefining it in terms of finding new tourism markets, and projecting a renewed brand image. The methodology provides authorities and stakeholders in local communities with valuable information for the larger spatial unit in which the respective town or settlement is included, thereby expanding the window of tourism development opportunities. In particular, the implementation of research findings may be a notable factor in the settlements of the Region of Eastern Macedonia and Thrace, where local branding has not yet been widely adopted, in the light of potential initiatives to establish a novel Silk Road brand identity.
Silk Road cultural heritage assets’ classification is considered as a useful tool for strategic planning in tourism and regional branding, addressed to local authorities and tourism stakeholders. The categorisation and networking methodology of Silk Road assets is designed to provide guidance for alternative cultural tourism development in the case study area, but also in other Greek Regions with similar Silk Road footprint. In addition, the buffer zoning methodological approach may be applied to explore the networking potential of diverse types of cultural heritage tourism, although with similar characteristics. The proposed scenarios could be also adapted on different spatial scales, depending on the study area (number of settlements, connectivity, travel time etc.) and the cultural footprint under investigation.
Furthermore, the innovative SiRoPI index introduced is expected to be more broadly applied in the field of cultural heritage tourism. The index is constructed to quantify any type of cultural assets with common characteristics, in order to identify the networking capacity within a study area. It could be also applied at different spatial levels—local, regional, national—including all types of settlements (urban or rural), as the spatial distribution of the cultural assets under investigation is the key attribute.
Author Contributions
Conceptualization, P.-K.S. and S.K.; methodology, P.-K.S. and S.K.; formal analysis, S.K., P.-K.S. and K.T.; investigation, K.T. and P.-K.S.; resources, K.T. and P.-K.S.; data curation, P.-K.S.; writing—original draft preparation, K.T. and P.-K.S.; writing—review and editing, S.K.; visualization, S.K., P.-K.S. and K.T.; supervision, S.K.; project administration, S.K.; funding acquisition, S.K., P.-K.S. and K.T. All authors have read and agreed to the published version of the manuscript.
Funding
This research is co-financed by Greece and the European Union (European Social Fund- ESF) through the Operational Programme «Human Resources Development, Education and Lifelong Learning 2014–2020» in the context of the project “Polycentric system of cultural tourism destinations of the Silk Road. Case study: Region of Eastern Macedonia-Thrace” (MIS code: 5047888).
Institutional Review Board Statement
Not applicable.
Informed Consent Statement
Not applicable.
Data Availability Statement
Not applicable.
Conflicts of Interest
The authors declare no conflict of interest. The funders had no role in the design of the study; in the collection, analyses, or interpretation of data; in the writing of the manuscript, or in the decision to publish the results.
References
- UNESCO. Convention Concerning the Protection of the World Cultural and Natural Heritage. 1972. Available online: https://whc.unesco.org/archive/convention-en.pdf (accessed on 16 November 1972).
- Della Spina, L. Adaptive Sustainable Reuse for Cultural Heritage: A Multiple Criteria Decision Aiding Approach Supporting Urban Development Processes. Sustainability 2020, 12, 1363. [Google Scholar] [CrossRef] [Green Version]
- Minetto, F.; Pirlone, F.; Tomasoni, L. Proposal of a methodological approach for sustainable regeneration in the historical centers of the Mediterranean Basin. Procedia Eng. 2011, 21, 1015–1022. [Google Scholar] [CrossRef] [Green Version]
- European Parliament. Cultural Heritage in EU Policies Briefing. Available online: https://www.europarl.europa.eu/RegData/etudes/BRIE/2018/621876/EPRS_BRI(2018)621876_EN.pdf (accessed on 15 October 2020).
- Coccosis, H. Cultural heritage, local resources and sustainable tourism. Int. J. Serv. Technol. Manag. 2008, 10, 8–14. [Google Scholar] [CrossRef]
- Ismagilova, G.; Safiullin, L.N.; Gafurov, I. Using Historical Heritage as a Factor in Tourism Development. Procedia Soc. Behav. Sci. 2015, 188, 157–162. [Google Scholar] [CrossRef] [Green Version]
- OECD. The Impact of Culture on Tourism. 2008. Available online: https://0-doi-org.brum.beds.ac.uk/10.1787/9789264040731-en (accessed on 16 December 2008).
- Yang, T.; Ye, M.; Pei, P.; Shi, Y.; Pan, H. City branding evaluation as a tool for sustainable urban growth: A framework and lessons from the Yangtze River Delta Region. Sustainability 2019, 11, 4281. [Google Scholar] [CrossRef] [Green Version]
- Zenker, S. Editorial: City marketing and branding as urban policy. Cities 2018, 80, 1–3. [Google Scholar] [CrossRef]
- Anttiroiko, A.V. City branding as a response to global intercity competition. Growth Chang. 2015, 46, 233–252. [Google Scholar] [CrossRef]
- Mitoula, R.; Kaldis, P. City Branding and Cultural Routes. SDCT J. 2020, 118–131. [Google Scholar] [CrossRef]
- Ashworth, G.J. Voogd. Selling the City: Marketing Approaches in Public Sector Urban Planning; Belhaven Press: London, UK, 1990. [Google Scholar]
- Deffner, A.; Metaxas, T.; Arvanitidis, P. Developing place marketing pilot plans: The cases of Rostock and Kainuu. Anatolia 2013, 24, 241–263. [Google Scholar] [CrossRef]
- Kavaratzis, M.; Warnaby, G.; Ashworth, G.J. (Eds.) Rethinking Place Branding: Comprehensive Brand Development for Cities and Regions; Springer International Publishing: Cham, Switzerland, 2015; ISBN 978-3-319-12423-0. [Google Scholar] [CrossRef]
- Boisen, M.; Terlouw, K.; Groote, P.; Couwenberg, O. Reframing place promotion, place marketing, and place branding-moving beyond conceptual confusion. Cities 2018, 80, 4–11. [Google Scholar] [CrossRef] [Green Version]
- Kloosterman, R.; Musterd, S. The Polycentric Urban Region: Towards a Research Agenda. Urban Stud. 2001, 38, 623–633. [Google Scholar] [CrossRef]
- Parr, J. The Polycentric Urban Region: A Closer Inspection. Reg. Stud. 2004, 38, 231–240. [Google Scholar] [CrossRef]
- Wang, S.; Liu, Y.; Zhi, W.; Wen, X.; Zhou, W. Discovering urban functional polycentricity: A traffic flow-embedded and topic modeling-based methodology framework. Sustainability 2020, 12, 1897. [Google Scholar] [CrossRef] [Green Version]
- Meijers, E. Polycentric Urban Regions and the Quest for Synergy: Is a Network of Cities More than the Sum of the Parts? Urban Stud. 2005, 42, 765–781. [Google Scholar] [CrossRef]
- Jamrozy, U. Sustainable tourism development: Ingenuity in marketing strategy. WIT Trans. Ecol. Environ. 2008, 115, 65–72. [Google Scholar] [CrossRef] [Green Version]
- Davoudi, S. European Briefing: Polycentricity in European spatial planning: From an analytical tool to a normative agenda. Eur. Plan. Stud. 2003, 11, 979–999. [Google Scholar] [CrossRef]
- Meijers, E. Summing Small Cities does not make a large City: Polycentric Urban Regions and the Provision of Cultural, Leisure and Sports Amenities. Urban Stud. 2008, 45, 2323–2342. [Google Scholar] [CrossRef]
- Meijers, E.; Hoekstra, J.; Aguado, R. Strategic Planning for City Networks: The Emergence of a Basque Global City? Int. Plan. Stud. 2008, 13, 239–259. [Google Scholar] [CrossRef] [Green Version]
- Meijers, E.J.; Waterhout, B.; Zonneveld, W. Closing the Gap: Territorial Cohesion through Polycentric Development. Eur. J. Spat. Dev. 2007, 24, 1–24. [Google Scholar]
- Meijers, E.J.; Burger, M.J. Stretching the concept of ‘borrowed size’. Urban Stud. 2017, 54, 269–291. [Google Scholar] [CrossRef]
- Brezzi, M.; Veneri, P. Assessing Polycentric Urban Systems in the OECD: Country, Regional and Metropolitan Perspectives. Eur. Plan. Stud. 2014, 23, 1128–1145. [Google Scholar] [CrossRef]
- Schmitt, P.; Volgmann, K.; Münter, A.; Reardon, M. Unpacking polycentricity at the city-regional scale: Insights from Dusseldorf and Stockholm. Eur. J. Spat. Dev. 2015, 59, 1–26. [Google Scholar]
- Veneri, P.; Burgalassi, D. Questioning Polycentric Development and its Effects. Issues of Definition and Measurement for the Italian NUTS-2 Regions. Eur. Plan. Stud. 2012, 20, 1017–1037. [Google Scholar] [CrossRef] [Green Version]
- Dembski, S. Structure and imagination of changing cities: Manchester, Liverpool and the spatial in-between. Urban Stud. 2015, 52, 1647–1664. [Google Scholar] [CrossRef]
- Evers, D.; de Vries, J. Explaining Governance in Five Mega-City Regions: Rethinking the Role of Hierarchy and Government. Eur. Plan. Stud. 2013, 21, 536–555. [Google Scholar] [CrossRef]
- Hall, P.; Pain, K. The Polycentric Metropolis: Learning from Mega-City Regions in Europe; Earthscan: London, UK, 2006. [Google Scholar]
- Cowell, M. Polycentric Regions: Comparing Complementarity and Institutional Governance in the San Francisco Bay Area, the Randstad and Emilia-Romagna. Urban Stud. 2010, 47, 945–965. [Google Scholar] [CrossRef]
- Meijers, E. Measuring Polycentricity and its Promises. Eur. Plan. Stud. 2008, 16, 1313–1323. [Google Scholar] [CrossRef]
- ESPON 1.1.1 Project: Potentials for Polycentric Development in Europe. 2005. Available online: https://www.espon.eu/sites/default/files/attachments/fr-1.1.1_revised-full_0.pdf (accessed on 28 March 2005).
- Wenner, F.; Dang, K.A.; Hölzl, M.; Pedrazzoli, A.; Schmidkunz, M.; Wang, J.; Thierstein, A. Regional Urbanisation through Accessibility?—The “Zweite Stammstrecke” Express Rail Project in Munich. Urban Sci. 2020, 4, 2. [Google Scholar] [CrossRef] [Green Version]
- Burger, M.J.; Meijers, E. Form Follows Function? Linking Morphological and Functional Polycentricity. Urban Stud. 2012, 49, 1127–1149. [Google Scholar] [CrossRef]
- Finka, M.; Kluvánková, T. Managing complexity of urban systems: A polycentric approach. Land Use Policy 2015, 42, 602–608. [Google Scholar] [CrossRef]
- Burger, M.J.; Meijers, E.J.; van Oort, F.G. Editorial: The Development and Functioning of Regional Urban Systems. Reg. Stud. 2014, 48, 1921–1925. [Google Scholar] [CrossRef]
- Davoudi, S. Conceptions of the city-region: A critical review. Proc. Inst. Civ. Eng. Urban Des. Plan. 2008, 161, 51–60. [Google Scholar] [CrossRef]
- Hewings, G.J.D.; Parr, J.B. Spatial Interdependence in a Metropolitan Setting. Spat. Econ. Anal. 2007, 2, 7–22. [Google Scholar] [CrossRef]
- Parr, J. Perspectives on the city-region. Reg. Stud. 2005, 39, 555–566. [Google Scholar] [CrossRef]
- Lambregts, B.; Kloosterman, R.; van der Werff, M.; Roling, R.W.; Kapoen, L.L. Randstad Holland: Multiple Faces of a Polycentric Role Model. The Polycentric Metropolis, Learning from Mega-City Regions in Europe, 1st ed.; Earhscan: London, UK, 2006; pp. 137–145. [Google Scholar]
- Meijers, E.J.; Burger, M.J. Spatial structure and productivity in US metropolitan areas. Environ. Plan. 2010, 42, 1383–1402. [Google Scholar] [CrossRef] [Green Version]
- Batty, M. Cities as Complex Systems: Scaling, Interaction, Networks, Dynamics and Urban Morphologies. Encycl. Complex. Syst. Sci. 2009, 44, 1041–1071. [Google Scholar] [CrossRef] [Green Version]
- Goess, S.; Jong, M.D.; Meijers, E. City branding in polycentric urban regions: Identification, profiling and transformation in the Randstad and Rhine-Ruhr. Eur. Plan. Stud. 2016, 24, 2036–2056. [Google Scholar] [CrossRef] [Green Version]
- Wäckerlin, N.; Hoppe, T.; Warnier, M.; de Jong, W.M. Comparing city image and brand identity in polycentric regions using network analysis. Place Brand. Publ. Dipl. 2020, 16, 80–96. [Google Scholar] [CrossRef]
- Metaxas, T.; Deffner, A.; Chalkiadaki, M. City marketing: Development plan for the municipality of Heraklion, Crete. In Proceedings of the 53rd Congress of the European Regional Science Association: “Regional Integration: Europe, the Mediterranean and the World Economy”, Palermo, Italy, 27–31 August 2013. [Google Scholar]
- Deffner, A.; Metaxas, T. Is city marketing opposed to urban planning? The elaboration of a pilot city marketing plan for the case of Nea Ionia, Magnesia, Greece. In Proceedings of the 46th congress of the European Regional Science Association “Enlargement, Southern Europe and the Mediterranean”, Volos, Greece, 30 August–3 September 2006. [Google Scholar]
- Chun, Z.; Bin, L. Cultural Approach to Planning of Inner City Regeneration. In Proceedings of the 44th ISOCARP: Cultural Approach/Inner City Regeneration Congress, Dalian, China, 19–23 September 2008. [Google Scholar]
- Kostopoulou, S.; Toufengopoulou, A.; Kyriakou, D.; Malisiova, S.; Sofianou, E.; Xanthopoulou-Tsitsoni, V.; The Western Silk Road in Greece. Aristotle University of Thessaloniki, Silk Road Programme 2016, Western Silk Road Tourism Initiative, A UNWTO-EU Initiative. 2016. Available online: https://webunwto.s3.eu-west-1.amazonaws.com/2019-09/aristotleuniversity-nationalswotanalysis-westernsilkroadgreece.pdf (accessed on 8 September 2020).
- Kostopoulou, S. Silk Road Cultural Heritage Tourism Network. In Proceedings of the 5th International Conference of International Association for Silk Road Studies IASS SUN “Silk Road: Connecting Cultures, Languages, and Ideas”, Moscow, Russia; 2019; pp. 232–260. [Google Scholar]
- Vasiliev, I.A.; Shmigelskaia, N.A. The Revival of the Silk Road: Brief review of the 4th China-Eurasia Legal Forum. Vestn. St. Petersburg Univ. Law 2016, 2, 94–101. [Google Scholar] [CrossRef] [Green Version]
- Winter, T. The geocultural heritage of the Silk Roads. Int. J. Herit. Stud. 2020, 1–20. [Google Scholar] [CrossRef]
- Xu, X.; Wang, L.; Song, Z.; Song, J. Brand equity for self-driving route along the Silk Road. Serv. Ind. J. 2019, 1–27. [Google Scholar] [CrossRef]
- World Tourism Organization (UNWTO). Western Silk Road Roadmap; World Tourism Organisation: Madrid, Spain, 2018. [Google Scholar] [CrossRef] [Green Version]
- World Tourism Organization (UNWTO). The Potential of the Western Silk Road; World Tourism Organisation: Madrid, Spain, 2017. [Google Scholar]
- Dadashpoor, H.; Saeidi Shirvan, S. Measuring functional polycentricity developments using the flow of goods in Iran: A novel method at a regional scale. Int. J. Urban Sci. 2019, 23, 551–567. [Google Scholar] [CrossRef]
- Miaoxi, Z.; Chen, C. Polycentric Network Organization of Mega-City Regions in Yangtze River Delta. Procedia Earth Planet. Sci. 2011, 2, 309–314. [Google Scholar] [CrossRef] [Green Version]
- IGEAT (Institut de Gestion de l’Environnnement et d’Aménagement du Territoire). ESPON 1.4.3 Project: Study on Urban Functions; Final Report; ESPON: Brussels, Belgium, 2007. [Google Scholar]
- Sandberg, K.; Meijers, E. Polycentric development: Panacea for regional disparities in European countries? In Proceedings of the 10th UNECE Conference on Urban and Regional Research, Bratislava, Slovakia, 22–23 May 2006. [Google Scholar]
- Burgalassi, D. Defining and Measuring Polycentric Regions: The Case of Tuscany; Discussion Papers del Dipartimento di Economia e Management-Università di Pisa: Pizza, Italy, 2010; p. 101. [Google Scholar]
- Gabaix, X.; Ioannides, Y. The Evolution of City Size Distributions. In Handbook of Regional and Urban Economics IV: Cities and Geography; Henderson, V., Thiss, J.F., Eds.; North Holland Publishing Company: Amsterdam, The Netherlands, 2004; pp. 2341–2378. [Google Scholar]
- Burger, M.J.; van der Knaap, B.; Wall, R.S. Polycentricity and the Multiplexity of Urban Networks. Eur. Plan. Stud. 2014, 22, 816–840. [Google Scholar] [CrossRef]
- Kloosterman, R.C.; Lambregts, B. Clustering of Economic Activities in Polycentric Urban Regions: The Case of the Randstad. Urban Stud. 2001, 38, 717–732. [Google Scholar] [CrossRef]
- Liu, X.; Derudder, B.; Wu, K. Measuring Polycentric Urban Development in China: An Intercity Transportation Network Perspective. Reg. Stud. 2016, 50, 1302–1315. [Google Scholar] [CrossRef]
- Palmisano, A. Confronting scales of settlement hierarchy in state-level societies: Upper Mesopotamia and Central Anatolia in the Middle Bronze Age. J. Archaeol. Sci. 2017, 14, 220–240. [Google Scholar] [CrossRef] [Green Version]
- Dökmeci, V.; Kundak, S. A Rank-Size Rule Analysis of The City System at The Country and Province Level in Turkey. ICONARP Int. J. Archit. Plan. 2018, 6, 77–98. [Google Scholar] [CrossRef] [Green Version]
- King, L. The Web Book of Regional Science; Thrall, G.I., Randall, J., Eds.; Sage Publication: Thousand Oaks, CA, USA, 1985. [Google Scholar]
- Wegener, M. Polycentric Europe: More Efficient, more Equitable and more Sustainable? In Welfare and Competitiveness in the European Polycentric Urban Structure: Which Role for Metropolitan, Medium and Small Cities? Instituto Regionale Programmazione Economica della Toscana (IRPET): Florence, Italy, 7 June 2013. [Google Scholar]
- Das, R.; Dutt, A. Rank-Size Distribution and Primate City Characteristics in India—A Temporal Analysis. Geoj. Urban Issues Urban Charact. Asia 1993, 29, 125–137. [Google Scholar] [CrossRef]
- Meijers, E.; Hoogerbrugge, M.; Cardoso, R. Beyond Polycentricity: Does Stronger Integration Between Cities in Polycentric Urban Regions Improve Performance? Tijdschr. Econ. Soc. Geogr. 2018, 109, 1–21. [Google Scholar] [CrossRef] [Green Version]
- EL.STAT. Greece in Figures. Peiraeus. 2016. Available online: http://www.statistics.gr/documents/20181/1515741/GreeceInFigures_2016Q3_GR.pdf/a5def5de-e7f7-423c-a23b-4e3e677a448c (accessed on 7 September 2020).
- European Commission. Region of Anatoliki Makedonia Thraki (Eastern Macedonia and Thrace), Internal Market, Industry, Entrepreneurship and SMEs. 2020. Available online: https://ec.europa.eu/growth/tools-databases/regional-innovation-monitor/base-profile/region-anatoliki-makedonia-thraki (accessed on 15 November 2020).
- INSETE Intelligence. Region of Eastern Macedonia and Thrace-Annual Report of Competition and Structural Adjunction in the Tourism Sector. 2019. Available online: https://insete.gr/wp-content/uploads/2020/04/Περιφέρεια-Αν.-Μακεδονίας-Θράκης.pdf (accessed on 15 November 2020). (In Greek).
- INSETE. Who Goes Where? How Much He Spends? Analysis of Inbound Tourism per Market and per Region 2019. 2019. Available online: https://insete.gr/studies/ (accessed on 1 February 2021). (In Greek).
- Silk Road Local Culture (SILC) Project (BSB570), Joint Operational Programme Black Sea Basin. 2014–2020. Available online: http://www.culturaltourismsilkroad.net/ (accessed on 5 February 2021).
- Kostopoulou, S.; Sofianou, E. Polycentric development through cultural heritage tourism based on the Silk Road footprint. In Proceedings of the International Conference Cultural Sustainable Tourism, Thessaloniki, Greece, 27–29 November 2017. [Google Scholar]
- Egnatia Motorway Observatory. 2nd Assessment of Spatial Effects. 2013. Available online: http://observatory.egnatia.gr/reports/2014/2nd_impacts_report_2013.pdf (accessed on 28 July 2013).
- Sat, N.A. Polycentricity in a developing world: A micro-regional analysis for morphological polycentricity in Turkey. GeoScape 2019, 12, 64–75. [Google Scholar] [CrossRef] [Green Version]
Figure 1.
Silk Road nodes in the primary buffer zones (15 km threshold).

Figure 2.
Silk Road nodes in the secondary buffer zones (30 km threshold).

Figure 3.
Regression line of Silk Road nodes-primary zones.

Figure 4.
Regression line of Silk Road nodes-secondary zones.

Figure 5.
Silk Road cultural assets proposed networks in primary zones.

Figure 6.
Silk Road cultural assets proposed networks in secondary zones.

Figure 7.
Silk Road cultural assets proposed networks among different zones.


Table 1.
Number of Silk Road assets per zone.
| Zone Code | Zone/Urban Centre | Number of Silk Road Assets—Primary Zones | Number of Silk Road Assets—Secondary Zones |
|---|---|---|---|
| 1 | Orestiada | 3 | 6 |
| 2 | Didymoteicho | 11 | 16 |
| 3 | Soufli | 17 | 18 |
| 4 | Feres | 4 | 4 |
| 5 | Alexandroupolis | 12 | 14 |
| 6 | Komotini | 24 | 28 |
| 7 | Iasmos | 6 | 7 |
| 8 | Xanthi | 19 | 30 |
| 9 | Nea Karvali | 2 | 3 |
| 10 | Kavala | 25 | 27 |
| 11 | Nea Peramos | 2 | 2 |
| 12 | Thassos (Limenas) | 8 | 11 |
| 13 | Drama | 15 | 15 |
| 14 | Prosotsani | 5 | 5 |
| 15 | Kato Nevrokopi | 1 | 1 |
| 154 | 187 |
Table 2.
Distribution of accommodation facilities per zone.
| 15 km Primary Zone | 30 km Secondary Zone | ||||
|---|---|---|---|---|---|
| Zone Code | Urban Centre—Main Node | Hotels | Campings | Hotels | Campings |
| 1 | Orestiada | 5 | 0 | 5 | 0 |
| 2 | Didymoteicho | 4 | 0 | 5 | 0 |
| 3 | Soufli | 5 | 0 | 5 | 0 |
| 4 | Feres | 3 | 0 | 3 | 0 |
| 5 | Alexandroupoli | 31 | 1 | 31 | 1 |
| 6 | Komotini | 11 | 0 | 15 | 0 |
| 7 | Iasmos | 0 | 0 | 4 | 2 |
| 8 | Xanthi | 14 | 0 | 18 | 2 |
| 9 | Nea Karvali | 2 | 1 | 2 | 1 |
| 10 | Kavala | 24 | 3 | 25 | 3 |
| 11 | Nea Peramos | 3 | 0 | 14 | 1 |
| 12 | Thassos (Limenas) | 159 | 4 | 166 | 4 |
| 13 | Drama | 10 | 0 | 10 | 0 |
| 14 | Prosotsani | 2 | 0 | 2 | 0 |
| 15 | Kato Nevrokopi | 7 | 0 | 7 | 0 |
Source: Hellenic Chamber of Hoteliers. Authors’ elaboration, authors’ field research.
Table 3.
Silk Road assets per zone and hierarchy for each scenario.
| Zone Code | Zone/Urban Centre | Number of Silk Road Assets—Primary Zone | Hierarchy Primary Zone—15 km Threshold | Zone Code | Zone/Urban Centre | Number of Silk Road Assets—Secondary Zone | Hierarchy Secondary Zone—30 km Threshold |
|---|---|---|---|---|---|---|---|
| 10 | Kavala | 27 | 1 | 8 | Xanthi | 30 | 1 |
| 6 | Komotini | 24 | 2 | 6 | Komotini | 28 | 2 |
| 8 | Xanthi | 19 | 3 | 10 | Kavala | 27 | 3 |
| 3 | Soufli | 17 | 4 | 3 | Soufli | 18 | 4 |
| 13 | Drama | 15 | 5 | 2 | Didymoteicho | 16 | 5 |
| 5 | Alexandroupoli | 12 | 6 | 13 | Drama | 15 | 6 |
| 2 | Didymoteicho | 11 | 7 | 5 | Alexandroupoli | 14 | 7 |
| 12 | Thassos | 8 | 8 | 12 | Thassos | 9 | 8 |
| 7 | Iasmos | 6 | 9 | 7 | Iasmos | 7 | 9 |
| 14 | Prosotsani | 5 | 10 | 1 | Orestiada | 6 | 10 |
| 4 | Feres | 4 | 11 | 14 | Prosotsani | 5 | 11 |
| 1 | Orestiada | 3 | 12 | 4 | Feres | 4 | 12 |
| 9 | Nea Karvali | 2 | 13 | 9 | Nea Karvali | 3 | 13 |
| 11 | Nea Peramos | 2 | 14 | 11 | Nea Peramos | 2 | 14 |
| 15 | Kato Nevrokopi | 1 | 15 | 15 | Kato Nevrokopi | 1 | 15 |
| Total | 154 | Total | 187 |
Publisher’s Note: MDPI stays neutral with regard to jurisdictional claims in published maps and institutional affiliations. |
© 2021 by the authors. Licensee MDPI, Basel, Switzerland. This article is an open access article distributed under the terms and conditions of the Creative Commons Attribution (CC BY) license (http://creativecommons.org/licenses/by/4.0/).
Share and Cite
MDPI and ACS Style
Kostopoulou, S.; Sofianou, P.-K.; Tsiokanos, K. Silk Road Heritage Branding and Polycentric Tourism Development. Sustainability 2021, 13, 1893. https://0-doi-org.brum.beds.ac.uk/10.3390/su13041893
AMA Style
Kostopoulou S, Sofianou P-K, Tsiokanos K. Silk Road Heritage Branding and Polycentric Tourism Development. Sustainability. 2021; 13(4):1893. https://0-doi-org.brum.beds.ac.uk/10.3390/su13041893
Chicago/Turabian StyleKostopoulou, Stella, Paraskevi-Kali Sofianou, and Konstantinos Tsiokanos. 2021. "Silk Road Heritage Branding and Polycentric Tourism Development" Sustainability 13, no. 4: 1893. https://0-doi-org.brum.beds.ac.uk/10.3390/su13041893
Note that from the first issue of 2016, this journal uses article numbers instead of page numbers. See further details here.