Article

Numerical Investigation for Riverbank Filtration Sustainability Considering Climatic Changes in Arid and Semi-Arid Regions; Case Study of RBF Site at Embaba, Nile Delta, Egypt

by
Ismail Abd-Elaty
1,
Hala M. Ghanayem
2,
Martina Zeleňáková
3,*,
Peter Mésároš
4 and
Osama K. Saleh
1
1
Water and Water Structures Engineering Department, Faculty of Engineering, Zagazig University, Zagazig 44519, Egypt
2
Ministry of Water Resources and Irrigation, Zagazig 44519, Egypt
3
Institute of Environmental Engineering, Faculty of Civil Engineering, Technical University of Košice, 04200 Košice, Slovakia
4
Institute of Technology, Economics and Management in Construction, Faculty of Civil Engineering, Technical University of Košice, 04200 Košice, Slovakia
*
Author to whom correspondence should be addressed.
Sustainability 2021, 13(4), 1897; https://0-doi-org.brum.beds.ac.uk/10.3390/su13041897
Submission received: 29 December 2020 / Revised: 29 January 2021 / Accepted: 5 February 2021 / Published: 10 February 2021
(This article belongs to the Special Issue Sustainable Water Resources Management and Waste Water Engineering)

Abstract

:
Changes in riverine hydrography and reduced aquifer recharge due to projected climate changes in arid and semi-arid regions are the main issues of water supply, especially in the Nile Delta, Egypt. Continuous degradation results from reduced Nile water flow, poor management of groundwater extraction, and human activities throughout the Nile’s course and drainage channels. Contamination of this water with heavy metals and dissolved organic solids reduces the quality of this water, which increases the price of treatment. River Bank Filtration (RBF) is a water treatment technology used for improving the quality of drinking water taken from polluted rivers where abstraction wells are installed on the banks. This study was applied to the RBF site at Embaba, Nile Delta, Egypt using the numerical code MT3D. The study was simulated and calibrated for the current situation and number of scenarios to investigate the effect of climatic changes on RBF sustainability. Four scenarios were simulated to identify and estimate the RBF portion and the total water travel time from the river to the wells. The first scenario involves a reduction in river stages, the second a decrease in aquifer recharge, the third a combination of the first two scenarios, and the fourth scenario combines scenarios 1, 2, and 3. The results indicate that the RBF portion decreased from 67.42% in the base case to 35.46% and 64.99% with a reduction in river stage by 75% from the base case and a decrease in aquifer recharge from 182.50 (base case) to 50 mm per year, respectively. Moreover, the RBF portion increased to reach 87.75% with a reduction in the General Head Boundary of 75% from the base case, while the combination of the three scenarios decreased the RBF portion to 67.24%. Finally, the water supply systems in arid and semi-arid regions should be extended by installing and operating RBF facilities to manage the negative effects of climatic change through reduction in river stages and aquifer recharge, and increasing abstraction due to overpopulation.

1. Introduction

Overpopulation and drought cause great pressure on water resources. This requires developing new resource approaches to water planning and management to prevent escalating conflicts and reverse environmental degradation. The Middle East and north Africa region can be considered one of the world’s most water-scarce regions [1], as the use of its water resources with increasing intensity and increasingly low precipitation is leading to national water crises with low water levels and the emptying of reservoirs [2,3]. Evaluating water quality indicators is a crucial issue for integrated water resource management, since potable water sustainability is an essential resource for the world’s health [4]
Global warming could cause further changes, variability and uncertainty, and rising water temperatures and extreme climate changes, including floods and droughts, are expected to affect water quality and exacerbate many forms of water pollution from sediments, nutrients, dissolved organic carbon, pathogens, pesticides and salt, as well as negative impacts of thermal pollution on ecosystems and health [5]. Rises in sea levels and dynamic changes also have potential impacts on groundwater quality and quantity [6].
Egypt has a semi-arid to extremely-arid climate, and demonstrates the classical features of arid zone hydrology, one of which is the poor availability of quantities of fresh water. The Nile has always been the main source of fresh water to the country, covering all water demands for Egypt’s people occupying the Nile Valley and the Delta. While human activity in the remaining 97% of desert land is confined to a few settled localities, where deep groundwater has been available through springs and seepage zones, great challenges and particular risks are emerging in the lower Nile region for providing sustainable clean drinking water due to the lack of resources, water shortages as well as water resource management issues, and inadequate sanitation systems for citizens. Besides, more water is needed to ensure sustainable irrigation, to produce electricity using hydropower, and to maintain diverse ecosystems [7,8]. Abd-Elaty et al. [9] simulated a numerical solution for reducing soil and groundwater contamination in arid and semi-arid regions of the eastern Nile Delta. The Egyptian Environmental Affairs Agency report notes that Egypt’s freshwater budget runs a deficit because supply, which comes from the Nile (95%), precipitation (3.5%) and groundwater (1.5%), is less than current demand. The results of global climate studies show that by 2050 it is expected that the rainfall will decrease in the regions of north Africa and some areas in Egypt by 20% to 25% in the dry season, while in the wet season the rainfall will decrease by about 10–15% [1,10]. These developments are putting pressure on Egypt’s water resources, which makes it imperative to use non-traditional methods to overcome this deleterious situation.
River Bank Filtration (RBF) is a water purification process in which river water is naturally filtered into the aquifer through the river bed or the banks of the river. A series of biological, chemical, and physical actions take place during the underground passage, which improve water quality [11]. Figure 1 presents a diagrammatic cross-section of the RBF system. It has been used in Europe for decades, especially since the end of World War II, because the rivers themselves have become significantly polluted with municipal and industrial effluents. Using RBF is now the most efficient method of producing high-quality drinking water. It is worth mentioning that earlier, in the 1870s, it was used in Germany, along the Rhine, Elbe and Danube, and in France along the Seine, to provide drinking water to cities [12]. Recently, many countries around the world have started evaluating RBF potential for water treatment, including countries like India, Jordan, and China [13,14,15]. Egypt has started using the RBF technique in water treatment processes as a primary or complete treatment step. The Holding Company for Water and Wastewater (HWCC) has conducted field investigations to study the efficiency of this system and it has shown satisfying results [16], especially at times when conventional water supply stations are liable to closure because of surface water pollution as a result of natural conditions such as floods, or leaks from ships and fuel carriers.
Numerical modelling is useful for studying groundwater systems, as it is a relatively low-cost method with the ability to experiment with multiple scenarios, and the results can be taken further into account, for example, when implementing an RBF system. Numerical simulations using MODFLOW software [18] have been applied concerning the effects of temperature on water contamination during soil passage transport, and to examine the influence of potential hydrological changes on the efficiency of bank filtration and artificial feeding [19,20]. Potential climate change has been assessed as discussed in applicable climate scenarios, including its impact on BF as a sustainable, cost-effective method of drinking water supply. In particular, increased biological activity at higher temperatures in the groundwater layer appears to improve the cleaning efficiency of the soil path, and the soil path functions as a temporary barrier to pollution. In the event of an increase in extreme situations such as floods and low flow periods, application strategies are provided to protect the drinking water supply [21].
This study aims to investigate the effects of projected climate change on the sustainable operation of RBF systems in arid and semi-arid regions using numerical modelling. Moreover, the study is intended to identify and estimate the RBF portion and the total water travel time from the river to the RBF wells by solute transport model MT3D, considering the effects of changes in river stages, precipitation, the combination of river stages with precipitation, and finally the effects of the General Head Boundary (GHB) from the groundwater side on the portion of the RBF site at Embaba, Nile Delta, Egypt.

2. Materials and Methods
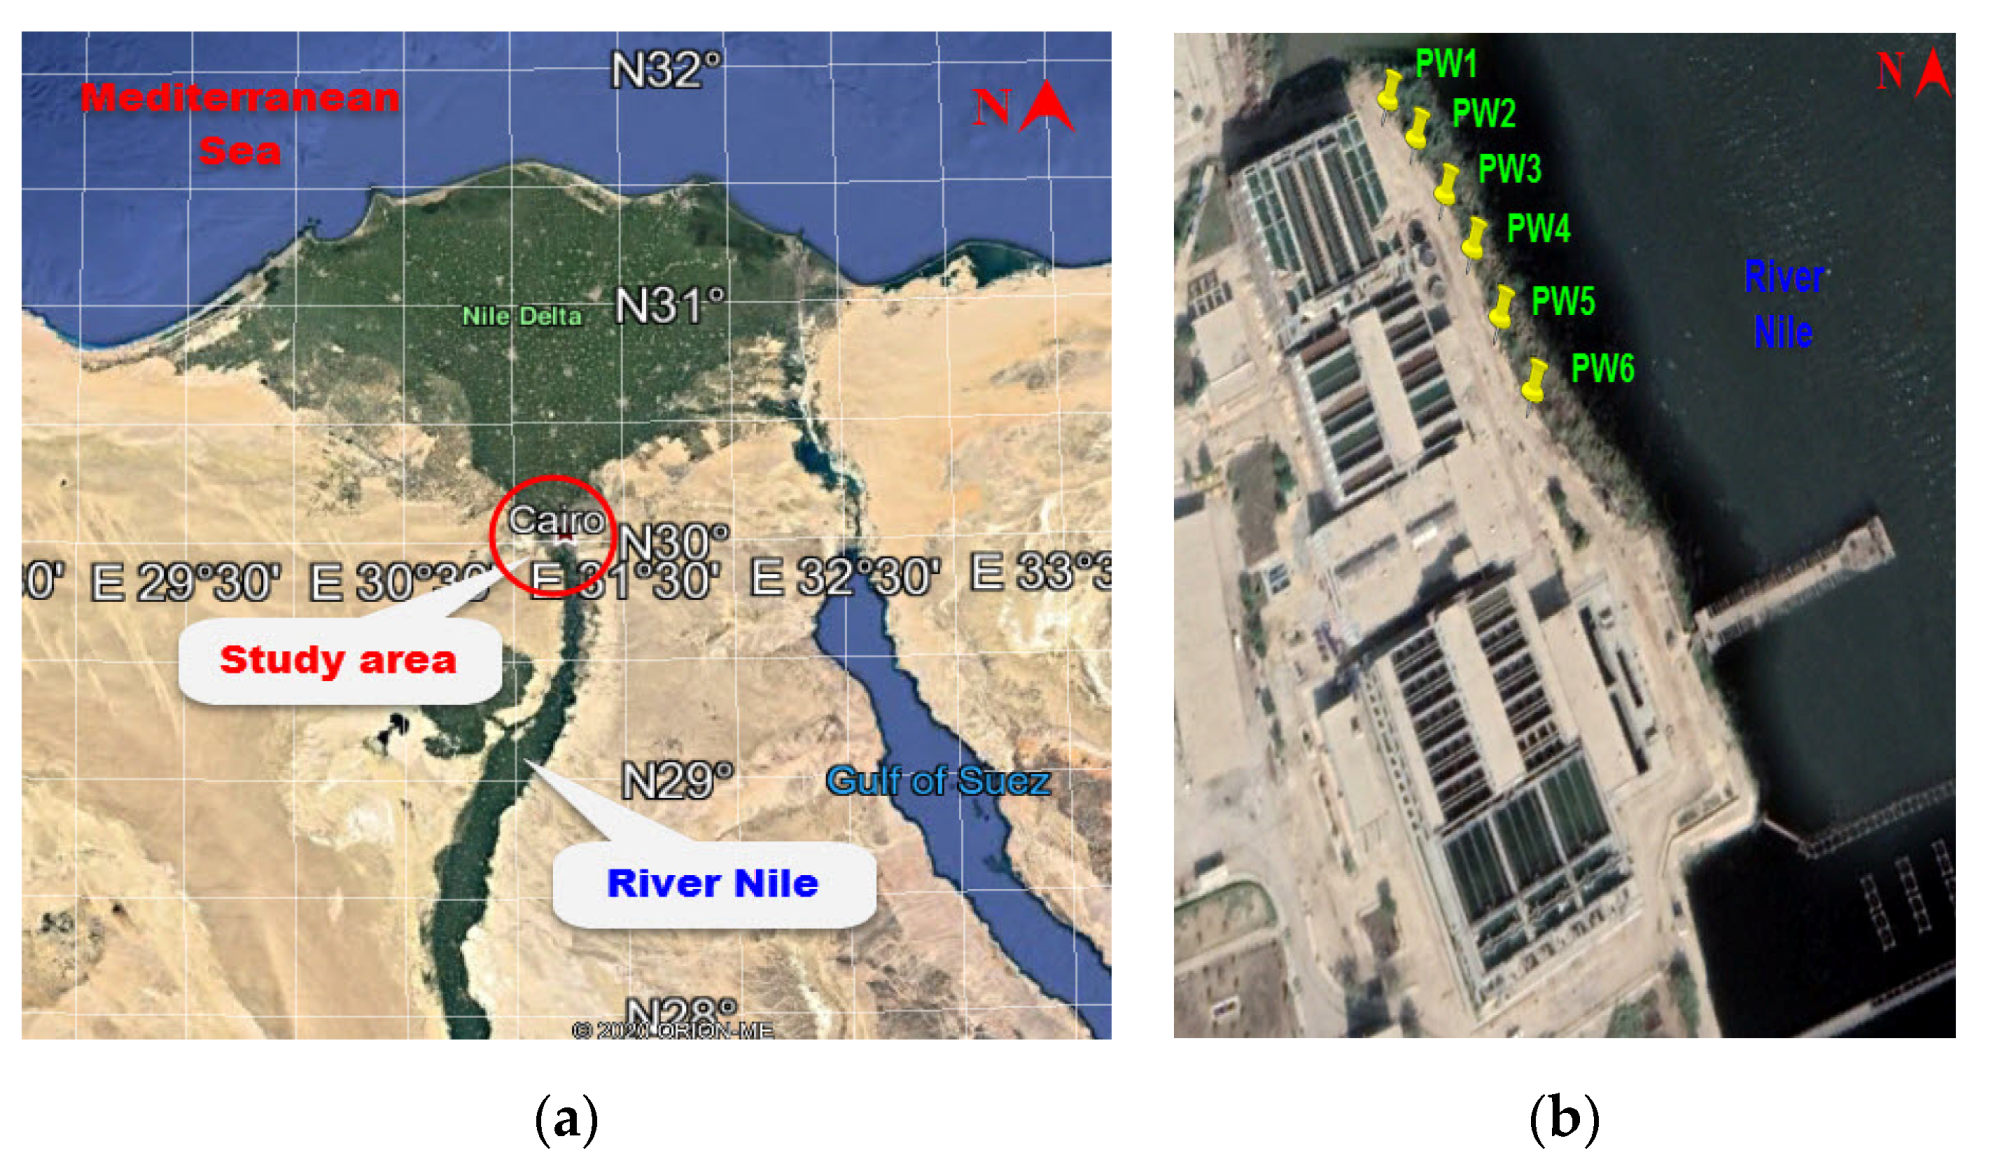
2.1. Study Area

The study area is located in Giza Governorate, Egypt between latitudes 30° 06\ to 30° 07\ N and longitudes 31° 12\ to 31° 13\ E, occupying about 4 km2, as presented in Figure 2a. This is the location of the drinking water and sewage plant at Embaba, which operates for a population of more than 8 million [22].

2.1.1. Geomorphology, Land Use, and Metrological Conditions

The geomorphologic features of the study area consist of Al-Warraq island to the east and the surrounding western branch of the river Nile. The average land levels range between 17 to 20 m above mean sea level (masl) reaching 23 m at the western boundary, while the eastern boundary is the river Nile branch with average bed level 8.8 (masl) and width 250 m. The groundwater reservoir in the study area depends on the river Nile at the source of the delta barrages, and its flow is generally in a northerly direction. However, due to the presence of two side depressions, at the Giza pyramids to the west and the Marg to the east, and due to the high levels of groundwater extraction at the-Remayyah Golf Club and the Giza Pyramids site [23], the flow conditions in the southern part of the map are different on the left from those on the right side of the river.
The climate of the Nile Delta region is moderate, with a relative rise in temperature during the summer and average mean temperatures between 12 °C and 31 °C in January and July, respectively. The rainfall is less than 40 mm per year; the humidity ranges from 45% to 84%, and the daily evaporation reaches 15 mm [24].

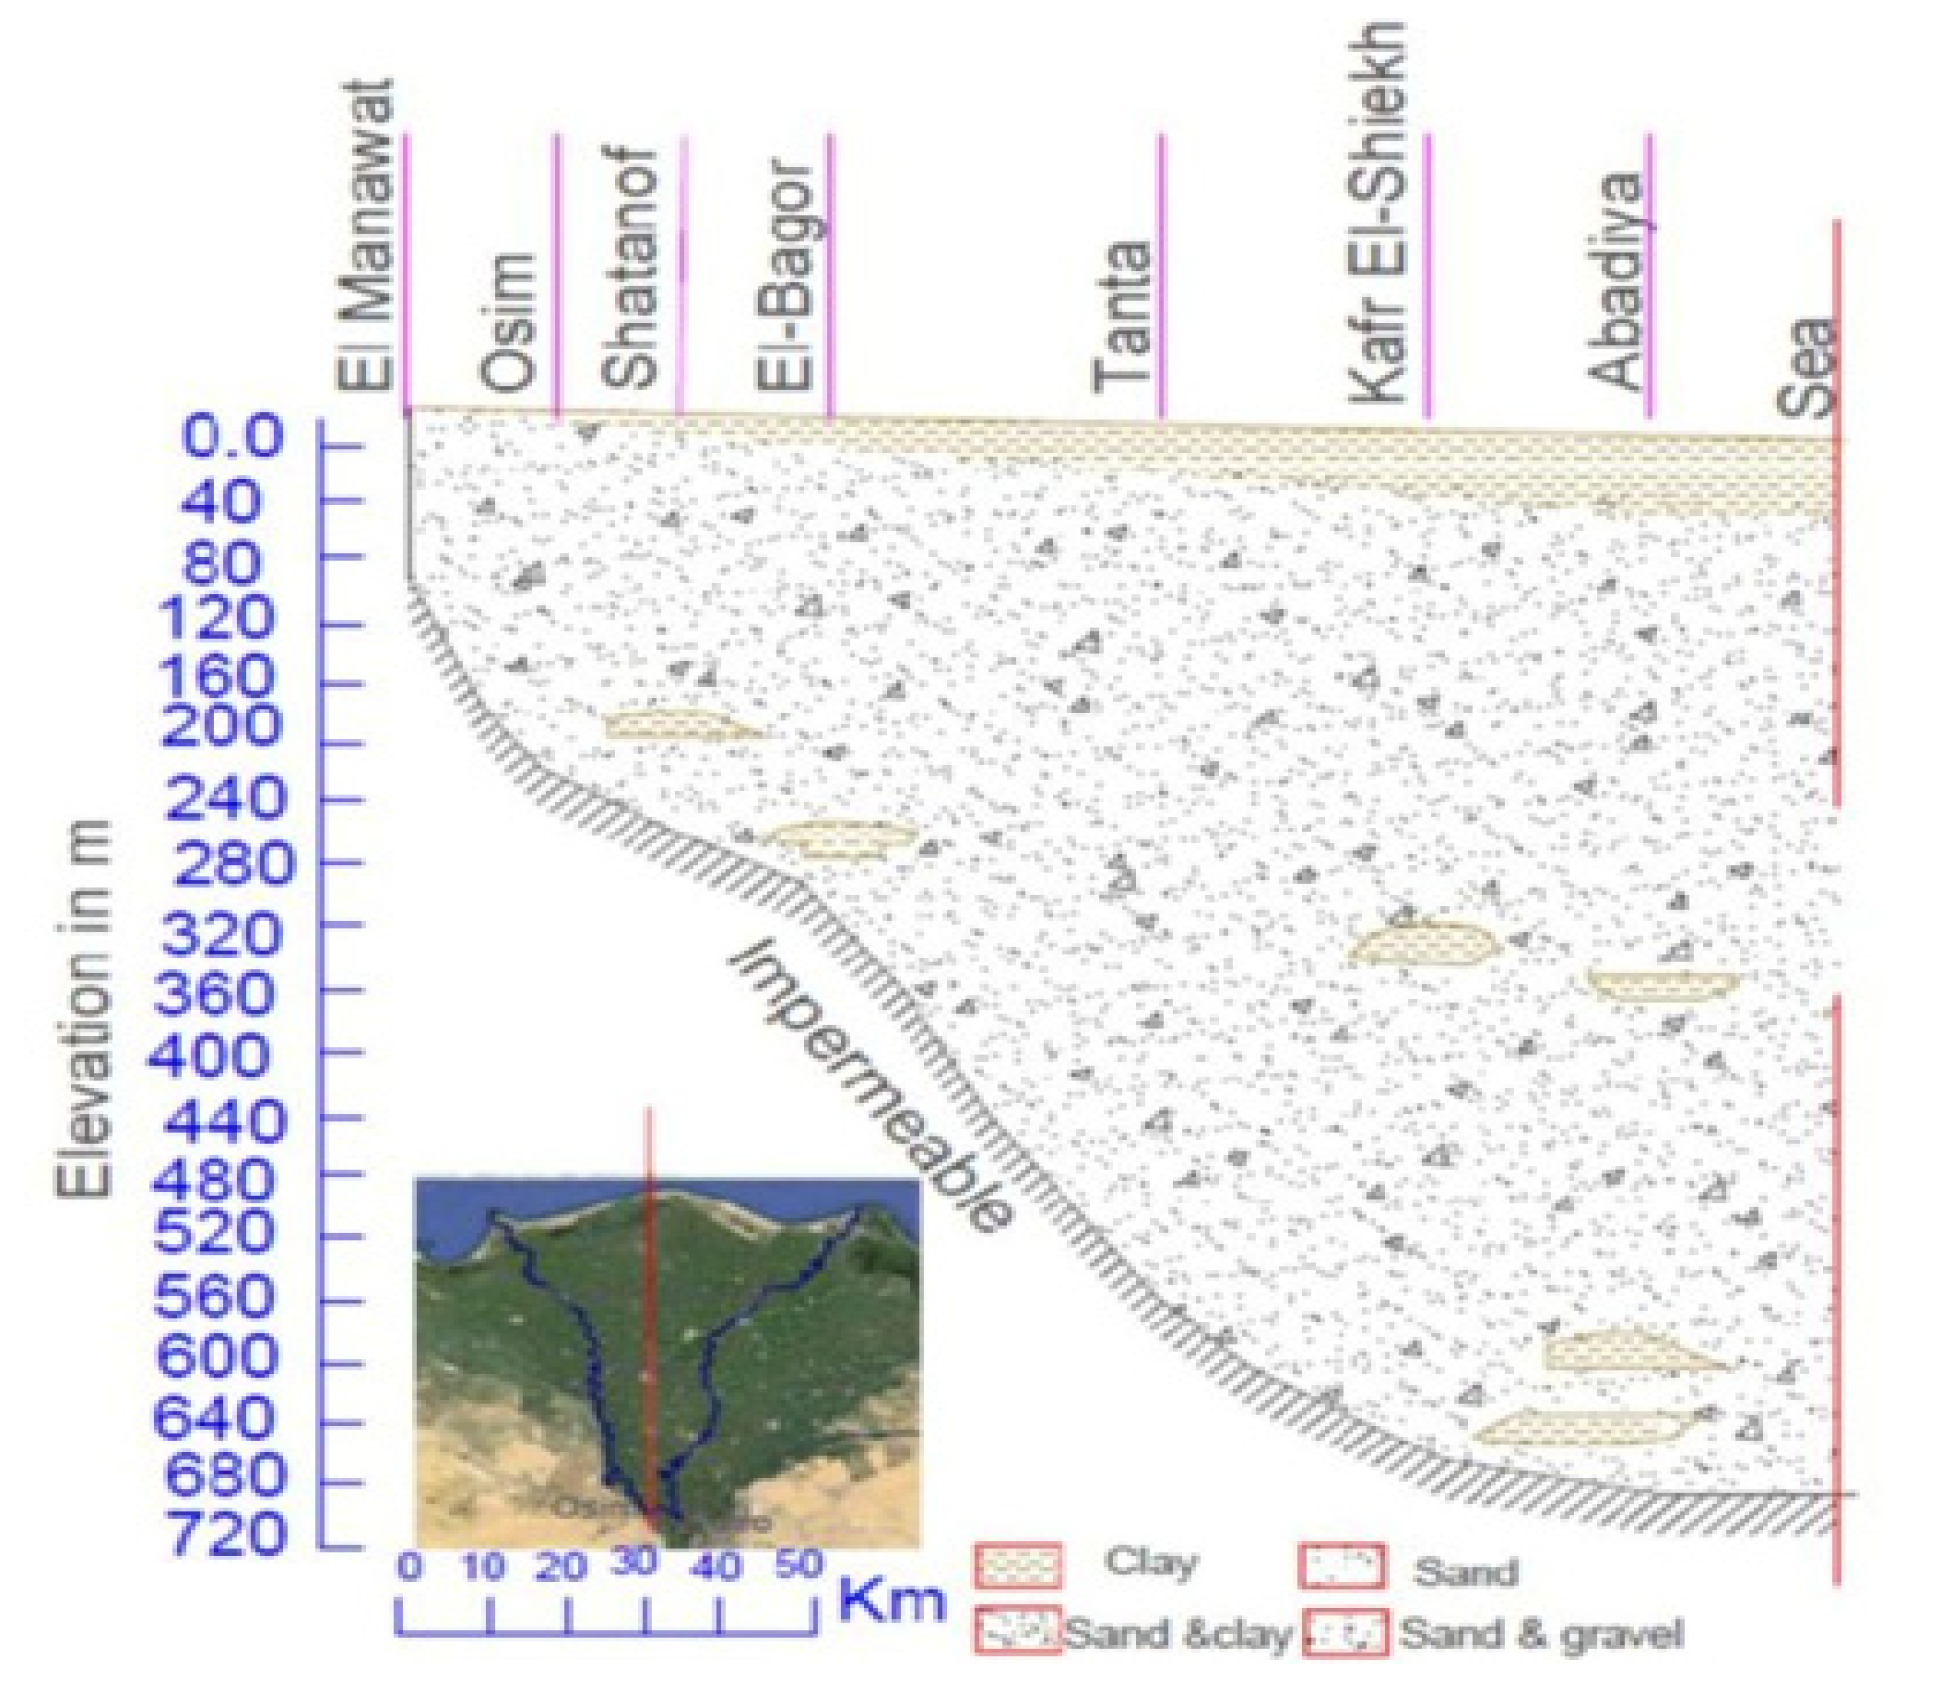
2.1.2. Geology Setting

The geology of this study area is formed from two layers: the upper layer known as the Bilqas formation was laid down in the Holocene age and is made up of alternating fine to medium-grained sand, silt, and clay interbeds, and the lower layer which functions as a semi-confining layer for the aquifer is the Mit-Ghamr formation, which includes organic matter and peat beds [26]. The Nile Delta Quaternary aquifer is classified as a semi-confined aquifer [27,28]. Figure 3 presents a vertical section through the formation of aquifer systems in the Nile Delta area, with gradient thickness ranging between more than 800 m in the north and 200 m in Cairo, where the RBF site is located [29]. The depth of groundwater is 2 m in the north, gradually increasing to 5 m in the south [30].

2.1.3. Hydrogeological Systems

Based on the relevant hydrogeological data, the current study area is located on the western fringes of the Greater Cairo area (Giza Governorate) overlying a regional aquifer, the quaternary aquifer of the Nile alluvium, which consists of graded sand and gravel with intercalations of clay lenses at various depths. The aquifer changes from phreatic (where the top silty layer vanishes) to semi-confined (where the silty clay layer appears on the surface). The hydraulic conductivity of the aquifer decreases towards the south and west, where the vertical conductivity of the Holocene clay ranges from 0.001–0.01 m/d [32], that of the Pleistocene sand ranges from 3.6–24.0 m/d [33], and the common value of effective porosity ranges from 0.05–0.45 [34] for the reservoir. Surface water is represented by the Nile to the east, with a water hydrograph showing from 16.00 to 16.40 m3·sec−1 according to Embaba water plant measurements [25]. The groundwater reservoir is over 60 m in depth, with the groundwater flow direction and the piezometric heads presented in Figure 4, which also shows the effects of abstraction wells in the south-west by the Remayyah Golf Club, which cause a reduction in piezometric water head in a westerly direction. The water quality of this aquifer shows variations in salinity ranging from less than 100 up to 1000 ppm, while the river Nile total dissolved soilds (TDS) values are close to 260 ppm [35].

2.2. Embaba River Bank Filtration Site

In 2015, the Holding Company for Water and Wastewater [36] drilled six pumping wells (PW) at the current RBF case study site at Embaba, Nile Delta, Egypt, close to the river Nile. The schematic PW depth ≈ 54 m, 450 mm in diameter with a discharge of 150 m3/h for each well, and total capacity ranging from 14,000 to 21,000 m3/day, as shown in Figure 2b. The distance between the wells and the river bank ranged between 10 and 15 m, and, moreover, four test wells each with a depth of 64 m and a maximum diameter of 216 mm were drilled to identify the lithology. Two further test wells, each with a depth of 30 m, were sunk, one beside the river and the other further inland, each with a diameter of 100 mm. Multiple core samples from all wells were taken to the HCWW laboratory [25,37]. The location was valid for RBF as the Nile naturally recharges the aquifer. The results show good values of total dissolved solids (TDS) and NH4, compatible with the Egyptian drinking water standards.

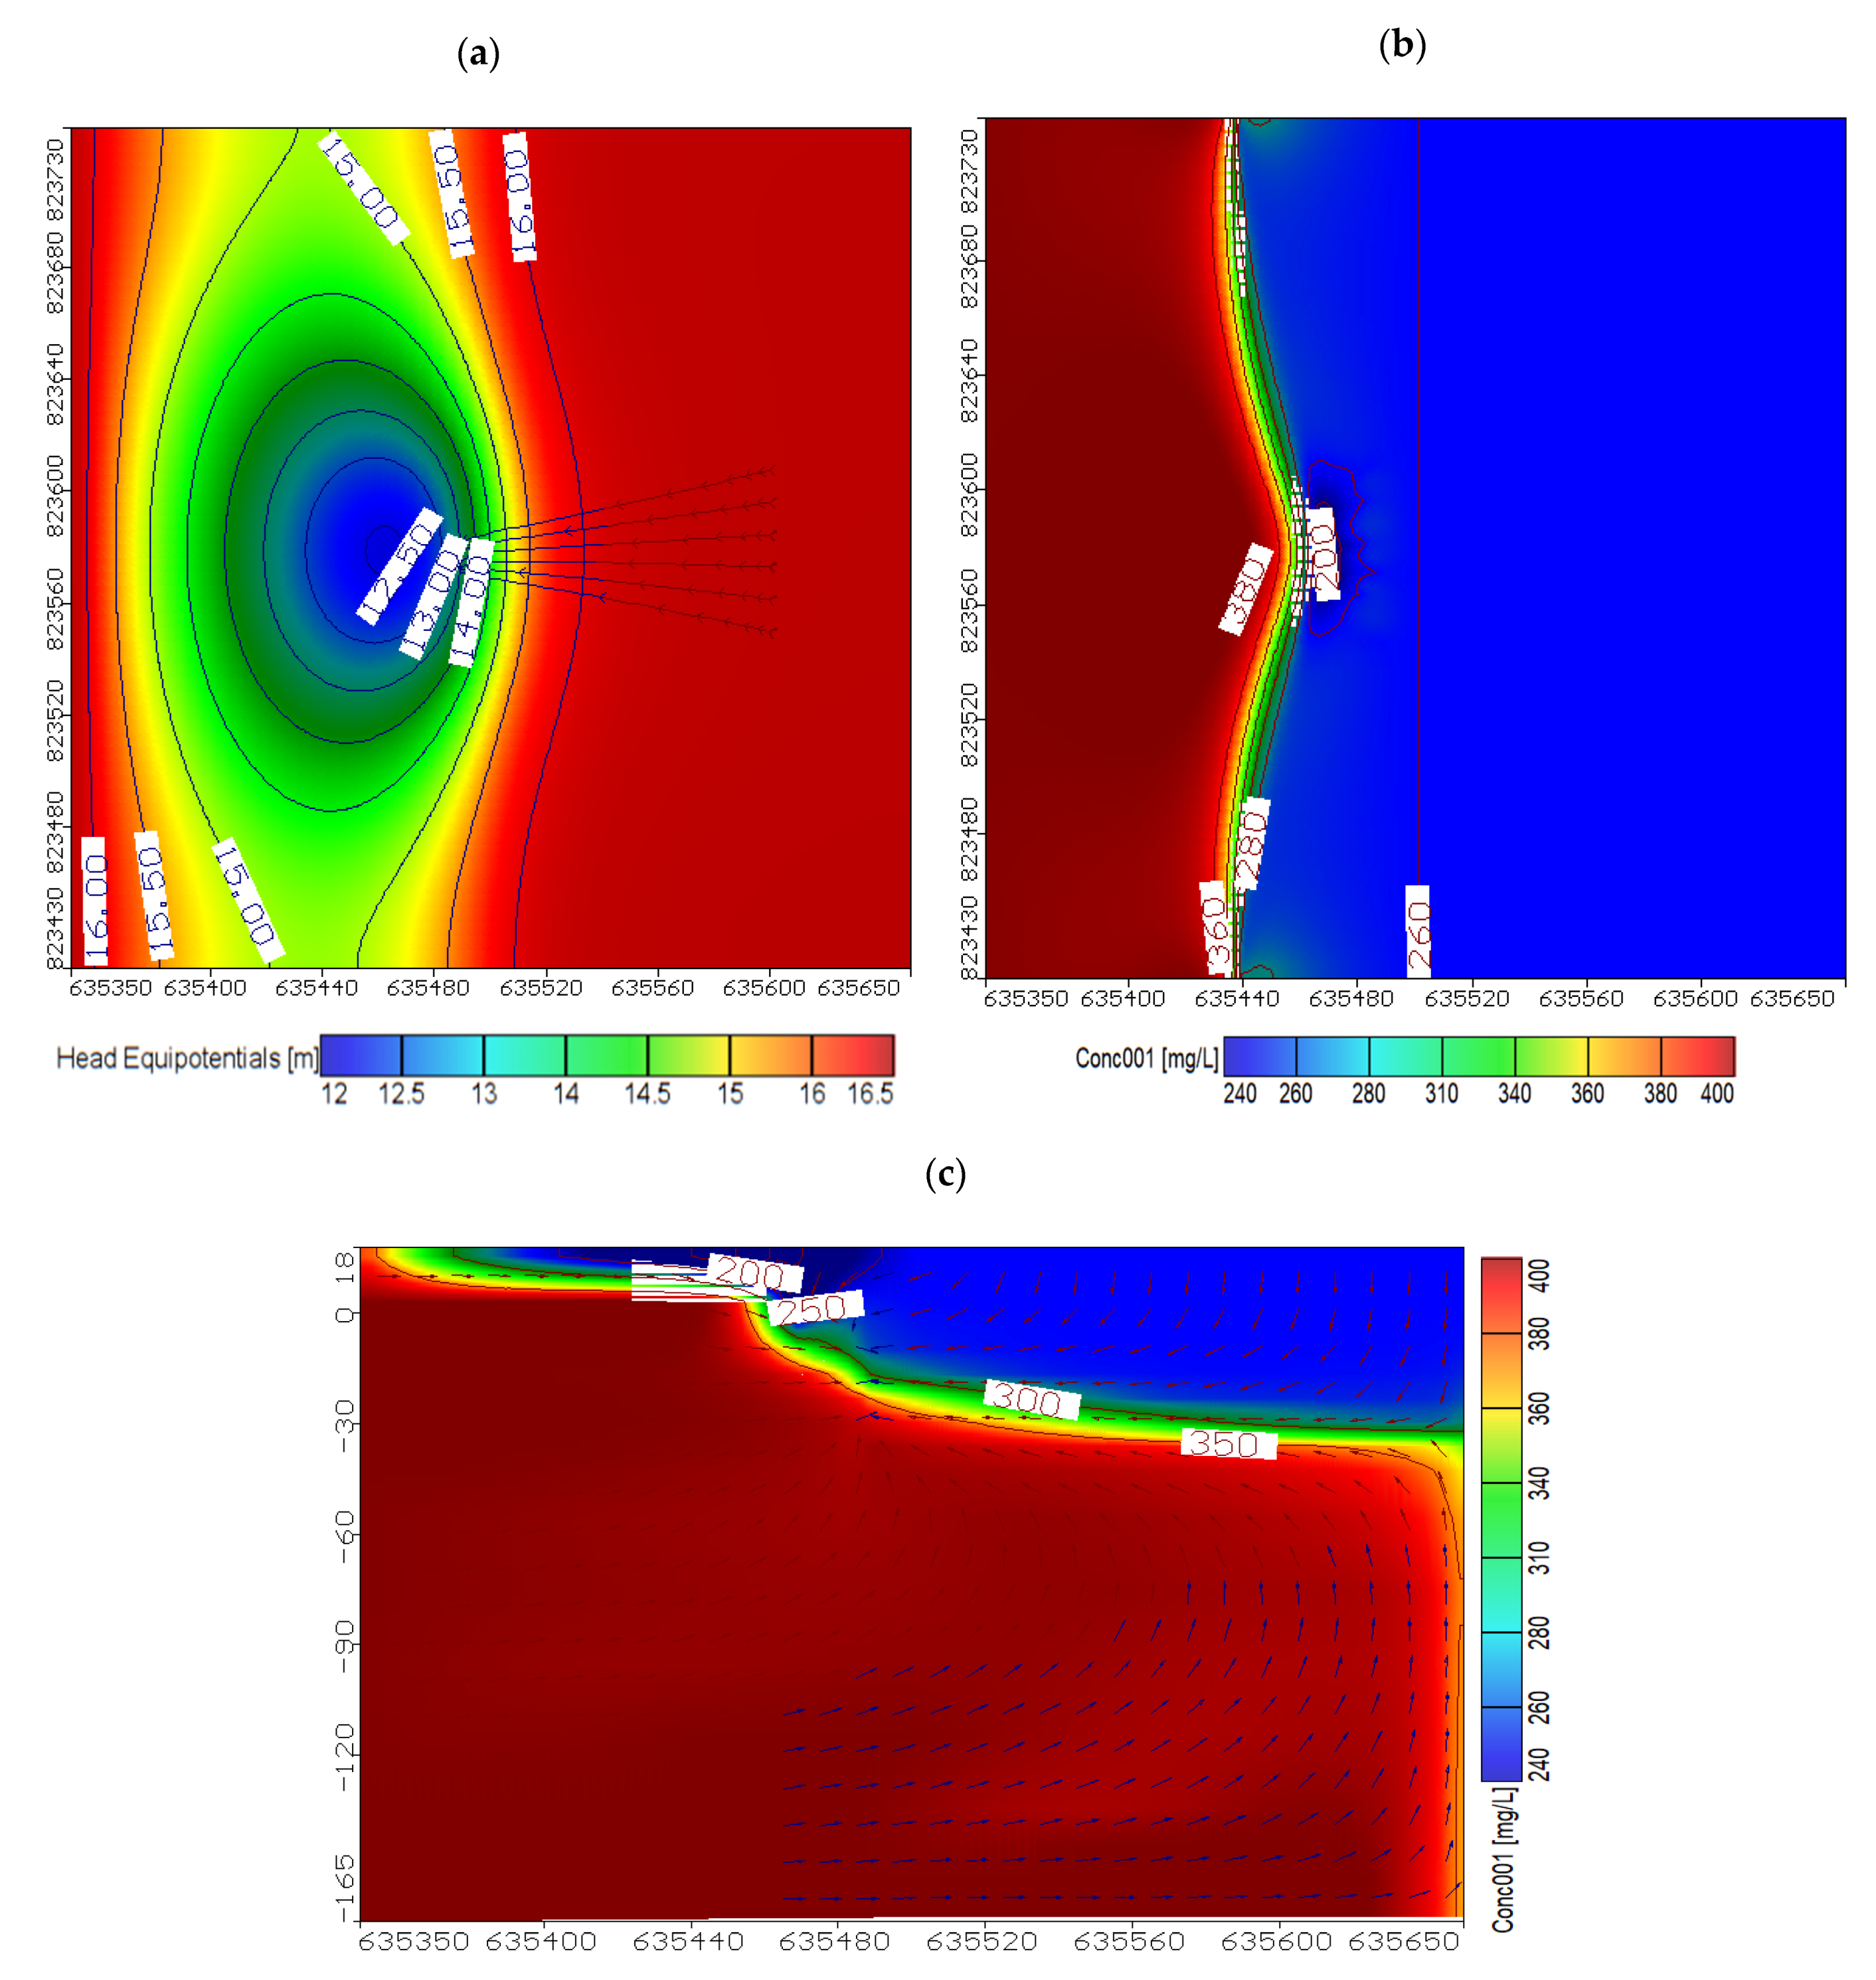
2.3. Contaminant Transport Model

The numerical model was used to investigate the potential of this system by simulating the RBF water quality for the current situation and different scenarios. The MT3D code was used to simulate the solute transport model and the partial differential equation [38]:
[ θ C K ] t = X i [ θ D u C K X j ] X i [ θ V i C K ] + q s C s k + R n
where Ck: concentration of species k, [ML−3], θ: porosity [−], t: time[T], Du: hydrodynamic dispersion coefficient [L2T1], Vi: seepage or linear water velocity [LT−1]; qs: volumetric flux of water per unit volume [Tˉ1], C s k : concentration of sources or sinks of species k [ML−3], and Rn: chemical reaction term [ML−3T−1].
The MODPATH code was used in a quasi-analytic scheme for particle tracking, based on the assumption that the velocity component in each direction varies linearly in a grid cell in the direction of its coordinate. This hypothesis allows for an analytical expression describing the flow path in the grid cell. Given the initial position of the particle at any point in the cell, it is possible to calculate the coordinates of any other point along its path line within the cell and the time of travel between them SWS [39].

2.3.1. Design and Setup of Model

The model covered a square area of 900 m2 [300 m length × 300 m width], which it divided into 60 columns and 60 rows with a square mesh size of 6.25 m2 [2.5 m × 2.5 m], as shown in (Figure 5b). The model depth was divided into six layers, whereby the thickness of the first layer represented the clay cap with 5.8 m and the other layers of the Quaternary aquifer with a thickness of about 42 m, as presented in Figure 5a.

2.3.2. Boundary Conditions and Hydraulic Parameters

The boundary conditions for the NDA were assigned using a river package where the river Nile was assigned at the east side with stage starts from 16.17 to 16.15 (masl) at the south side. The northern and southern boundaries had no-flow boundaries. However, along the model’s western boundary a general head boundary (GHB, Cauchy BC) representing the unaffected groundwater head was set, starting from 16.18 to 16.20 (masl) at a distance of 150 m from the river Nile, where the natural groundwater slope was assigned 0.083‰ [25]; these values were based on the groundwater map published by [23]. Figure 5a,b show the study area boundary conditions. The aquifer hydraulic parameters including hydraulic conductivity [K] ranged from 0.25 to 5 m per day [m/day] for the clay cap and the fine sand top layer, while the course of coarse Quaternary sand ranged from 10 to 60 m/day. The storage coefficient [S] for the upper layers was 10−3–5 × 10⁻³ and 2.5 × 10⁻³ for the lower layers, the specific storage [Ss] ranged from 0.1 to 0.2, and effective porosity from 40% to 25% [Table 1]. The total abstraction from the study area reached 50,000 cubic meters per day (m3/day), while the average net recharge was 0.5 mm/day [40]. A constant concentration of 260 ppm was assigned along the river boundary, and initial concentration was set at 1000 ppm [41]. These parameters are reported by [42,43].

2.4. Model Calibration

The model calibration started with a comparison of the simulated head with the measured data from the observation wells using the piezometric contour map of Greater Cairo developed by [23] (see Figure 4). The flow model was calibrated for steady-state by changing the aquifer hydraulic conductivity using a trial-and-error approach to match the model results and piezometric head. Figure 6 shows the difference between the calculated and observed heads, where the root mean square [RMS] and normalization root mean square reached 0.366 m and 8.135%, respectively; the correlation coefficient also reached 94%.
The groundwater head ranged from 13 to 15 (masl) as shown in Figure 7a, and TDS in the study area ranged from 250 to 350 ppm at layer #2 as presented in Figure 7b,c. The travel time for river particles was calculated for the transverse flow paths to redirect the trace and reverse trace particles, which were simulated using the Visual Modflow mod-path, assigning particles in the middle of the simulated river at a distance of 75 m from the shore line and 90 m from the pumping wells along the river. Using forward tracking, the travel time reached 200 days, as presented in Table 2.
The solute transport model was calibrated by changing the hydraulic conductivity of the clogging bed layer (kclogging) on the RBF portion by 0.01 × 10⁻⁵, 0.1 × 10⁻⁵, 0.2 × 10⁻⁵, 0.5 × 10⁻⁵, 1 × 10⁻⁵ and 1.16 × 10⁻⁵ m/s. Figure 8 shows that the relationship between kclogging and RBF share reached 46.54%, 62.07%, 65%, 66.59%, 66.71% and 66.88%. The model results give a good match with the field measurements and the numerical investigation by [20,25,37], where the RBF portion at Embaba, Nile Delta, Egypt is around 60%, which corresponds to kclogging of 0.5 × 10⁻⁵ m/s (0.43 m/day).

3. Results and Discussion

The influence of climate change on the availability and quality of both surface- and ground-water resources is well recognized nowadays [44,45,46,47]. The impact of climate change on the share of the bank filtration technique is calculated using the mean value of conservative species of TDS. This selection of the TDS parameter in the evaluation of RBF systems was based on the published field investigation maps for groundwater salinity for this study area, and this parameter is also a very important indicator for groundwater quality in arid and semi-arid regions.
The percentage of bank filtrate in the pumped water was calculated with the following equation:
RBF P % = ( TDS ) G W ( TDS ) R B F ( TDS ) G W ( TDS ) R i v e r
where (TDS)GW is the concentration of TDS in the aquifer around the pumping well, (TDS)RBF is the concentration of TDS in pumped water after using a filter, and (TDS)River is the concentration of TDS in the surface water or river.
Particle tracking was used to calculate the travel time of river particles to the top of the RBF well screens by adding a line of particles in the centre of the river in layer #2 of the model at a distance of 90 m from the RBF wells using forward tracking (Figure 7a).

3.1. Impact of River Boundary Stages on RBF Portion

Four scenarios were enacted to estimate the RBF efficiency for decreasing the river stage to reach 75%, 50%, 25%, and 12.5% from the base case, where the river boundary was changed to start from 14.70, 13.23, 11.17, 9.77 m and end at 14.68, 13.21, 11.15 and 9.75 m, respectively. The RBF portion reached 61.05%, 49.20%, 35.46%, and 32.11%, respectively, compared with 67.42% for the base case (see Table 2). Figure 9 shows the relationship between the different river stages with the percentage of RBF portion, whereby the results indicate that this system has high sensitivity to the river stage. Moreover, Figure 13a presents the vertical distribution of TDS in the study area for a 50% reduction in river stage. The expected impacts of climate change on the RBF system in this scenario are shown in Table 2, where the travel time reached 220, 280, 800 and 1000 days, respectively. The results show a corresponding decrease in the RBF portion and increase in travel time as the river stage drops due to climatic changes, so the RBF system requires high heads for increasing the system portion and sustainability.

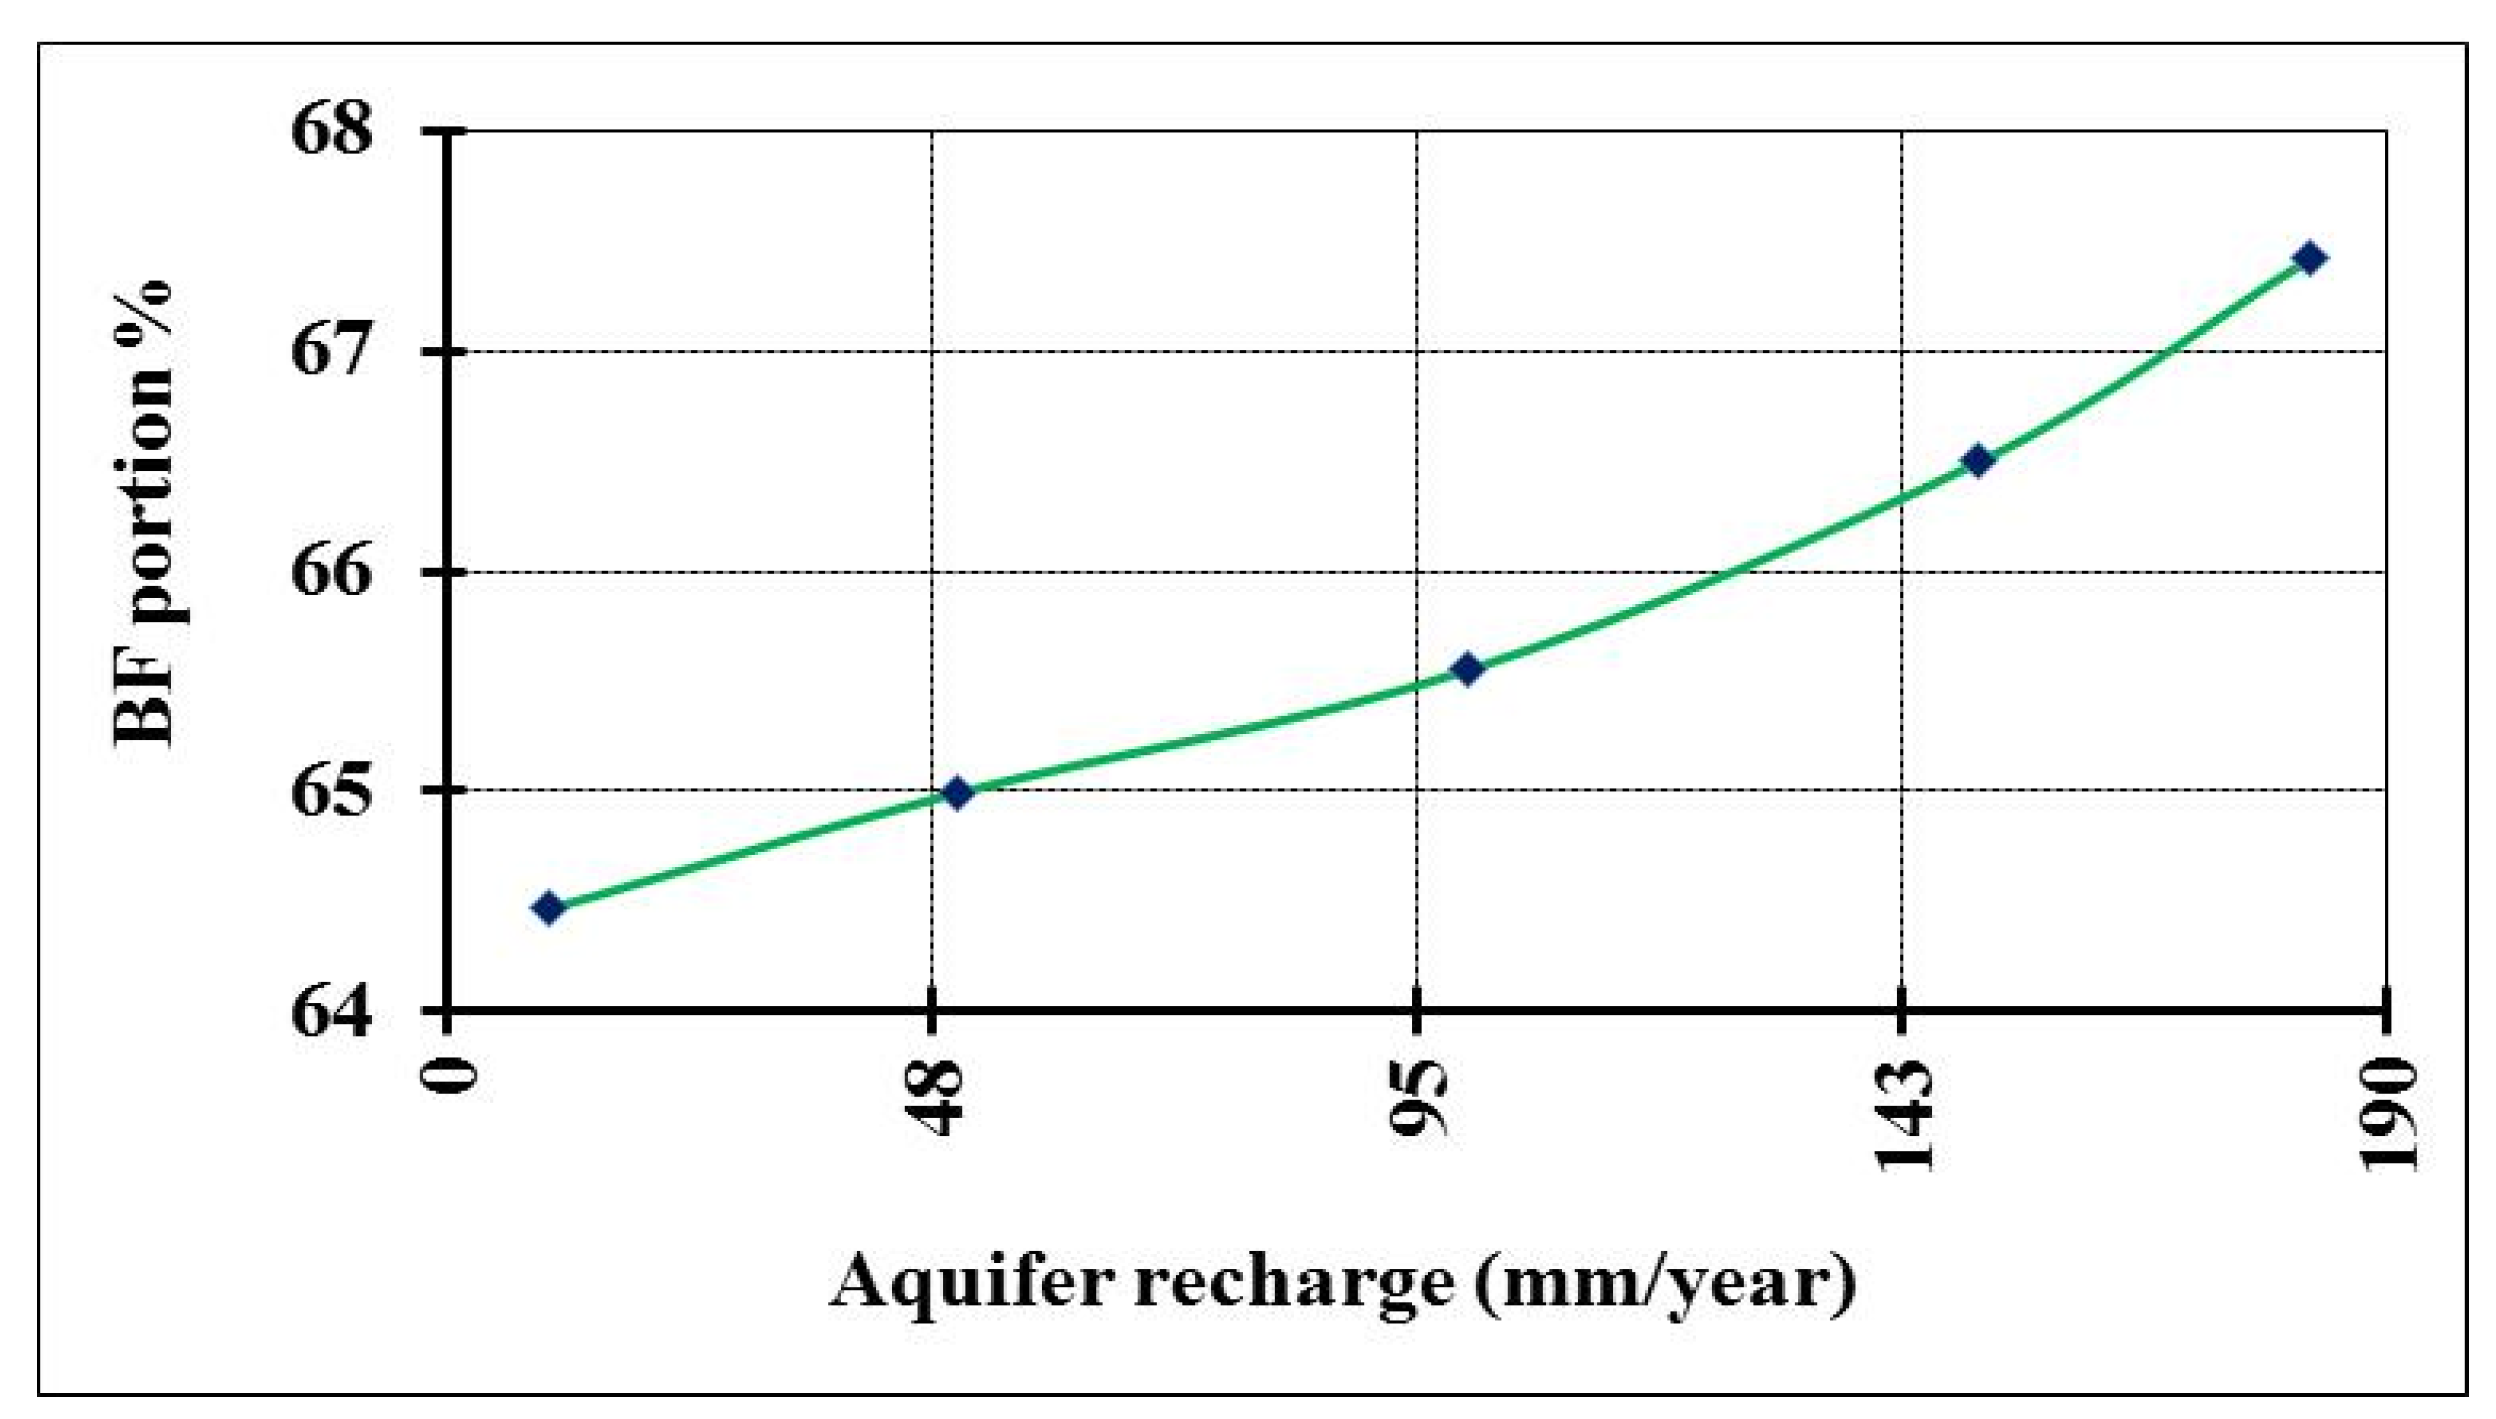
3.2. Impact of Aquifer Recharge Reduction on RBF Portion

Figure 10 shows the results of numerical simulation changing the aquifer recharge based on the expected scenarios of climate change for the charge by 182.5, 150, 100, 50, and 10 mm per year. The results of the RBF portion reached 67.42%, 66.50%, 65.55%, 64.99%, and 64.47%, respectively, while the travel time reached 200 days for all scenarios (see Table 2). Moreover, the TDS distribution for a reduction in aquifer recharge to value 100 mm per year is presented in Figure 13b. The results also show that low values of rainfall in arid and semi-arid regions have an effect on RBF portion, but no effect on particle travel time.

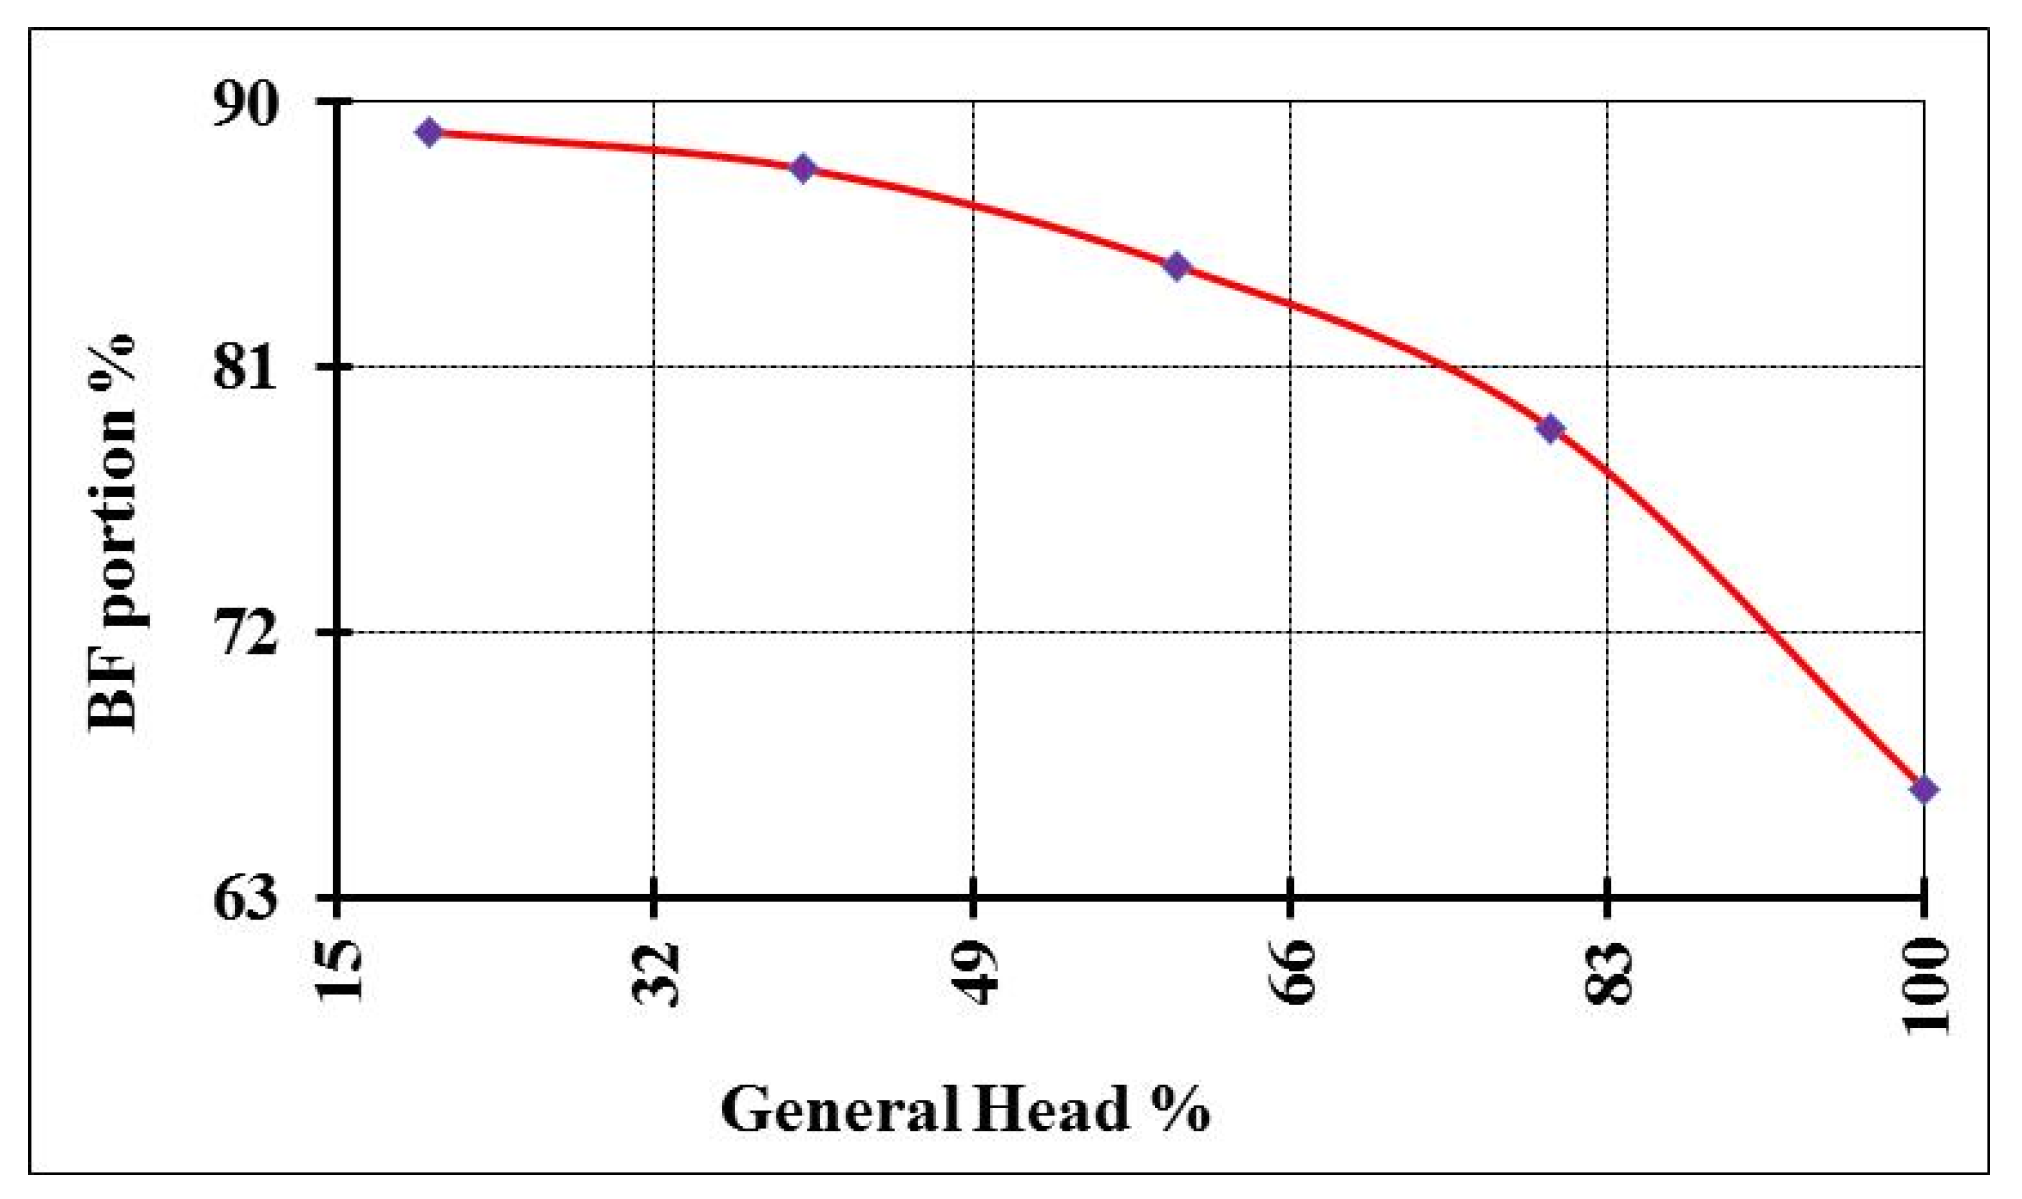
3.3. Effect of General Head Reduction on RBF Portion

The General Head Boundary [GHB, Cauchy BC] was studied as a product of decreasing groundwater levels due to increased groundwater abstraction as a result of overpopulation. The current scenarios involved reduction of groundwater levels to reach 80%, 60%, 40%, and 20% from the base case. The GHB changed, starting at 12.90, 9.68, 6.45, and 3.22 (masl) and ending at 12.15, 8.10, 4.05, and 2.03 (masl). The simulation results show that decreasing the GHB led to increased RBF portion due to changing groundwater flow direction from the high level at the riverside to the low level at GHB. Moreover, Figure 11 and Table 2 show the RBF portion reaching 78.94%, 84.43%, 87.75%, and 89%, while the travel time reached 140, 95, 80, and 70 days. Moreover, the results of TDS distribution at 50% reduction in GHB are shown in Figure 13c. These results confirm that decreasing groundwater heads led to an increase in RBF portion and a decrease in travel time due to an increased slope of groundwater heads from the river to land-side.

3.4. Combined Effects of River Stage, General Head and Groundwater Recharge on RBF Portion

This part of the study was carried out using a combination of a reduction in river stage with groundwater recharge and with general head as a result of climatic changes in arid and semi-arid regions. The river stage and the GHB boundary were reduced to 75%, 50%, 25%, and 12.50% from the base case, while the aquifer recharge was changed by 150, 100, 50, and 10 mm per year. The RBF portion and the travel time are presented in Figure 12 and Table 2. The results show that reduction in river stage and GHB by 75% and 50% with aquifer recharge of 150, 100 mm/yr increased the RBF portion to 67.80% and 69.79% with constant particle travel time at 220 days, whereas the RBF portion decreased to 67.24% and 63.10% and the travel time increased to 220 and 240 days with further reduction in river stage and GHB by 25% and 12.50%, and aquifer recharge by 50 and 10 mm/yr, respectively. Moreover, Figure 13d shows the distribution of TDS at 50% reduction in river stage and GHB with aquifer recharge at 100 mm/yr. These scenarios indicate that surface water and groundwater boundary conditions are more critical for using RBF in arid and semi-arid regions to decrease the negative impacts of climate change on river water quality and groundwater recharge, whereby this system is the key to improving water quality management and sustainability in these regions.

4. Conclusions

RBF sustainability takes into account current and future climate changes. As this technology actually provides surface water from rivers or streams through bank-side aquifers, which depend on the stage of the river and the head of groundwater, the quality of the water in rivers and aquifers is an important factor. MT3D code was used to run the simulations in this study at the RBF site at Embaba, Giza Governorate, Egypt. The RBF portion and the travel time of river particles were investigated for the base case in the Nile Delta aquifer, and four scenarios involving changes in river stages, aquifer recharge, and General Head Boundary [GHB] were applied, followed by combinations of these scenarios. The simulation results indicate that the RBF portion reached 67.42% and 200 days of river particles travel time for the current situation. Reduction in river stage decreased the RBF portion and increased the travel time of river particles to reach 61.05%, 49.20%, 35.46%, and 32.11%, and 220, 280, 800, and 875 days, respectively. Different reductions in river stage by 75%, 50%, 25%, and12.50% from the base case, as well as changes in aquifer recharge by 150, 100, 50, and 10 mm, caused the RBF portion to reach 66.50%, 65.55%, 64.99%, and 64.47%, respectively, while the travel time remained at 200 days for all scenarios. The GHB was also a factor, decreasing the particle travel time to 140, 95, 80, and 70 days while the RBF portion increased to 78.94%, 84.43%, 87.75%, and 89% with reduction in GHB by 75%, 50%, 25%, and12.50% from the base case, whereby the flow increased in the direction from the river to the aquifer. A combination of the three scenarios produced an increase in the RBF portion to 67.80% and 69.79% with constant particle travel time at 220 days and reduction in river stage and GHB by 75% and 50% with aquifer recharges of 150 and 100 mm/yr, respectively. Further reduction in river stage and GHB by 25% and 12.50% with aquifer recharges of 50 and 10 mm/yr led to decreases in the RBF portion to 67.24% and 63.10%, while the travel time increased from 220 to 240 days, respectively. The conclusion of this study is that the effects of climate change are inevitable, and that resorting to unconventional counter-measures will be necessary, such as natural water treatment systems including RBF, taking into account the hydraulic factors which affect it, such as decreases in river level and aquifer recharge, which impact the efficiency of the system. However, RBF is considered to be an effective treatment or pre-treatment method, while intensive withdrawal from the groundwater systems showed a good influence on the effectiveness of the system due to increased flow velocity from the river to these wells.

Author Contributions

Conceptualization, M.Z.; methodology, I.A.-E. and H.M.G.; software, H.M.G.; validation, I.A.-E., and H.M.G.; formal analysis, M.Z.; investigation, O.K.S.; resources, P.M.; data curation, O.K.S.; writing—original draft preparation, I.A.-E.; writing—review and editing, H.M.G. and M.Z.; visualization, I.A.-E.; supervision, M.Z.; project administration, O.K.S.; funding acquisition, P.M. All authors have read and agreed to the published version of the manuscript.

Funding

This research received no external funding.

Acknowledgments

The authors wish to express their sincere appreciation to the Department of Water and Water Structures Engineering, Faculty of Engineering, Zagazig University Egypt, for the instrument and software facilities, as well as the Department of Environmental and Chemical Engineering, University of Calabria, Ponte P. Bucci, 87036 Rende, Italy. Thanks also for the support of project KEGA 059TUKE-4/2019 M-learning tool for intelligent modeling of building-site parameters in a mixed reality environment. This work was supported by the Slovak Research and Development Agency through contract no. APVV-17-0549 Research of knowledge and virtual technologies supporting intelligent design and implementation of buildings with emphasis on their economic efficiency and sustainability.

Conflicts of Interest

The authors declare no conflict of interest.

References

  1. Terink, W.; Immerzeel, W.W.; Droogers, P. Climate change projections of precipitation and reference evapotranspiration for the Middle East and Northern Africa until 2050. Int. J. Climatol. 2013, 33, 3055–3072. [Google Scholar] [CrossRef]
  2. Droogers, P.; Immerzeel, W.; Terink, W.; Hoogeveen, J.; Bierkens, M.; Van Beek, L.; Debele, B. Water resources trends in Middle East and North Africa towards 2050. Hydrol. Earth Syst. Sci. 2012, 16, 3101–3114. [Google Scholar] [CrossRef] [Green Version]
  3. Khaled, A.; Abdel, A. Water Conflicts and Conflict Management Mechanisms in the Middle East and North Africa Region; Centre for Environment and Development for the Arab Region and Europe (CEDARE): Cairo Governorate, Egypt, 2006. Available online: http://water.cedare.int/cedare.int/files15/File2862.pdf (accessed on 13 January 2021).
  4. Abd-Elaty, I.; Zelenakova, M.; Straface, S.; Vranayová, Z.; Abu-hashim, M. Integrated Modelling for Groundwater Contamination from Polluted Streams Using New Protection Process Techniques. Water 2019, 11, 2321. [Google Scholar] [CrossRef] [Green Version]
  5. Bates, B.; Kundzewicz, Z.; Wu, S. Climate Change and Water; Intergovernmental Panel on Climate Change Secretariat: Geneva, Switzerland, 2008.
  6. Abd-Elaty, I.; Eldeeb, H.; Vranayova, Z.; Zelenakova, M. Stability of Irrigation Canal Slopes Considering the Sea Level Rise and Dynamic Changes: Case Study El-Salam Canal, Egypt. Water 2019, 11, 1046. [Google Scholar] [CrossRef] [Green Version]
  7. Abd Ellah, R.G. Water resources in Egypt and their challenges, Lake Nasser case study. Egypt. J. Aquat. Res. 2020, 46, 1–12. [Google Scholar] [CrossRef]
  8. Abdelhafez, A.A.; Metwalley, S.M.; Abbas, H. Irrigation: Water Resources, Types and Common Problems in Egypt. In Technological and Modern Irrigation Environment in Egypt; Springer: New York, NY, USA, 2020; pp. 15–34. [Google Scholar]
  9. Abd-Elaty, I.; Pugliese, L.; Mesaros, P.; El Shinawi, A. Simulation-Based Solutions Reducing Soil and Groundwater Contamination from Fertilizers in Arid and Semi-Arid Regions: Case Study the Eastern Nile Delta, Egypt. Int. J. Environ. Res. Public Health 2020, 17, 9373. [Google Scholar] [CrossRef]
  10. Rucksthuhl, S.; Ward, C. Water Scarcity, Climate Change and Conflict in the Middle East: Securing Livelihoods, Building Peace; Bloomsbury Publishing: New York, NY, USA, 2017. [Google Scholar]
  11. Sprenger, C.; Lorenzen, G.; Hülshoff, I.; Grützmacher, G.; Ronghang, M.; Pekdeger, A. Vulnerability of bank filtration systems to climate change. Sci. Total Environ. 2011, 409, 655–663. [Google Scholar] [CrossRef]
  12. Sharma, L.; Ray, C. A Combined RBF and ASR System for Providing Drinking Water in Water Scarce Areas; Springer: Dordrecht, The Netherlands, 2011; pp. 29–49. [Google Scholar]
  13. Wu, Y.; Hui, L.; Wang, H.; Li, Y.; Zeng, R. Effectiveness of riverbank filtration for removal of nitrogen from heavily polluted rivers: A case study of Kuihe River, Xuzhou, Jiangsu, China. Environ. Geol. 2007, 52, 19–25. [Google Scholar] [CrossRef]
  14. Eckert, P. Risk Assessment for Chemical Spills in the River Rhine; Springer: Dordrecht, The Netherlands, 2011; pp. 69–79. [Google Scholar]
  15. Pholkern, K.; Srisuk, K.; Grischek, T.; Soares, M.; Schäfer, S.; Archwichai, L.; Saraphirom, P.; Pavelic, P.; Wirojanagud, W. Riverbed clogging experiments at potential river bank filtration sites along the Ping River, Chiang Mai, Thailand. Environ. Earth Sci. 2015, 73, 7699–7709. [Google Scholar] [CrossRef]
  16. Abdalla, F.; Shamrukh, M. Riverbank Filtration: Developing Countries Choice for Water Supply Treatment, Egypt Case. In Proceedings of the 1st International Water Association IWA Malaysia Young Water Professionals Conference (IWAYWP2010), Negeri Sembilan, Malaysia, 16–19 December 2010. [Google Scholar]
  17. Wahaab, R.A.; Salah, A.; Grischek, T. Water Quality Changes during the Initial Operating Phase of Riverbank Filtration Sites in Upper Egypt. Water 2019, 11, 1258. [Google Scholar] [CrossRef] [Green Version]
  18. Becker, M.W.; Schuetz, J.W. An introduction to ground-water modeling using virtual reality modeling language (VRML). J. Geosci. Educ. 2003, 51, 506–511. [Google Scholar] [CrossRef]
  19. Umar, D. An overview assessment of the effectiveness and global popularity of some methods used in measuring riverbank filtration. J. Hydrol. 2017, 550, 497–515. [Google Scholar] [CrossRef]
  20. Paufler, S.; Grischek, T.; Bartak, R.; Ghodeif, K.; Wahaab, R.; Boernick, H. Riverbank filtration in Cairo, Egypt: Part II—detailed investigation of a new riverbank filtration site with a focus on manganese. Environ. Earth Sci. 2018, 77, 1–14. [Google Scholar] [CrossRef]
  21. Schoenheinz, D.; Grischek, T. Behavior of dissolved organic carbon during bank filtration under extreme climate conditions. In Riverbank Filtration for Water Security in Desert Countries; Springer: Dordrecht, The Netherlands, 2011; pp. 51–67. [Google Scholar]
  22. Capmas. Egypt Census 2020. Egyptian Central Agency for Public Mobilization and Statistics: Cairo, Egypt. Available online: https://www.capmas.gov.eg/Pages/populationClock.aspx (accessed on 2 January 2021).
  23. El-Arabi, N.; Fekri, A.; Zaghloul, E.; Elbeih, S.; Laake, A. Assessment of Groundwater Movement at Giza Pyramids Plateau Using GIS Techniques. J. Appl. Sci. Res 2013, 9, 4711–4722. [Google Scholar]
  24. Mahmoud, S.H. Investigation of rainfall–runoff modeling for Egypt by using remote sensing and GIS integration. Catena 2014, 120, 111–121. [Google Scholar] [CrossRef]
  25. Ghodeif, K.; Paufler, S.; Grischek, T.; Wahaab, R.; Souaya, E.; Bakr, M.; Abogabal, A. Riverbank filtration in Cairo, Egypt—part I: Installation of a new riverbank filtration site and first monitoring results. Environ. Earth Sci. 2018, 77, 1–11. [Google Scholar] [CrossRef]
  26. Said, R. The Geology of Egypt; Routledge: New York, NY, USA, 2017. [Google Scholar]
  27. Ball, J. Contribution to the Geography of Egypt; Government Press: Washington, DC, USA, 1952. [Google Scholar]
  28. Sabry, A. Chapter 2 Geological Settings Nile Delta; Springer: Dordrecht, The Netherlands, 2016. [Google Scholar]
  29. RIGW. Hydrogeological Map of Egypt; National Water Research Center: Fountain Valley, CA, USA, 1992. [Google Scholar]
  30. RIGW. Monitoring of Groundwater Microbiological Activities in the Nile Delta Aquifer; National Water Research Center: Fountain Valley, CA, USA, 2002. [Google Scholar]
  31. Sherif, M. Assessment, modeling and management of seawater intrusion in the Nile delta aquifer. In Tecnología De La Intrusión De Agua De Mar En Acuíferos Costeros: Países Mediterráneos© Igme; Instituto Geológico y Minero de España: Madrid, Spain, 2003. [Google Scholar]
  32. Leaven, M. Hydrogeological Study of the Nile Delta and Adjacent Desert Areas, Egypt, with Emphasis on Hydrochemistry and Isotope Hydrology; Free University of Amsterdam: Amsterdam, The Netherlands, 1991. [Google Scholar]
  33. Sefelnasr, A.; Sherif, M. Impacts of seawater rise on seawater intrusion in the Nile Delta aquifer, Egypt. Groundwater 2014, 52, 264–276. [Google Scholar] [CrossRef]
  34. Helalia, A.M. The relation between soil infiltration and effective porosity in different soils. Agric. Water Manag. 1993, 24, 39–47. [Google Scholar] [CrossRef]
  35. Omran, E.-S.E. Land and Groundwater Resources in the Egypt’s Nile Valley, Delta, and Its Fringes. In Groundwater in the Nile Delta; Negm, A.M., Ed.; Springer International Publishing: Cham, Switzerland, 2019; pp. 45–103. [Google Scholar]
  36. HCWW. Internal Report; Holding Company for Water and Wastewater: Cairo Governorate, Egypt, 2017. [Google Scholar]
  37. Ghodeif, K.; Grischek, T.; Bartak, R.; Wahaab, R.; Herlitzius, J. Potential of river bank filtration (RBF) in Egypt. Environ. Earth Sci. 2016, 75, 671. [Google Scholar] [CrossRef]
  38. Javandel, I.; Doughty, C.; Tsang, C.-F. Groundwater Transport: Handbook of Mathematical Models; Lawrence Berkeley Lab.: Berkeley, CA, USA, 1984. [Google Scholar]
  39. SWS. User’s Manual; SWS: Toronto, ON, Canada, 2010; Volume N2L 5J2. [Google Scholar]
  40. Abd-Elaty, I.; Abd-elhamid, H.; Fahmy, M.; Abd-Elaal, G. Study of Impact of some changes on groundwater system in Nile delta aquifer. Egypt. J. Eng. Sci. Technol. 2014, 17, 10–11. [Google Scholar] [CrossRef]
  41. Al-Agha, D.E.; Closas, A.; Molle, F. Survey of groundwater use in the central part of the Nile Delta. In Water and Salt Management in the Nile Delta: Report; IWMI: Gujarat, India, 2015. [Google Scholar]
  42. El-Atfy, H. Integrated National Water Resources Plan in Egypt; Ministry of Water Resources and Irrigation Alexandria Governorate: Governorate, Egypt, 2007.
  43. Morsy, W. Environmental Management to Groundwater Resources for Nile Delta Region. Ph.D. Thesis, Cairo University, Giza, Egypt, 2009. [Google Scholar]
  44. Abd-Elaty, I.; Sallam, G.A.; Straface, S.; Scozzari, A. Effects of climate change on the design of subsurface drainage systems in coastal aquifers in arid/semi-arid regions: Case study of the Nile delta. Sci. Total Environ. 2019, 672, 283–295. [Google Scholar] [CrossRef] [PubMed]
  45. Abd-Elhamid, H.F.; Abd-Elaty, I.; Hussain, M.S. Mitigation of seawater intrusion in coastal aquifers using coastal earth fill considering future sea level rise. Environ. Sci. Pollut. Res. 2020, 27, 23234–23245. [Google Scholar] [CrossRef] [PubMed]
  46. Abd-Elaziz, S.; Zelenakova, M.; Mesaros, P.; Purcz, P.; Abd-Elhamid, H.F. Anthropogenic Activity Effects on Canals Morphology, Case Study: Nile Delta, Egypt. Water 2020, 12, 3184. [Google Scholar] [CrossRef]
  47. Abd-Elhamid, H.F.; Zelenakova, M.; Vranayova, Z.; Fathy, I. Evaluating the Impact of Urban Growth on the Design of Storm Water Drainage Systems. Water 2020, 12, 1572. [Google Scholar] [CrossRef]
Figure 1. RBF-River Bank Filtration modified from (Wahaab et al., 2019) [17].
Sustainability 13 01897 g001
Figure 2. (a) Lower Egypt map and (b) RBF location [25].
Sustainability 13 01897 g002
Figure 3. Vertical formation of aquifer systems in the Nile Delta area [31].
Sustainability 13 01897 g003
Figure 4. Piezometric contour map of Greater Cairo area in 1982, modified from [23].
Sustainability 13 01897 g004
Figure 5. Study area digitizing with boundary conditions for (a) section X- X and (b) Aerial view.
Sustainability 13 01897 g005
Figure 6. Calculated head with VISUAL MOD flow and observed field head
Sustainability 13 01897 g006
Figure 7. Model calibration results for base case; (a) Aerial view of head and path line, (b) Aerial view of total dissolved solids (TDS) contamination, and (c) Vertical cross section for distribution of TDS
Sustainability 13 01897 g007
Figure 8. Relationship between River Bank Filtration (RBF) share and hydraulic conductivity of the clogging layer.
Sustainability 13 01897 g008
Figure 9. Relationship between RBF portion % and river stage.
Sustainability 13 01897 g009
Figure 10. Relationship between RBF portion % and aquifer recharge.
Sustainability 13 01897 g010
Figure 11. Relationship between RBF portion % and general head.
Sustainability 13 01897 g011
Figure 12. Relationship between RBF portion % and combination of river stage, groundwater recharge and general head.
Sustainability 13 01897 g012
Figure 13. Vertical distribution of TDS in study area for different boundary conditions.
Sustainability 13 01897 g013
Table 1. Hydraulic parameters of the study area.
Main Hydraulic UnitsLayer #Hydraulic ConductivityStorage CoefficientSpecific YieldEffective Porosity
KhKvSSsn
m/daym/day-1/m%
Clay cap10.25–50.025–0.510−30.140
Coarse sand Quaternaryfrom 2 to 625–702.5–72.5 × 10−30.225
Note: # refers to layer number.
Table 2. RBFE and travel time for different boundary conditions.
Item ScenarioRBF Efficiency (%)Travel Time (Day)
CaseValue
1base-67.42200
2River stage reduction (%)From 14.68 to 14.70 m61.05220
3From 13.21to 13.23 m49.2280
4From 11.15 to 11.17 m35.46800
5From 9.72 to 9.77 m32.11875
6Aquifer recharge reduction [mm/y]15066.5200
710065.55200
85064.99200
91064.47200
10General head reduction (m)From 12.90 to12.92 m78.94140
11From 9.67 to 9.6984.4895
12From 6.45 to 6.47 m87.7580
13From 3.22 to 3.24 m8970
14Combination of river stage and general head reduction (%) with aquifer recharge reduction(mm/y)75% with 150 mm/y67.80220
1550% with 100 mm/y69.79220
1625%with 50 mm/y67.24220
1712.5% with 10 mm/y63.10240
Publisher’s Note: MDPI stays neutral with regard to jurisdictional claims in published maps and institutional affiliations.

