Article

Effect of Soil Management on Erosion in Mountain Vineyards (N-W Italy)

1
Department of Agricultural, Forest and Food Sciences, University of Turin, 10095 Grugliasco, Italy
2
NATRISK, Interdepartmental Research Centre on Natural Risks in Mountain and Hilly Environments, University of Turin, 10095 Grugliasco, Italy
3
Institut Agricole Régional, 11100 Aosta, Italy
*
Author to whom correspondence should be addressed.
Sustainability 2021, 13(4), 1991; https://0-doi-org.brum.beds.ac.uk/10.3390/su13041991
Submission received: 21 December 2020 / Revised: 8 February 2021 / Accepted: 9 February 2021 / Published: 12 February 2021

Abstract

:
We studied the effects of three soil management approaches (permanent grassing, chemical weeding, and buffer strips), and the additional impact of tractor passage on soil erosion in a sloping vineyard located in the inner part of Aosta Valley (N-W Italian Alps). The vineyard rows were equipped with a sediment collection system with channels and barrel tanks. A total of 12 events with sediment production were observed across 6 years, and the collected sediments were weighted and analyzed. Average erosion rates ranged from negligible (mainly in grassed rows) to 1.1 t ha−1 per event (after weeding). The most erosive event occurred in July 2015, with a total rainfall of 32.2 mm, of which 20.1 were recorded in 1 h. Despite the limited number of erosive events observed, and the low measured erosion rates, permanent grassing reduced soil erosion considerably with respect to weeding; buffering had a comparable effect to grassing. The tractor passage, independent of the soil management approaches adopted, visibly accelerated the erosion process. The collected sediments were highly enriched in organic C, total N, and fine size fractions, indicating a potential loss of fertility over time. Despite the measured erosion rates being low over the experiment’s duration, more severe events are well documented in the recent past, and the number of intense storms is likely to increase due to climate change. Thus, the potential effects of erosion in the medium and long term need to be limited to a minimum rate of soil loss. Our experiment helped to compare soil losses by erosion under different soil management practices, including permanent grassing, i.e., a nature-based erosion mitigation measure. The results of the research can provide useful indications for planners and practitioners in similar regions, for sustainable, cross-sectoral soil management, and the enhancement of soil ecosystem services.

1. Introduction

Mountain vineyards are naturally prone to erosion processes, mainly due to steep slopes and complex topography [1]. As reviewed in Geitner et al. [2], accelerated erosion, triggered by water and tillage can impact the main ecosystem services provided by mountain soils, such as runoff regulation, nutrients cycling, water filtration, biodiversity, and cultural and spiritual value. Therefore, conservation practices are needed to warrant a cross-sectoral, sustainable soil management encompassing production and conservation aspects [2].
Nature-based solutions against erosion, such as the use of grassing proved to be very effective for soil conservation in vineyards, as they warrant protection against splash erosion, considerably reduce runoff, and improve the soil structure, but they also contribute to other relevant ecosystem services (e.g., [3,4,5]). In many cases, the possible negative effects of the use of grassing or cover crops (i.e., reduced yield, the spread of pests, competition with vines, etc.) can be avoided with adaptation strategies to local conditions (e.g., fertilization, irrigation, species choice, temporary cover cropping, alternating grass cover on every other inter-row, etc.). Recently, Mercenaro et al. [6] and cited literature reported that grassing did not significantly impact quality and productive performance, and is therefore highly recommended. Finally, Schütte et al. [7] demonstrated that the use of cover crops for grassing in vineyards to prevent erosion is cost-effective if all on- and off-site costs are considered, warranting a wide range of ecosystem services in the long term.
According to CERVIM (Centre for Research, Environmental Sustainability and Advancement of Mountain Viticulture) in Aosta Valley (N-W Italy), in the year 2006, 315 ha of vineyards out of 522 grew on difficult terrain. In particular, 191 ha were on steep slopes (>30%), 315 ha were located above 500 m a.s.l., and 191 ha were terraced [8]. According to the same source, the average size of wineries was very small: 67% of grape growers had a cultivated surface less than 0.2 ha, 31% of the producers had farm surfaces from 0.2 to 1 ha, and only 2% were larger than 1 ha. Despite difficult site conditions, wine production in the region is of a very high quality.
A recent regional estimate (1:100,000) based on the newly released soil map of Aosta Valley [9,10] showed an average soil loss of 9.8 t ha−1 y−1 in vineyards developing on different soil types. Other measures and estimates exist in Aosta Valley region, which is characterized by very heterogeneous soils and climatic regimes. In particular, a very high variability in rainfall can be observed depending on the geographical location (inner valley vs. other portions). For example, Biddoccu et al. [11] estimated an average soil loss of ca. 16 t ha−1 y−1 in a mountain vineyard with 50% slope, located in Aosta, using botanical benchmark techniques.
RUSLE (Revised Universal Soil Loss Equation, by Renard et al. [12]) is still the most adopted erosion estimate method in a wide variety of environments (e.g., [4,13]), and it allows the simulation of erosion scenarios based on changes in rainfall pattern, soil management techniques, soil properties, and vegetation cover. Since the available erosion estimates might exceed the tolerable erosion rates reported for mountain soils e.g., by Alewell et al. [14], the need for validations and site-specific mitigation techniques is urgent.
Our work studied the effect of soil management approaches (permanent grassing, chemical weeding, buffer rows), and tractor passage on soil erosion in an Alpine vineyard, through field measurements, that were then compared to RUSLE estimates.

2. Materials and Methods

2.1. Study Area Location

The study area is a Pinot noir vineyard managed by the Institut Agricole Régional located in Aosta (N-W Italian Alps, Figure 1a,b), at 780 m a.s.l. The average annual temperature is around 10 °C and the average annual precipitation in the city of Aosta is less than 600 mm due to its inner position in Aosta Valley region [15].

2.2. Vineyard Characteristics and Experimental Setting

The vineyard was established around 50 years ago, planted up and down a slope (Figure 1b). It consists of 18 rows with a surface of 47 m2 each and an average slope of 30%.
Three treatments (detail in Figure 1c) were carried out: Chemical weeding—W, permanent grassing—PG, and buffer strip rows—BU, the latter being 10 m long. The grass cover (PG), seeded in 2012 (17 g seed m−2), was a commercial mixture composed of Festuca ovina (60%), Poa pratensis (30%), and Lotus corniculatus (10%). For each plot, 1 inter-row was affected by mechanization, i.e., tractor passage, and 1 was left undisturbed.
A sediment collection system was built at the bottom of each row (white barrels visible in Figure 1b), consisting of a transversal open PVC (Polyvinyl Chloride) channel (diameter 31.5 cm) that collected runoff and sediments, that were finally deposited in a 150-L barrel through a PVC pipe (detail in Figure 1d). After each rainfall event, the collecting system was inspected by the staff of the Institut Agricole Régional to assess the presence of visible sediment deposits in the channels and tanks, i.e., if soil erosion had occurred. Sediments were collected from 2014 (starting 1 April) and then every year onwards, from mid-March to the first or second week of November, depending on the weather, harvest timing, and logistic issues, a minimum of 24 h after each erosive rainfall event, to allow the fine fraction of the sediments to settle. Settled sediments were collected, transported to the laboratory, then dried at 40 °C. The material in the tanks was mixed with the one collected in the pipes and sieved at 2 mm, obtaining the fine earth fraction, and finally weighted. The >2 mm fraction (skeleton) was discarded. Sediment collection was not performed during the late autumn and winter because low temperatures would damage pipes and containers. The collecting systems were stored for the winter season and placed back again every year. The experiment ended in 2019.
A Vantage Pro2 meteorological station (Davis Instruments—Hayward, CA, USA) was installed in the vineyard and started collecting data on the 1 April 2014. The station provided hourly measurements of rainfall (mm), peak rainfall intensity based on the time between successive tips of the rain collector (then reported to 1-h duration), and temperature data (°C). Hourly data were aggregated into daily data to obtain the cumulated rainfall for single events.

2.3. Soil Analyses

Two soil profiles (chemical weeding—W, and permanent grassing—PG) were described right before the beginning of data collection and characterized for texture, pH, total C, total N, and carbonates content. Soil horizons were identified, described in the field, and sampled. For each soil horizon, chemical and physical analyses were made in double and then averaged. Soil pH was determined potentiometrically [16], total C and N were determined with an elemental analyzer (NA2100 Carlo Erba Elemental Analyzer). The CaCO3 content was measured by volumetric analysis of the carbon dioxide liberated by a 6 M HCl solution [16]. The organic C content was then obtained by subtracting the amount of inorganic C from the total C. Soil particle-size distribution was determined by the pipette method by Gee and Bauder [17]. The soil aggregate stability was assessed by wet sieving for two sieving times (10 min and 60 min) using the apparatus described in Zanini et al. [18].
Total C and N, particle-size distribution, and CaCO3 content were determined on collected sediments, too, as done for soil horizons.

2.4. Erosion Modeling

To have a comparison with measured data, the RUSLE model was applied to estimate (1) the annual erosion rate (t ha−1 y−1) and (2) erosion rates during the annual measurement season (t ha−1). It was derived from the original USLE equation by Wischmeier and Smith [19] which allows the estimation of erosion as follows:
A = RKLSCP
where:
  • A = estimated erosion rate (t ha−1 y−1);
  • R = rainfall erosivity (MJ mm ha−1 h−1 y−1) quantifying the eroding power of the rainfall and runoff;
  • K = soil erodibility (t ha h MJ ha mm−1) indicating the susceptibility of soil to erosion;
  • LS = length-slope factor (dimensionless), considering the effect of topography on erosion;
  • C = vegetation cover (dimensionless), considering the effect of vegetation cover/soil management practices;
  • P = support practices (dimensionless) i.e., practices adopted for erosion control.
Annual R was taken from the repository of Bazzoffi [20] for Italian municipalities, which reports the average values among 6 R-computation formulas. R values for the sediment collection seasons were computed based on monthly rainfall recorded during our experiment.
The soil erodibility factor, i.e., K was calculated using the formula reported in Bazzoffi [20]:
K = 0.0013175 * ((2.1 M1.14 ((10 −4) * (12 − a) + 3.25 * (s − 2) + 2.5 * p − 3))
where M = (silt (%) + very fine sand (%)) * (100 − clay (%)); a = organic matter (%), obtained as organic C content multiplied by the conversion factor 1.72. The coefficients s and p are the structure and permeability codes and were evaluated in the field.
LS was computed after Renard [12] according to the formula proposed for slopes >9%:
LS = (λ/72.6)0.5 * (16.8 * sin ϑ − 0.5)
where λ is slope length (feet) and ϑ is the slope angle.
C was taken from tabular data collected by Bazzoffi [20,21]. We adopted C equal to 0.35 for weeding and 0.013 for permanent grassing, hypothesizing 80% vegetation cover.
p was set equal to 1 (i.e., no support practices).

2.5. Statistical Analyses

Statistics (descriptive, ANOVA, and GLM: General linear model) were performed using software SPSS-v. 26. ANOVA was used to test differences in soil, erosion rates, and sediment properties among treatments, GLM to investigate the interaction effects between treatments and mechanization.

3. Results

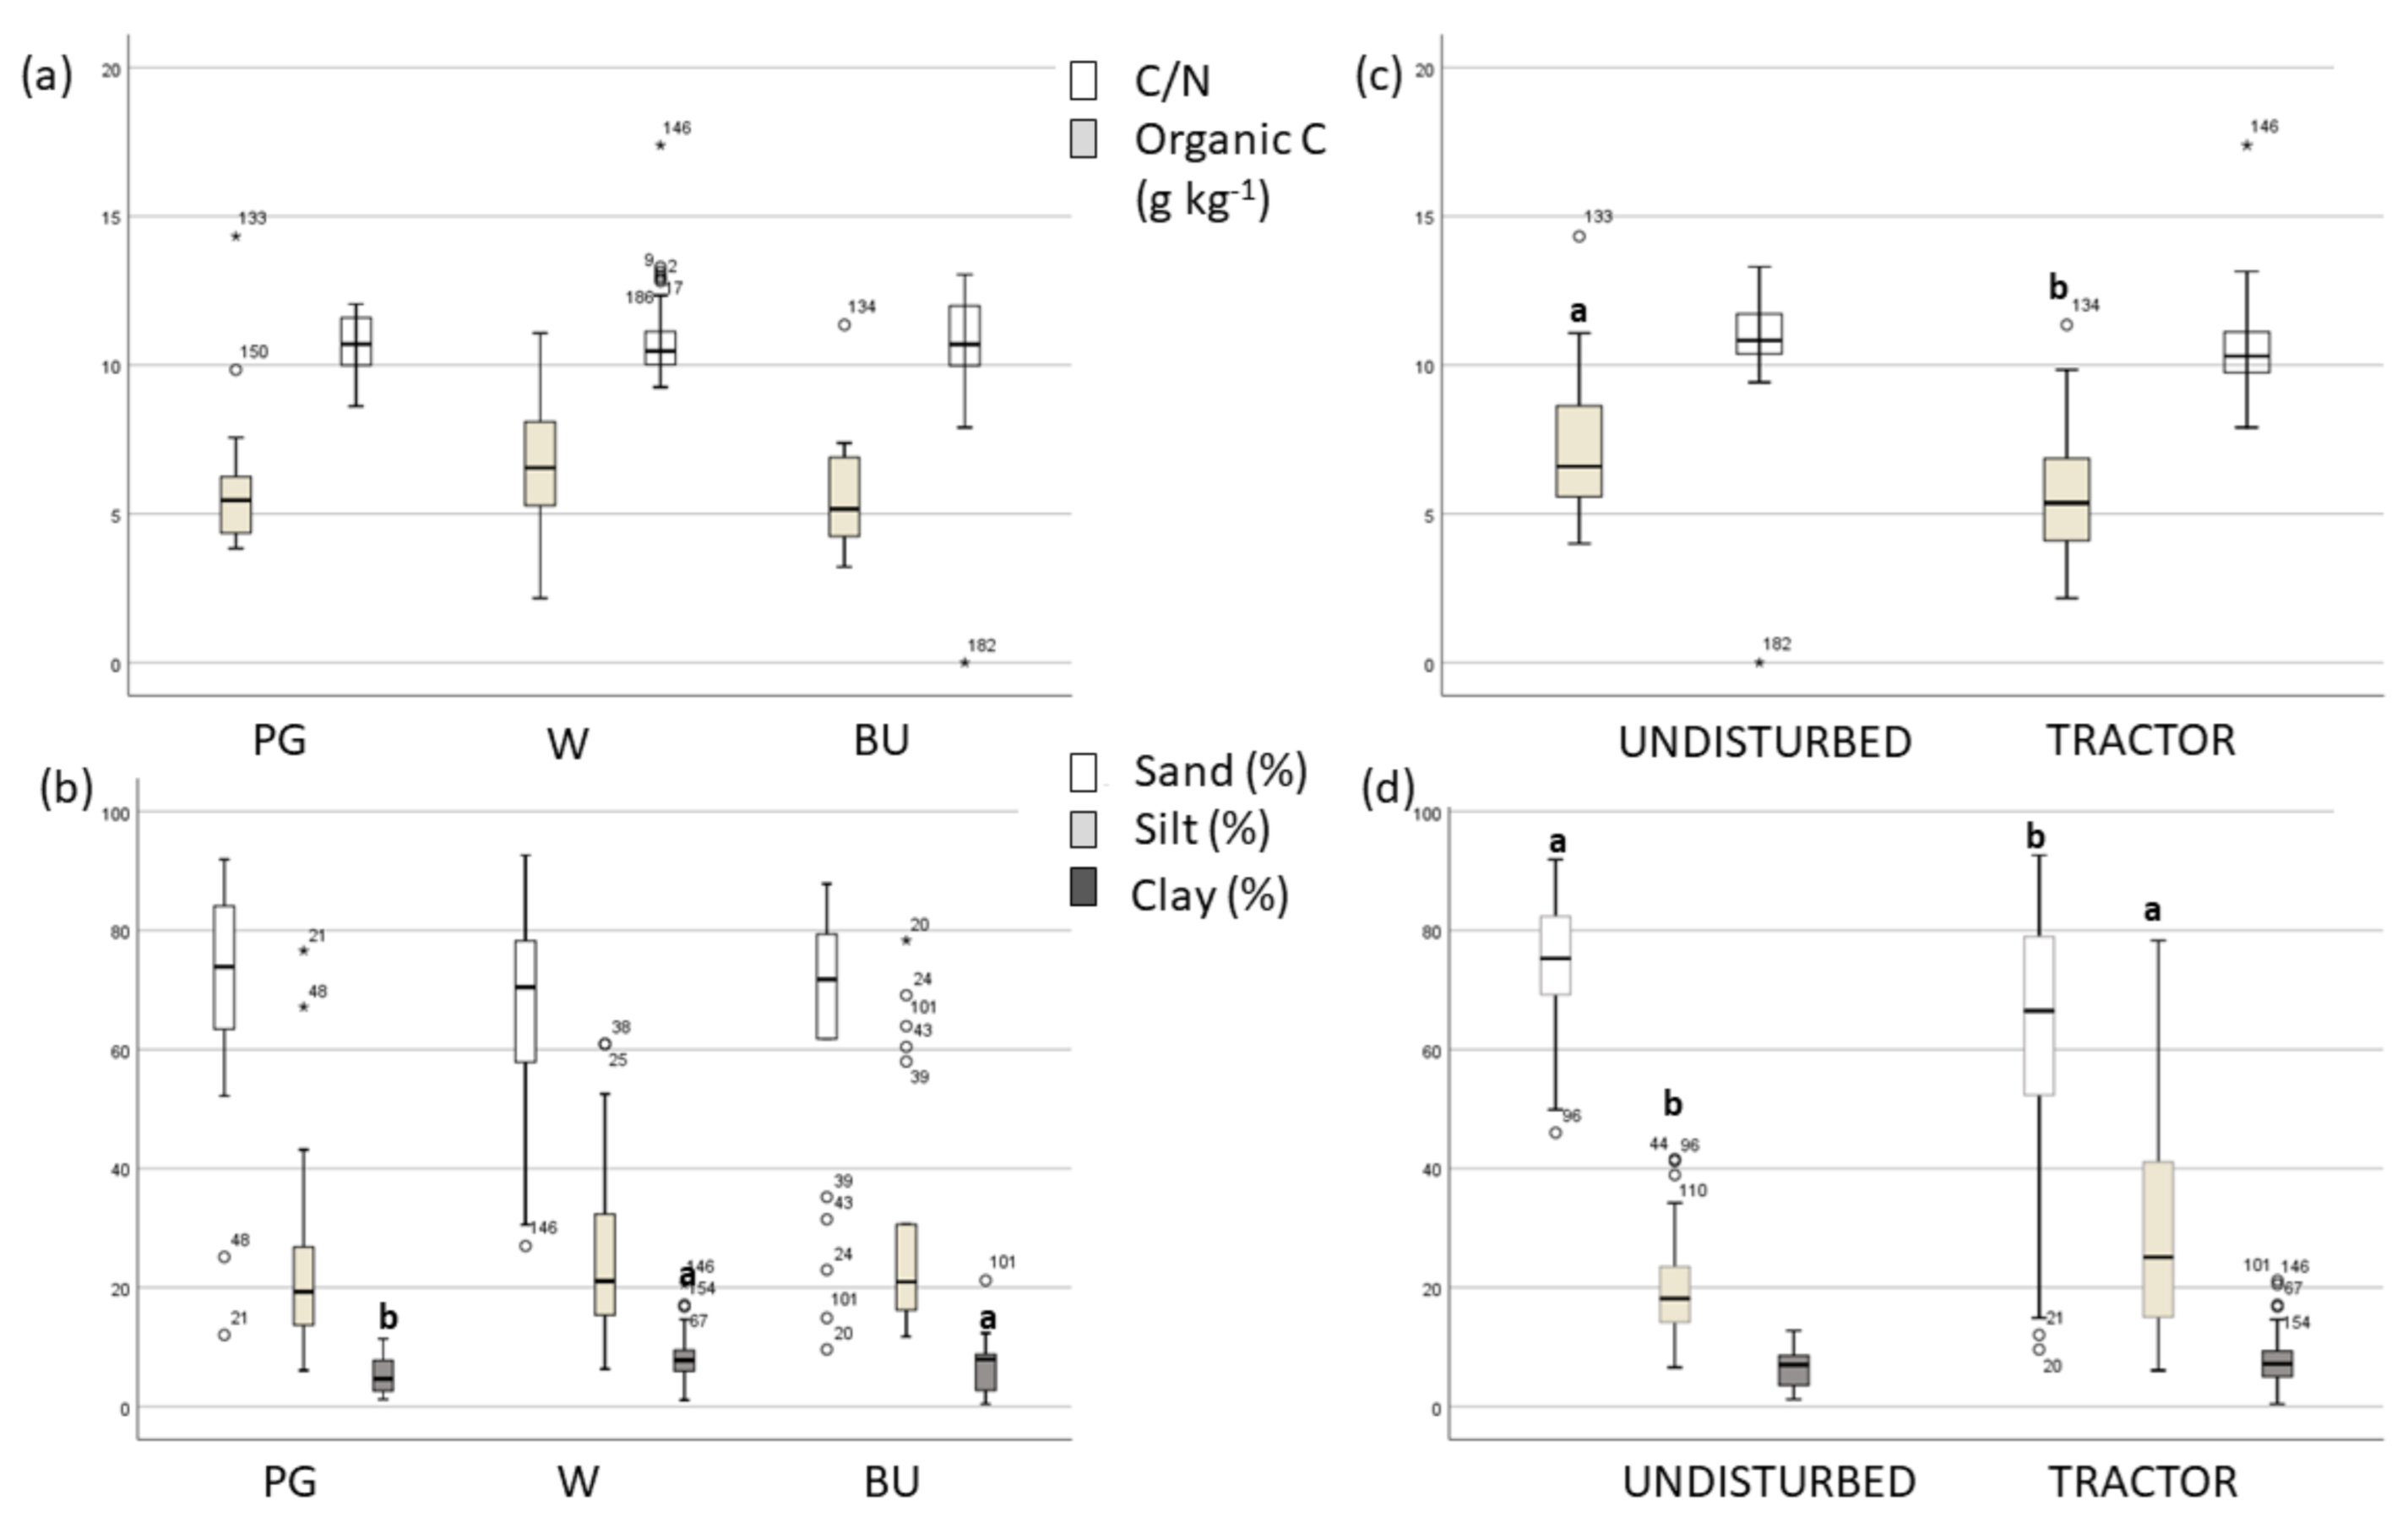
3.1. Soil Properties

The two soil profiles described under PG and W rows were classified as Protocalcic Regosols (Skeletic) according to WRB [22]. Localized precipitation of secondary carbonates was observed starting at a 50 cm depth, as indicated in Table 1, where the main soil chemical properties are listed for soil horizons. The PG profile showed a very thin organic horizon consisting of unaltered or slightly altered pruning residuals. In both cases, the topsoil consisted of one or more Ap horizons with a fine, granular, weakly developed structure, that was slightly stronger in the grassed rows. The total profile depth (reported in Table 1) was comparable in PG and W, although the sequence of soil horizons was slightly different. The main differences were observed in the bottom horizon, which was defined as BCk in PG and Ck in W, due to the absence of the structure observed in the latter (Table 1).
Soil pH was alkaline and increased with depth (range 7.5–8.4). Deeper horizons (i.e., BC and C types) showed a marked effervescence when tested with HCl, and CaCO3 concretions were observed (maximum 3.1% in Ck horizon of the W profile, Table 1). The organic C content was in the range 24.25–9.13 g kg−1 and 24.19–10.60 g kg−1 in PG and W, respectively, in both cases decreasing linearly with soil depth. The C/N ratio ranged from 10.7 to 8.7 and decreased with soil depth (Table 1). Soil texture was dominated by sand, in most cases exceeding 70%. The clay content was almost negligible and below 5% (Table 1). Therefore, all soil horizons were sandy-loam. Topsoil aggregate loss was very high already after 10 min of sieving (always exceeding 75% also in top horizons) and almost complete after 60 min of sieving (Table 1). Top horizons showed better resistance to wet sieving than deeper horizons, both in PG and W (Table 1). The rows affected by tractor passage showed well visible tracks, soil compaction, and loose structure in the topsoil.

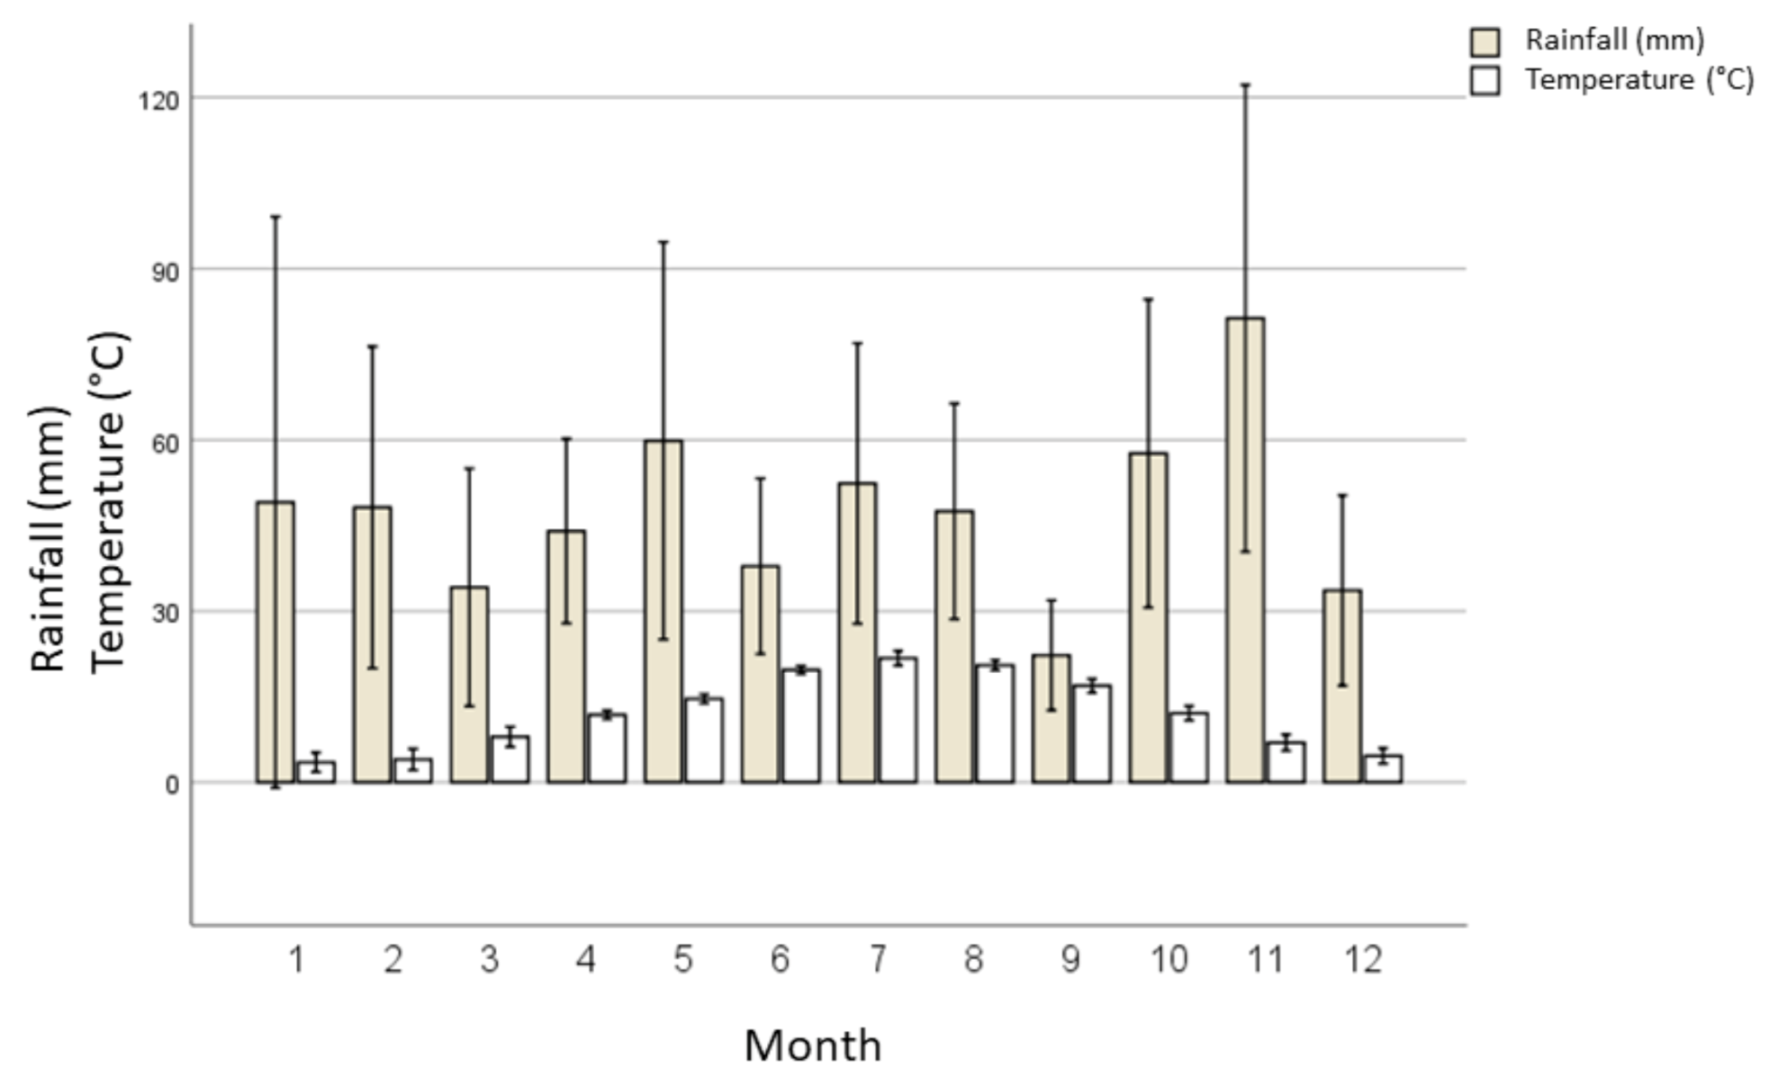
3.2. Rainfall Data, Soil Erodibility, and Erosion Estimates

The soil erodibility (K) was computed for the first mineral horizon reported in Table 1 and then used as input for an erosion estimate. The average K was 0.02678 t ha h MJ−1 ha−1 mm−1 for PG and 0.02878 t ha h MJ−1 ha−1 mm−1 for W. Considering A horizons (topsoil) and other horizon types separately, no significant difference between PG and W was observed in the soil properties listed in Table 1, after running ANOVA. In the rows with tractor passage, we can hypothesize a slightly lower permeability and structure degradation localized along the tractor tracks, based on field observation. However, we did not compute specific K values for the whole rows affected by mechanization, as the compaction effect was very localized.
As visible in Figure 2, the monthly rainfall showed high interannual variability. The annual rainfall was 538 mm in 2015, 610 mm in 2016, 389 mm in 2017, 775 mm in 2018, and 560 mm in 2019. In 2014, the meteorological station recorded 506 mm (measured since the installation on 1 April). The precipitation collected when tanks were on-site generally accounted for 65–86% of the yearly precipitation. The maximum monthly precipitation was recorded in May and November with an average in the range 60–90 mm and the minimum in September had an average rainfall of around 20 mm (Figure 2). Temperatures clearly showed a summer peak with a mean daily temperature >20 °C. The mean daily temperature was always above 0 °C (Figure 2).
Soil erosion estimates based on a historical time series (i.e., literature-derived R values) are shown in Table 2. For PG, they ranged from 1.8 to 2.4 t ha−1 y−1, depending on the R-value reported by Bazzoffi [20] for Italian municipalities (minimum or maximum). Estimates for W ranged from 52 to 69 t ha−1 y−1 (Table 2), again depending on the chosen R (minimum or maximum listed in the repository). Estimates based on measured precipitation during the vegetative season were made, too. Estimated erosion rates in PG ranged from 0.9 to 3.7 t ha−1 and always exceeded 26 t ha−1 in W, with a maximum erosion rate estimated in 2018 (Table 2).
During the experimental seasons, we observed 504 rainy days out of 1619. Daily rainfall ranged from less than 1 mm (detection threshold 0.3 mm) to 49.4 mm, recorded on 29 October 2018. The average daily rainfall was 5.1 mm (st. dev. 6.6, n = 504). A total of 27 events showed a total daily rainfall >20 mm, 12 of which were observed in the period October–November. The vast majority of the events (n = 422) showed <10 mm of daily rainfall.

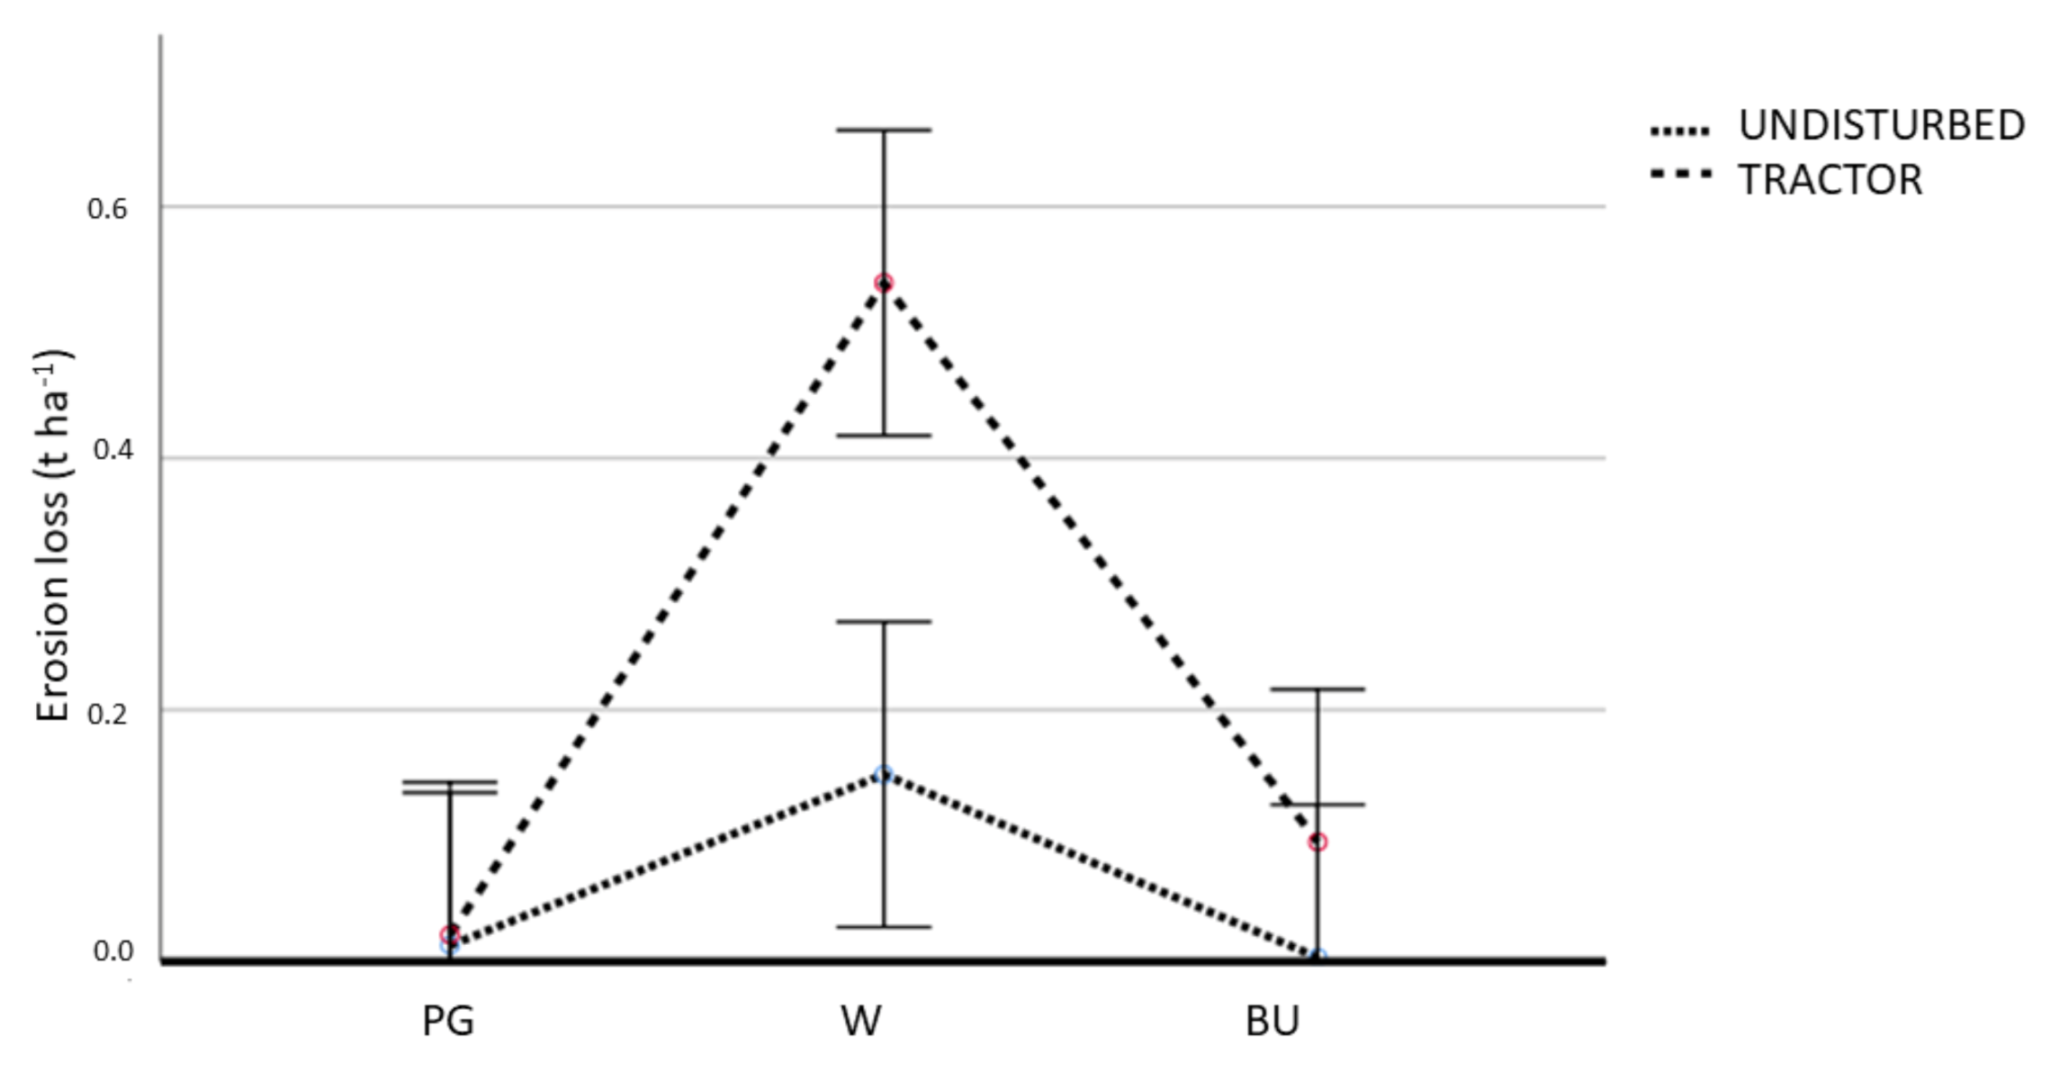
3.3. Erosive Events, Erosion Measurements

As visible from Table 3, 12 erosive events, i.e., events with measurable sediment amounts collected in the channels and tanks, took place during the experiment duration: 3 in 2014, 2 in 2015, 2 in 2016, 2 in 2018, and 2 in 2019. In 2017, a single, slightly erosive event occurred in the summer season.
The cumulative rainfall recorded in each event of Table 3 ranged from 5.9 to 147 mm, the latter resulting from a series of 12 rainy days ending on 7 November 2018, characterized by daily precipitation amounts with low intensities (maximum 7.4 mm in 1 h, Table 3). This series of events was treated as a unique erosive event as the sediments were collected after 24 h without precipitation, to allow complete sedimentation of the fine fraction. A long series of rainy days was observed in June 2019 too, but in this case, the total amount of rainfall was 55.7 mm, with 11.2 mm of rainfall collected in 1 h.
Hourly rainfall exceeding 10 mm was recorded in September 2014 for a total of 26.8 mm rainfall, July 2015 for a total of 32 mm, June 2016 for a total of 13.3 mm, August 2018 for a total of 23.8 mm, and June 2019 for 55.7 of cumulated mm (Table 3). However, the peak intensities computed on the time between the successive tips of the rain collector, and then reported to 1-h duration, often exceeded 100 mm h−1 (events 4, 6, 9, 11, 12, Table 3).
Event-based erosion measures (Table 3) varied from 0.03 to 1.1 t ha−1 for W (average 0.34 t ha−1) and from negligible to 0.12 t ha−1 for PG (average 0.018 t ha−1), while BU showed erosion rates in the range 0–0.20 t ha−1 (average 0.049 t ha−1).
Significant differences were evidenced by ANOVA between BU-PG vs. W measures (Table 3), the latter with erosion rates often more than double (or even 10-fold). No clear relationship was observed between measured erosion rates and the cumulated rainfall in the previous days.

3.4. Sediment Properties

The collected sediment showed an average clay content of 7.2%, a silt content of 26.2%, and a sand content of 66.6% (data not shown). Thus, the average amount of clay in sediments was two-fold compared to the original soil from the two profiles reported in Table 1. The amount of sand was lower than at the beginning of the experiment (i.e., 70%, see Table 1). The sediment was also enriched in organic C (6.1%, st. dev. 2.07) that was three-fold with respect to the original Ap horizons of Table 1. The C/N ratio in the sediment (average 10.7, st. dev. 1.7) was instead comparable with the initial values of Table 1. The sediment properties for different soil management approaches are represented by the boxplots in Figure 3. The eroded material (fine earth fraction) did not differ significantly for organic C, C/N ratio (Figure 3a), and texture among soil management approaches (PG, W, BU) except for clay content, which was slightly lower in PG (p < 0.01, Figure 3b).

3.5. Effect of Mechanization

In addition to the aim of comparing different weed management practices, we also considered the effect of the tractor passage on the vineyard rows. The rows affected by tractor passage also showed a slightly different organic C content in sediments (6 vs. 7%, p = 0.001, Figure 3c), but comparable C/N ratios (Figure 3c). The tractor passage resulted in higher silt release and lower sand release than the undisturbed rows (61 vs. 74% and 30 vs. 20% respectively, p = 0.001, Figure 3d). A general linear model evidenced a significant interaction in the case of tractor passage (p values reported in Table 4, always significant). In detail, as visible from Figure 4, mechanization always enhanced soil erosion, and particularly for BU and W. In the latter, much higher average erosion rates were observed when the tractor passage was present.

4. Discussion

4.1. Soil Properties

The two soil profiles described were rather similar for chemical and physical properties, and both showed visible signs of past re-shaping and slope modeling, which allowed for reducing the slope angle and length, improving accessibility and mechanization in the area. The Aosta Valley has large terraced surfaces, and agricultural slopes have been often reshaped, as reported by Curtaz et al. [23]. Even if in this case we cannot define them as conventional terraces, the slope was deeply modeled in the past as visible in Figure 1b, where the plot length is easily defined by the upper road and the lower retaining wall. The slight morphological differences in the profiles visible from Table 1 and in the field were mainly due to compaction caused by a repeated tractor passage. In general, the soils were characterized by very quick drainage, as a result of the coarse texture, where coarse sand represented the predominating size class. This might justify the relatively low erosion rates observed, due to high infiltration rates. The main pedogenic process acting in the area was CaCO3 precipitation as commonly seen in the inner portion of Aosta Valley region [10]. The topsoil showed a severe aggregate loss, that can be related to coarse textures, low organic matter content, and management practices, including mechanization, besides erosion due to severe slope.

4.2. Rainfall Data, Soil Erodibility, and Erosion Estimates

The soil physical and chemical properties affecting aggregation determined the high erodibility of the topsoil, which was comparable in W and PG at the time of our survey. K values were in line with those reported by Biddoccu et al. for Italian eroded vineyards in a hilly environment [4]. Compared to the common soils in the inner Aosta Valley (Calcic Regosols and Calcisols, with median K values equal to 0.039 and 0.046 respectively according to the regional map repository [10]), the considered topsoils (Table 1) were however less erodible probably due to the abundance of coarse sand.
The total rainfall in the area was typical of inner Alpine valleys and showed considerable variability, even in the relatively short duration of our project. In particular, during 2017 a severe summer drought occurred, as confirmed by the low yearly precipitation when compared to the rest of the experiment, while 2018 showed the highest rainfall amount (almost double than 2017). Such variability might be related to ongoing climate change, with drier summers and wet winters, with limited snowfall, potentially affecting erosion processes. However, the final effects of climate change on soil erosion rates in the Alps are still highly debated, as reported by Gianinetto et al. [24], because of the complexity of the factors involved. The importance of summer storms in soil erosion was evident from the data in Table 2 and by the peak erosion intensities computed by the meteorological station. Annual erosion estimates in PG were in line with the data reported by Zweifel et al. [25] for the Urseren Valley (Switzerland), i.e., average erosion rate of 1.8 t ha−1 y−1 (mainly grassland area), with hotspots of 30 t ha−1 y−1. However, our estimates on bare soil (W) were even higher, and this could be due to: (1) the time series used for R computation and (2) the tabular data used for C in vineyards in our study. As for R, we can hypothesize that the values reported in the literature [20], obtained from the average of six existing R formulas, did not fit the inner-alpine climate of the study area.
The average daily rainfall event was characterized by a rather low amount of precipitation (ca. 5 mm), and the total precipitation was often below 1–2 mm per day. Compared with other studies conducted in North-Eastern Italy by Carretta et al. [26], our experimental plot had a similar average number of rainy days per year (84 in our 6-year experiment vs. 76 across 2 years in [26]) and almost comparable annual rainfall, despite a quite different rainfall distribution pattern. In fact, in the inner part of the Aosta Valley, severe summer storms were more relevant than fall events in terms of intensity and peak intensities (see Table 3). However, data from the literature report extreme events in the whole Mediterranean area. For example, Ramos and Martinez-Casanovas documented an extreme storm in the year 2000 with a total rainfall of 215 mm, 205 mm of which fell in 2 h 15 min, with a soil loss of 207 t ha−1 from a Typic Xerorthent in Spain [27].

4.3. Erosive Events, Erosion Measurements

The average number of erosive events in our experiment was 2 per year. Data published about a vineyard in the Southern Piemonte region, in a hilly environment [28], reported 30 erosive events in 14 years, although with a higher average annual precipitation (849 mm, time-series 2000–2013), which is comparable with our findings. The erosive events characterized by low cumulated rainfall (e.g., events 1, 8, 12) were always preceded by dry periods (at least a week). In such conditions, we observed that even a limited rainfall amount triggered soil erosion, probably due to the extremely low soil moisture that made it more vulnerable to detachment and transport. Evidence for this behavior has been reported in the past. For example, Biddoccu et al. [4] pointed out that considering soil moisture is crucial for erosion modeling, and underlined the importance of local conditions (topography, C factor, etc.) in erosion prediction in sloping vineyards. Thus, rainfall data alone cannot always identify erosion thresholds, as it happened also in our case, but the soil conditions at the event start need to be taken into account.
The measured erosion rates visible in Table 3 reflect the high variability of rainfall intensities and event characteristics. They varied greatly depending on the soil management approaches and showed high variability among rows for individual events, probably due to small-scale, local conditions. This might be particularly true for fall records, because harvesting, although carried out manually, might have locally affected the surface roughness and the degree of soil compaction, determining heterogeneous topsoil microrelief.
Maximum soil loss by erosion showed an order of magnitude comparable with available literature data. For example, Panagos et al. [13] applied the RUSLE model at the European level on a 100 m grid, predicting average erosion rates around 5 t ha−1 y−1 in the Alps, due to high rainfall erosivity combined with steep slopes. In Switzerland, Alewell et al. [14] measured erosion rates ranging from 6 to 30 t ha−1 y−1. However, these estimates were not specific for agricultural soils. Rodrigo-Comino et al. [29] measured soil losses around 3 t ha y−1 in a 35-year-old German sloping vineyard, with 524–902 mm of rainfall per year, after spring tillage and weeding in the vegetative season. Besides soil loss, also severe nutrients loss was reported for example by Ramos and Martines-Casanovas [27]. Across the duration of our experiment, no extreme meteorological event was observed, but they were documented in the near past (e.g., a severe erosion after a summer storm occurred in the experimental vineyard in 2012). Additionally, existing literature (e.g., [24,30]) underlined that climate change could worsen erosion processes due to the increase of extreme events, threatening soil conservation. Finally, Prosdocimi et al. [31] reviewed erosion in Mediterranean vineyards and reported 2.4 t ha−1 rates for erosion plots (single event), but they observed that the maximum rainfall intensity explained only in part the sediment loss.
In our experiment, permanent grassing strongly reduced erosion (in most cases from 2 to 10 times, depending on the event characteristics, but even more for the least erosive). The mitigation effect exerted by PG was therefore considerable and in agreement with the findings of Biddoccu [32], who reported a reduction by 90% of the erosion rate in rows with cover crops vs. conventional tillage in similar environments. The presence of buffer strip rows was quite effective too in reducing erosion in the vineyard, and almost comparable to permanent grassing. Thus, it could be a valuable option to warrant a wide range of ecosystem services, such as the habitat for bird species that are used to feed on bare soil, without enhancing soil erosion (for species and details see Maffei et al. [33]). An effect of the stone cover can also be hypothesized in containing erosion, particularly in the weeded plots (see Rodrigo-Comino et al. [29] and cited literature).
The fact that we observed very low erosion rates in absolute terms, which should not be of particular concern, is evident. However, these findings refer to a limited experiment duration. We must acknowledge that catastrophic events did occur in the past, and erosion took place over the vineyard cultivation period (i.e., nearly 50 years, most of the time with bare soil), as demonstrated by the visual assessment of the grafting point heights and by the denudation of the poles over time. Therefore, as the occurrence of severe events in the future is likely, we would recommend cautious soil management, adopting permanent grassing whenever possible.
Finally, the poor match between measured and predicted erosion rates might be due partly to the limited number of erosive events (n = 12, Table 3), but also the choice of the C factor used, or R computation equations (Table 2). A longer time series would be needed to calibrate and fully validate the R and C factors in the study area. However, this was not one of the aims of our research.

4.4. Sediment Properties

The collected sediments were enriched in clay, organic C, and N, while the C/N ratio did not evidence significant differences in the degree of alteration of the organic matter. The contribution of vineyard erosion to nutrients loss proved to be a crucial issue in land degradation and soil conservation.
In our study, the sediment collected, independent of the management, showed a comparable enrichment in C and N, and comparable textures (Figure 3a,b). This is in agreement with the erodibility factors determined on topsoils, which were very similar in PG and W at the beginning of the experiment (Table 2). We can hypothesize that topsoil C and N are associated with the fine aggregates or in the particulate form that was subject to erosion and transport. The use of a cover crop over a longer period could help to re-establish the nutrients in topsoil.

4.5. Effect of Mechanization

Mechanization (i.e., tractor passage) amplified the effect of the soil management and accelerated the erosion process due to the formation of tracks along the slope and the compaction effect (Figure 4). The effects were well-visible in the field and from the morphology of soil surface horizons (Table 1). The reduction of the hydraulic conductivity and the penetration resistance has been largely documented by Capello et al. also after a limited number of tractor passes [34], and in our case it also increased channeling and runoff, accelerating soil erosion and topsoil degradation (Figure 4).

5. Conclusions

We conducted a six-year experiment in a sloping vineyard located in Aosta Valley, N-W Italy, to assess the effect of different soil management (permanent grassing, chemical weeding, and buffer strips) and the additional impact of mechanization on the sediment amounts and properties, to compare traditional agricultural management types with more sustainable, nature-based solutions against erosion. Permanent grassing and buffering showed comparable effects, reducing soil erosion considerably. The tractor passage, independent of the soil management approach adopted, visibly accelerated the erosion process.
The collected sediments were highly enriched in organic C, N, and the clay fraction, thus a fertility loss is expected in the medium-long term. Erosion estimates gave much higher results than measured rates. This probably depended on a combination of factors such as local variability of the vegetation cover and terrain roughness, choice of the C factor, and computation of R in the prediction model. Thus, further validation of the model in inner-alpine environments would be beneficial in the future.
Although the measured erosion rates were not particularly high during our experiment, still, extreme rainfall events can be expected in the near future, and their occurrence in the climate change scenario is very difficult to predict. Moreover, it is very difficult to estimate soil formation rates on highly remodeled slopes, as the existing literature mostly focuses on non-agricultural soils. Thus we suggest to cautiously keep the threshold for tolerable erosion to a minimum rate, adopting permanent grassing whenever possible. The use of nature-based solutions against erosion, such as permanent grassing proved in fact to be very effective also in inner-alpine vineyards. These findings could orient planners and practitioners in the future, as a suggestion for sustainable soil management and enhancement of soil ecosystem services in mountain regions.

Author Contributions

S.S. wrote the paper and contributed the project administration, she carried out erosion estimates and analyzed the results together with M.E.D., O.Z. and M.L. implemented the experimental plot and contributed to the meteorological analyses and interpretation of rainfall data. D.G., D.V., N.C., E.P., and C.H. carried out sampling, analyses, and data interpretation in different years of the project duration. M.E.D. contributed to erosion estimates and overall data interpretation. M.F. provided the funding, contributed to the project administration, and overviewed the data interpretation and the manuscript production. All authors have read and agreed to the published version of the manuscript.

Funding

This work was co-financed by the European Regional Development Fund in Interreg Alpine Space project Links4Soils (ASP399): Caring for Soil—Where Our Roots Grow. (http://www.alpinespace.eu/projects/links4soils/en/the-project (accessed on 9 February 2021)).

Institutional Review Board Statement

Not applicable.

Informed Consent Statement

Not applicable.

Data Availability Statement

The soil map of Aosta Valley is available at https://geoportale.regione.vda.it/ (accessed on 9 February 2021).

Acknowledgments

We wish to thank Fabio Gorraz, Innocenzo Vallet, Michel Gilliavod, Daniele Domeneghetti, and the entire technical staff of the Institut Agricole Régional for their invaluable help in recording experimental data, managing and checking the collecting devices, maintaining the experimental treatments, and making the completion of the project possible. We would like to thank the guest editor and two anonymous reviewers for their substantial help in improving the first version of the manuscript.

Conflicts of Interest

The authors declare no conflict of interest.

References

  1. Stanchi, S.; Freppaz, M.; Agnelli, A.; Reinsch, T.; Zanini, E. Properties, best management practices and conservation of terraced soils in Southern Europe (from Mediterranean areas to the Alps). A review. Quat. Int. 2012, 265, 90–100. [Google Scholar] [CrossRef] [Green Version]
  2. Geitner, C.; Freppaz, M.; Lesjak, J.; Schaber, E.; Stanchi, S.; D’Amico, M.; Vrscaj, B. Soil Ecosystem Services in the Alps—An Introduction for Decision-Makers; Agricultural Institute of Slovenia: Ljubljana, Slovenia, 2019; 78p. [Google Scholar]
  3. Winter, S.; Bauer, T.; Strauss, P.; Kratschmer, S.; Paredes, D.; Popescu, D.; Landa, B.; Guzman, G.; Gomez, J.A.; Guernion, M.; et al. Effects of vegetation management intensity on biodiversity and ecosystem services in vineyards: A meta-analysis. J. Appl. Ecol. 2018, 55, 2484–2495. [Google Scholar] [CrossRef] [PubMed] [Green Version]
  4. Biddoccu, M.; Guzman, G.; Capello, G.; Thielke, T.; Strauss, P.; Winter, S.; Zaller, J.G.; Nicolai, A.; Cluzeau, D.; Popescu, D. Evaluation of soil erosion risk and identification of soil cover and management factor (C) for RUSLE in European vineyards with different soil management. Int. Soil Water Cons. Res. Press 2020, 8, 337–353. [Google Scholar]
  5. Cataldo, E.; Salvi, L.; Sbraci, S.; Storchi, P.; Mattii, G.B. Sustainable viticulture: Effects of soil management in Vitis vinifera. Agronomy 2020, 10, 1949. [Google Scholar] [CrossRef]
  6. Mercenaro, L.; Nieddu, G.; Pulina, P.; Porqueddu, G. Sustainable management of an intercropped Mediterranean vineyard. Agric. Ecosyst. Environ. 2014, 192, 95–104. [Google Scholar] [CrossRef]
  7. Schütte, R.; Plaas, E.; Gómez, J.A.; Guzmán, G. Profitability of erosion control with cover crops in European vineyards under consideration of environmental costs. Environ. Dev. 2020, 35, 100521. [Google Scholar]
  8. CERVIM Website. Available online: http://www.cervim.org/en/heroic-viticulture.aspx (accessed on 11 December 2020).
  9. Aosta Valley Region Geoportal. Available online: https://geoportale.regione.vda.it/ (accessed on 11 December 2020).
  10. D’Amico, M.E.; Pintaldi, E.; Sapino, E.; Colombo, N.; Quaglino, E.; Stanchi, S.; Navillod, E.; Rocco, R.; Freppaz, M. Soil types of Aosta Valley (N-W Italy). J. Maps 2020, 16, 755–765. [Google Scholar] [CrossRef]
  11. Biddoccu, M.; Zecca, O.; Audisio, C.; Godone, F.; Barmaz, A.; Cavallo, E. Assessment of long-term soil erosion in a mountain vineyard, Aosta Valley (NW Italy). Land Deg. Dev. 2018, 29, 617–629. [Google Scholar] [CrossRef]
  12. Renard, K.; Foster, G.; Weesies, G.; McCool, D.; Yoder, D. Predicting Soil Erosion by Water: A Guide to Conservation Planning with the Revised Universal Soil Loss Equation (RUSLE); USDA Agriculture Handbook No. 703; USDA: Washington, DC, USA, 1997. [Google Scholar]
  13. Panagos, P.; Borrelli, P.; Poesen, J.; Ballabio, C.; Lugato, E.; Meusburger, K.; Montanarella, L.; Alewell, C. The new assessment of soil loss by water erosion in Europe. Environ. Sci. Pol. 2015, 54, 438–447. [Google Scholar] [CrossRef]
  14. Alewell, C.; Egli, M.; Meusburger, C. An attempt to estimate tolerable soil erosion rates by matching soil formation with denudation in Alpine grasslands. J. Soils Sediments 2015, 15, 1383–1389. [Google Scholar] [CrossRef] [Green Version]
  15. Mercalli, L.C.; Berro, D.; Montuschi, S. Atlante Climatico della Valle d’Aosta; Società Meteoroligica Subalpina: Turin, Italy, 2003; 416p. [Google Scholar]
  16. S.I.S.S. Metodi di Analisi Fisica del Suolo; Franco Angeli: Milano, Italy, 1997. [Google Scholar]
  17. Gee, G.W.; Bauder, J.W. Particle-size analysis. In Methods of Soil Analysis: Part I, 2nd ed.; Klute, A., Ed.; ASA: Madison, WI, USA, 1986. [Google Scholar]
  18. Zanini, E.; Bonifacio, E.; Albertson, J.D.; Nielsen, D.R. Topsoil aggregate breakdown under water saturated conditions. Soil Sci. 1998, 163, 288–298. [Google Scholar] [CrossRef]
  19. Wischmeier, W.H.; Smith, D.D. Predicting Rainfall Erosion Losses—A Guide to Conservation Planning; Agriculture Handbook No. 537; United States Department of Agriculture: Washington, DC, USA, 1978. [Google Scholar]
  20. Bazzoffi, P. Erosione del Suolo e Sviluppo Rurale; Edagricole: Bologna, Italy, 2007; 249p. [Google Scholar]
  21. Regione Marche Portal. Available online: http://suoli.regione.marche.it/Erosioneascaladicampo.aspx (accessed on 13 January 2021).
  22. IUSS Working Group WRB. World Reference Base for Soil Resources 2014, Update 2015. International Soil Classification System for Naming Soils and Creating Legends for Soil Maps; World Soil Resources Reports No. 106; FAO: Rome, Italy, 2015. [Google Scholar]
  23. Curtaz, F.; Stanchi, S.; D’Amico, M.E.; Filippa, G.; Zanini, E.; Freppaz, M. Soil evolution after land-reshaping in mountains areas (Aosta Valley, NW Italy). Agric. Ecosyst. Environ. 2014, 199, 238–248. [Google Scholar] [CrossRef]
  24. Gianinetto, M.; Aiello, M.; Vezzoli, R.; Polinelli, F.; Rulli, M.; Chiarelli, D.; Bocchiola, D.; Ravazzani, G.; Soncini, A. Future scenarios of soil erosion in the alps under climate change and land cover transformations simulated with automatic machine learning. Climate 2020, 8, 28. [Google Scholar] [CrossRef] [Green Version]
  25. Zweifel, L.; Meusburger, K.; Alewell, C. Spatio-temporal pattern of soil degradation in a Swiss Alpine grassland catchment. Remote Sens. Environ. 2019, 199, 111441. [Google Scholar] [CrossRef]
  26. Carretta, L.; Tarolli, P.; Cardinali, A.; Nasta, P.; Romano, N. Evaluation of runoff and soil erosion under conventional tillage and no-till management: A case study in northeast Italy. Catena 2021, 197, 104972. [Google Scholar] [CrossRef]
  27. Ramos, M.; Martinez-Casanovas, J. Nutrient losses from a vineyard soil in Northeastern Spain caused by an extraordinary rainfall event. Catena 2004, 55, 79–90. [Google Scholar] [CrossRef]
  28. Biddoccu, M.; Ferraris, S.; Opsi, F.; Cavallo, E. Long-term monitoring of soil management effects on runoff and soil erosion in sloping vineyards in Alto Monferrato (North–West Italy). Soil Tillage Res. 2016, 155, 176–189. [Google Scholar] [CrossRef]
  29. Rodrigo-Comino, J.; Quiquerez, A.; Follain, S.; Raclot, D.; Le Bissonais, Y.; Casalì, J.; Giménez, R.; Cerdà, A.; Kesstra, S.D.; Brevik, E.C.; et al. Soil erosion in sloping vineyards assessed by using botanical indicators and sediment collectors in the Ruwer-Mosel valley. Agric. Ecosyst. Environ. 2016, 223, 158–170. [Google Scholar] [CrossRef]
  30. Chersich, S.; Rejšek, K.; Vranová, V.; Bordoni, M.; Meisina, C. Climate change impacts on the Alpine ecosystem: An overview with focus on the soil—A review. J. For. Sci. 2015, 11, 496–514. [Google Scholar]
  31. Prosdocimi, M.; Cerda, A.; Tarolli, P. Soil water erosion on Mediterranean vineyards: A review. Catena 2016, 141, 1–21. [Google Scholar] [CrossRef]
  32. Biddoccu, M.; Opsi, F.; Cavallo, E. Relationship between runoff and soil losses with rainfall characteristics and long-term soil management practices in a hill vineyard (Piedmont, NW Italy). Soil Sci. Plant Nutr. 2014, 60, 92–99. [Google Scholar] [CrossRef] [Green Version]
  33. Maffei, G.; Baroni, D.; Bocca, M. Uccelli Nidificanti in Valle d’Aosta. Distribuzione, Ecologia, Fenologia e Conservazione; Testolin Editore: Sarre, Italy, 2018; 418p. [Google Scholar]
  34. Capello, G.; Biddoccu, M.; Ferraris, S.; Cavallo, E. Effects of tractor passes on hydrological and soil erosion processes in tilled and grassed vineyards. Water 2019, 11, 2118. [Google Scholar] [CrossRef] [Green Version]
Figure 1. Study area location and view of the experimental plot (a). The sediment collection systems (white tanks) is well visible at the bottom of each row (b). The experimental setup (one block) is shown in (c), a detail of the collection system is provided in (d), with the transversal trench visible in the background.
Sustainability 13 01991 g001
Figure 2. Monthly rainfall (mm) and monthly average temperature (°C), in the years 2014–2019. Bars represent the standard error of the mean.
Sustainability 13 01991 g002
Figure 3. Sediment properties according to soil management approaches, computed for the whole experiment duration (12 erosive events). (a) C/N ratio and organic C content for PG, W, BU; (b) soil texture for PG, W, BU; (c) C/N ratio and organic C for undisturbed rows and the rows affected by tractor passage; (d) soil texture for undisturbed rows and the rows affected by tractor passage. Letters indicate significant differences among treatments. PG is permanent grassing, W is chemical weeding, and BU is buffer row. The black horizontal line in the box is the median value.
Sustainability 13 01991 g003
Figure 4. Interaction effect (weed management * mechanization) in the experimental vineyard. PG is permanent grassing, W is weeding, and BU is buffer row.
Sustainability 13 01991 g004
Table 1. Soil profile properties (st. dev. in brackets). PG is permanent grassing, W is weeding. Csa is coarse sand, Fsa is fine sand, Csi is coarse silt, Fsi is fine silt, and Cl is clay. AL is the aggregates loss. Soil profiles were described to represent the two extreme treatments, i.e., PG and W.
Horizon (cm)pHorg C (g kg−1)C/NCaCO3 (%)Csa (%)Fsa (%)Csi (%)Fsi (%)Cl (%)AL 10 min (%)AL 60 min (%)
PG
Oi/Oe (0.5–0)-----------
Ap1 (0–7)7.5 (0.17)24.25 (8.82)10.7 (1.29)2.4 (0.42)51.7 (3.2)19.4 (4.3)10.2 (1.0)15.3 (3.2)3.4 (0.3)75.3 (19.8)98.4 (1.8)
Ap2 (7–20)8.1 (0.60)13.92 (6.15)9.1 (1.7)2.1 (0.28)51.3 (1.5)21.2 (2.7)9.2 (0.7)14.9 (1.2)3.4 (0.7)80.7 (18.7)91.9 (14.6)
BC1 (20–40) 8.1 (0.24)12.55 (3.51)9.2 (1.31)2.4 (0.23)52.7 (3.5)19.2 (1.9)10.4 (0.3)14.5 (0.9)3.2 (0.3)77.7 (2.1)89.4 (3.8)
BC2 (40–50)8.2 (0.19)1.33 (3.46)9.1 (1.50)2.5 (0.23)51.1 (2.7)17.1 (3.1)11.4 (0.4)17.1 (1.2)3.3 (0.2)100.0100.0
BCk (50–70+)8.1 (0.38)9.13 (3.18)9.5 (2.30)2.3 (0.3)54.5 (4.1)16.2 (2.2)9.1 (0.3)16.1 (1.3)4.1 (0.5)--
W
Ap (0–10)7.6 (0.53)24.19 (9.16)9.5 (0.98)2.4 (1.82)50.4 (1.0)20.5 (2.8)12.2 (1.8)13.2 (1.8)3.7 (0.4)81.4 (14.9)95.8 (3.8)
BC1 (10–30)7.8 (0.40)13.13 (2.53)9.6 (3.20)2.9 (0.97)51.2 (0.8)21.7 (1.1)7.6 (2.5)15.8 (1.1)3.7 (0.4)94.1 (7.8)100.0
BC2 (30–50)7.9 (0.70)10.22 (2.46)9.1 (2.06)2.7 (0.83)50.7 (2.7)21.7 (3.0)8.5 (3.3)15.7 (1.5)3.4 (0.4)95.4 (5.1)100.0
Ck (50–70+)8.4 (0.23)10.60 (1.80)8.7 (0.27)3.1 (0.90)53.6 (5.0)15.4 (4.7)9.2 (1.3)18.0 (0.7)3.8 (0.6)100.0100.0
Table 2. Estimated erosion (during the experiment; historical). Historical R is based on minimum and maximum annual values for the town of Aosta reported in the literature [20]. R for each year of the experiment is based on the meteorological station data and computed for the actual months of sediment collection. Thus, A is referred to the fraction of the year indicated in the title row. PG is permanent grassing, W is chemical weeding. LS, K, and C factors do not vary for events.
April–November 2014March–November 2015March–November 2016March–November 2017March–November 2018March–November 2019Hist. R (min) Year Hist. R (max) Year
R (MJ mm ha−1 h−1 y−1)1306130614275102097192210131338
K (t ha h MJ−1 ha−1 mm−1)0.02678 (PG) 0.02878 (W)
LS (-)5.1
C (-)0.013 (PG) 0.35 (W)
A (t ha−1)2.3 (PG)
67.1 (W)
2.3 (PG)
67.1 (W)
2.5 (PG)
73.3 (W)
0.91 (PG)
26.2 (W)
3.7 (PG)
107.7 (W)
3.4 (PG)
66.7 (W)
1.8 (PG)
52.0 (W)
2.4 (PG)
68.7 (W)
Table 3. Erosive events, date, total rainfall, max. rainfall recorded in 1 h, peak intensity, and cumulated rainfall amount in the previous 7 and 14 days. Measured erosion rates are average values for treatments, st. dev. is reported in brackets. Letters indicate significant differences among treatments.
IDEnd Date of the Event Total Rainfall (mm)Max Rainfall in 1 h (mm)Peak Intensity (Reported to mm h−1)Cumulative Rainfall in the Previous 7 Days (mm)Cumulative Rainfall in the Previous 14 Days (mm)Measured Erosion Rate (t ha−1) PGMeasured Erosion Rate (t ha−1) WMeasured Erosion Rate (t ha−1) BU
123 June 20145.92.525.12.02.80.030 (0.034)0.070 (0.073)0.026 (0.026)
229 July 201443.19.126.728.539.30.0099 (0.012)0.111 (0.167)0.0480 (0.0478)
39 September201426.816.595.04.621.50.116 (0.124)0.923 (1.47)0.195 (0.226)
425 July 201532.220.1162.611.711.70.018 (0.0244) b **1.11(0.729) a **0.125 (0.239) b **
56 October 201542.74.19.70.00.80.00 (-) b **0.041 (0.0169) a **0.00 (-) b **
630 June 201613.311.7>1006.16.10.00989 (0.0148) *0.618 (0.710) *0.163 (0.271) *
75 November 201620.22.05.30.012.00.0177 (0.0043) b **0.0290 (0.0253) a **0.00 (-) b **
89 September 20176.11.37.90.02.60.0147 (0.0237) b **0.0986 (0.0381) a **0.0157 (0.0250) b **
917 August 201823.810.7159.00.3016.00.00327 (0.007) *0.624 (0.760) *0.00985 (0.0231) *
107 November 2018147.07.414.0--0.00 (-)0.0975 (0.182)0.00 (-)
1115 June 201955.711.2182.9--0.00 (-)0.283 (0.521)0.00639 (0.00996)
121 October 20197.95.1124.00.05.10.00 (-)0.0987 (0.110)0.00 (-)
All2014–2019-- --0.018 (0.048) b **0.342 (0.652) a **0.049 (0.133) b **
* is p < 0.05, ** is p < 0.01. PG is permanent grassing, W is chemical weeding, and BU is buffer row.
Table 4. General linear model results (dependent variable is measured erosion rate). PG is permanent grassing, W is chemical weeding, and BU is buffer row.
TreatmentFFreedom Degreesp
Corrected model11.1105<0.001
Management (W, PG, BU)17.1412<0.001
Tractor passage (Y/N)10.59410.001
Management * Tractor5.33820.005
Intercept29.5841<0.001
Publisher’s Note: MDPI stays neutral with regard to jurisdictional claims in published maps and institutional affiliations.

