
Analysis and Distribution of Conveyor Belt Noise Sources under Laboratory Conditions


Department of Mining and Geodesy, Faculty of Geoengineering, Mining and Geology, Wroclaw University of Science and Technology, 50-421 Wroclaw, Poland
*
Author to whom correspondence should be addressed.
Sustainability 2021, 13(4), 2233; https://0-doi-org.brum.beds.ac.uk/10.3390/su13042233
Submission received: 18 January 2021
/
Revised: 10 February 2021
/
Accepted: 13 February 2021
/
Published: 19 February 2021
(This article belongs to the Special Issue Diagnostics and Nondestructive Testing as an Important Factor of Sustainability)
Abstract
:In compliance with ecological policies, activities undertaken by surface mines in relation to environment protection should be comprehensive and must take into account the principle of sustained development. One of the most basic tasks in this area is to reduce the nuisance caused by the noise emitted to the environment. The problem of above-standard noise levels caused by transportation systems operated in mines can be solved only after major noise sources are identified and analyzed in detail. This article first focuses on the literature studies to describe the possible sources of noise generated by a belt conveyor and in its second part it presents exploratory research into noise sources. The research was performed under laboratory conditions with the use of an acoustic camera as a tool for spatially identifying and classifying individual noise sources. The article identifies some phenomena related to the operation of main belt conveyor components and describes their characteristic frequency ranges.
1. Introduction
Being a factor harmful for the environment, noise is a particularly detrimental phenomenon. Belt conveyors connected in series to form routes stretching for many kilometers in surface mines are an important source of noise. They are typically systems operated on a round-the-clock basis, and as such they are a nuisance both for the employees of the plant and for the residents of the neighboring areas [1]. Noise emission standards are typically exceeded in the locations where belt conveyors are operated, and particularly during the night. Belt conveyors largely account for the noise generated by the entire technological system. Therefore, reducing their noise emissions is of particular importance. The requirements concerning the noise emitted by machines and devices used in mining operations are regulated in European Union directives, as well as in national acts of law introducing the provisions of these directives [2,3,4,5,6]. Generally, in relation to the entire device, the noise level depends on the main sources of noise, and the identification and location of these sources is an important step of the noise reduction cycle [7]. Importantly, the National Environmental Policy until 2030, as defined in the binding legal regulations [8,9], introduces a diagnosis of “current problems related to defining acoustic standards of environment quality which are optimal from the perspective of the environment and of sustained development” and announces the possibility to define new limit values of noise emissions to the environment [10].
2. Noise Sources in the Belt Conveyor
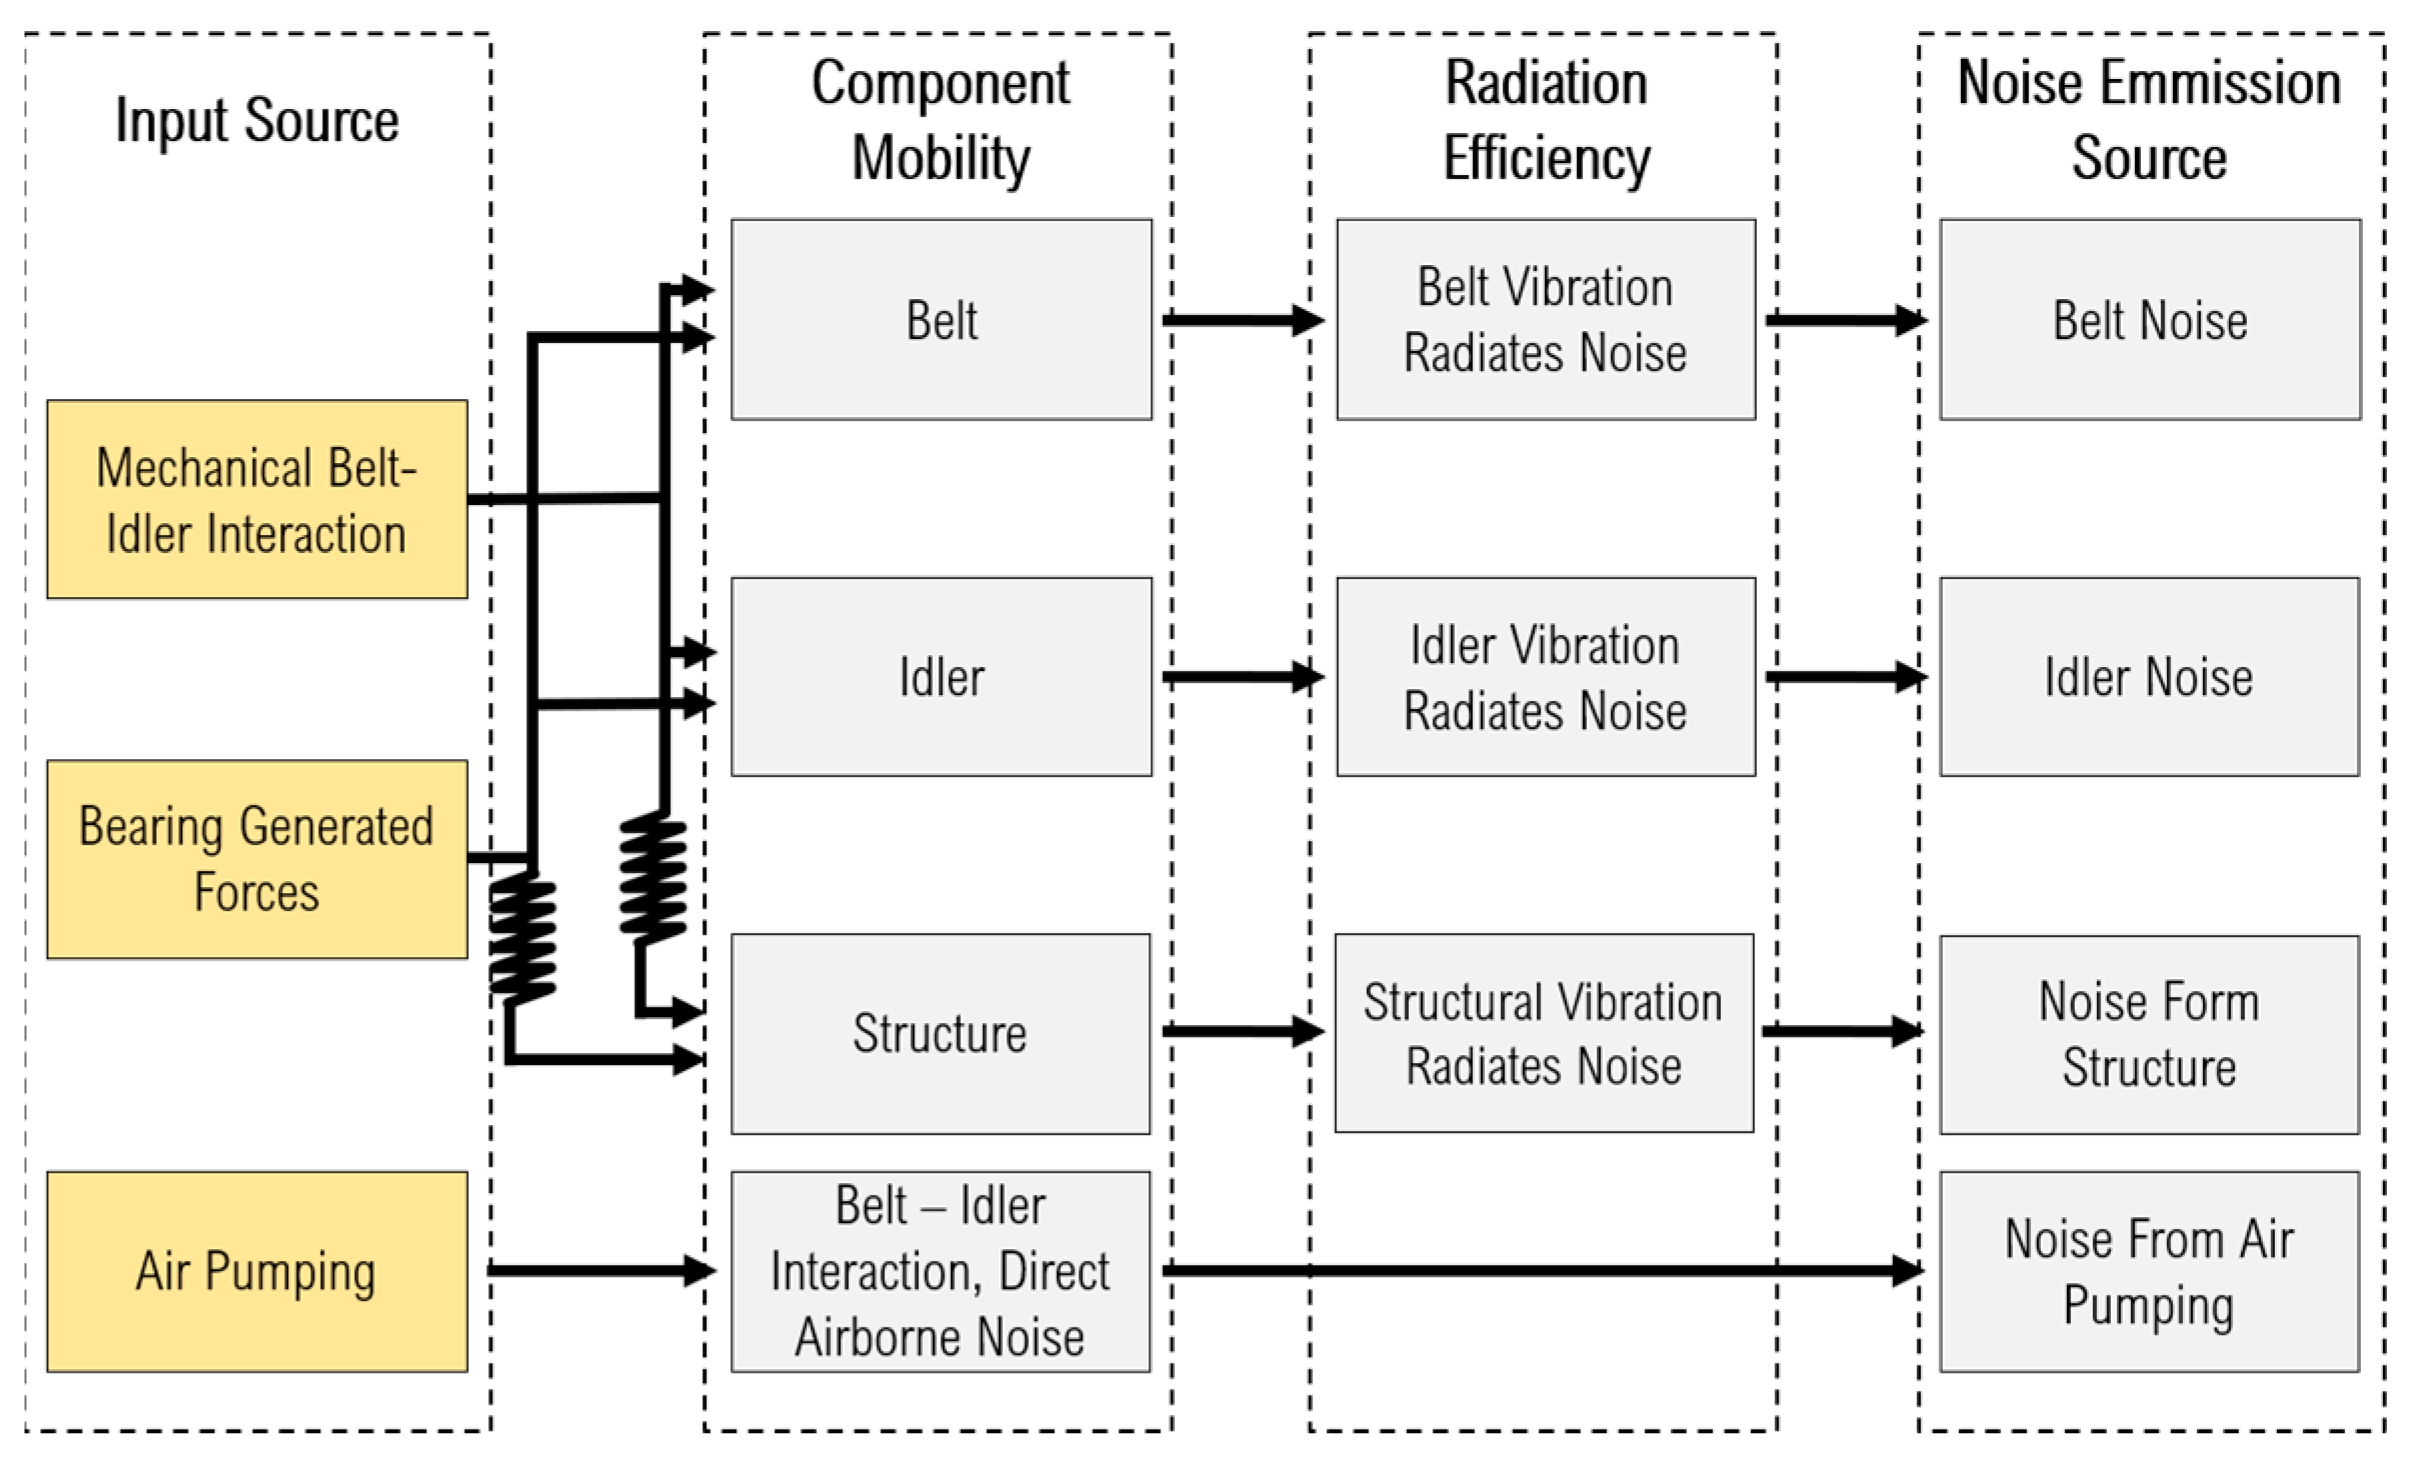
A growing number of publications on noise emissions from belt conveyors illustrates the importance of research on this problem. Analyses demonstrate that the dominant noise component originates from the contact between the belt and the idler [11,12,13,14]. This belt-idler interaction generates lateral belt vibrations as well as vibrations induced by the rotational movement of the idler, which are largely transmitted to the structural elements of the conveyor route. This phenomenon is particularly intensive in the case of new conveyor routes, in which the idlers are not yet properly settled and aligned with respect to the belt. Noise is also emitted in the process of pumping air in wedges formed as the belt enters the pulleys and idlers.
The bearing-supported elements of belt conveyors include idler axles, pulley shafts, gear shafts, and drive motor shafts. In the case of bearings, noise and vibrations are generated by the friction of the rolling elements against the raceway. The level of noise generated by a bearing depends on its load, the material it is made of, and the used lubricant [15]. The technical condition and the wear degree of the bearing is also of major importance. The peak value of sound pressure in an entire damaged bearing may exceed 100 dB [16].
The noise generated by an idler is influenced by the manufacturing technology and its mass. The type of the bearings is also important [17]. The noise along the conveyor route largely depends on the belt velocity and the materials used in the bottom cover and in the idler coat. Worn idler bearings, structural defects in the axles and sealings, or improper assembly on the conveyor route may all cause vibrations of the coat, which are emitted in the form of an acoustic wave [13]. The vibroacoustic properties of idlers may be significantly improved by adjusting the type of coat lining. The conveyor belt partially dampens the vibrations from the idler, but they are also transmitted to the structural elements of the conveyor route.
The mechanisms of noise generation also result from aerodynamic phenomena, i.e. the air-flow with the accompanying pressure changes around the moveable elements [18]. As in the case of a vehicle tire [19], this type of noise is generated in the belt conveyor by the belt engaged with the idlers and the pulleys. The geometry of the rotating elements at the contact point with the belt results in the formation of air wedges, from which the air is pumped [16,17], and transverse belt vibrations cause local air pressure changes. The vibration frequency of the belt is typically within the range of 2.5 to 16 Hz [20]. A 2.5 Hz belt vibration occurs for belts at low speed near 0.8 m/s with an idler diameter Di near 100 mm, whereas the upper belt vibration frequency could be as high as 16 Hz for a 7.5 m/s belt speed with 152 mm idler diameter. Idler rotation and belt excitation frequency Fb is governed by [21]:
This phenomenon was carefully analyzed on an example of belt transmissions located in closed spaces [22]. The schematic diagram in Figure 1 shows noise generation mechanisms in belt conveyors [12].
In the case of long transportation systems operating in surface mines, noise sources are located pointwise at the head station and at the tail station, and also line-wise along the conveyor route. In order to verify the existing knowledge, and most importantly to arrange all of the noise sources described in the literature by noise emission levels, laboratory tests were performed on an experimental conveyor.
3. Materials and Methods
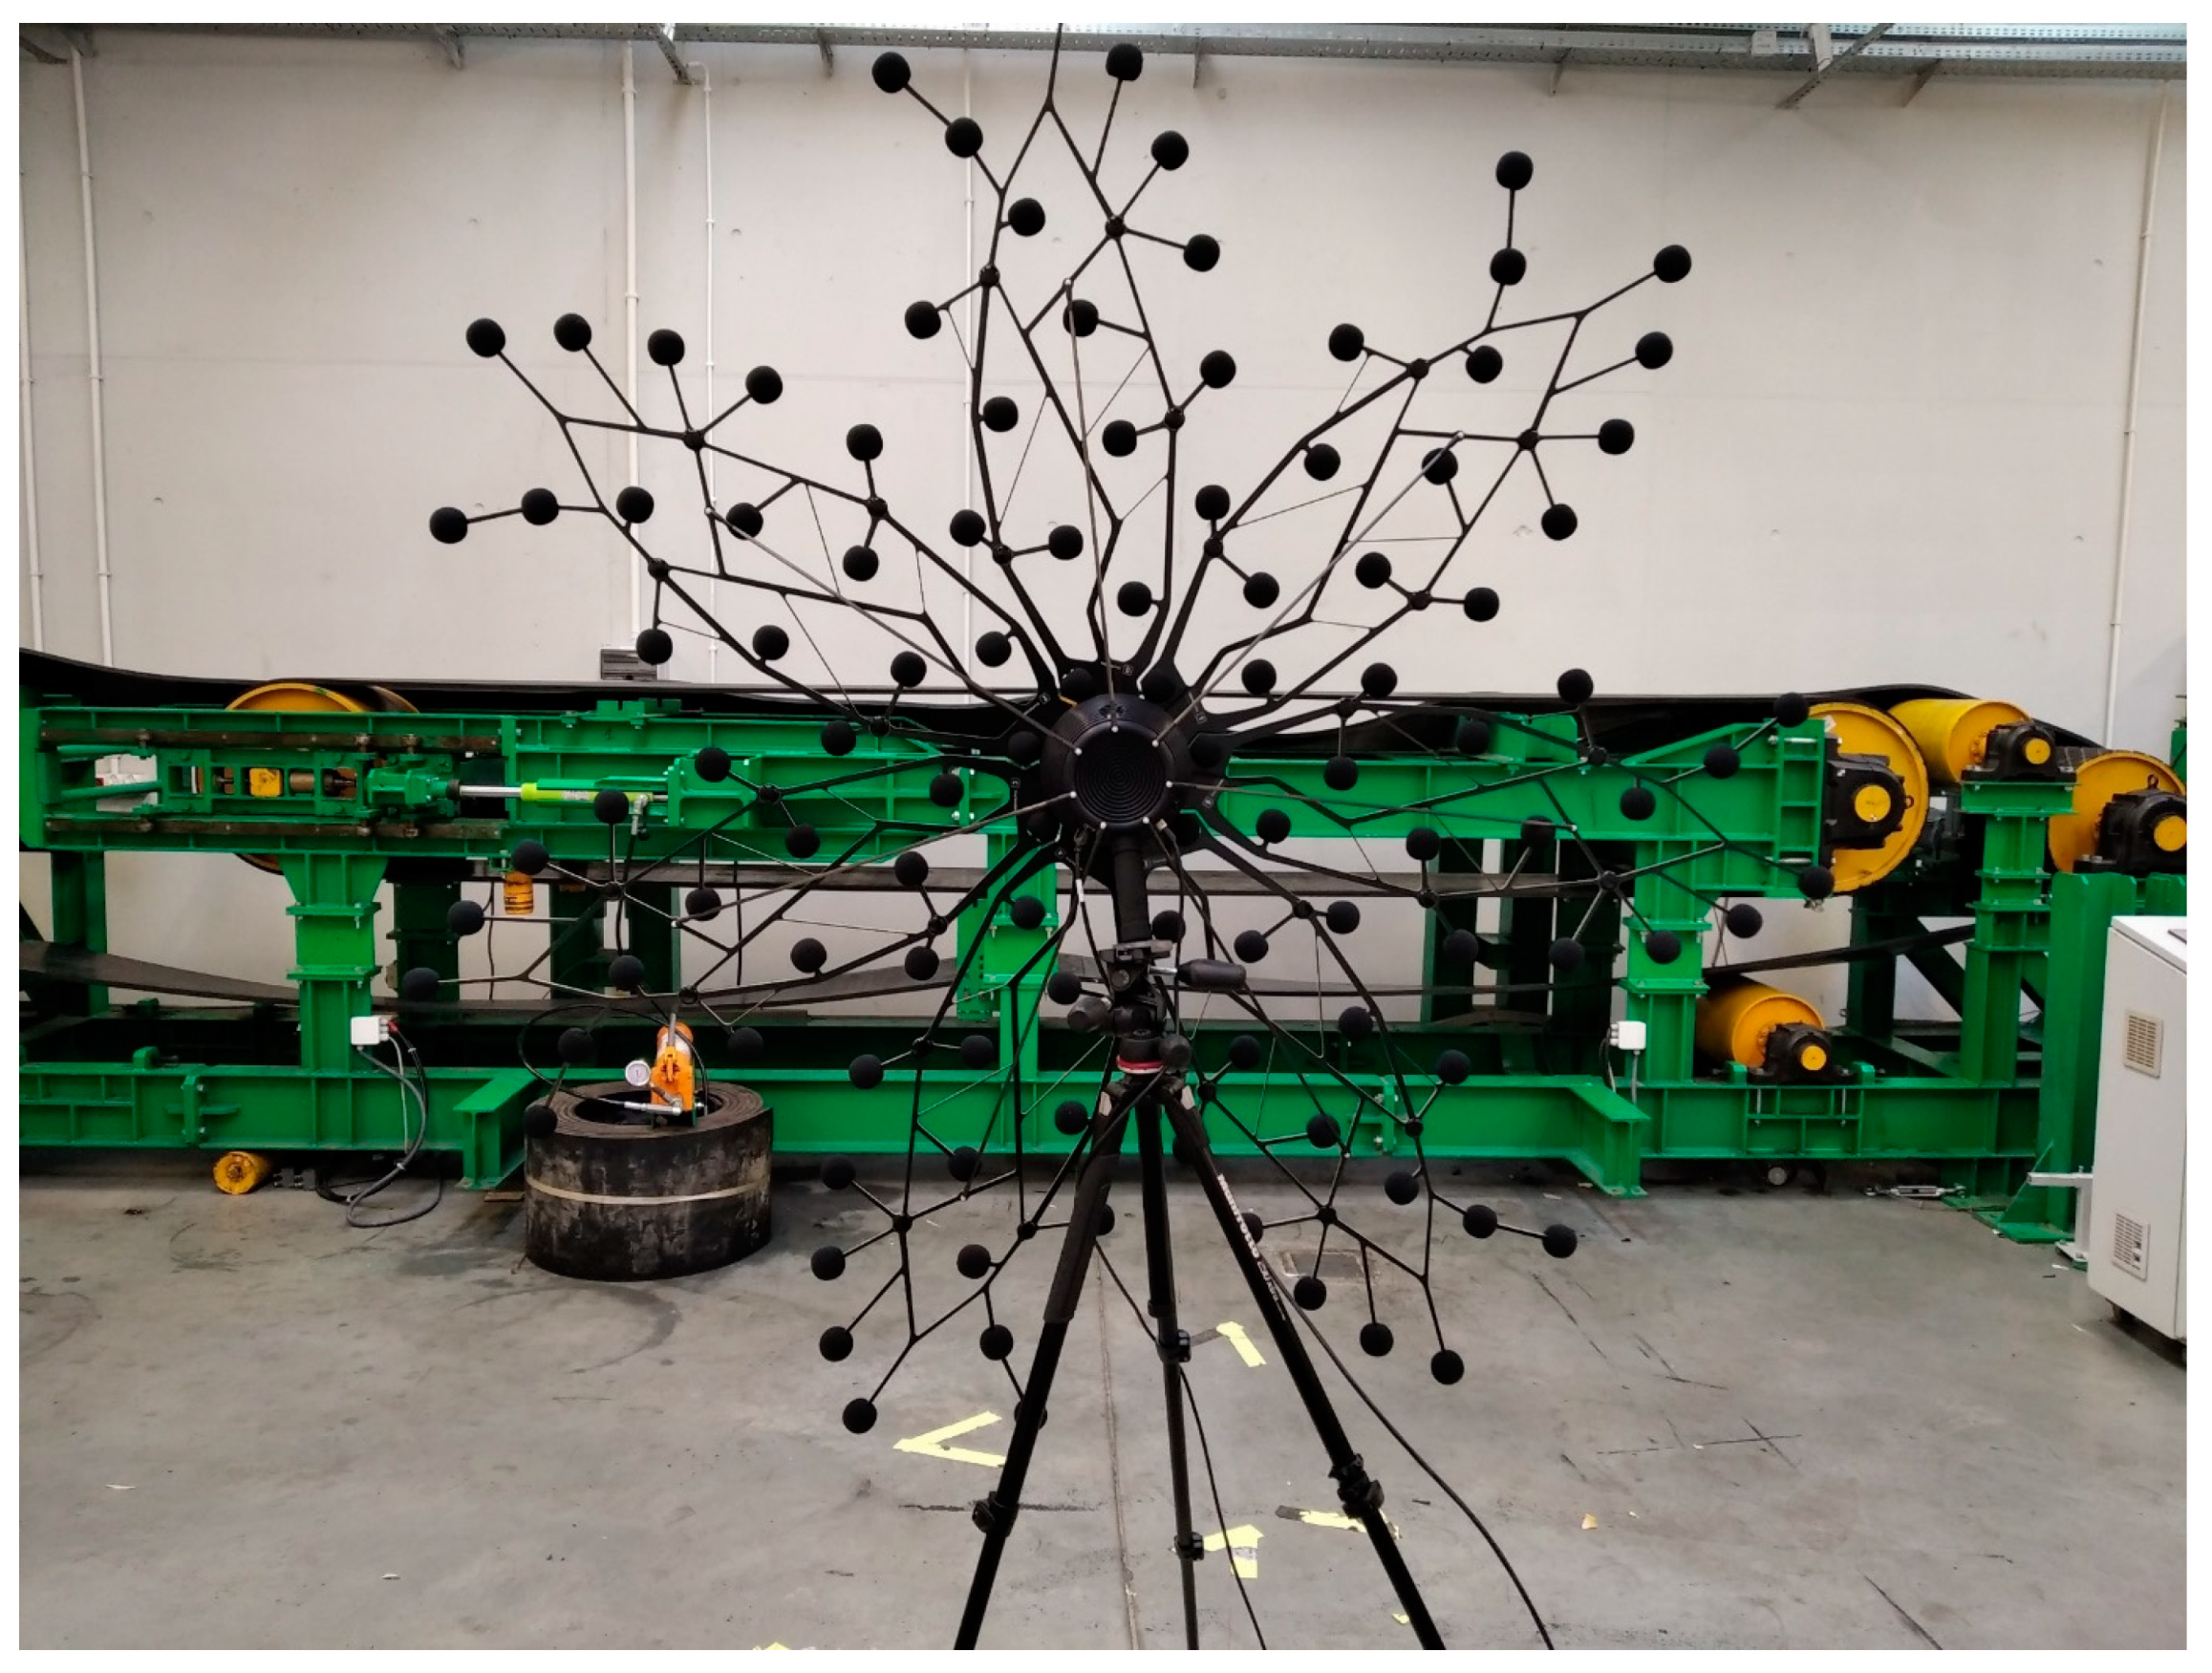
The tests were performed with the use of an acoustic camera CAE Software and Systems GmbH, Gütersloh, North Rhine-Westphalia, Germany (Figure 2), which allows the locations of the main noise sources in the analyzed machine to be identified simultaneously. An acoustic camera is a combination of two devices: a video camera and measurement microphones. The measurement microphones record changes of the acoustic pressure, while the video image is simultaneously recorded with the camera. Such a synchronization allows simultaneous sound pressure measurement and spatial identification of the noise source. The camera used in the measurement equipment has a Bionic L-112 microphone array containing 112 MEMS microphones and is 1.7 m in diameter. Its maximum sample rate is 48 kHz for the frequency range of the sound pressure between 10 Hz and 24 kHz. The operating principle of an acoustic camera is based on beamforming methods, which allow precise calculations of noise emission delays by several sources for individual micro-phones [23]. The video image and the recorded sound are sent via an Ethernet interface to the computer, in which the data are then combined and analyzed. With the help of included algorithms, the dedicated CAE Noise Inspector software allows sound distribution maps to be developed. As a result, the main noise sources can be located, and the absolute values of sound pressure levels can be identified. The camera enables the recording of the sound pressure level already at 33 dB and up to 120 dB, with dynamics up to 40 dB.
The tests were performed for a short experimental conveyor 10 m in length, consisting of two pulleys and one idler in the top run (Figure 2). The conveyor was equipped with an EP1250/5 textile belt 0.4 m in width, moving at 2.75 m/s (half the maximum speed for this rig), with average force in the belt equal to 25 kN.
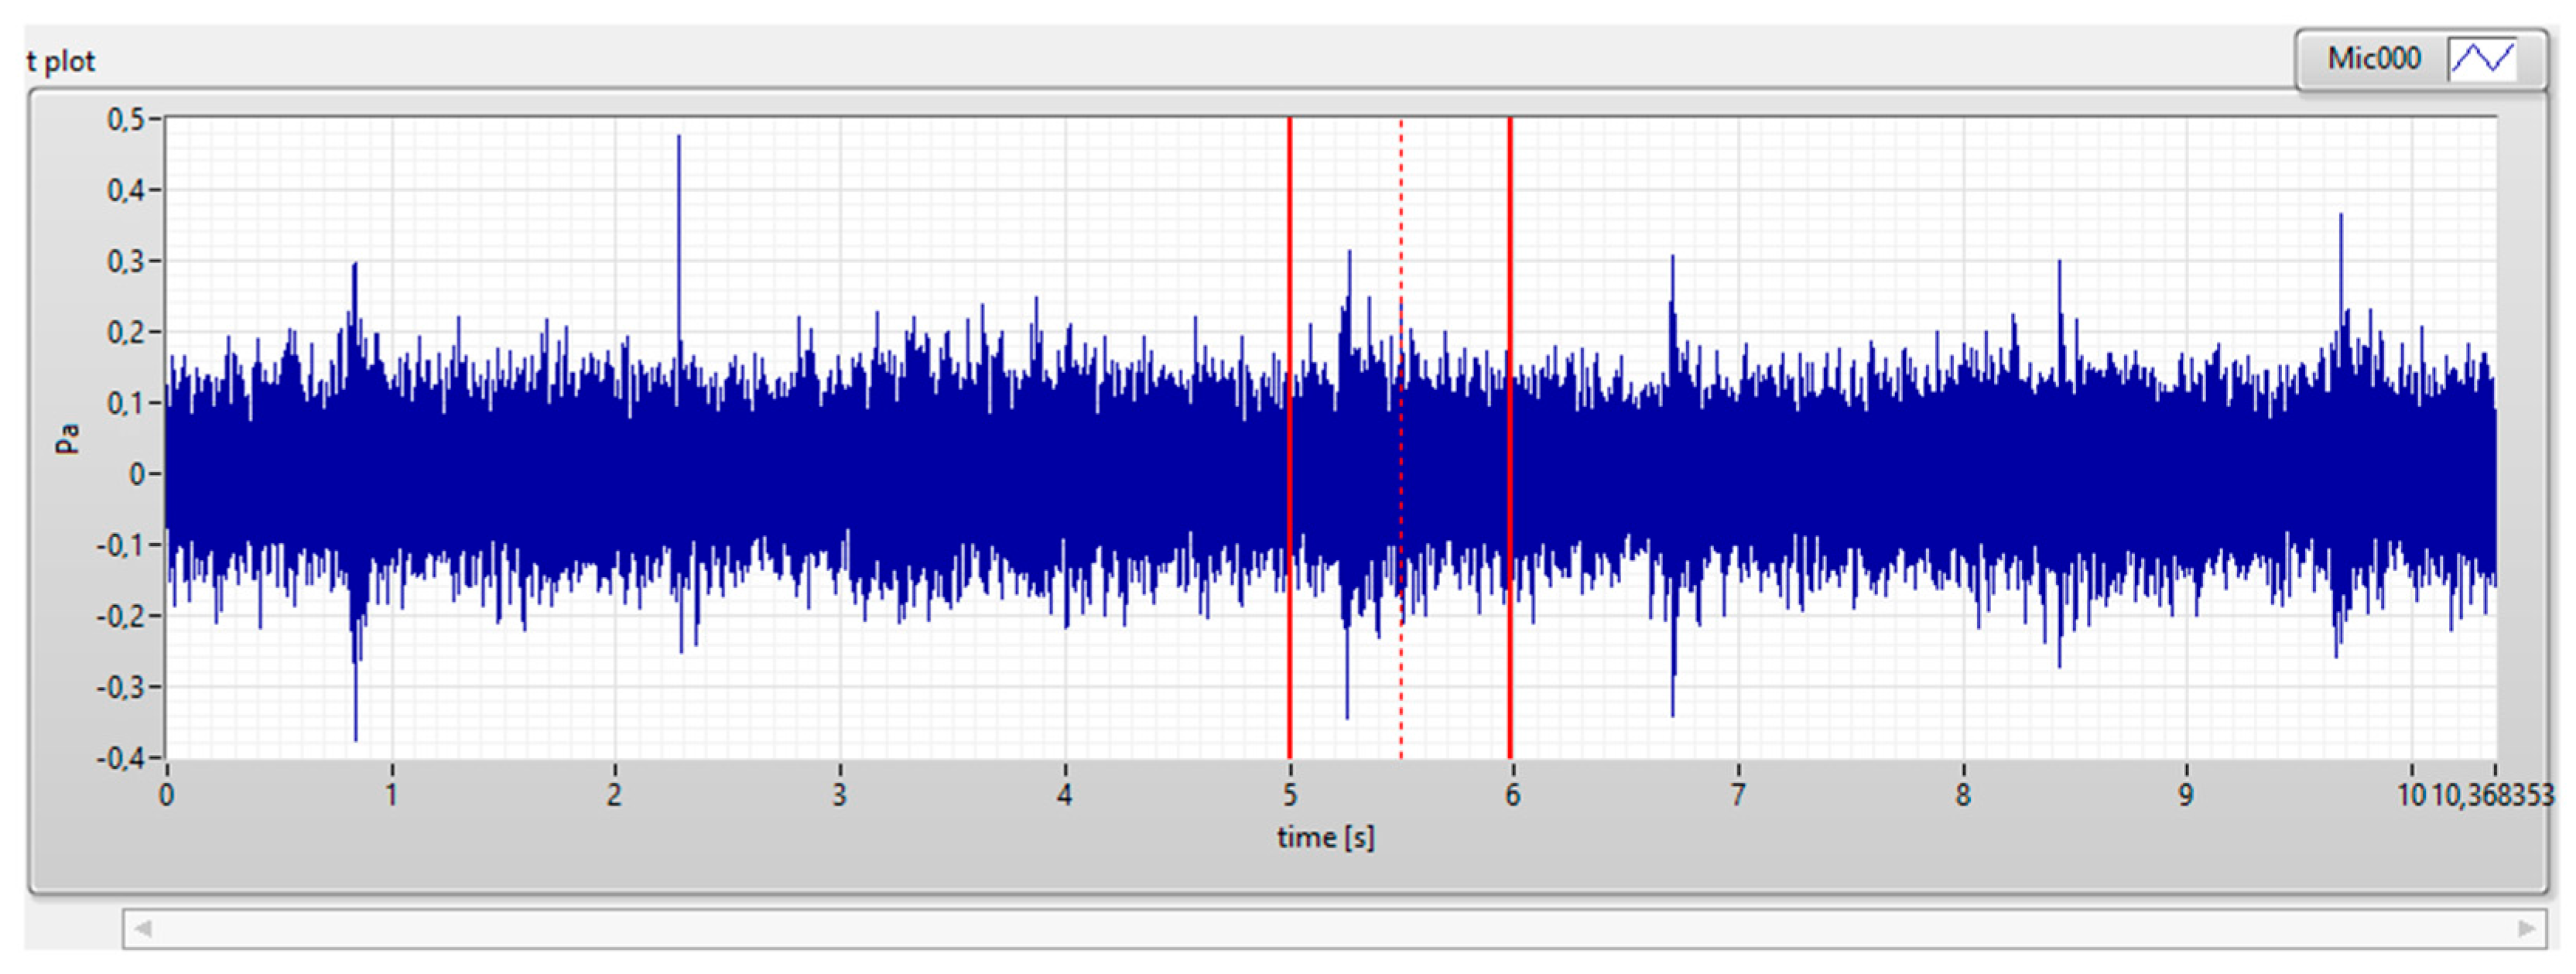
Measurements in laboratory conditions allow the elimination of the influence of the background noise on the measurement results. Owing to this fact, the source of noise can be located precisely. The maximum and minimum distance between the acoustic camera and the investigated object is limited by the measurement range of the microphones. The acoustic camera was positioned at a distance of 4.1 m from the belt conveyor. Ten-second signal samples were recorded with a sampling rate of 800 Hz (Figure 3). The recorded signals were divided in order to obtain 1-second samples, which were subsequently subjected to direct analysis. Individual analyses of the signal split into shorter time intervals facilitates the interpretation of the obtained results and results in a shorter data processing time. The general noise of the entire laboratory belt conveyor, as identified from the recorded time signal, was 73.32 dB. This is noise for the full range of frequencies found in the spectrum.
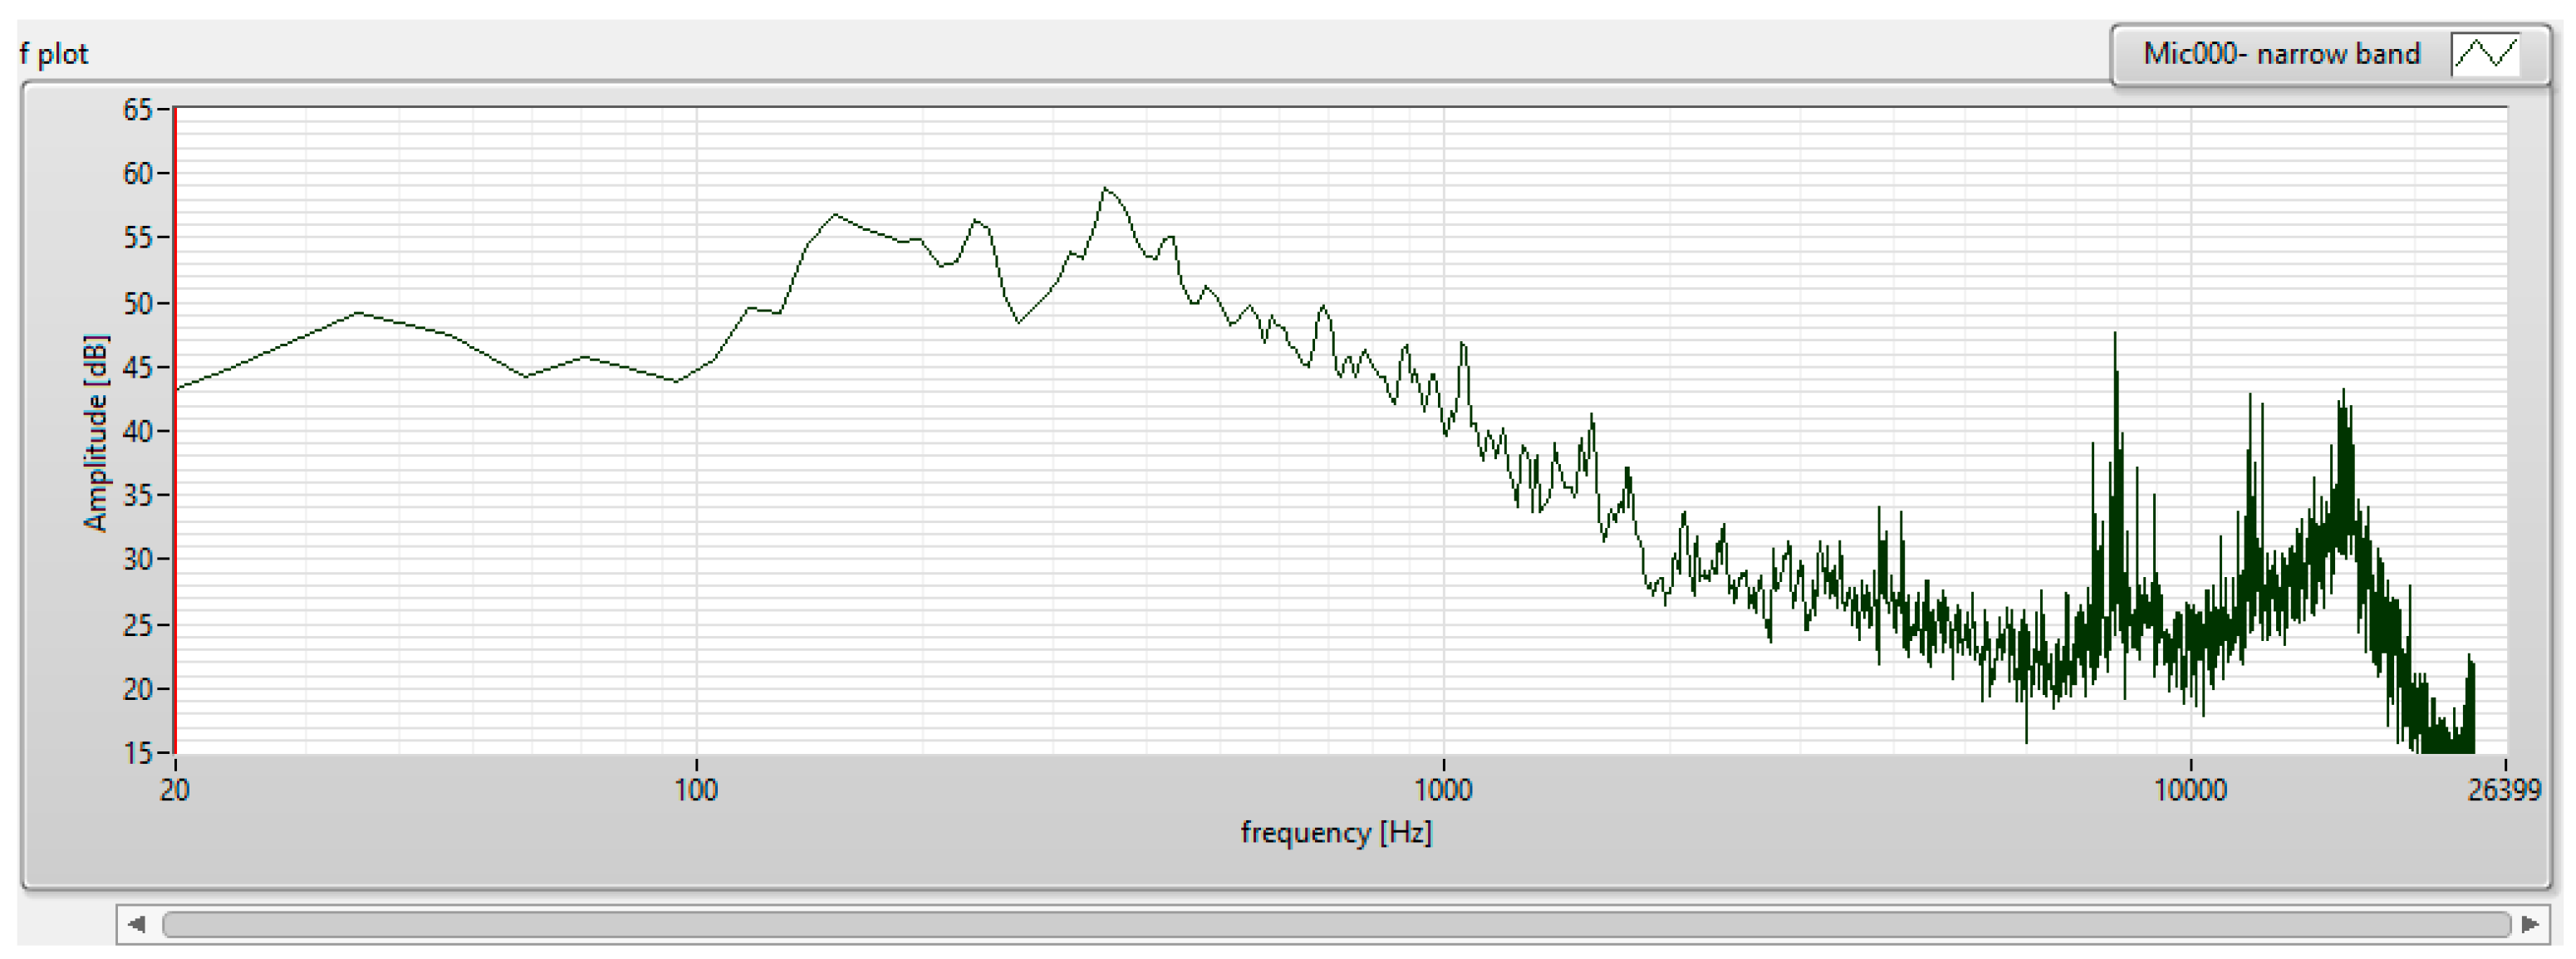
The signals were analyzed using the fast Fourier transform (FFT), which allows the time signal amplitude to be described as a function of frequency (Figure 4). Such a signal description is called a signal spectrum. The signal spectrum has a practical application, as it enables the identification of the dominant frequencies. Each element emits noise of a specific frequency. A function which allows these frequencies to be found in the signal spectrum and related to a particular noise source significantly improves research efficiency. The Noise Inspector processing algorithms integrated with the camera also facilitate the interpretation of the results for the entire range of the recorded frequencies. The signal spectrum can be best analyzed if it is divided into smaller frequency ranges, thus increasing the chances of identifying individual noise sources.
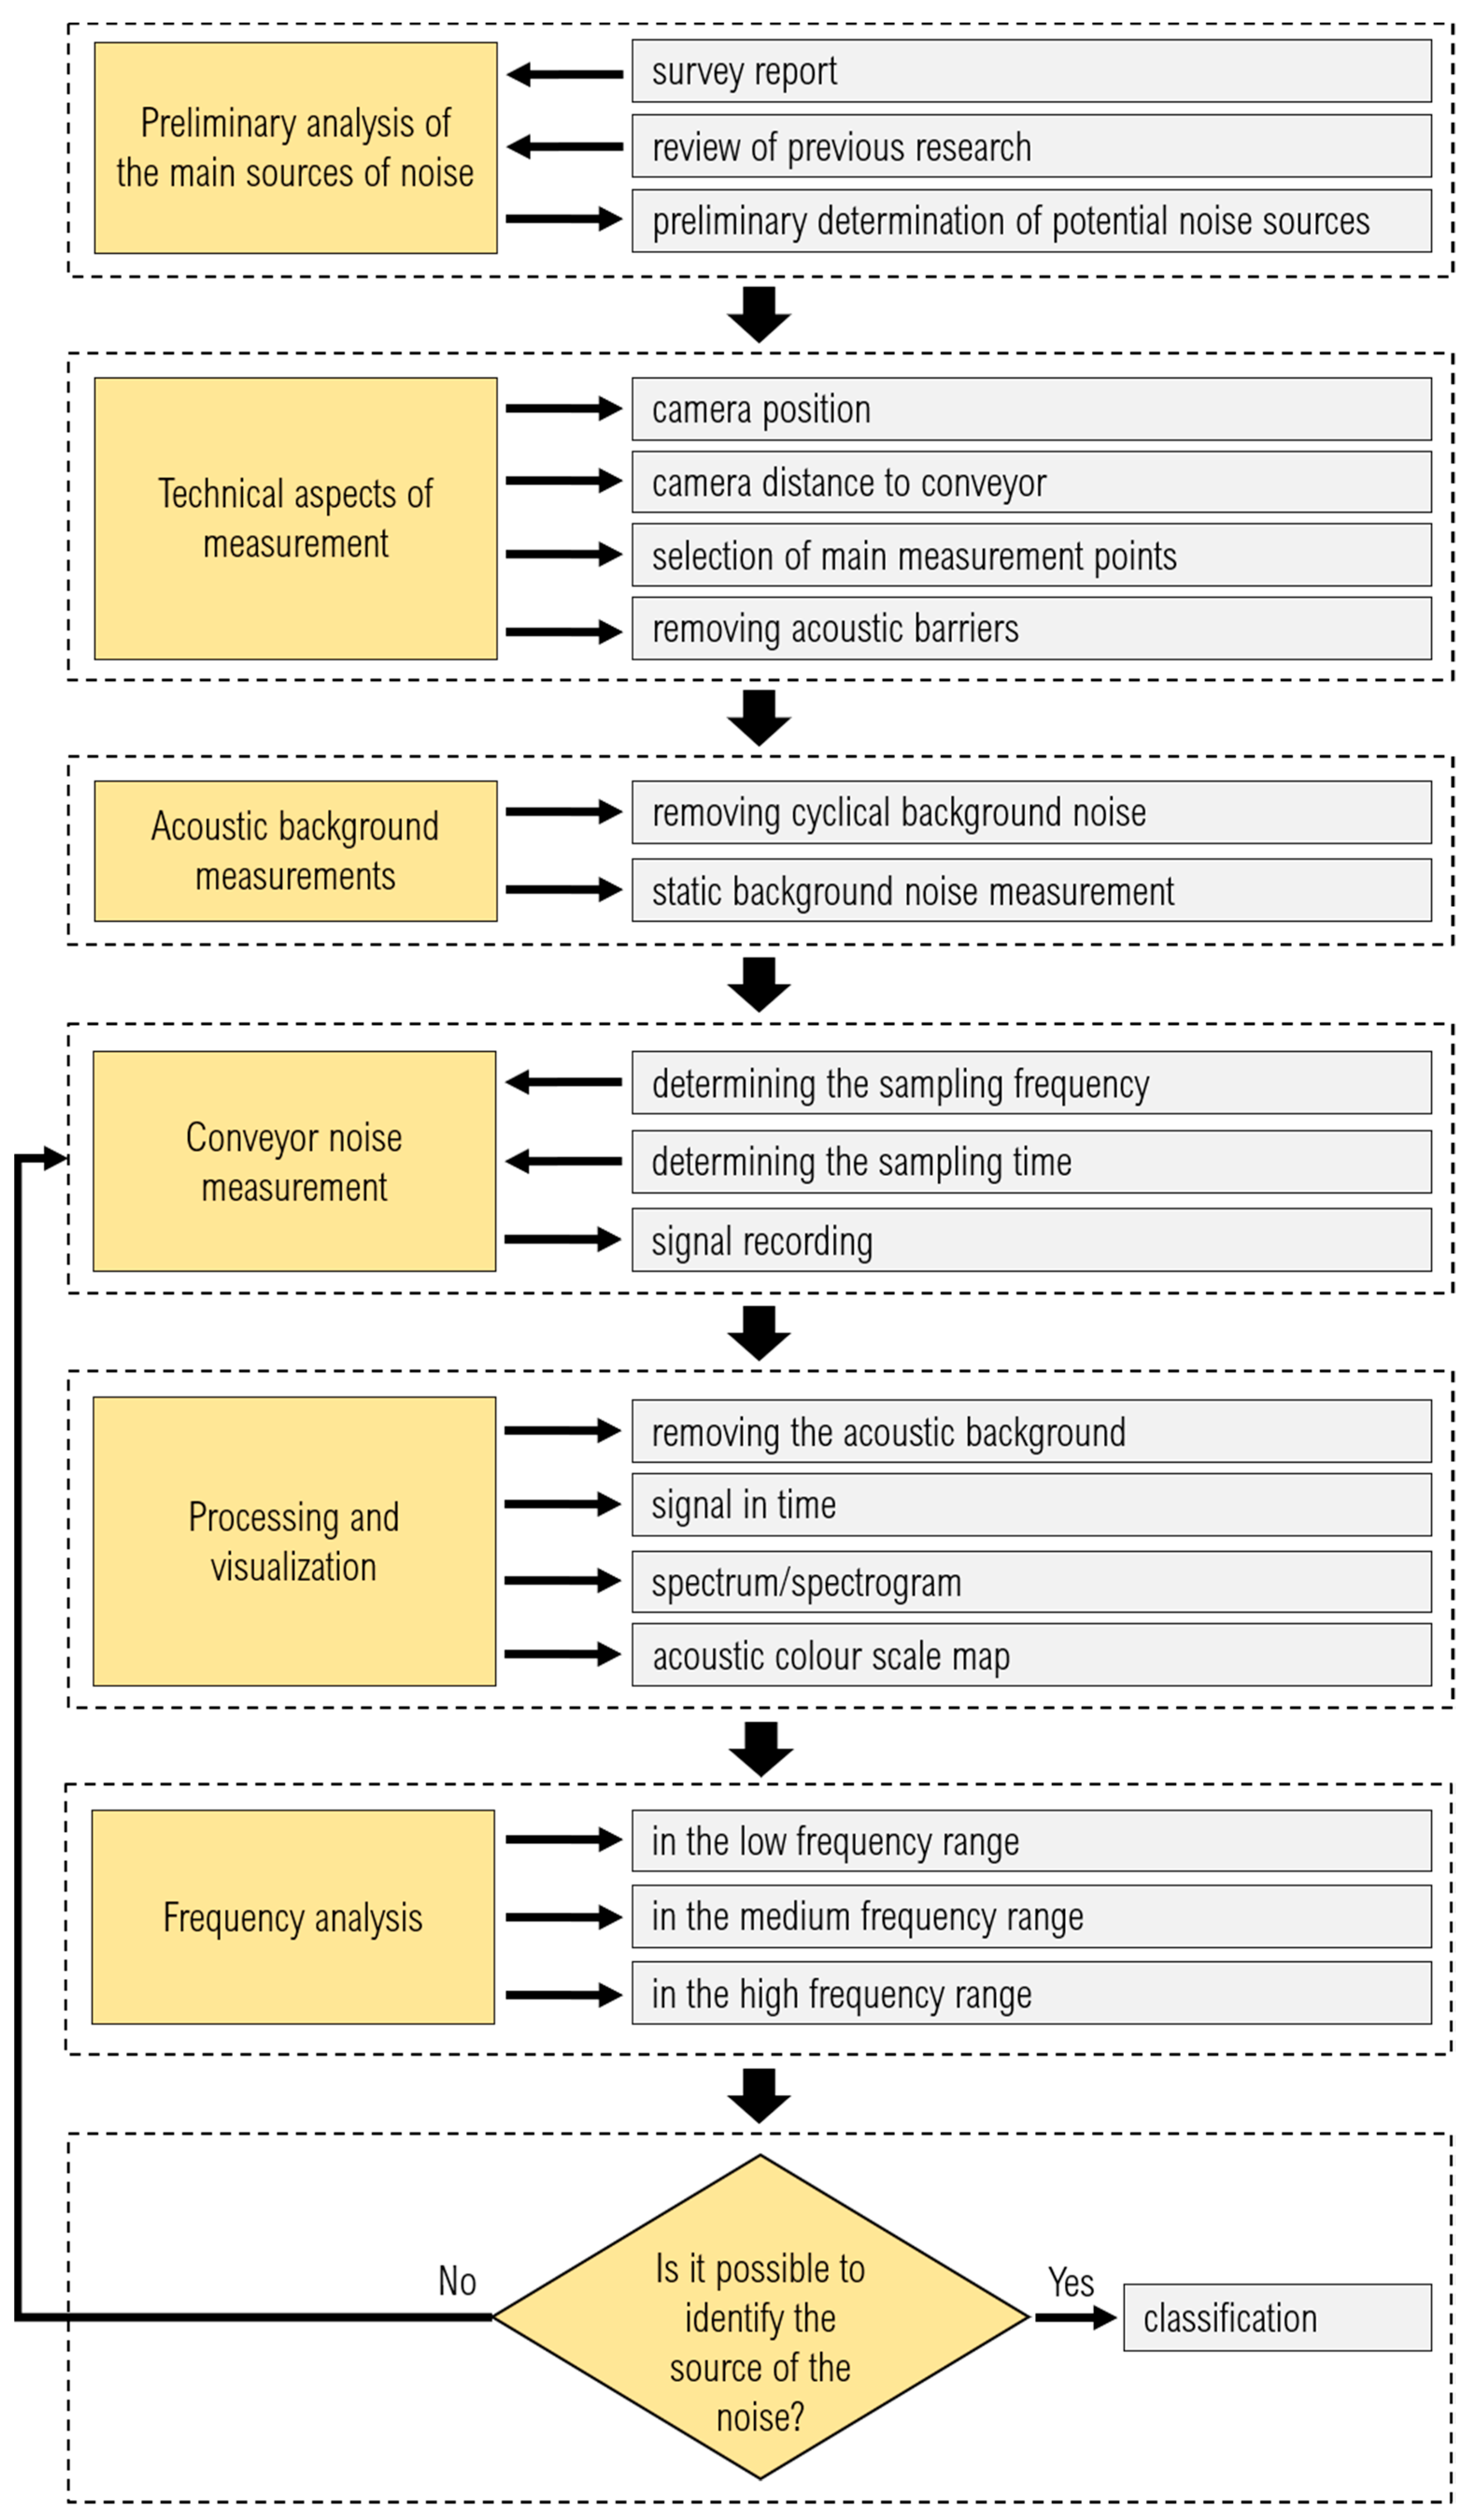
The schematic diagram below (Figure 5) presents the successive steps of the research into noise sources in a belt conveyor.
4. Results
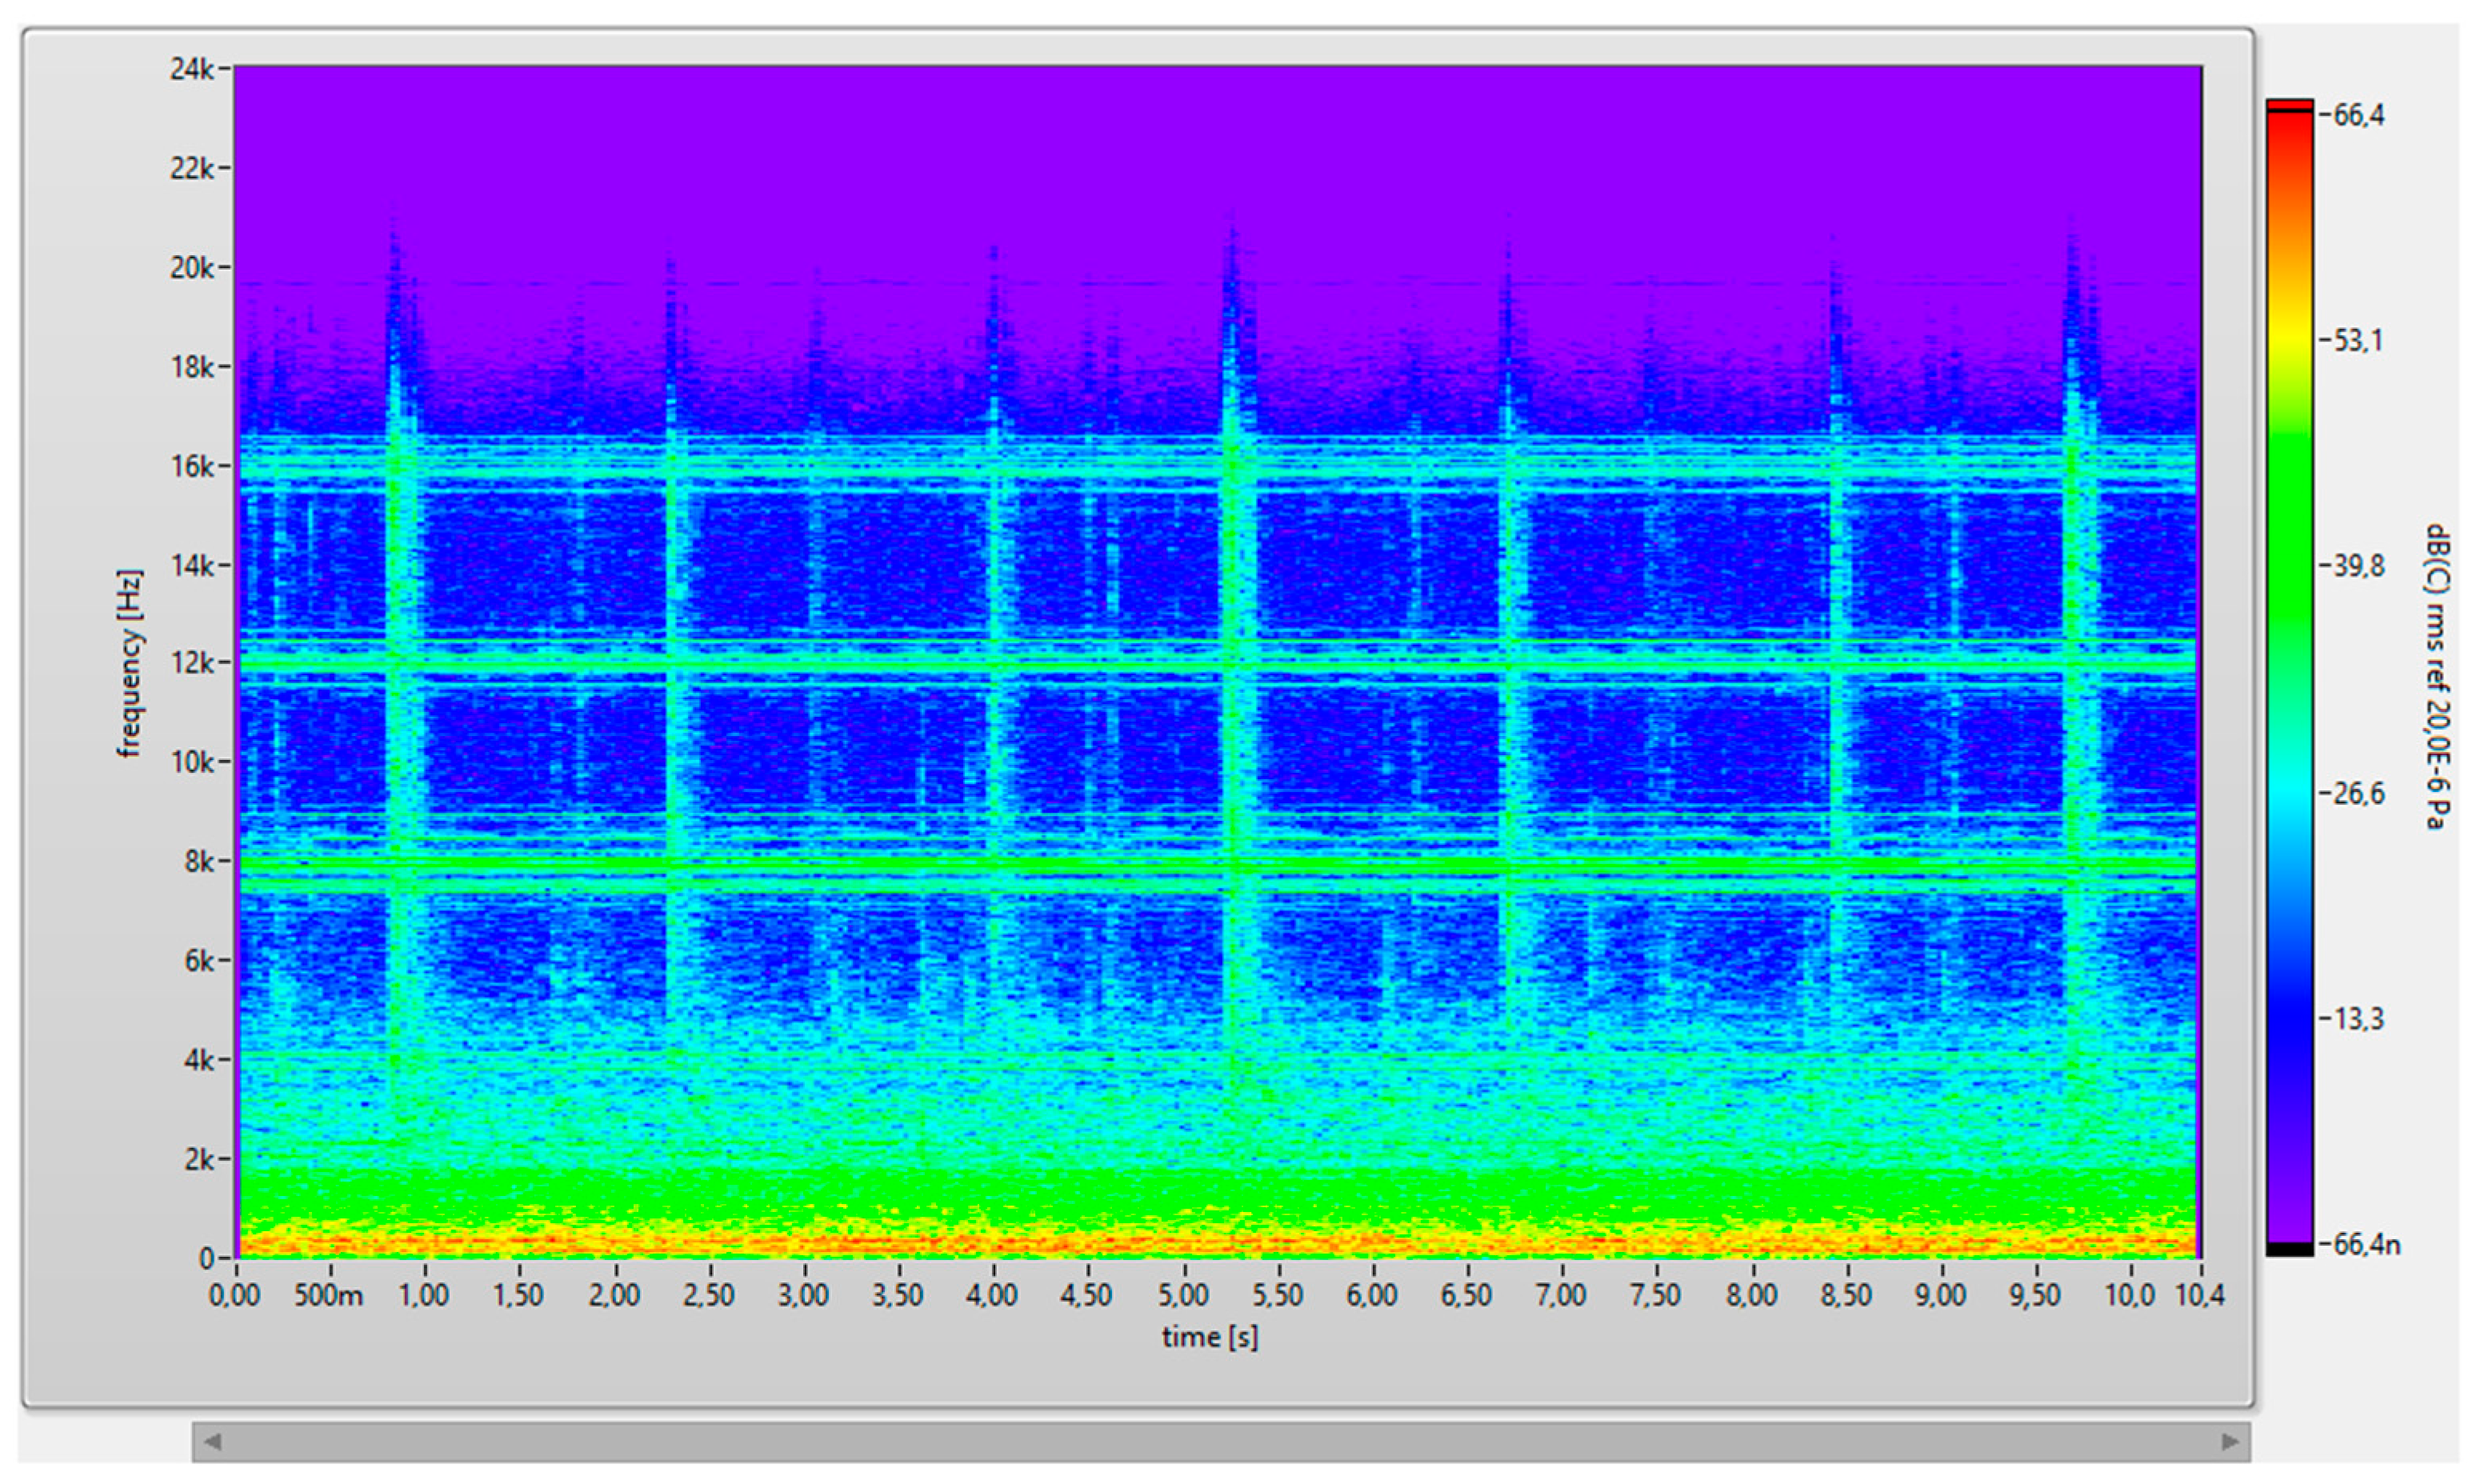
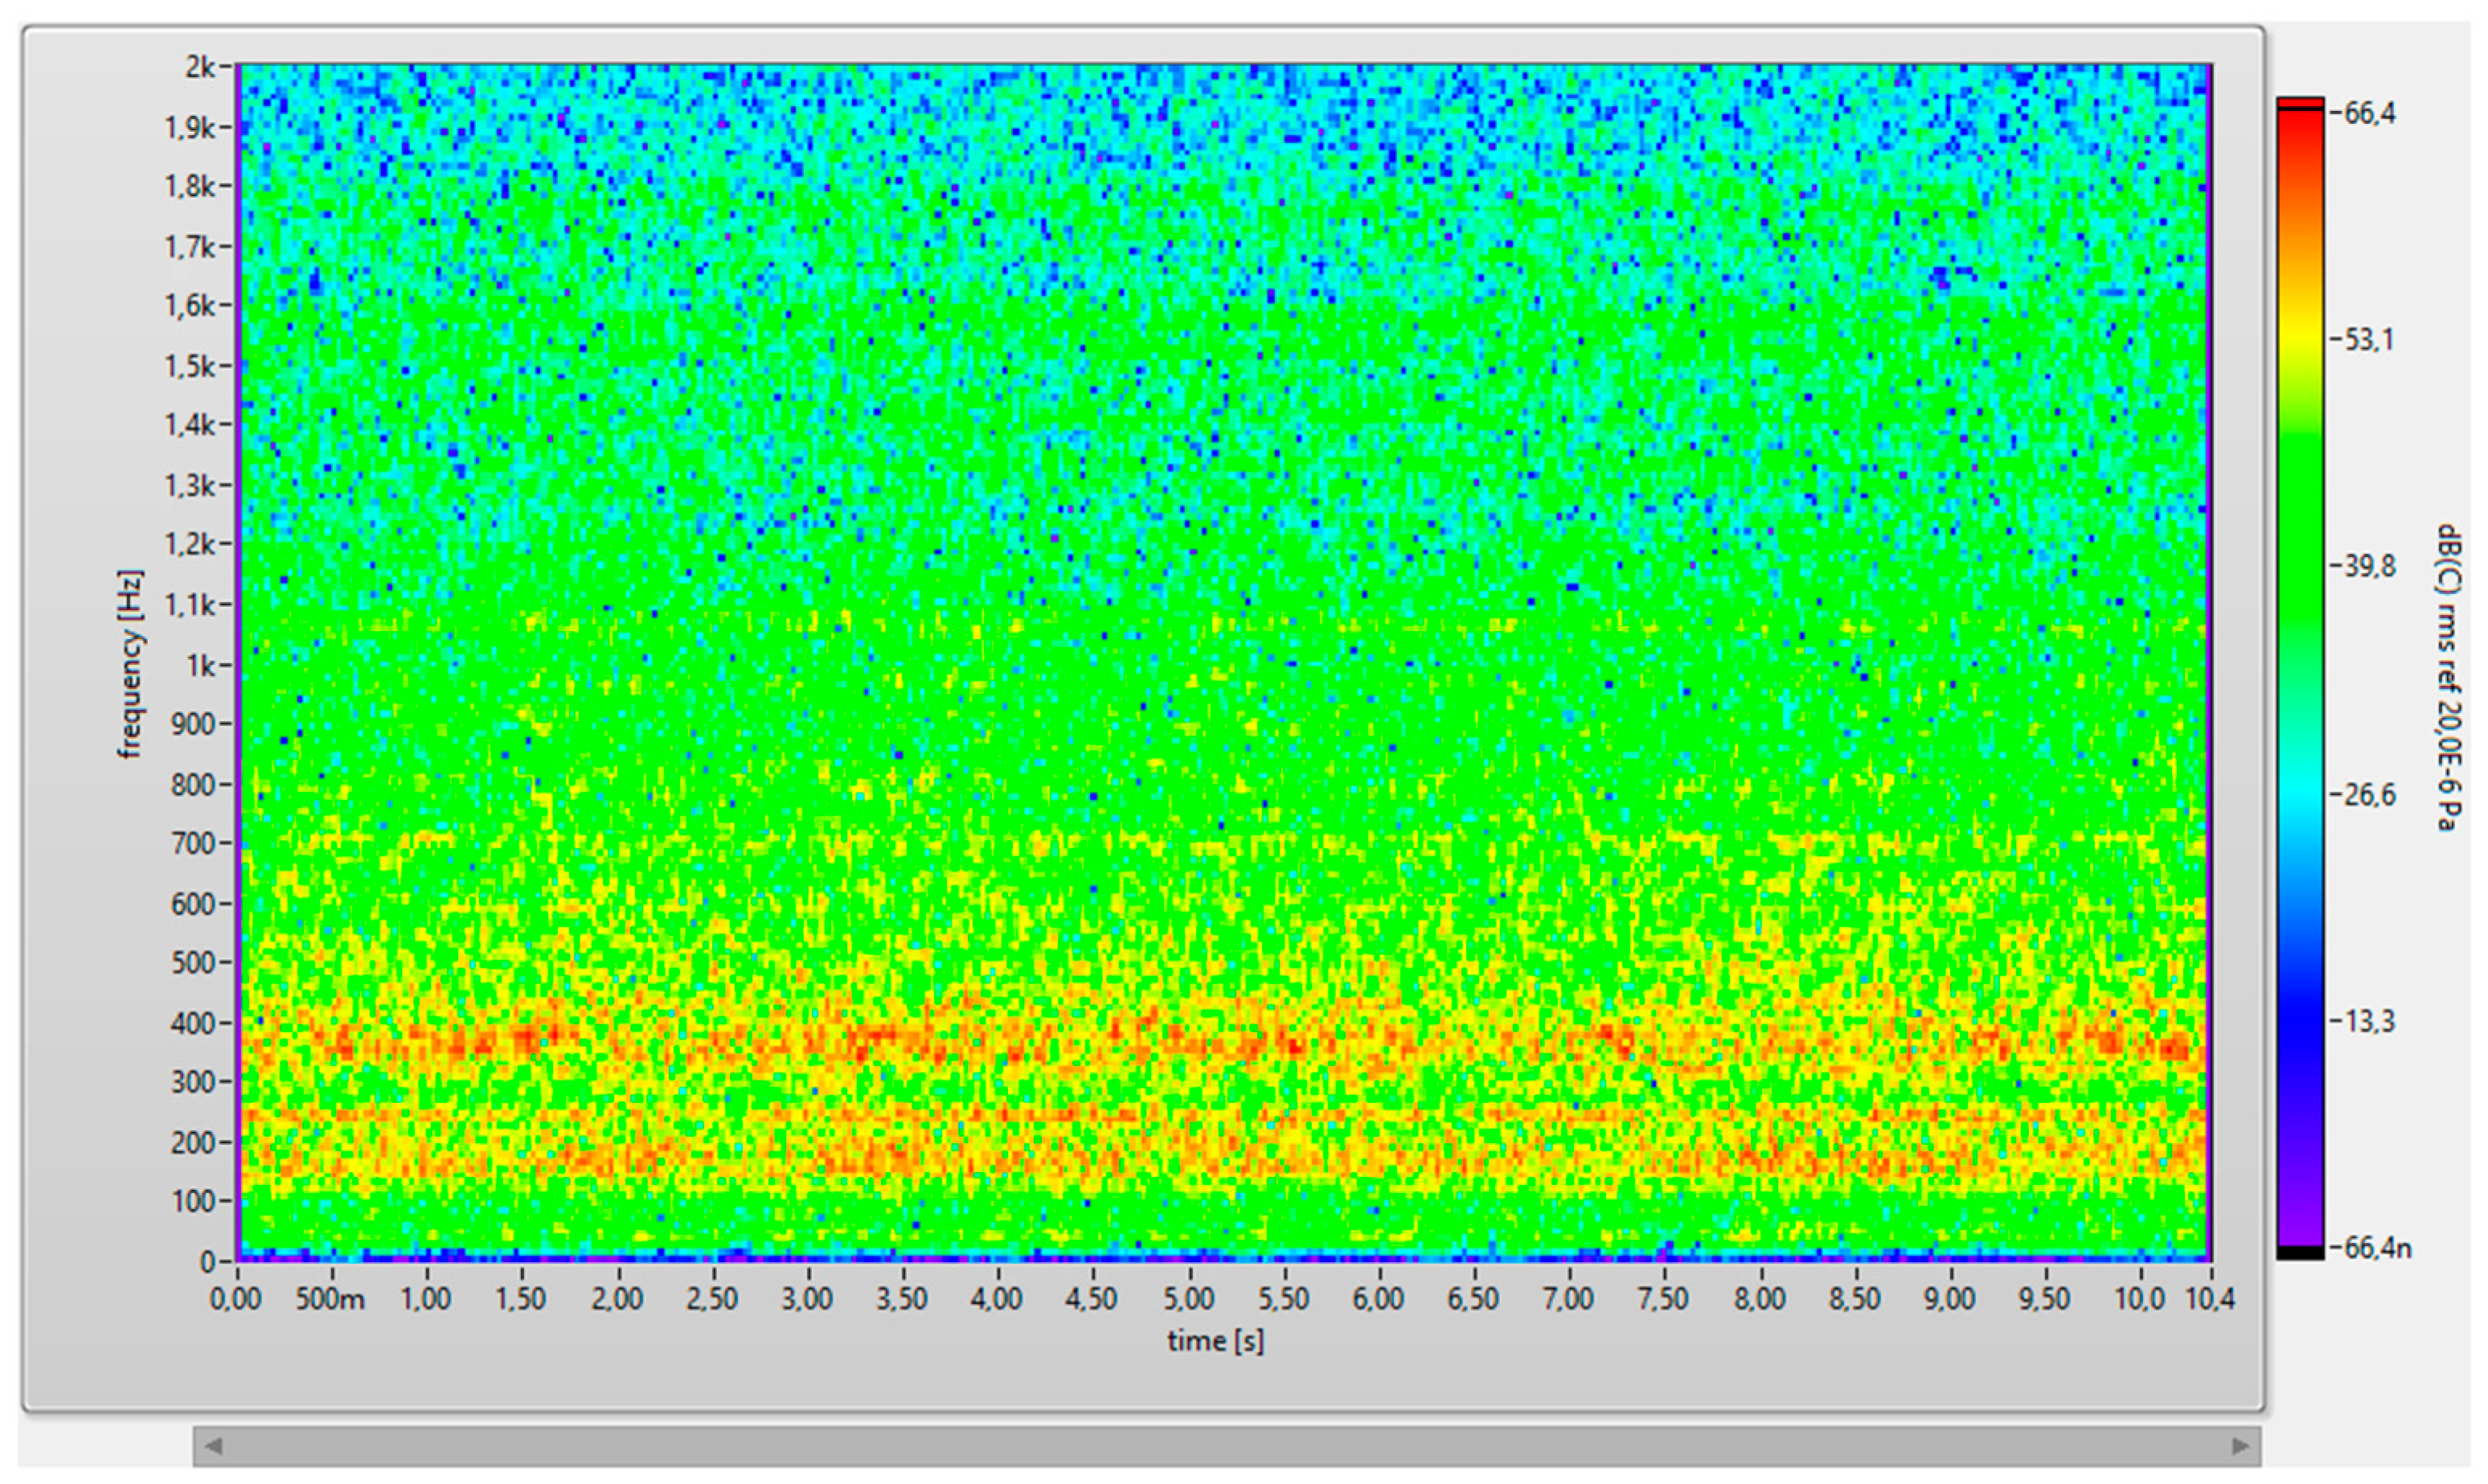
The noise spectrum (Figure 4) and the spectrogram (Figure 6) clearly show the concentration of the main noise sources within the low and medium frequency range. This fact indicates that the belt conveyor, similarly to other industrial devices, generates noise mainly in the low and medium frequency range between 22 Hz and 2 kHz (Figure 6). This frequency range is considered the most harmful to human hearing, especially when the person is situated at a small distance from the source [24]. For this reason, a number of noise reduction methods were developed, and the methods developed for the frequency of up to 600 Hz demonstrate the greatest efficiency [24,25,26].
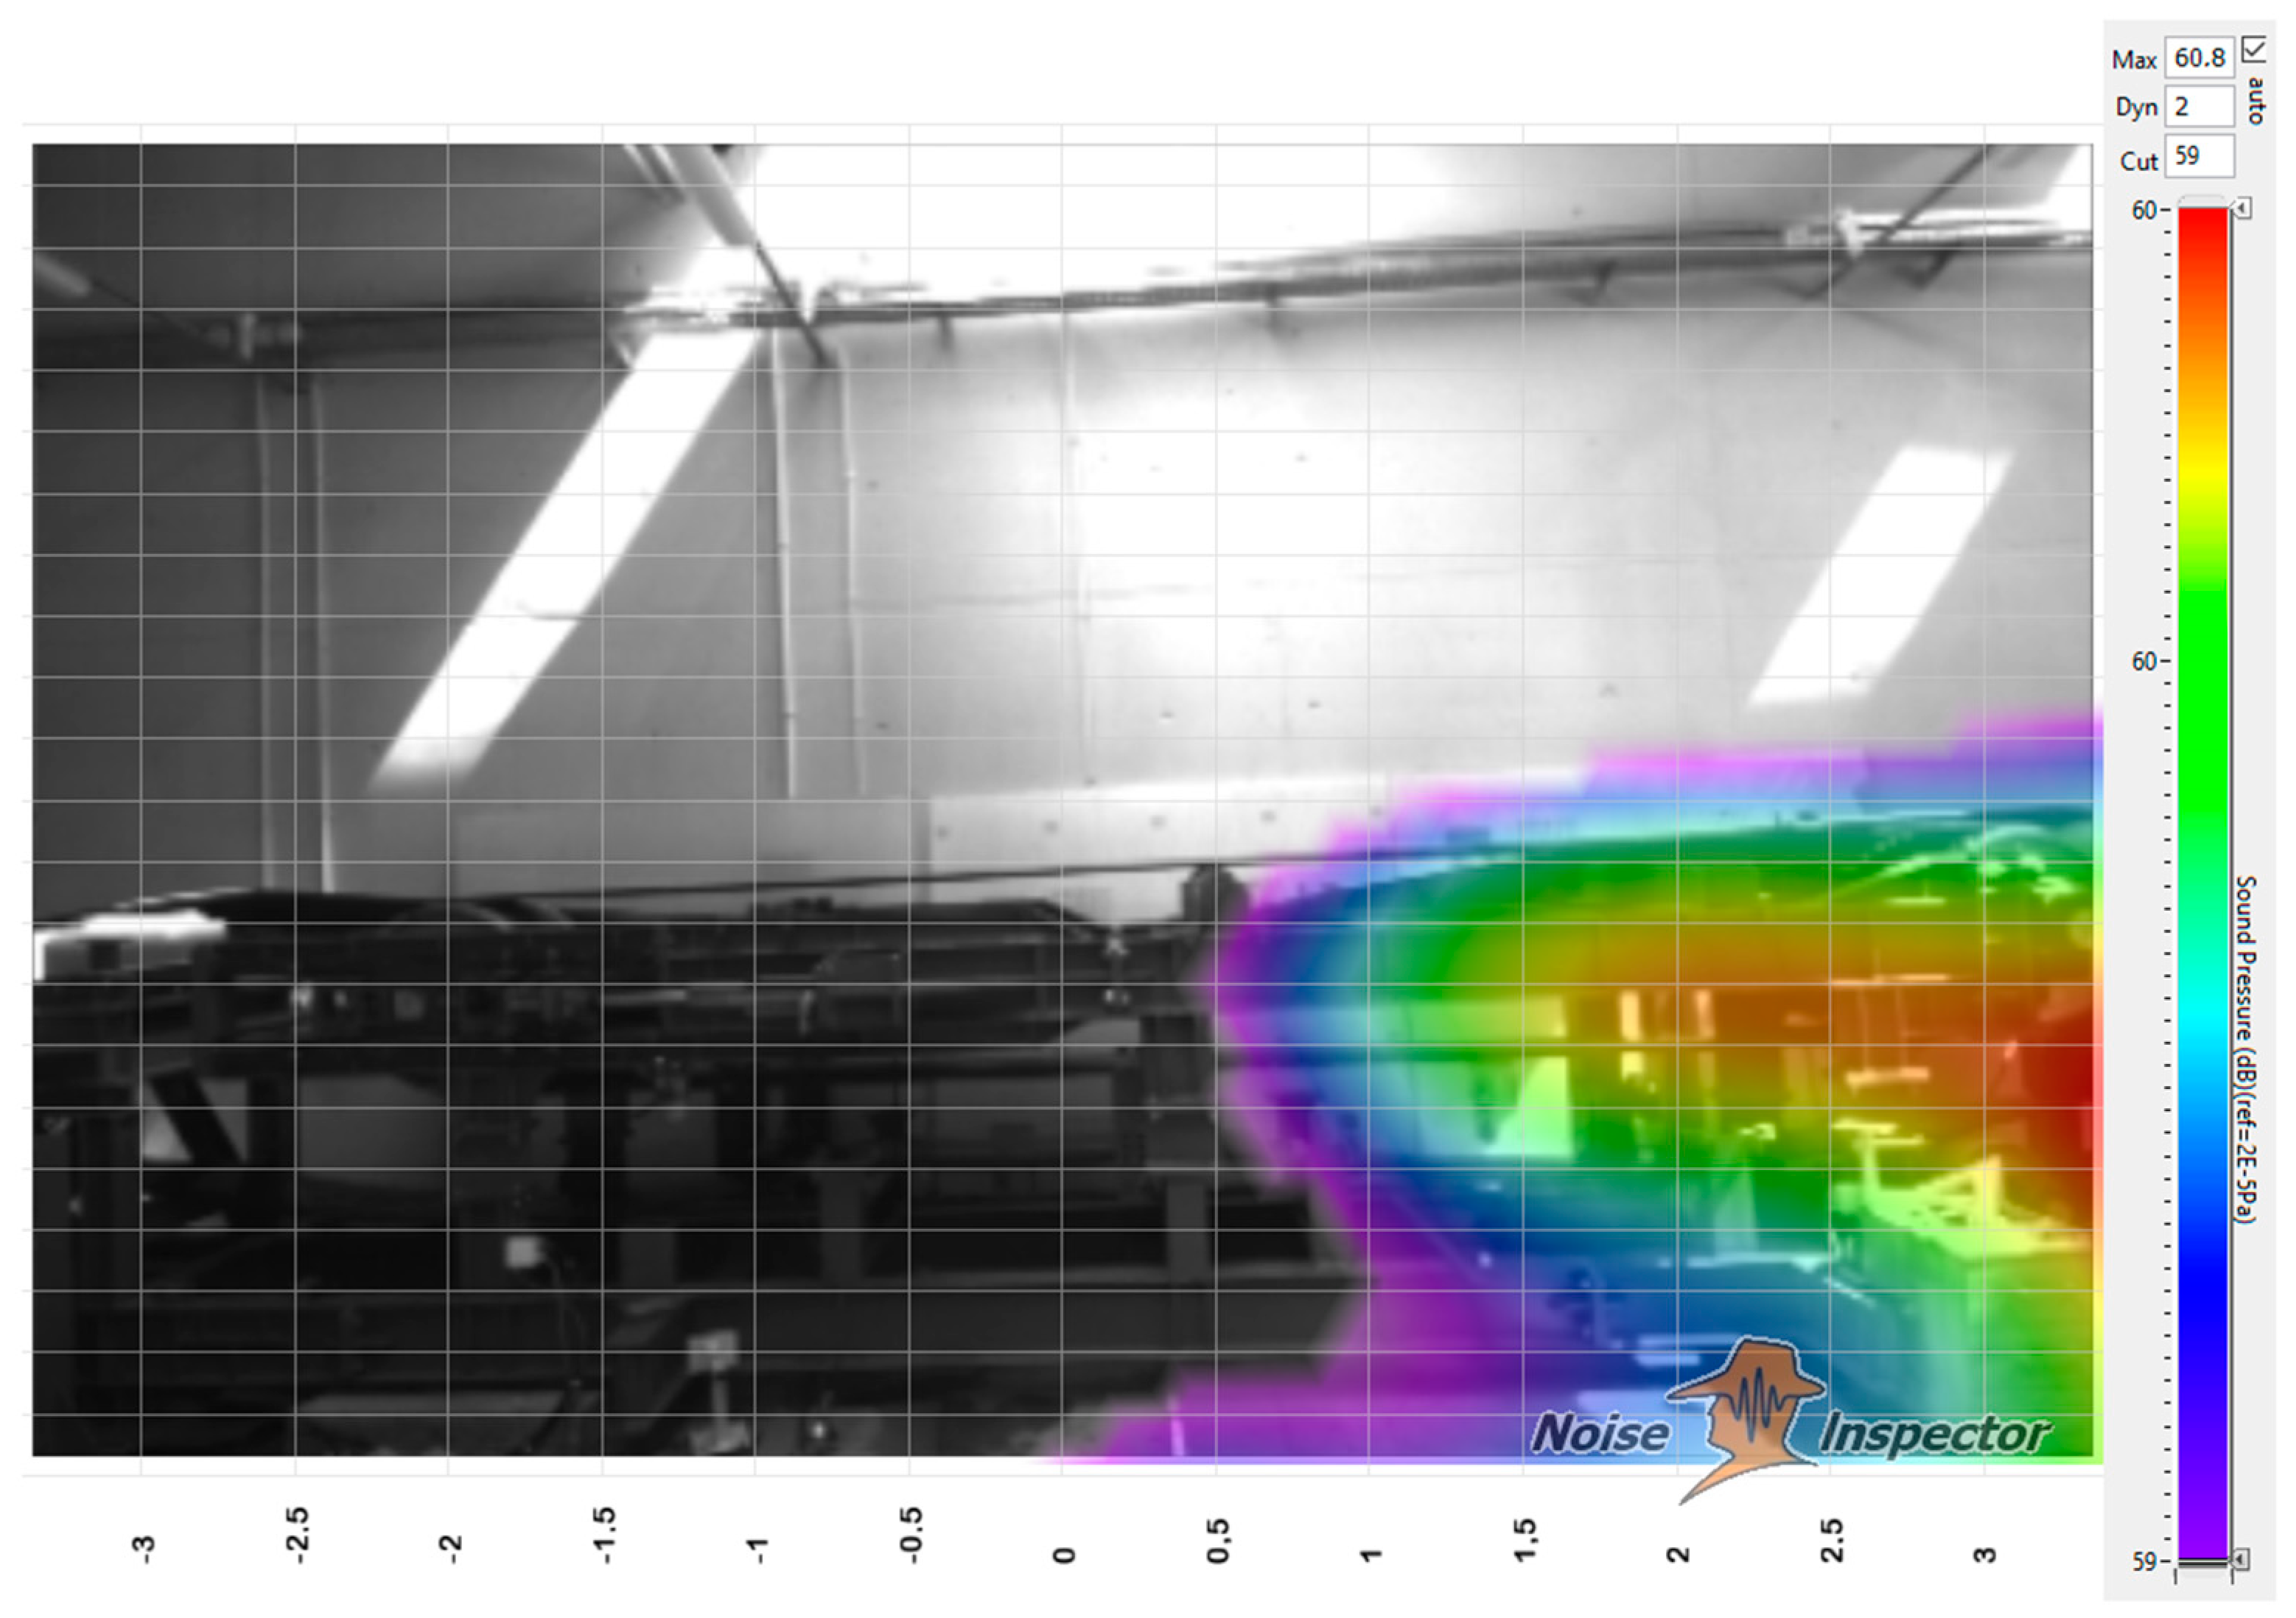
The measurement results clearly indicate that the belt conveyor drive system is the main noise source in the low frequency range, i.e. between 200 Hz and 1000 Hz. The low and medium frequency spectrogram is shown in Figure 7. Figure 8 shows the measurement rig during normal operation. The main source of noise for the 200–1000 Hz range is located in the vicinity of the drive system. The recorded noise has the maximum sound level (for the investigated period) of 60.8 dB.
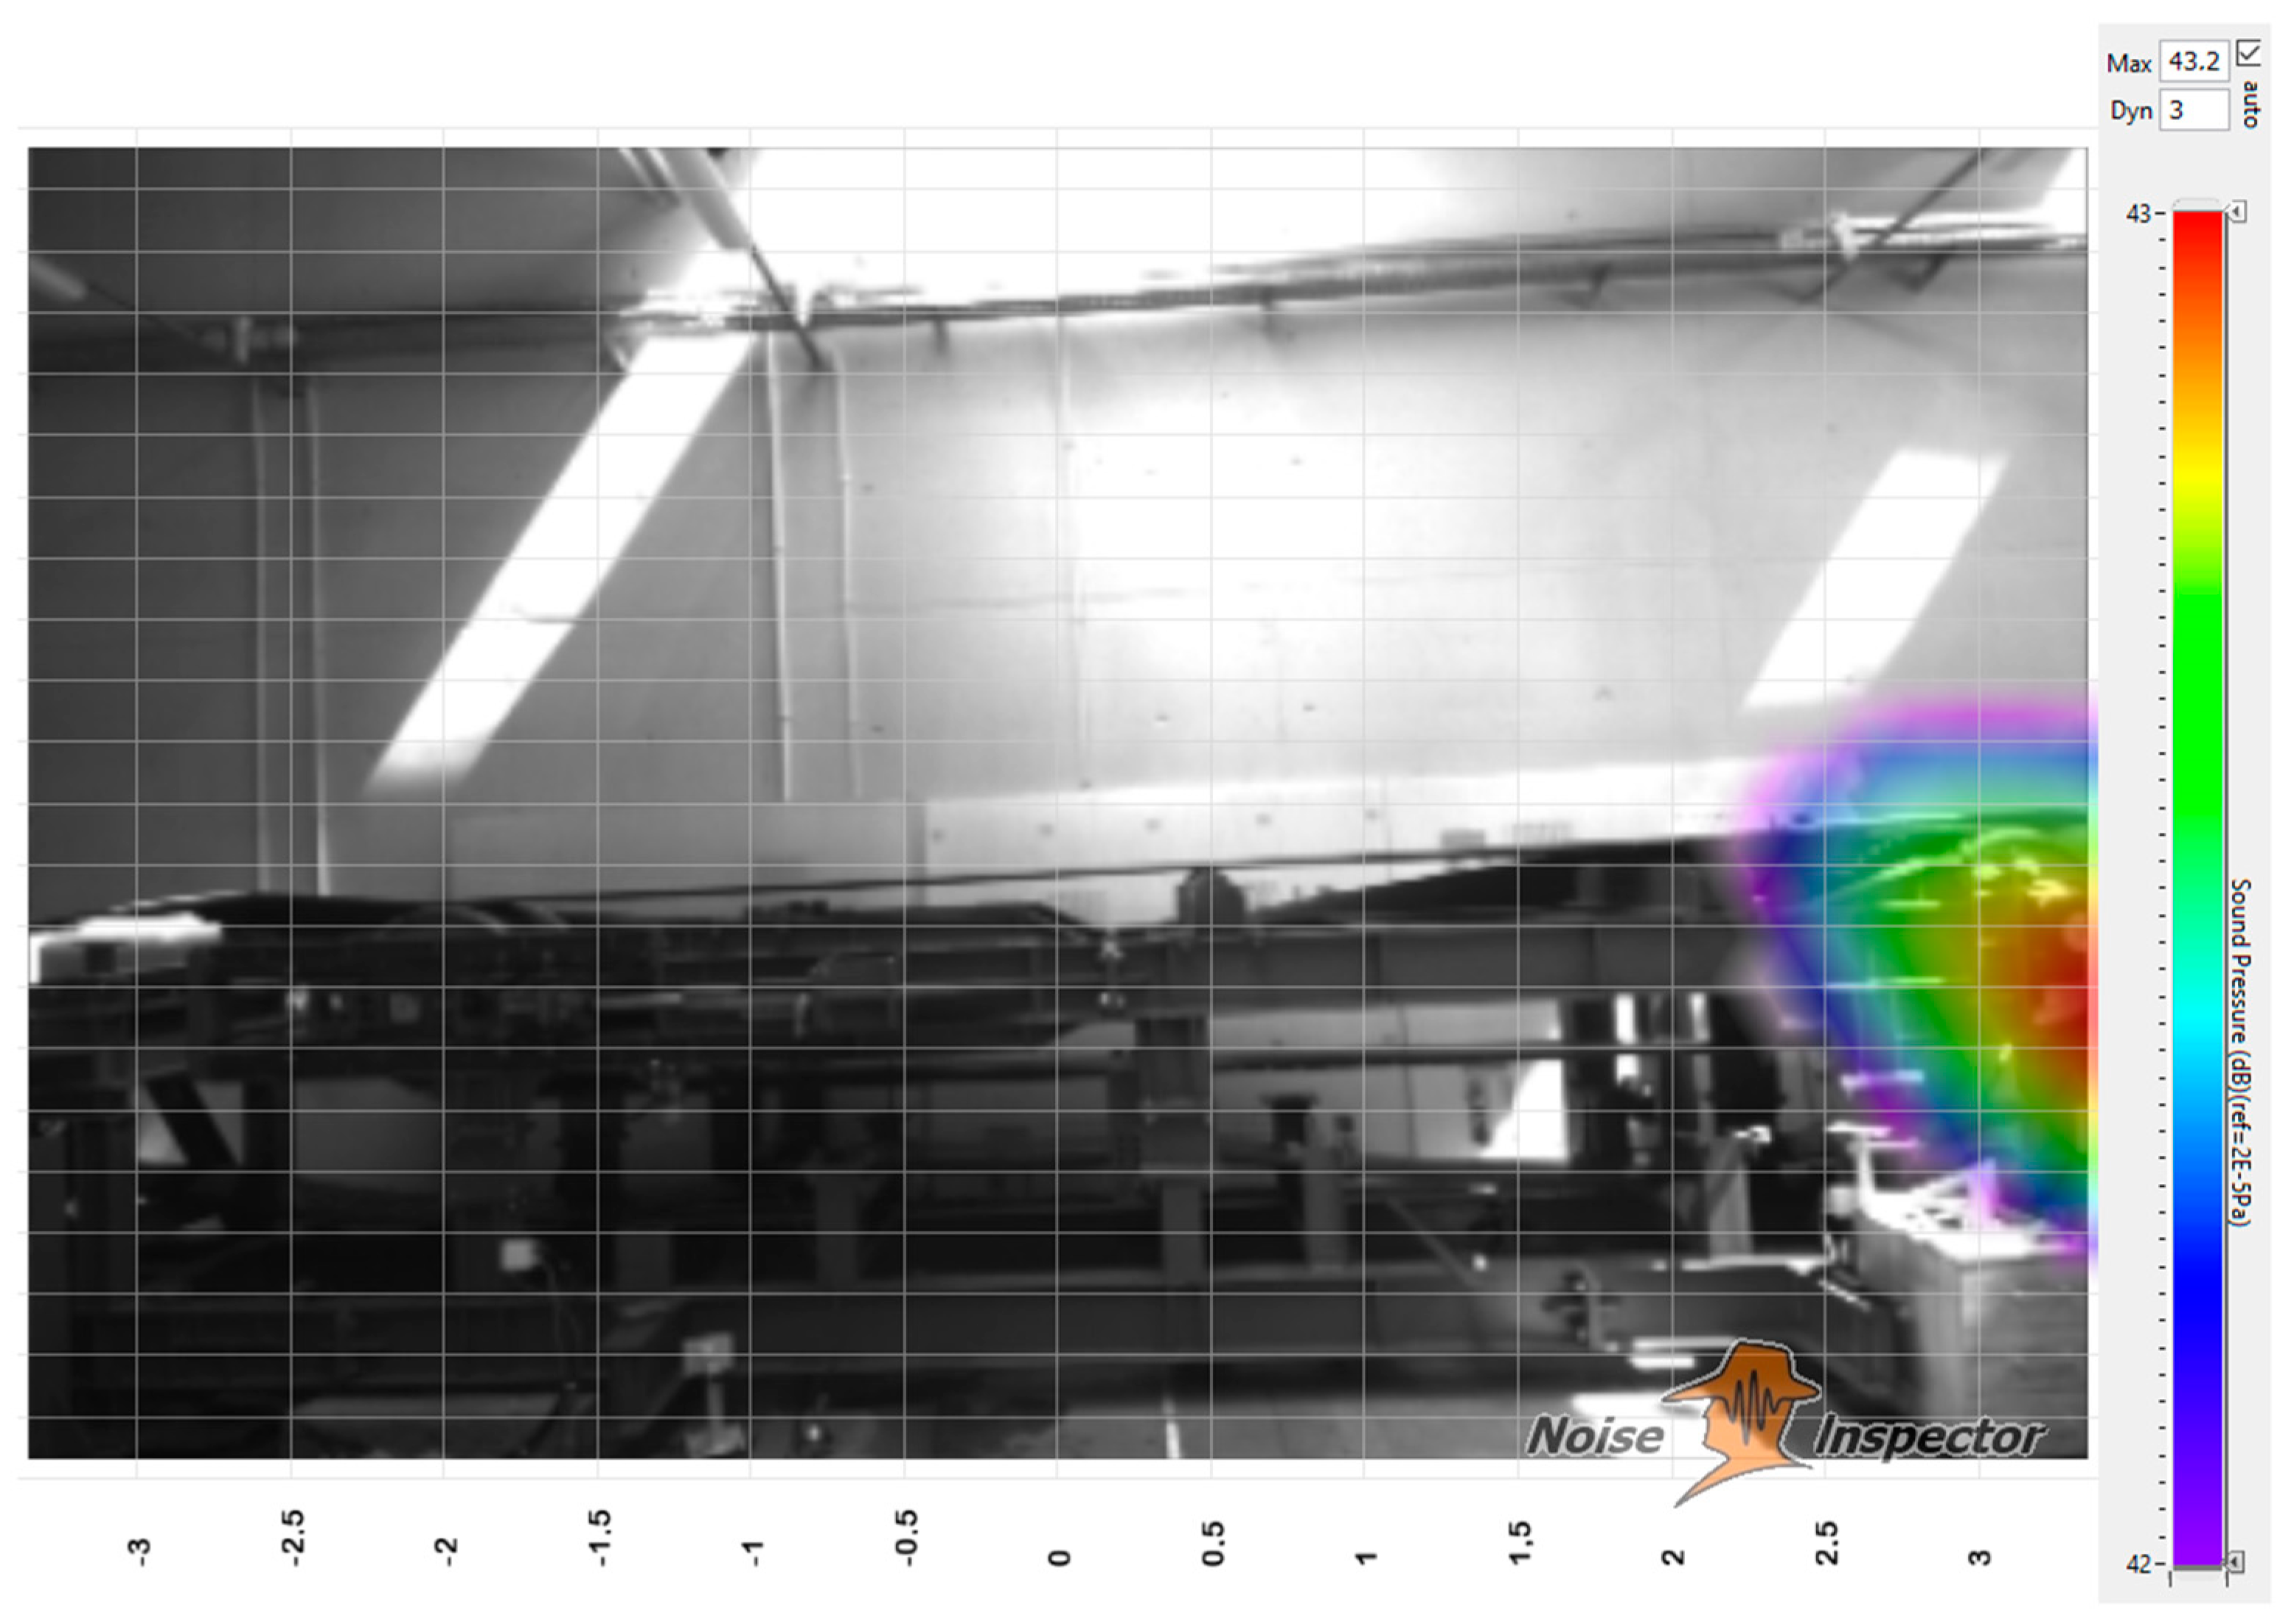
The noise generated by the electric motor is the result of its internal electromagnetic processes. The frequency is equal to double the power-line frequency, but also depends on the design parameters of the motor, such as for example the number of pole pairs. The research on this issue demonstrated that these are typically the higher harmonics of the base frequency (>600 Hz) [27,28,29]. The noise frequency of the electric motor in the measurement rig is within 852–853 Hz, with the maximum sound level for this frequency being 43.2 dB (Figure 9).
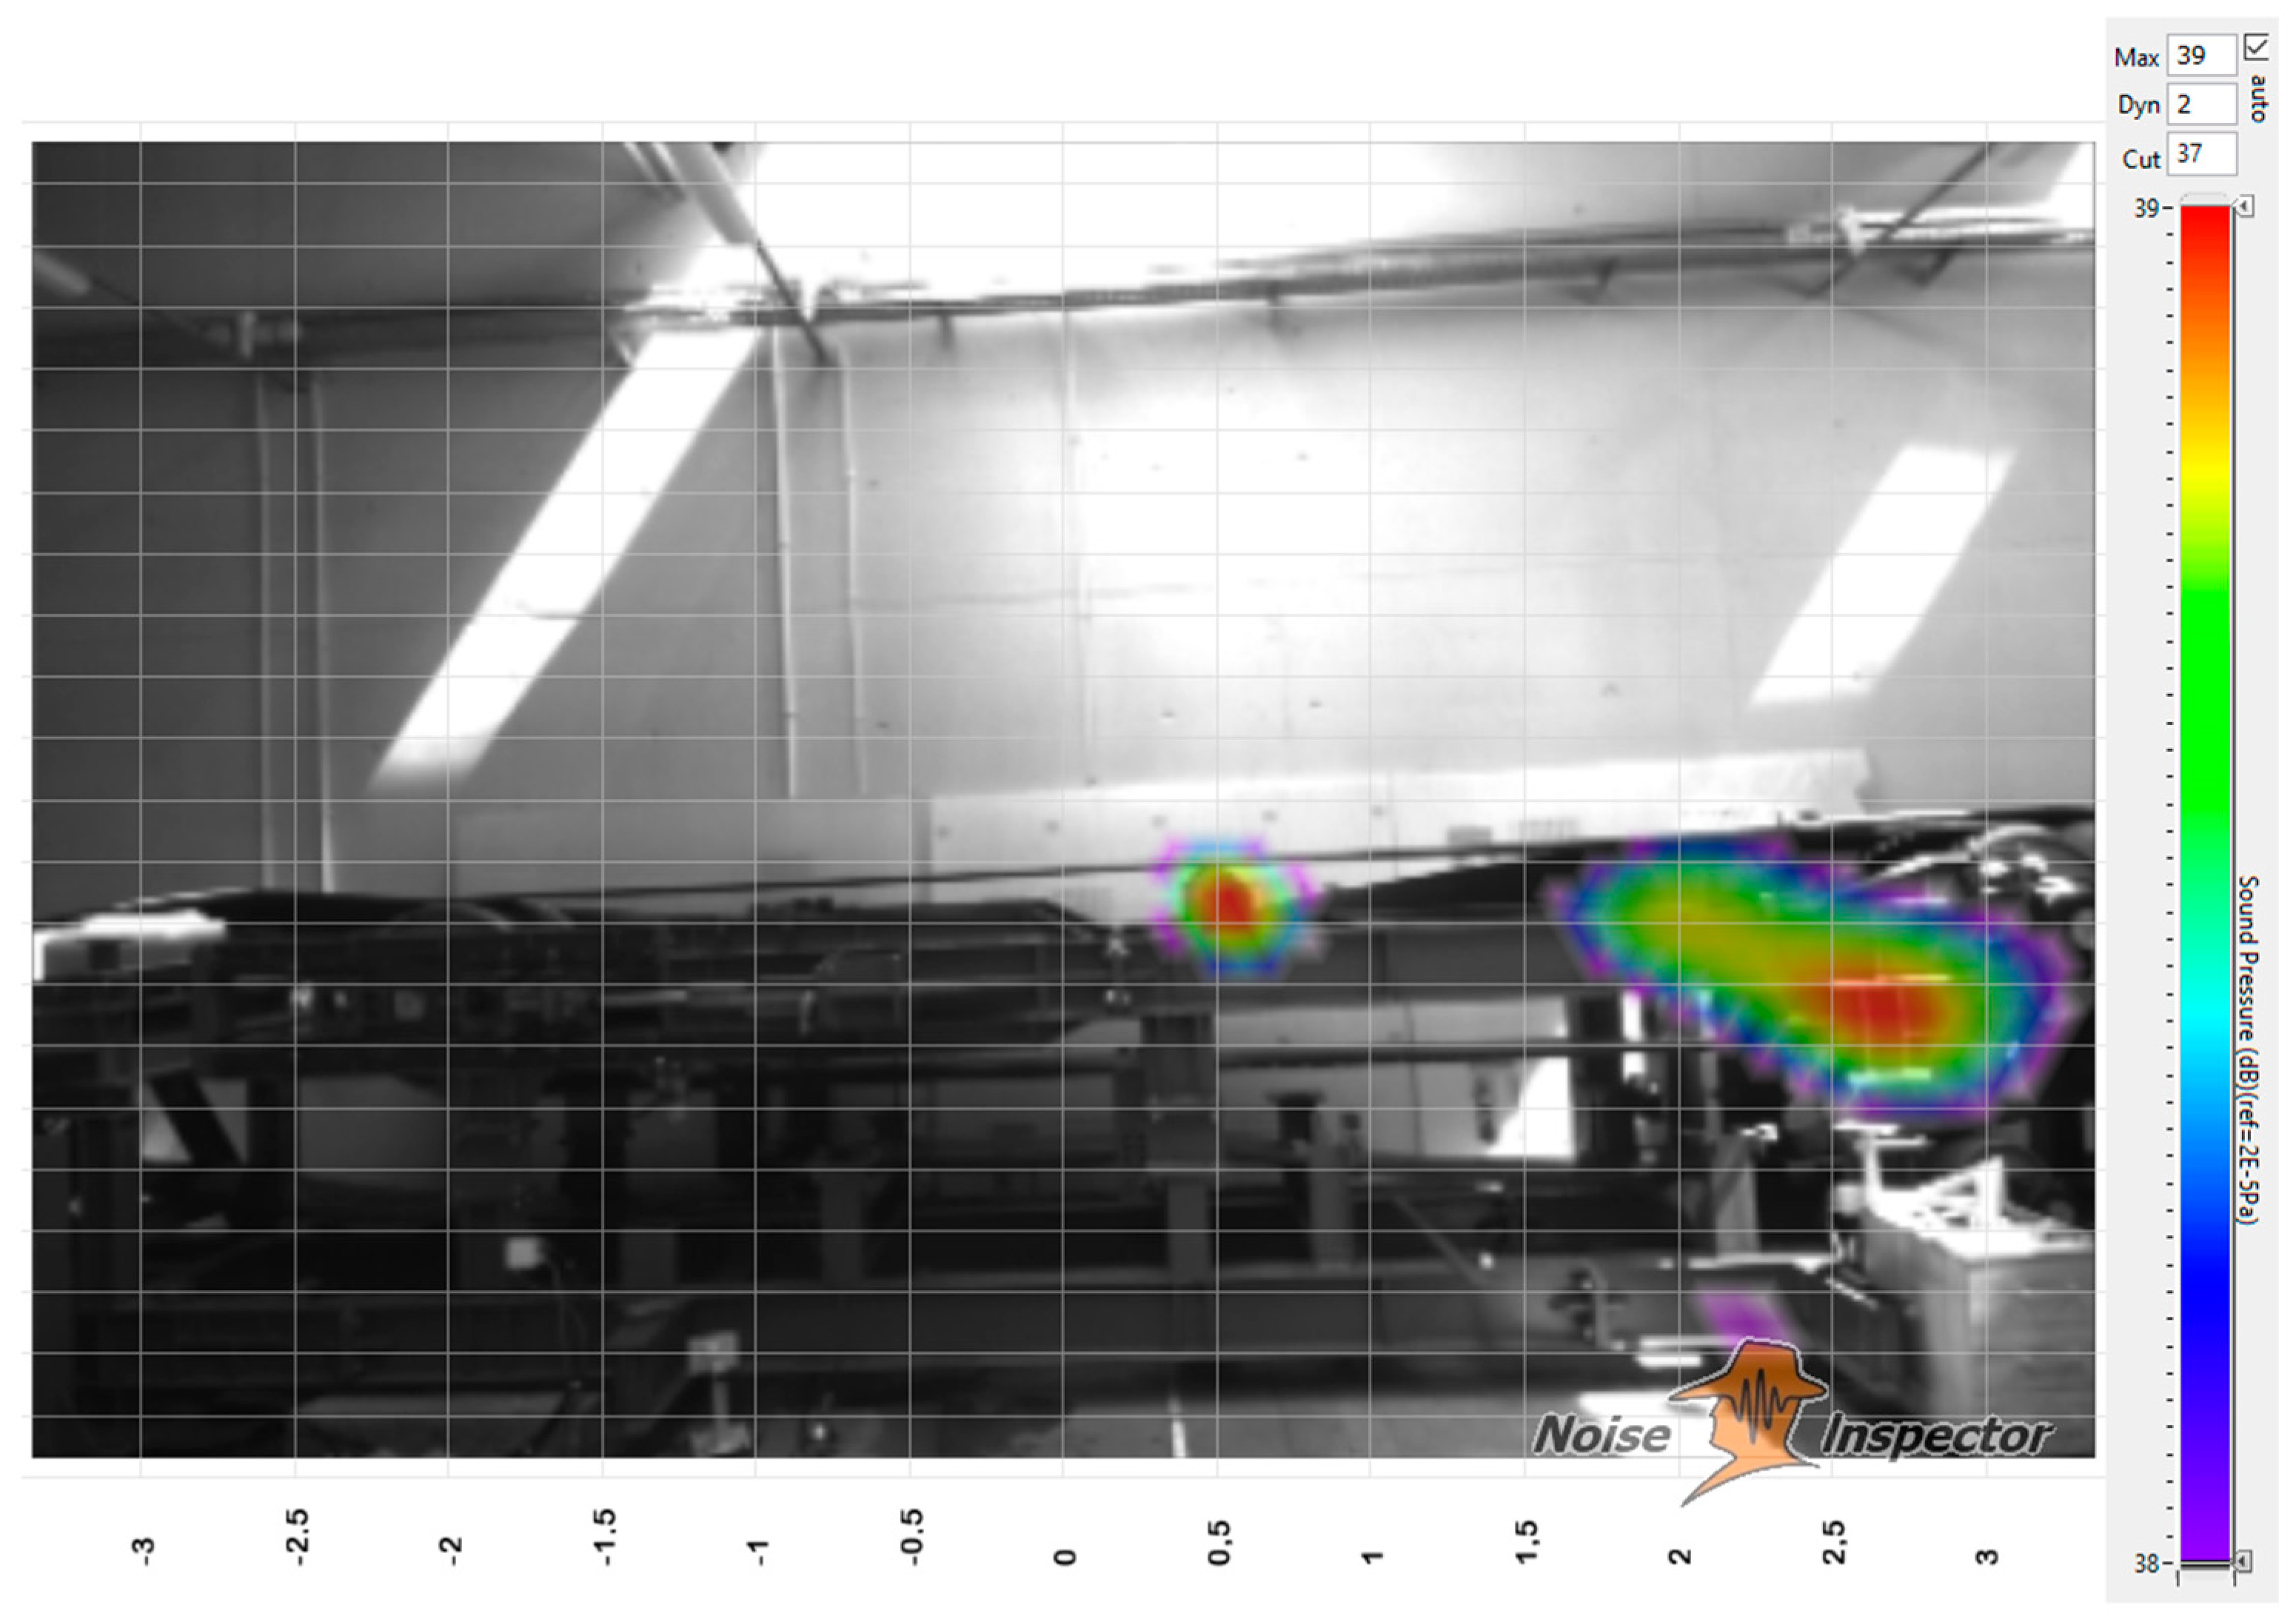
The main sources of noise for the conveyor within the medium frequency range (1000–2000 Hz) is the noise from the drive system and the noise due to the belt-idler interaction (Figure 10). Further noise harmonics from the electric motor (1004–1005 Hz, 1404–1405 Hz, and so on) can be identified in the analyzed frequency range, and mean sound level for the electric motor is 35.4 dB.
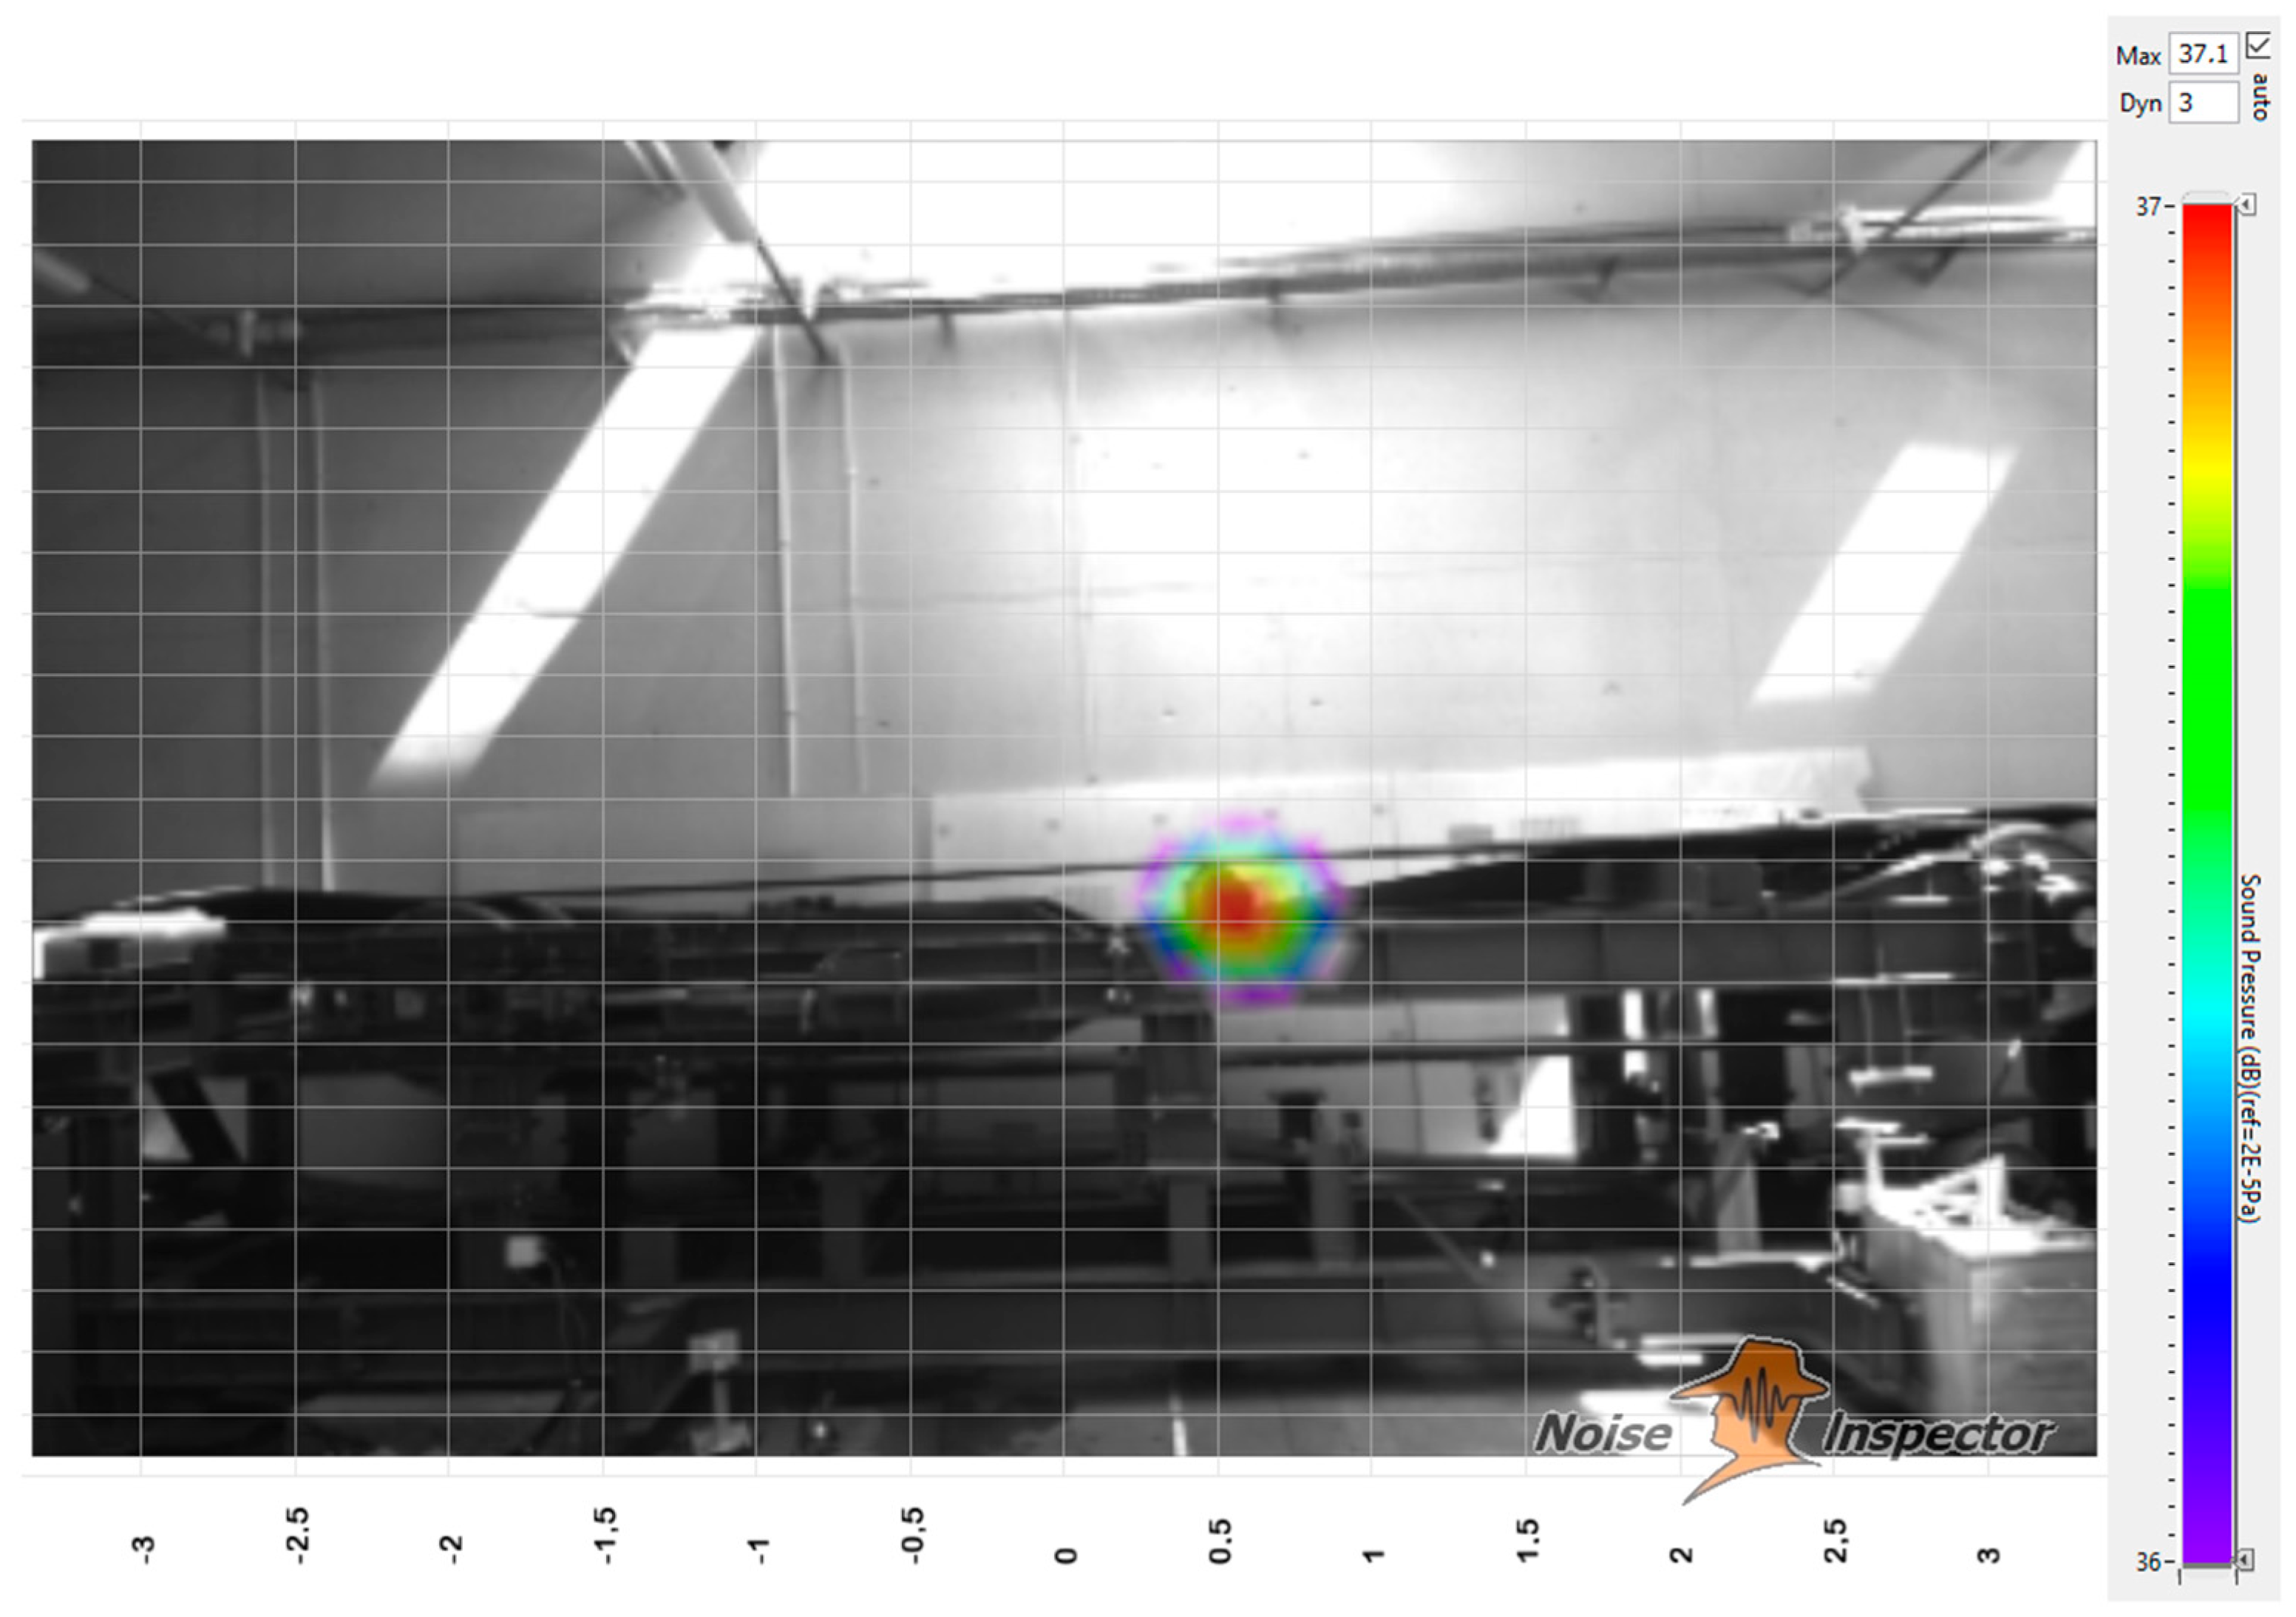
The rotating idler loaded with the belt generates noise, which is the effect of the interaction between the bottom cover of the belt and the idler coat. The noise may increase as the bearings in the idler become increasingly worn [20]. In the case of the belt-idler interaction, the idler coat is the main source of noise [13]. Noise from the idler bearings is typically located within the range of 1000 Hz to 3000 Hz (the frequency of up to 1000 Hz is from the vibration in the bearings). The noise due to the belt-idler interaction (the result of the rotating idlers), such as transverse belt vibration or vibration on the structure of the conveyor route, is within the low frequency range, up to 100 Hz [20]. An acoustic camera does not allow measurements in a low part of the low-frequency range (less than 20Hz). The noise source in the area of the idler (the idler bearing) generates the maximum sound level of 37.1 dB within the frequency range of 1580–1581 Hz (Figure 11).
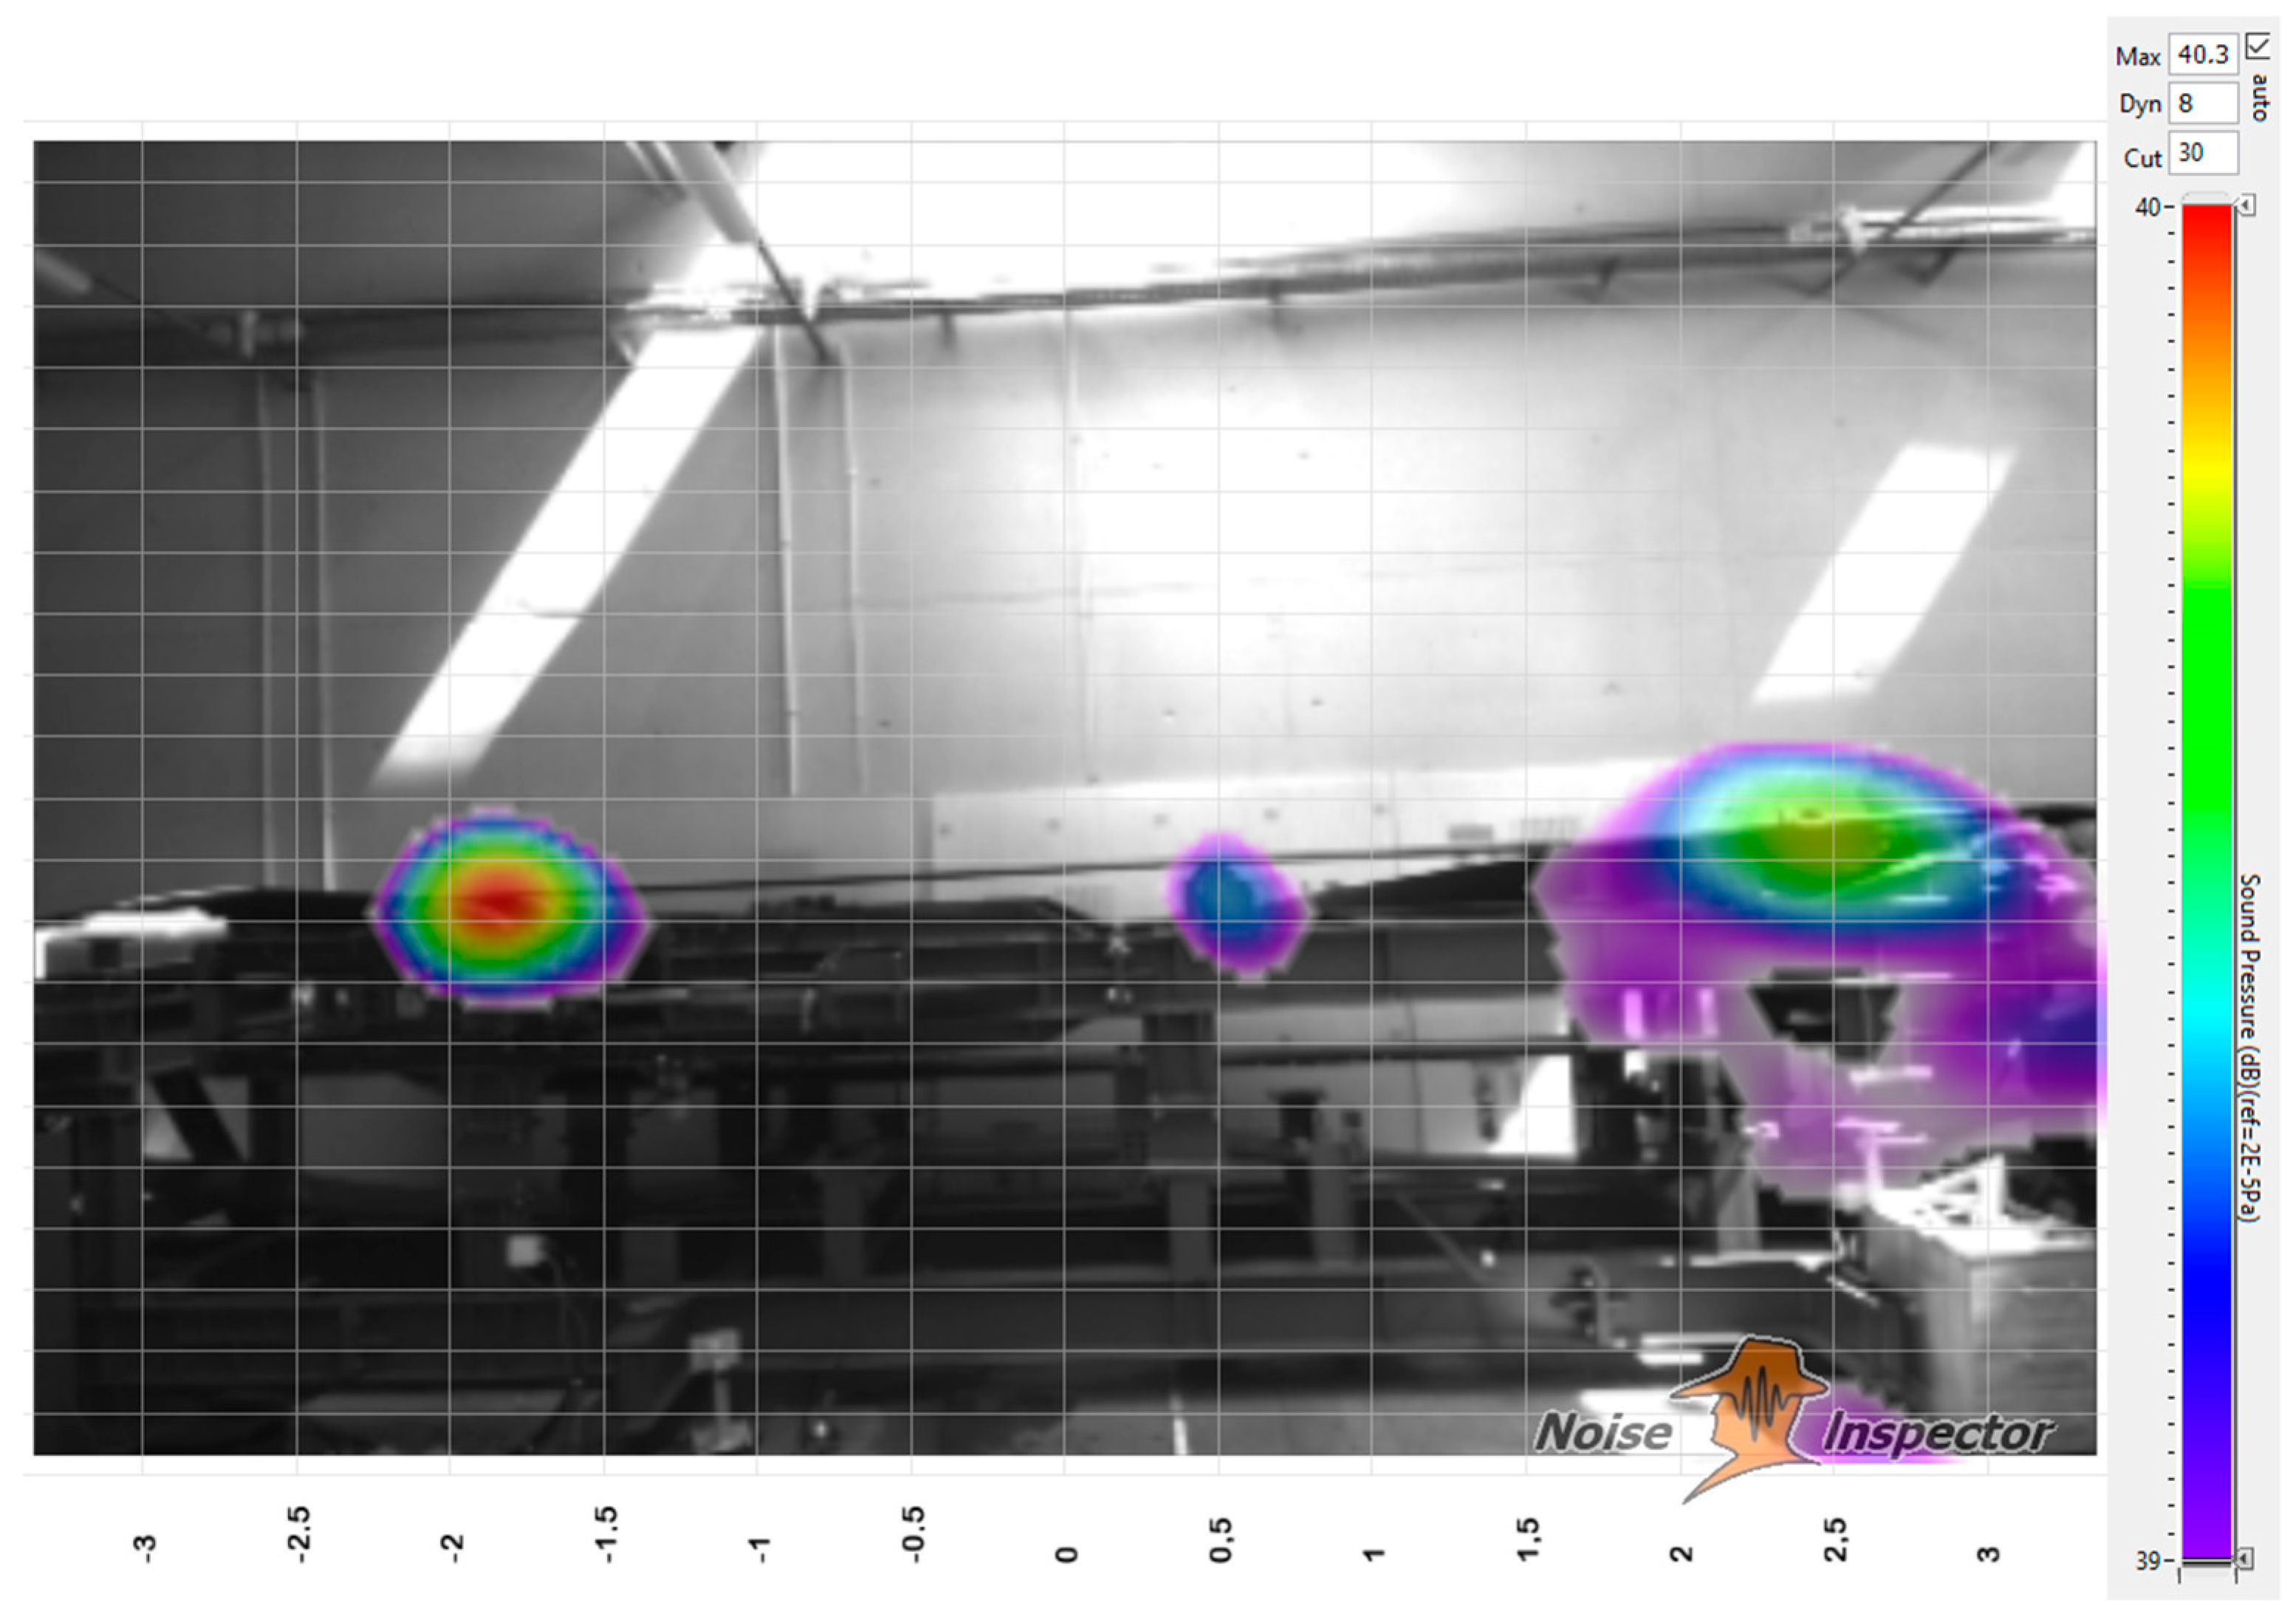
Within the frequency range between 2000 Hz and 3000 Hz, the main sources of noise in the conveyor are related to the operation of the drive motor and to the belt-idler interaction, with the resulting noise generated in the bearings (Figure 12).
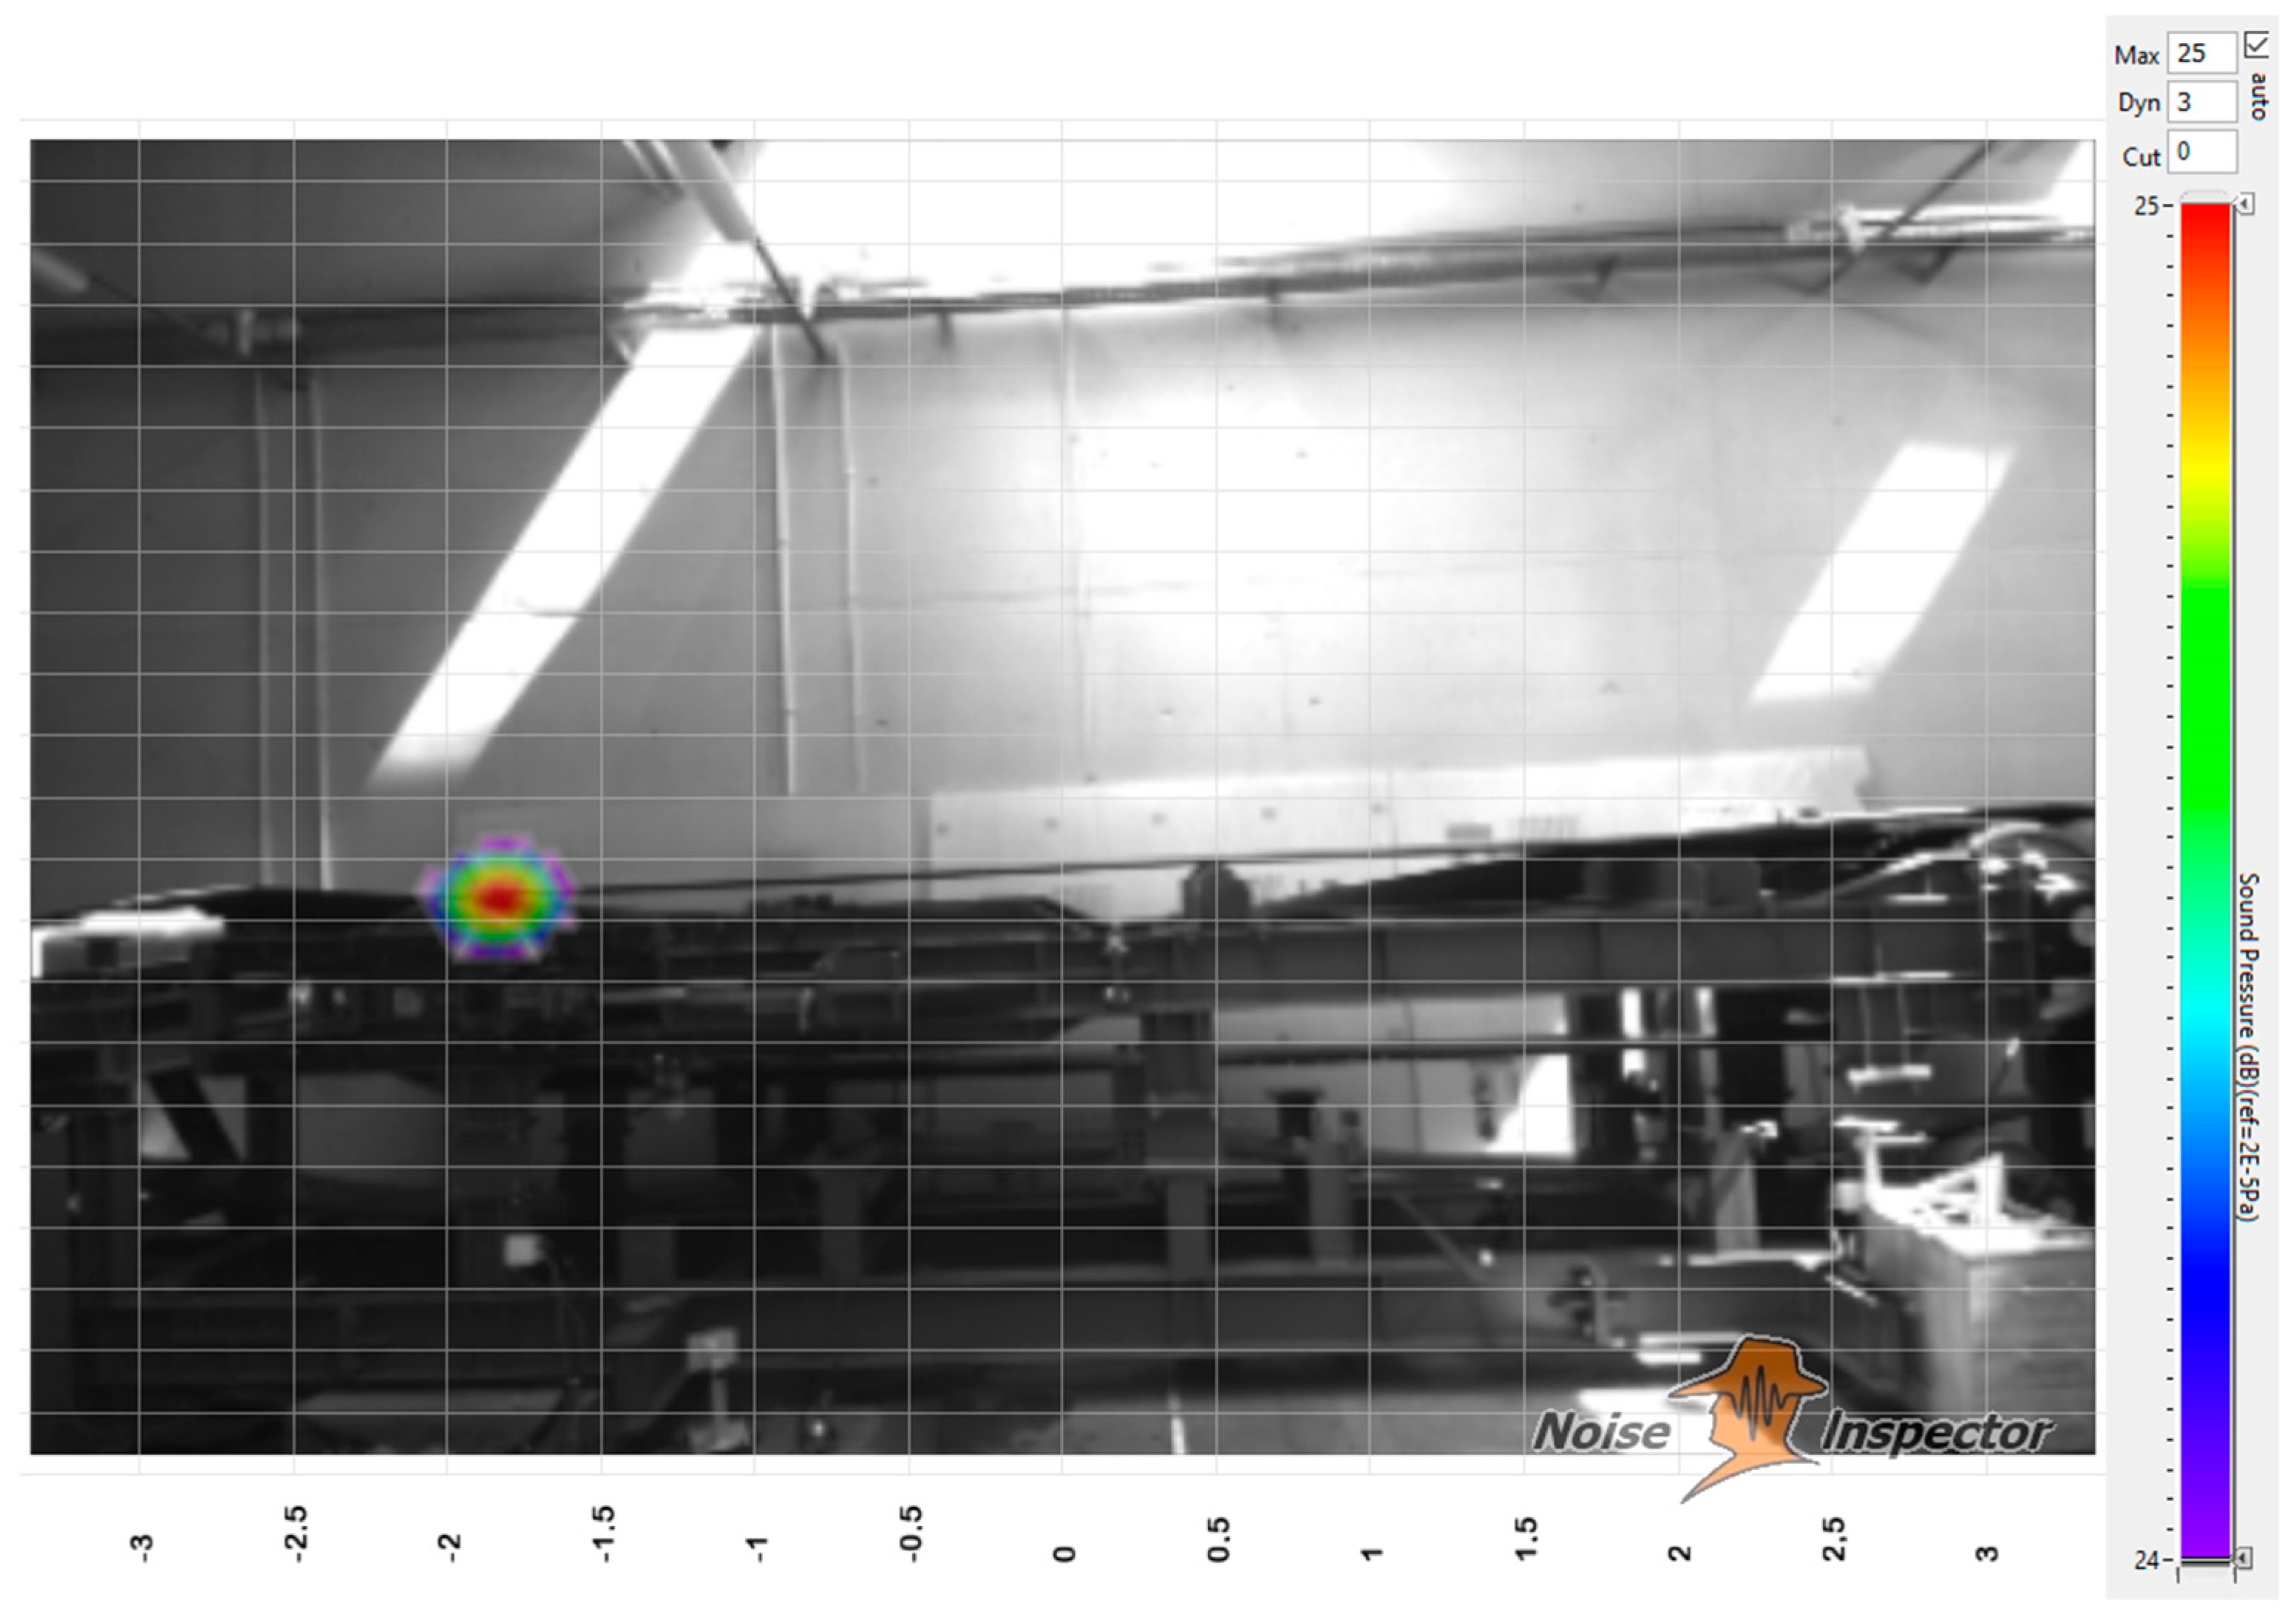
In the high frequency range, the noise source was observed to be related to the cyclical passing of the belt around the return pulley (Figure 13). Unlike the drive pulley, the tail pulley in the measurement rig does not have a rubber lining, and this fact causes notable lateral belt wandering. This wandering may result from misaligned axles of the two pulleys and from a non-uniform stress distribution across the width of the belt due to imprecise belt splicing. During the lateral belt wandering, a characteristic high-frequency noise is emitted. The noise emission also depends on the types of surfaces in contact and on the scale of the phenomenon (the extent of lateral wandering). The noise due to the lateral belt wandering is at the maximum sound level of 25 dB within the frequency range of 2508–2509 Hz (Figure 13).
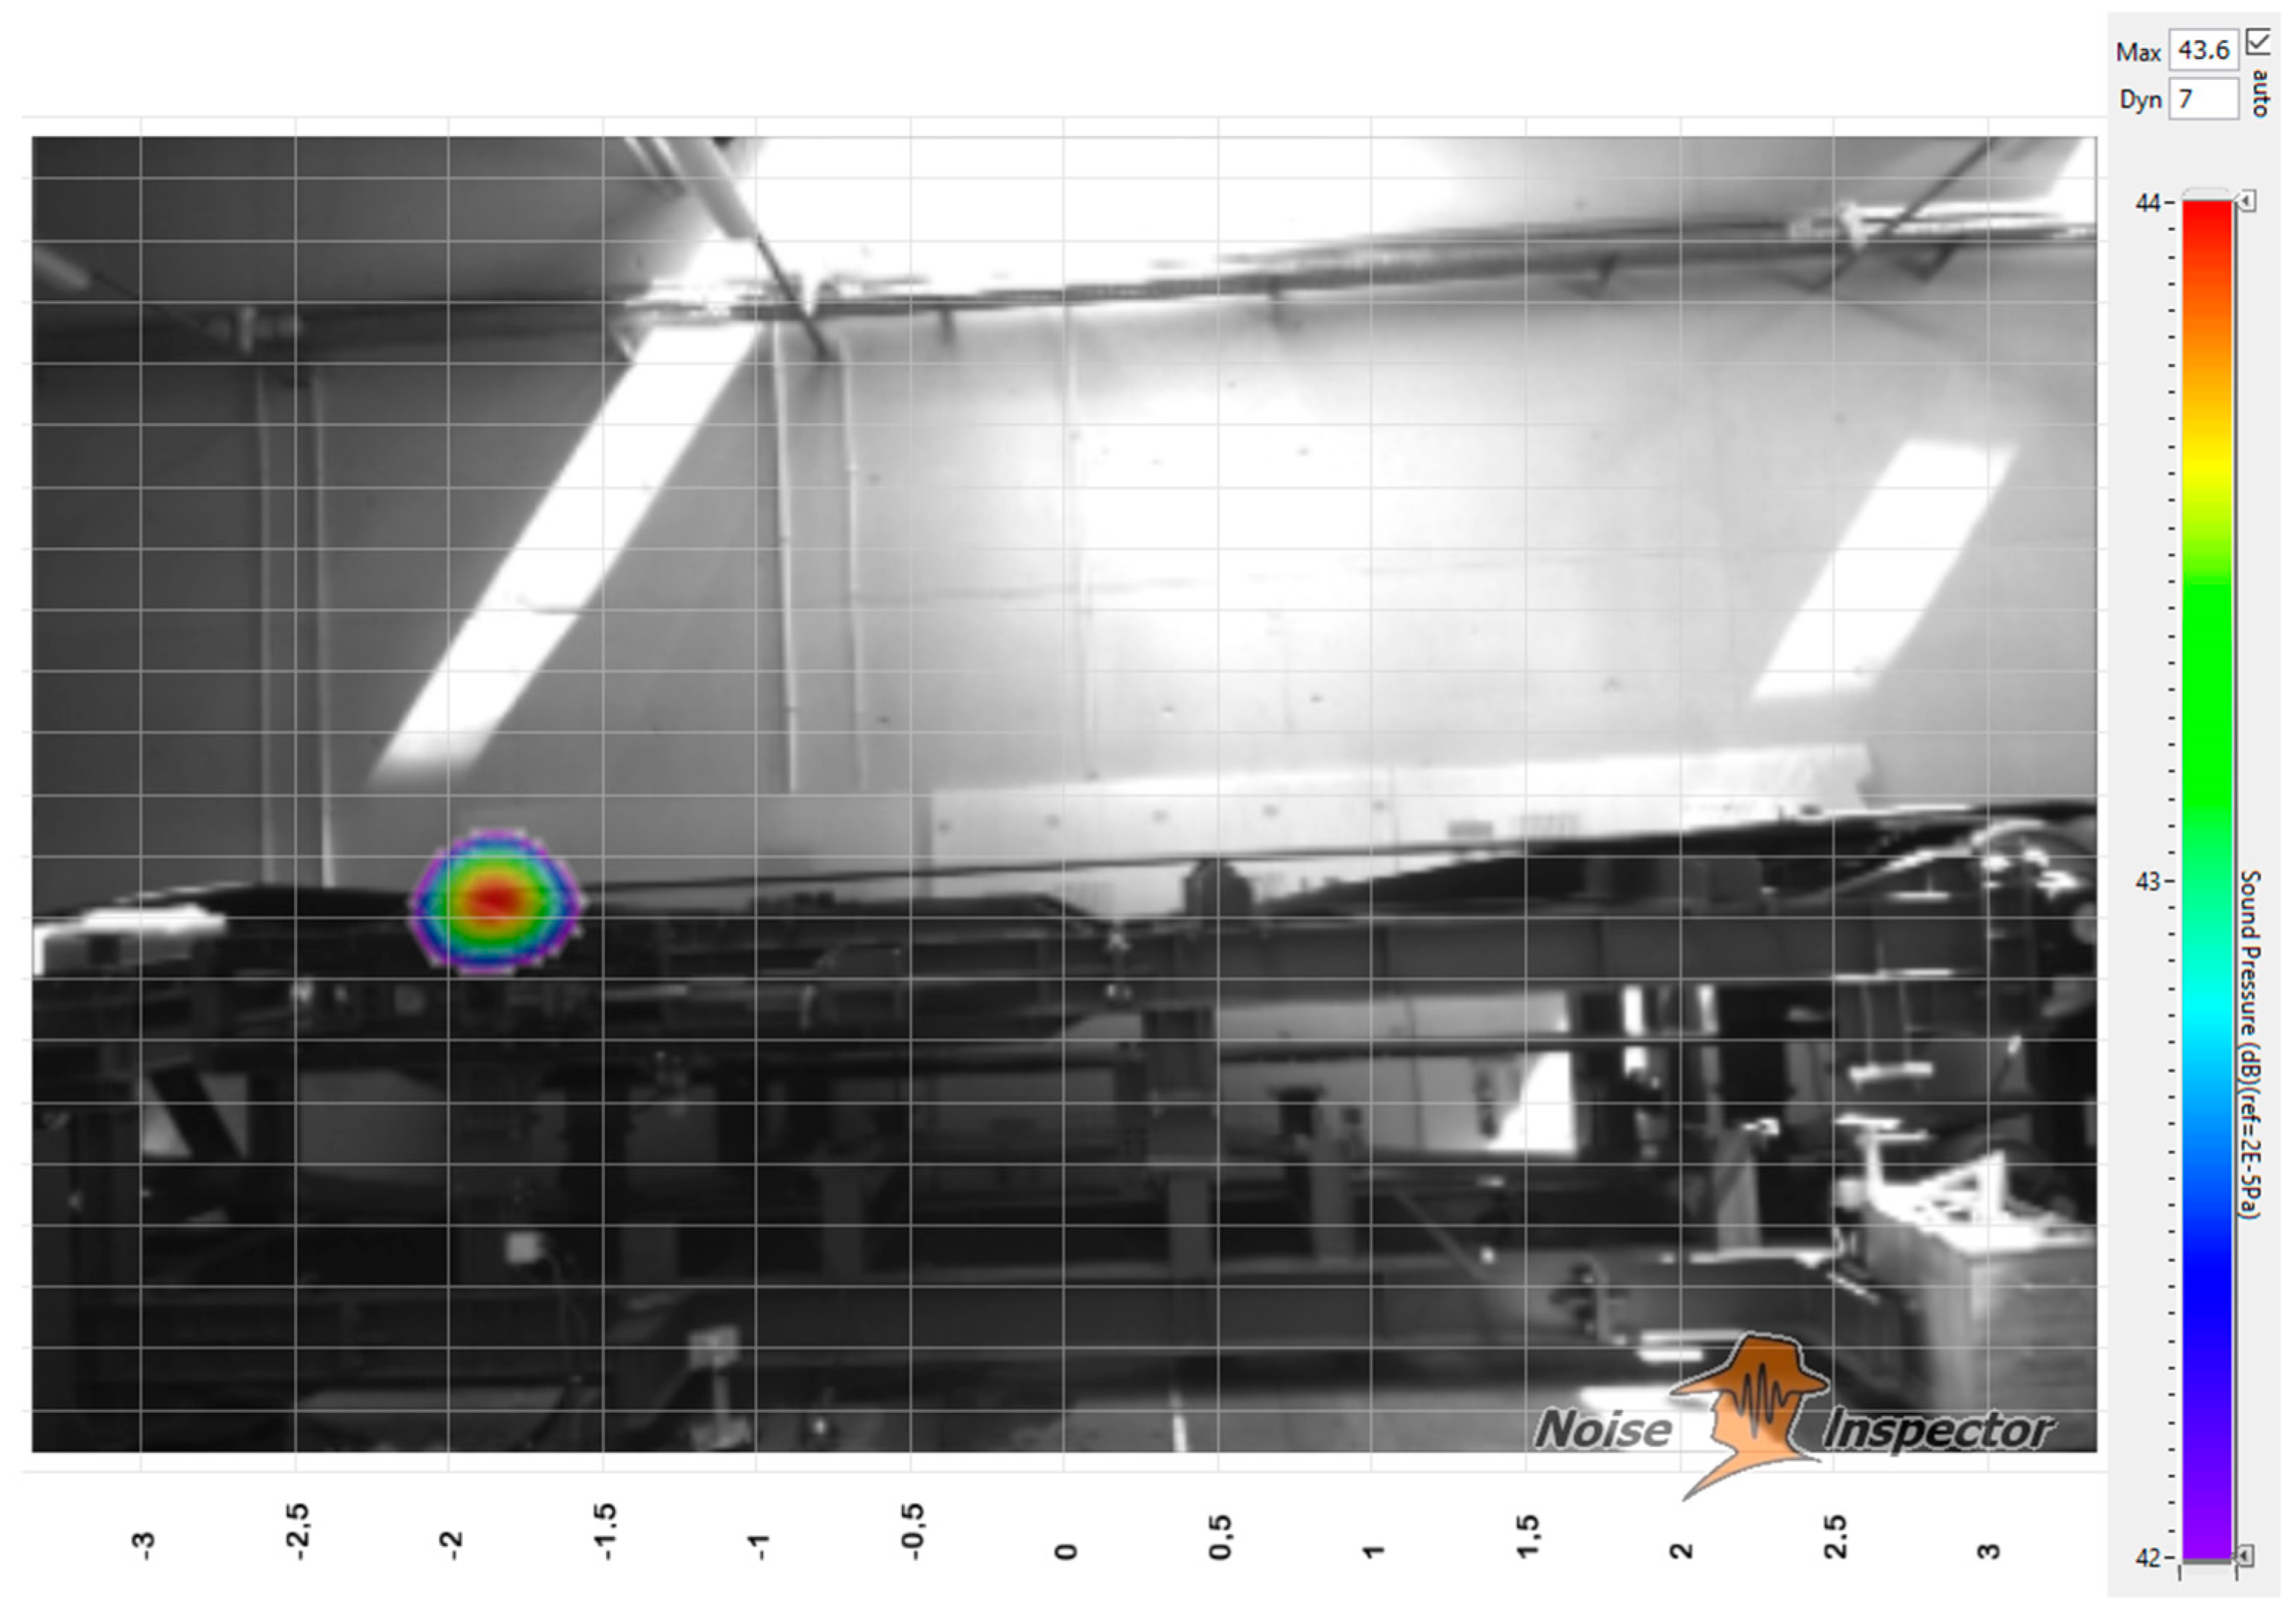
Lateral belt wandering on the return pulley also emits noise within the high frequency range from 3000 Hz to 8000 Hz, with a number of harmonic frequencies to be identified in its noise spectrum (Figure 14). The noise level due to the lateral belt wandering across the entire analyzed range was 43.6 dB.
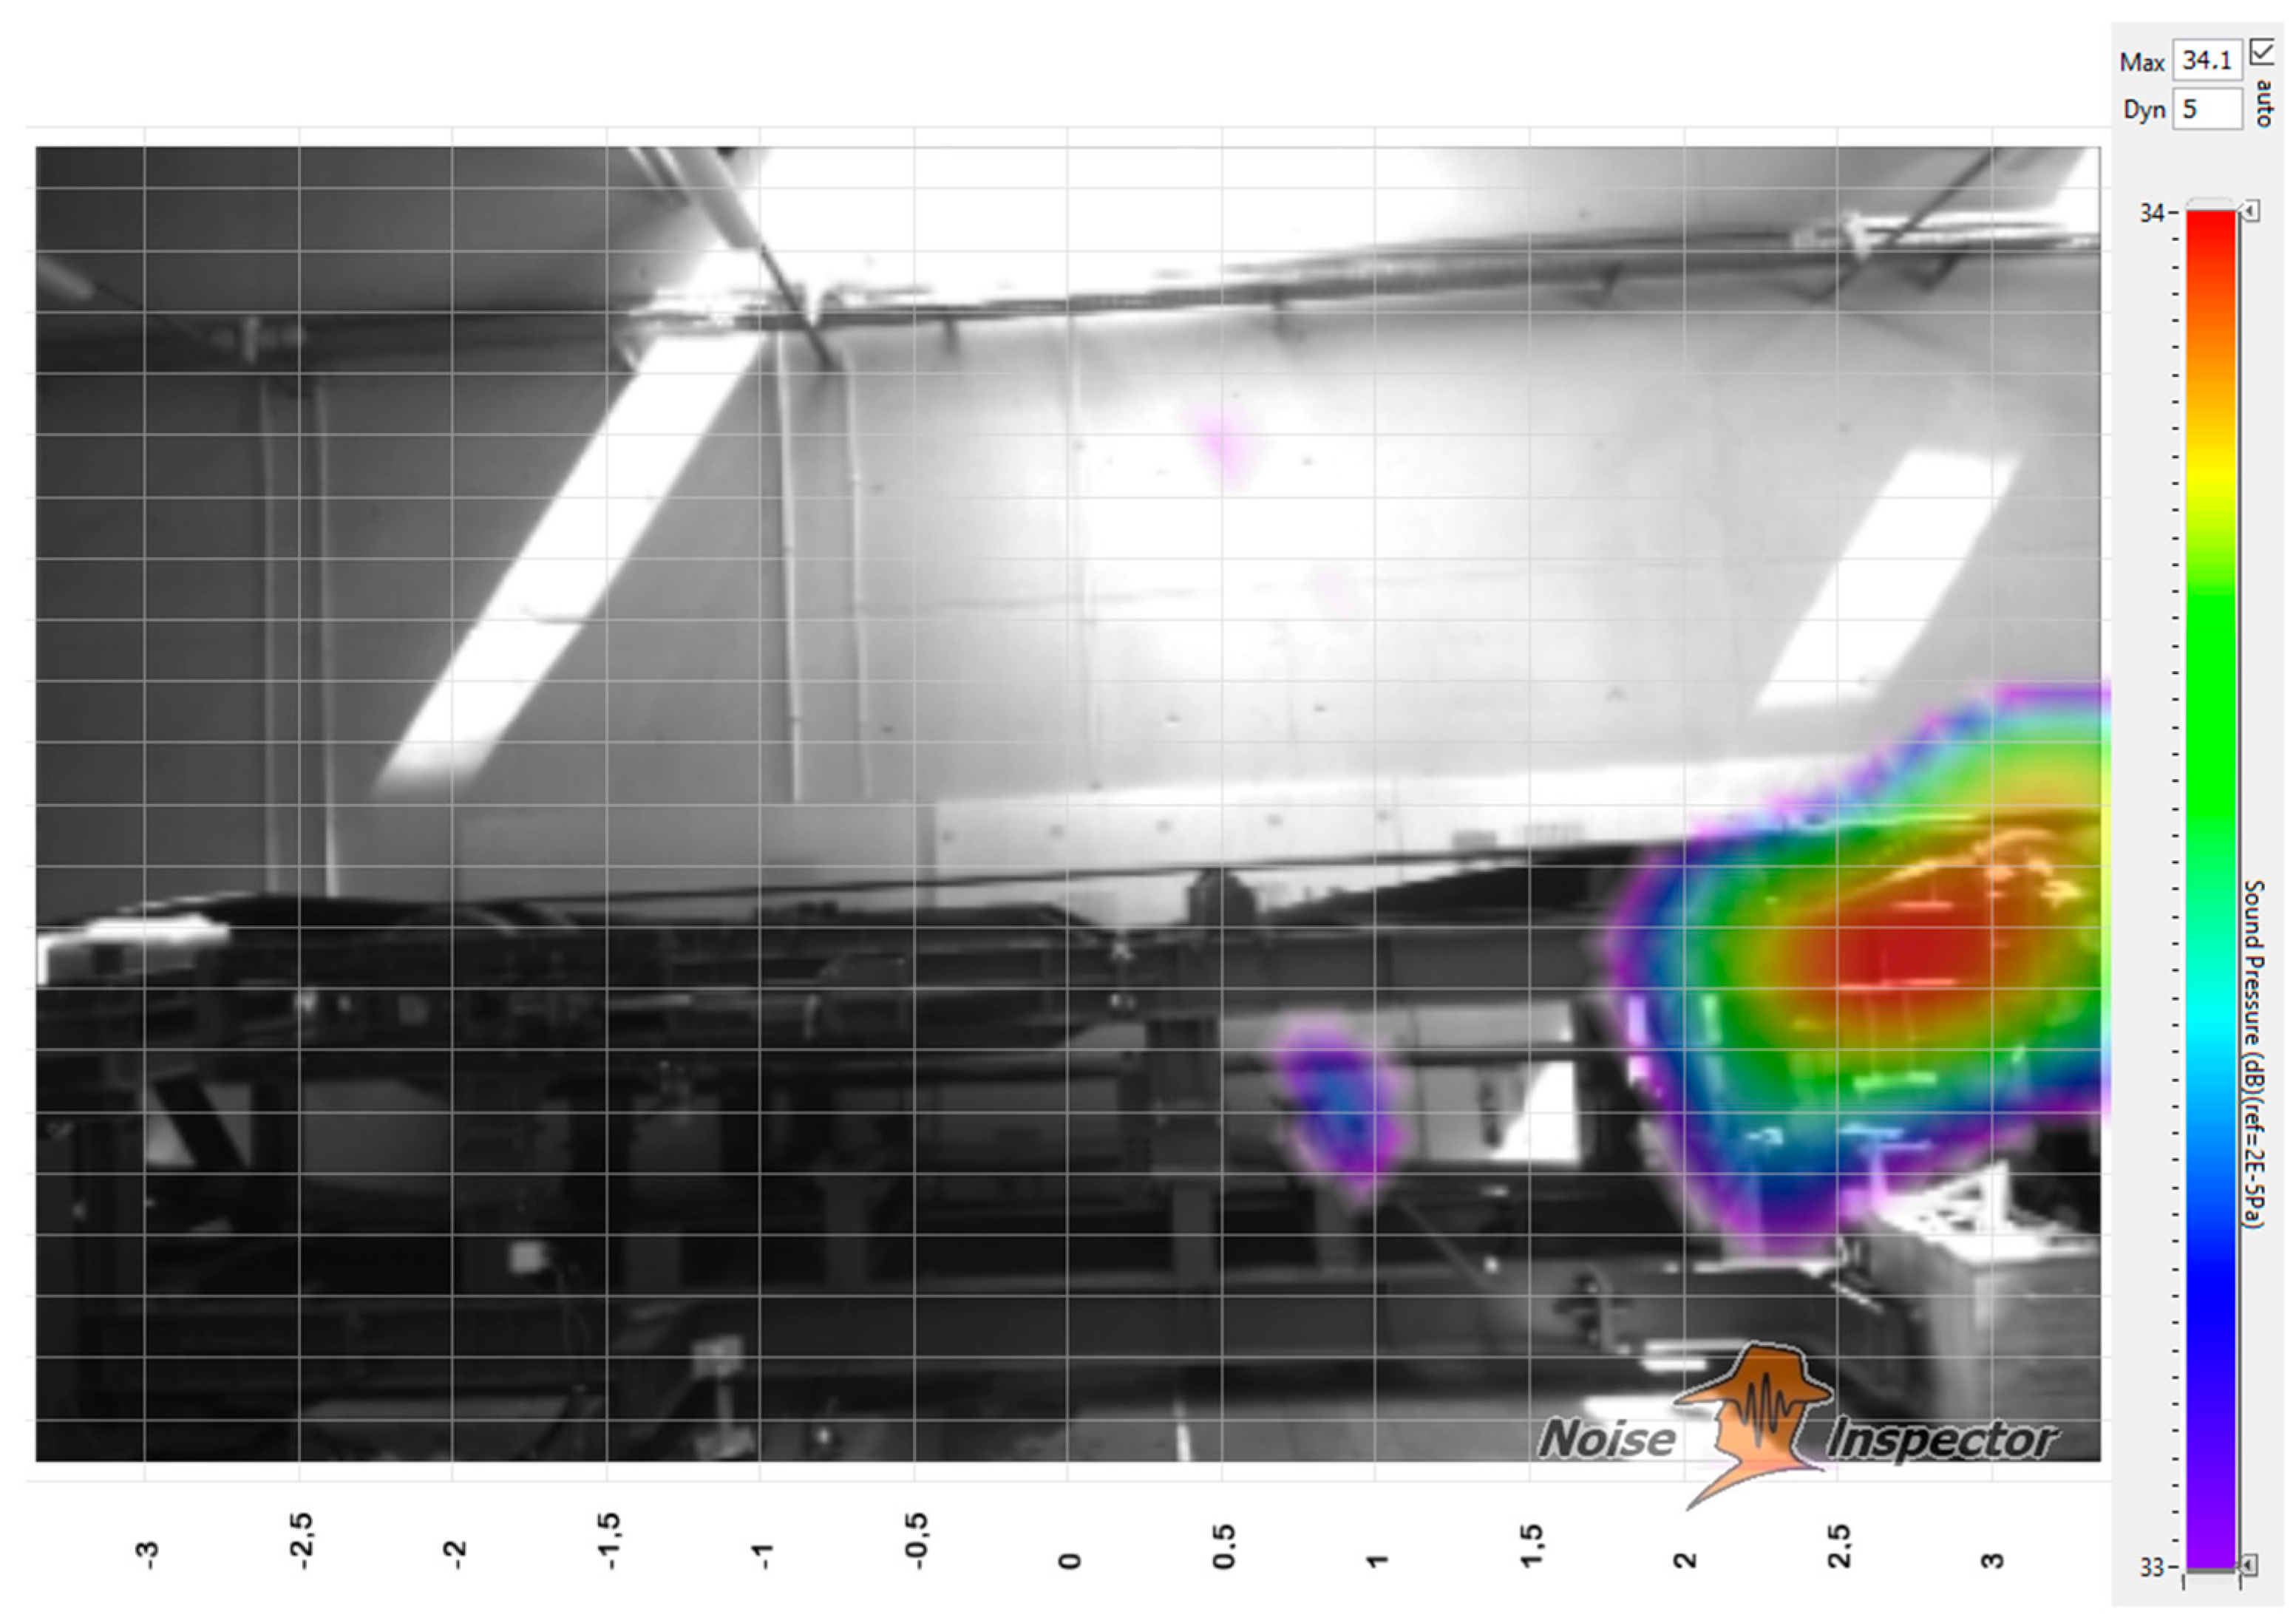
Dominant frequencies in the 8000–9000 Hz range can be clearly identified in the noise spectrum. The data from the acoustic camera indicate that these are higher harmonic frequencies of the motor. Figure 15 shows the noise in the conveyor at the level of 34.1 dB, which corresponds to the frequency range of 8000–9000 Hz.
5. Discussion
The analysis of the results allowed a systematic presentation of the information on the noise generated at the measurement rig. The entire frequency range was divided into frequencies in which the individual noise-emitting elements were located. The ranges and the identified noise sources are presented in Table 1.
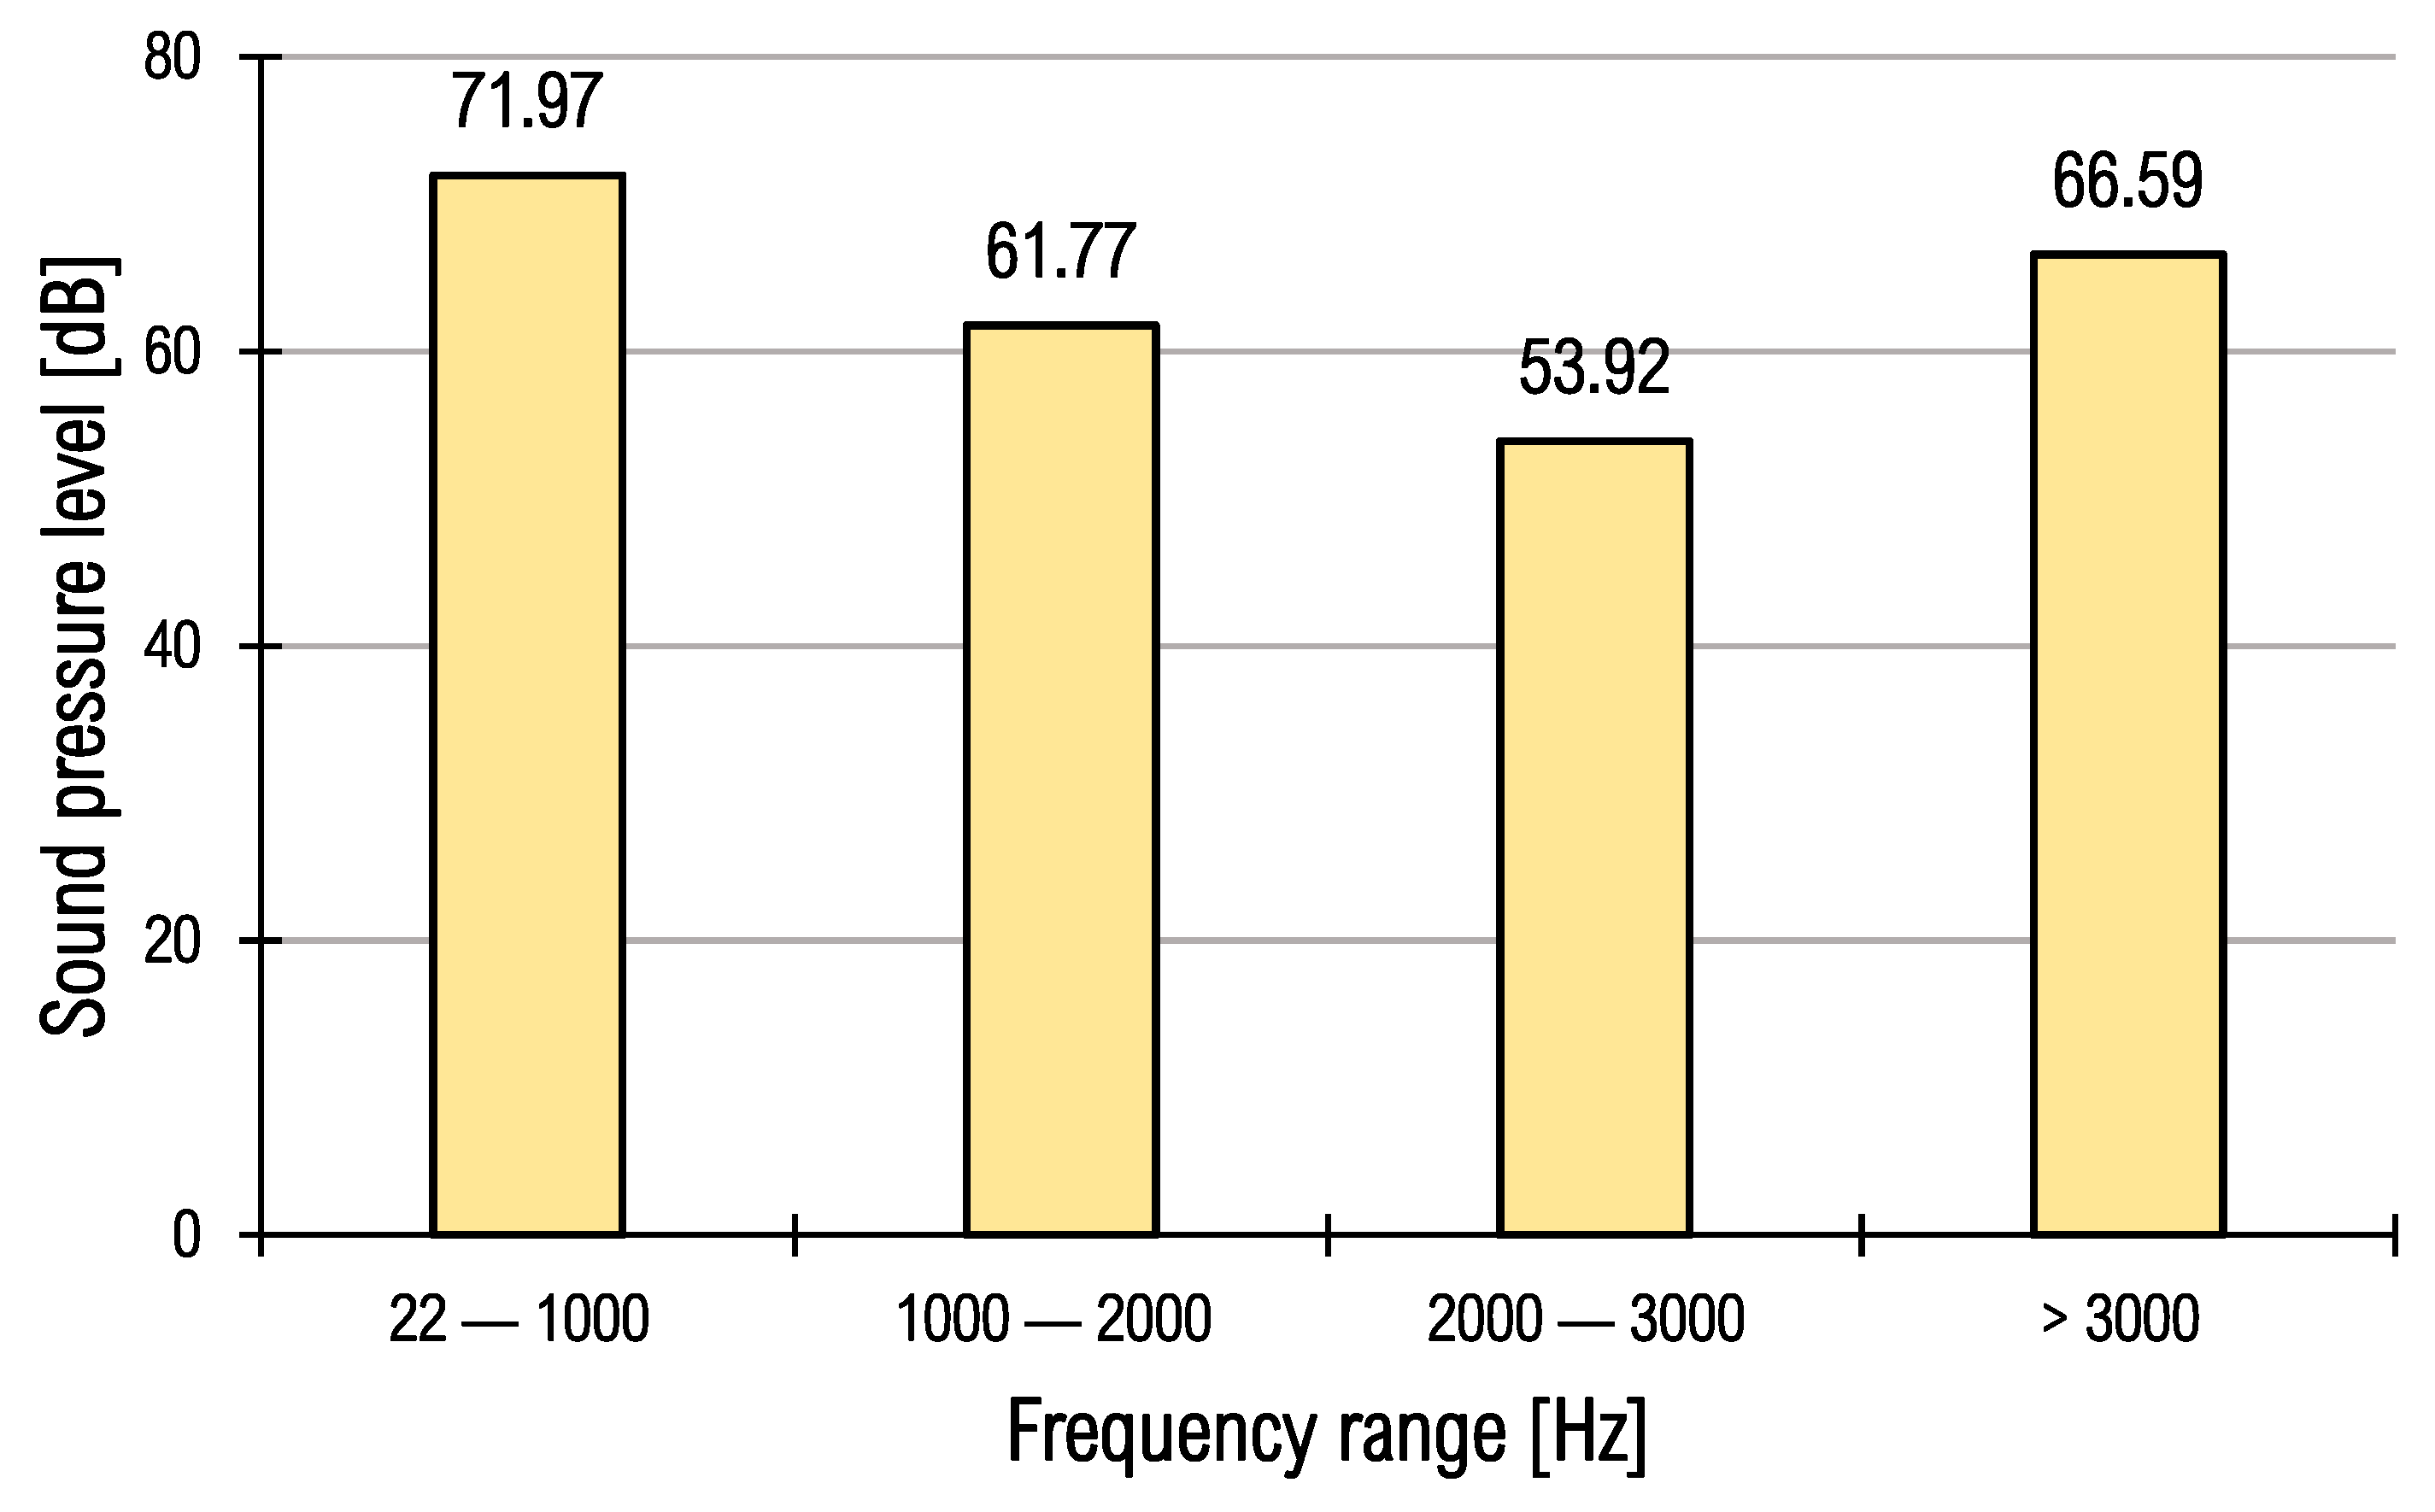
Mean sound pressure levels were identified for each of the frequencies. Their numerical values are shown in Figure 16. The highest-pressure level was identified for the frequency in the range of 22–1000 Hz. In the higher frequency ranges, the mean sound pressure level was significantly lower. This fact indicates that the majority of the noise nuisance is generated by the elements that generate noise in low frequencies. Importantly, the frequency ranges used in the evaluation are illustrative, as they are based on the observations and assumed for the purpose of noise analyses in laboratory conditions.
Measurements relate to conveyor system noise production in a laboratory environment. Noise emission as measured by the microphone array relates mostly to idler rotation and belt motion on the idlers, which can change in the field due to use of lagging and belt cleaning devices. Belt flap noise due to span resonances in a range 2.5–16 Hz falls below the detection limit of the recording system, therefore belt flap noise is not considered in this research. The laboratory test rig does not contain all devices that may be installed on a typical conveyor in the field.
6. Conclusions
The use of an acoustic camera in a measurement rig provided information which allow the main noise sources to be identified in space and ranked. The rank of the noise-generating elements is as follows: the drive system with the motor, the idler, the contact area between the belt, and the return pulley.
The noise was described by distinguishing the frequency ranges in which records were made of the components of the total noise generated by the rig. The majority of the noise sources in the analyzed conveyor is located within the low and the medium frequency ranges of up to 2 kHz. These are the frequency ranges most harmful to human hearing. These ranges are also the greatest nuisance to people in the vicinity of the conveyor. However, noise can be reduced for this frequency range with the use of a number of methods, which are particularly effective for frequencies up to 600 Hz. The low frequency noise is emitted mostly along the conveyor route, and its sources can be classified as linear emitters.
The research results confirm that the main source of noise in the belt conveyor is its drive system, and in particular its electric motor. The images recorded with the acoustic camera allow the majority of the noise sources to be located in the area of the conveyor drive system. The noise of the drive motor was identified in the frequency range from 200 Hz to 2 kHz, and the maximum sound level for this range was 43.2 dB. In the case of the belt conveyor operated underground, this noise source should be classified as a point emitter.
In addition, the noise spectrum allows the identification of harmonic frequencies of the conveyor noise within the high frequency range of 8–9 kHz. This is the noise from the belt-idler interaction. The noise generated in the idler bearings is located in the frequency range of 1–2 kHz. The research allowed the idler noise to be identified at the frequency of 1580–1581 Hz and at the level of 37.1 dB. For the frequency range of 2–3 kHz, the noise from the idler bearing was less significant, albeit still identifiable.
The last identified noise source in the investigated measurement rig was the noise from the lateral wandering of the belt on the return pulley (without the rubber lining). This phenomenon was identified for the frequency starting at 2 kHz, and a number of harmonic frequencies can be distinguished in the signal spectrum, in its practically entire range. The maximum noise level for this frequency was 43.6 dB.
The locating of noise in space allows identification of phenomena which are difficult to describe theoretically due to the limited possibility to evaluate the scale and due to the lack of theoretical models. A good example of this advantage is the possibility to locate the noise due to the lateral belt wandering.
The determination of the background noise is necessary for the separation of the machine noise signal or a single working system necessary. During laboratory tests, this consisted in recording the noise of the machine and the background and then the background itself in the room. The background is a set of noise-generating phenomena in the study environment. In field measurements, background noise depends on weather conditions and other machines conditionally operating nearby. Therefore, the algorithm of conduct must be adapted so that the background removed does not affect the results of the noise measurement.
The measurements were performed in laboratory conditions without the typical background noise observed in surface mines. Owing to this fact, the basic noise sources could be located and assigned to their characteristic frequencies, which is a result expected to prove useful during measurements in actual conditions.
Author Contributions
Conceptualization, methodology, software and validation, M.O.; P.B.; writing—review and editing and supervision, R.K. and A.N.-S.; project administration, R.K. final text prepared by M.O., P.B., A.N.-S., and R.K. All authors have read and agreed to the published version of the manuscript.
Funding
The research work was co-founded with the research subsidy of the Polish Ministry of Science and Higher Education granted for 2021.
Institutional Review Board Statement
Not applicable.
Informed Consent Statement
Not applicable.
Data Availability Statement
The data presented in this study are available on request from the corresponding author.
Conflicts of Interest
The authors declare no conflict of interest.
References
- Sadowski, J.; Fąs, T. Noise minimization of belt conveyor used for lignite coal transportation. Chem. Eng. Equip. 2014, 2, 113–115. [Google Scholar]
- Directive 2000/14/EC of the European Parliament and of the Council of 8 May 2000 on the Approximation of the Laws of the Member States Relating to the Noise Emission in the Environment by Equipment for Use Outdoors. Available online: https://eur-lex.europa.eu/legal-content/EN/TXT/?uri=celex%3A32000L0014 (accessed on 18 February 2021).
- Union, E. Directive 2006/42/EC of the European Parliament and of the Council of 17 May 2006 on Machinery, and Amending Directive 95/16/EC. Off. J. Eur. Union 2006, L161, 12–18. [Google Scholar]
- Regulation (EU) 2019/1243 of the European Parliament and of the Council of 20 June 2019 Adapting a Number of Legal Acts Providing for the Use of the Regulatory Procedure with Scrutiny to Articles 290 and 291 of the Treaty on the Functioning of the Europea. Available online: https://eur-lex.europa.eu/eli/reg/2019/1243/oj (accessed on 18 February 2021).
- Series of Standards PN-EN ISO 3740 Acoustics—Determination of Sound Power Levels of Noise Sources Using Sound Intensity. Available online: https://www.iso.org/obp/ui/#iso:std:iso:3740:ed-3:v1:en (accessed on 18 February 2021).
- Act of 29 August 2003 Amending the Act on the System of Conformity Assessment and Amending of Certain Acts. Available online: https://trade.ec.europa.eu/doclib/docs/2020/september/tradoc_158930.pdf (accessed on 18 February 2021).
- Lutyński, A. Noise measurements at production stands of the coal preparation plants. Min. Geoengin. 2006, 30, 173–180. [Google Scholar]
- Ustawa z dnia 27 kwietnia 2001 r. Prawo ochrony środowiska, Dziennik Ustaw z 2019 r., pozycja 1396. Act of 27 April 2001. Environmental Protection Law. J. Laws 2019. Available online: https://isap.sejm.gov.pl/isap.nsf/DocDetails.xsp?id=WDU20010620627 (accessed on 18 February 2021).
- European Union. Single European Act, 17 February 1986, 0.J. L169/1 (1987). Consolidated Version of the Treaty on the Functioning of the European Union, 26 October 2012. Available online: https://eur-lex.europa.eu/resource.html?uri=cellar:a519205f-924a-4978-96a2-b9af8a598b85.0004.02/DOC_1&format=PDF (accessed on 18 February 2021).
- Ministry of Climate and Environment. National Environmental Policy 2030—The Development Strategy for Environment and Water Management Area. 2019. Available online: https://www.gov.pl/web/climate/the-2030-national-environmental-policy--the-development-strategy-in-the-area-of-the-environment-and-water-management (accessed on 18 February 2021).
- Brown, S.C. Conveyor noise specification and control. Proc. Acoust. 2014, 2014, 269–276. [Google Scholar]
- Ladányi, G. Study on the noise emission of belt conveyor idler rolls. Ann. Univ. Petrosani Mech. Eng. 2016, 18, 83–92. [Google Scholar]
- Sawicki, W.; Król, R. Estimation of vibro-acoustic properties of idlers based on modal analysis. Min. Sci. 2006, 8, 179. [Google Scholar]
- Bennett, S.C. Conveyor Belt Noise. Min. Mag. 1983, 148, 453–455. [Google Scholar]
- Bučinskas, V.; Mirzaei, S.; Kirchner, K. Some Aspects of Bearing Noise Generation. In Solid State Phenomena; Trans. Tech. Publications Ltd.: Bäch, Switzerland, 2010; Volume 164, pp. 278–284. [Google Scholar]
- Charles, S.; Vijaya, J.D. Acoustic Analysis Using Sound Level Meter to Determine the Period of Usage of the Spindle Bearing of a Radial Drilling Machine. Arch. Acoust. 2019, 44. [Google Scholar] [CrossRef]
- Klimenda, F.; Kampo, J.; Hejma, P. Vibration measurement of conveyor rollers. Procedia Eng. 2016, 136, 198–203. [Google Scholar] [CrossRef] [Green Version]
- Gautam, P.; Chandy, A.J. A three-dimensional numerical investigation of air pumping noise generation in tires. J. Vib. Acoust. 2016, 138, 061005. [Google Scholar] [CrossRef]
- Vieira, T. Tyre-Road Interaction: A Holistic Approach to Noise and Rolling Resistance. Ph.D. Thesis, Kungliga Tekniska Högskolan, Stockholm, Sweden, 2018. [Google Scholar]
- Bartelmus, W.; Sawicki, W. Noise of belt conveyors. In Mine Planning and Equipment Selection 2000; Routledge: Oxfordshire, UK, 2000; pp. 879–884. [Google Scholar]
- Harrison, A. Determination of the natural frequencies of transverse vibration for conveyor belts with orthotropic properties. J. Sound Vib. 1986, 110, 483–493. [Google Scholar] [CrossRef]
- Kaiser, H.-J.; Querengässer, J.; Bündgens, G.M. Special noise problems in automotive timing belts. SAE Trans. 1993, 102, 1679–1686. [Google Scholar]
- Erić, M.M. Some research challenges of acoustic camera. In Proceedings of the 2011 19th Telecommunications Forum, TELFOR 2011—Proc. Pap., Belgrade, Serbia, 22–24 November 2011; pp. 1036–1039. [Google Scholar] [CrossRef]
- Monaragala, R.M. Knitted structures for sound absorption. In Advances in Knitting Technology; Elsevier: Amsterdam, The Netherlands, 2011; pp. 262–286. [Google Scholar]
- Wang, C.; Gao, H.; Yu, L.; Yu, T.; Yan, W.; Xue, Q. Portable Low-Frequency Noise Reduction Device for Both Small Open and Closed Spaces. Shock Vib. 2016, 2016, 6241935. [Google Scholar] [CrossRef] [Green Version]
- Kuo, S.M.; Morgan, D.R. Active noise control: A tutorial review. Proc. IEEE 1999, 87, 943–973. [Google Scholar] [CrossRef] [Green Version]
- Nau, S.L.; Mello, H.G.G. Acoustic noise in induction motors: Causes and solutions. In Proceedings of the Record of Conference Papers. Industry Applications Society Forty-Seventh Annual Conference, 2000 Petroleum and Chemical Industry Technical Conference (Cat. No. 00CH37112), San Antonio, TX, USA, 13 September 2000; pp. 253–263. [Google Scholar]
- Janda, M.; Vitek, O.; Hajek, V. Noise of Induction Machines. Induction Mot. Control 2012, 558. [Google Scholar] [CrossRef] [Green Version]
- Sathyan, S.; Aydin, U.; Belahcen, A. Acoustic noise computation of electrical motors using the boundary element method. Energies 2020, 13, 245. [Google Scholar] [CrossRef] [Green Version]
Figure 1.
Noise generation mechanisms in belt conveyors [12].
Figure 1.
Noise generation mechanisms in belt conveyors [12].

Figure 2.
The measurement rig and the location of the Bionic L-112 acoustic camera with respect to the measurement rig.
Figure 2.
The measurement rig and the location of the Bionic L-112 acoustic camera with respect to the measurement rig.

Figure 3.
Conveyor noise as a function of time (recorded time signal) with one-second time interval indicated.
Figure 3.
Conveyor noise as a function of time (recorded time signal) with one-second time interval indicated.

Figure 4.
Noise spectrum of the belt conveyor.

Figure 5.
Algorithm of the research based on the acoustic camera.

Figure 6.
Spectrogram of noise in the measurement rig for the entire range of the recorded frequencies.
Figure 6.
Spectrogram of noise in the measurement rig for the entire range of the recorded frequencies.

Figure 7.
Spectrogram of noise in the measurement rig for the frequency range of up to 2 kHz.

Figure 8.
Operating belt conveyor—belt speed: 2.75 m/s, load on the motor: 40%, frequency range: 200–1000 Hz.
Figure 8.
Operating belt conveyor—belt speed: 2.75 m/s, load on the motor: 40%, frequency range: 200–1000 Hz.

Figure 9.
Noise of the drive system in the measurement rig—frequency range 852–853 Hz.

Figure 10.
Operating belt conveyor—belt speed: 2.75 m/s, load on the motor: 40%, frequency range: 1000–2000 Hz.
Figure 10.
Operating belt conveyor—belt speed: 2.75 m/s, load on the motor: 40%, frequency range: 1000–2000 Hz.

Figure 11.
Noise of the idler bearing—frequency range 1580–1581 Hz.

Figure 12.
Operating belt conveyor—belt speed: 2.75 m/s, load on the motor: 40%, frequency range: 2000–3000 Hz.
Figure 12.
Operating belt conveyor—belt speed: 2.75 m/s, load on the motor: 40%, frequency range: 2000–3000 Hz.

Figure 13.
Noise generated due to the belt passing around the return pulley without the rubber lining—frequency range 2508–2509 Hz.
Figure 13.
Noise generated due to the belt passing around the return pulley without the rubber lining—frequency range 2508–2509 Hz.

Figure 14.
Operating belt conveyor—belt speed: 2.75 m/s, load on the motor: 40%, frequency range: 3000–8000 Hz.
Figure 14.
Operating belt conveyor—belt speed: 2.75 m/s, load on the motor: 40%, frequency range: 3000–8000 Hz.

Figure 15.
Operating belt conveyor—belt speed: 2.75 m/s, load on the motor: 40%, frequency range: 8000–9000 Hz.
Figure 15.
Operating belt conveyor—belt speed: 2.75 m/s, load on the motor: 40%, frequency range: 8000–9000 Hz.

Figure 16.
Conveyor noise for various frequency ranges.


Table 1.
Main noise sources of the conveyor for the analyzed frequency ranges.
| Frequency Range [Hz] | Identified Noise Sources |
|---|---|
| 22–1000 | conveyor drive system, electric motor, mechanically engaged conveyor elements |
| 1000–2000 | drive system, electric motor, mechanically engaged conveyor elements, idler bearings |
| 2000–3000 | drive system, mechanically engaged conveyor elements, idler bearings, belt passing on pulleys, lateral belt wandering, non-linear belt movement |
| 3000–24,000 | electric motor, belt passing on pulleys, lateral belt wandering, non-linear belt movement |
Publisher’s Note: MDPI stays neutral with regard to jurisdictional claims in published maps and institutional affiliations. |
© 2021 by the authors. Licensee MDPI, Basel, Switzerland. This article is an open access article distributed under the terms and conditions of the Creative Commons Attribution (CC BY) license (http://creativecommons.org/licenses/by/4.0/).
Share and Cite
MDPI and ACS Style
Bortnowski, P.; Nowak-Szpak, A.; Król, R.; Ozdoba, M. Analysis and Distribution of Conveyor Belt Noise Sources under Laboratory Conditions. Sustainability 2021, 13, 2233. https://0-doi-org.brum.beds.ac.uk/10.3390/su13042233
AMA Style
Bortnowski P, Nowak-Szpak A, Król R, Ozdoba M. Analysis and Distribution of Conveyor Belt Noise Sources under Laboratory Conditions. Sustainability. 2021; 13(4):2233. https://0-doi-org.brum.beds.ac.uk/10.3390/su13042233
Chicago/Turabian StyleBortnowski, Piotr, Anna Nowak-Szpak, Robert Król, and Maksymilian Ozdoba. 2021. "Analysis and Distribution of Conveyor Belt Noise Sources under Laboratory Conditions" Sustainability 13, no. 4: 2233. https://0-doi-org.brum.beds.ac.uk/10.3390/su13042233
Note that from the first issue of 2016, this journal uses article numbers instead of page numbers. See further details here.