
Study on Glacial Tourism Exploitation in the Dagu Glacier Scenic Spot Based on the AHP–ASEB Method


1
Key Laboratory of Eco-Hydrology of Inland River Basin, Northwest Institute of Eco-Environment and Resources, Chinese Academy of Sciences, Lanzhou 730000, China
2
College of Resources and Environment, University of Chinese Academy of Sciences, Beijing 100049, China
3
Scientific Research Department, Dagu Scenic Area Management Bureau, Heshui 623500, China
4
School of Civil Engineering, Lanzhou Jiaotong University, Lanzhou 730000, China
5
State Key Laboratory of Cryospheric Science, Northwest Institute of Eco-Environment and Resources, Chinese Academy of Sciences, Lanzhou 730000, China
*
Author to whom correspondence should be addressed.
Sustainability 2021, 13(5), 2614; https://0-doi-org.brum.beds.ac.uk/10.3390/su13052614
Submission received: 14 January 2021
/
Revised: 18 February 2021
/
Accepted: 24 February 2021
/
Published: 1 March 2021
(This article belongs to the Special Issue Technological Transformations towards a More Sustainable Environment in Hospitality and Tourism)
Abstract
:Due to the impact of COVID-19, people’s demand for non-contact tourism is increasing. The development of Internet technologies such as the Internet of Things, virtual reality (VR), and augmented reality (AR) can meet this demand. Internet technology makes non-contact tourism grow. However, these new technologies are emerging only within application cases, which cannot provide comprehensive methodological guidance for tourism suppliers. Despite the booming development of winter tourism in China, there are still many problems, especially affecting the tourist experience.rarchy process (AHP) and activity, setting, experience and benefit (ASEB) grid analysis were used to analyze the activities, settings, experiences and benefits of the scenic spot from the tourist perspective taking the Dagu Glacier Scenic Spot (DGSS) as an example. The research aims to increase the attraction of the scenic zone, and promote the coordinated and sustainable development of business in West China under the goal of improving tourists’ experiences. The results show that: subgoals of experience (E) and benefit (B) are the main directions of the development of ice and snow tourism in the DGSS. Furthermore, the threat of benefits (TB), the threat of setting (TS), the threat of experience (TE), the opportunities of benefits (OB), the opportunities of setting (OS), and the opportunities of experience (OE) are the main concerns.
1. Introduction
Glacier tourism, seeing modern natural resources such as glaciers, alpine snowfields, and glacier relics as the main attraction, observing the sensory, and psychological and spiritual needs of tourists, is an outdoor mountain activity that integrates self-challenge, physical exercises, leisure and entertainment, scientific research, and popular science education, and emotional cultivation [1,2,3]. Ice and snow activities originated in central Europe [4]. It has spread widely all over the world with the prosperity of the modern global economy and the promotion of the Winter Olympic Games. China’s ice and snow traveling traditional stems from the first Ice Lantern Garden Fair in Harbin, Heilongjiang in 1963 [4]. China’s economic level and residents’ living standards have gradually improved after the economic reform and opening-up policies in 1978. After that, winter tourism quickly became popular. Especially since the 2010s, China’s winter sports tourism has had a super-high-speed period of development. The number of tourists in China reached 170 million in the ice and snow season from 2016 to 2017, generating RNB 270 billion in revenue. From 2017 to 2018, the scale of sightseers increased to 197 million, and the income of snow tourism was RNB 330 billion, which was 16% and 22% higher than that of 2016 and 2017, respectively [5]. It is expected that the number of travelers in China will exceed 340 million in the winter tourism season from 2021 to 2022, with RNB 670 billion in revenue and a total value of RNB 2.88 trillion in related industries [5].
The rapid growth of the industry not only makes it a new consumer hotspot, but also makes the relevant business rise to a key national strategy and local government investment field [6]. In March 2019, the General Office of the Central Committee of the Communist Party of China and the General Office of the State Council issued a document, Opinions on Vigorously Developing Ice and Snow Sports with the Opportunity of the 2022 Beijing Winter Olympics, proposing to “speed up the development of the ice and snow industry”. In November 2019, the Sichuan Provincial Department of Culture and Tourism released the “Sichuan Province Winter Tourism Development Vision and Sichuan Province’s Three-Year Action Plan for Winter Tourism Development”, proposing to integrate the advantageous resources of Sichuan and focus on building a snow tourism industrial cluster. In the same year, Heishui County in Sichuan Province put out an ambitious plan to make use of the advantages of ice and snow to create an “international iceberg forest tourist destination”.
Despite the thriving tourism, many common problems still exist, such as poor construction quality, incomplete supporting facilities, and a lack of features [7]; a shortage of tourism infrastructure, poor service guarantee efficiency, and lagging resource development, single concept of consumption, and a lack of high-end human capital [5]. Compared with Europe and the United States, snow tourism in China started late, and the industrial system was imperfect. In particular, the exploiting concept was lagging, and the development path was not clear due to the contradistinction of the examples of Japan and South Korea [8]. In addition, the size of glacier tourism in China was small, the development level was low, and it had not yet stimulated an economic growth effect on the region [9].
The western regions, generally deemed as one of the key distribution areas of China’s glacier resources and one of the most important destinations of winter tourism in China, has great development potential under the background of the national strategy of the Belt and Road Initiative. However, snow traveling in the western regions also faces the above-mentioned problems, among which the comprehensive problem of low satisfaction due to the imperfect utilization is prominent. Therefore, it is particularly important to improve the quality of tourism, meet the needs of tourists, and strive for sustainable development under the existing conditions.
Strengths, weaknesses, opportunities, and threats (referred to as SWOT) situation analysis, considered as a method of system analysis and strategic choice based on an internal and external competitive environment, can provide relatively reasonable development strategy in line with their own advantages [10]. It has been applied in the evaluation of tourism resources in some areas [11,12]. However, SWOT cannot incorporate all dimensions of consumer experience into its system. The activity, setting, experience, and benefit (referred to as ASEB) grid analysis method oriented by tourist satisfaction decomposes various elements of tourists’ subjective feelings and incorporates them into the analysis system, which can provide a systematic analysis framework aimed at improving tourists’ satisfaction degree [13,14,15]. ASEB is widely used [16,17], but a lack of quantitative data is one of its shortcomings.
The analytic hierarchy process (referred to as AHP), regarded as a classical method of hierarchical structure analysis, possesses the advantages of quantitative and qualitative analysis [18]. Since 2018, the academia both within and outside of China have conducted much research by integrating AHP and SWOT, and good results have been achieved: Shu [19] discussed the strategic opportunities of the China–Pakistan Economic Corridor with the background of “One Belt One Road”; Shen [20] studied the renewal of rail transit stations in urban central areas under the conditions of preserving historical and cultural heritage with specific cases; Liu [21] analyzed the strategic choice of the Zhejiang Xiangshan film and television city; and Lenis Escobar [22] designed the application and management strategy of monetary policy system based on the SWOT-AHP method. AHP and SWOT are unable to analyze various elements that threaten visitors’ experience in-depth, nor can they offer a strategic path to enhance the tourist perception based on quantitative methods. Therefore, this study used the AHP–ASEB analysis method to make up for the shortcomings of the above two analysis methods in order to boost the quality of tourism.
Much related research around the development of glacier resources of the western region has been performed from different angles over the past three years: Wang [23] analyzed the temporal and spatial structure characteristics of Dagu snow tourism and optimization countermeasures; Song [24] studied the layout of tourism space of the Glacier National Geopark by using the example of Yulong Snow Mountain; Ma [25] took the Midui glacier in Tibet as an example to analyze the comprehensive development of glacier tourism resources in China. As a representation of winter tourism in the western region, the Dagu Glacier Scenic Spot (DGSS) reflects the common challenges faced by the western region with the processes of mining and utilization. In view of this, this study selected the DGSS as the research object and used the AHP–ASEB analysis method to make up for the shortcomings of the above two analysis methods. Moreover, the ultimate goal of using AHP–ASEB was to provide an analytical framework and empirical guidance for similar scenic spots in the West.
2. Materials and Methodology
2.1. Study Area
2.1.1. Location
The DGSS is located in the northwest of Heishui County, about 20 km away from Heishui County, and administratively belongs to Aba Tibetan and Qiang Autonomous Prefecture, Sichuan Province. The scenic spot, about 175 km from Maerkang City and 300 km from Chengdu (Figure 1), is bordered by Qinglang Township of Heishui County to the east, Shashiduo Township and Hongyuan County to the west, Luhua Town of Heishui County to the south, and Songpan County to the north. Heishui County located in the northwest of Sichuan Province has transportation connections with western Sichuan and Kangzang, which is an important transportation node for southwest China. In terms of the division of regional functional areas, it belongs to the key areas of Sichuan–Yunnan forest and biodiversity functional areas in the national key ecological functional areas. Moreover, it is the first group of pilot areas of the global tourism strategy determined by the National Tourism Administration. It is one of the provincial “strong rural tourism” counties built in Sichuan Province, and it is also the center of the five major areas in Aba Prefecture. Consequently, its ecological and tourism function are indispensable.
2.1.2. Glacier Tourism Resources
Snow tourism is a kind of tourism that depends on cold climate conditions and ice and snow resources [26]. It has three basic characteristics: snowy natural landscapes and humanistic landscapes are the main attractions; winter sports, snow culture and sightseeing are the main activities; the integrated development of snow sports and tourism is the main model [27]. Natural resources are the material basis of snow tourism; thus, the preservation of natural landscape resources should be the primary concern. In terms of natural landscape resources, the DGSS takes the glacier as the principal natural feature and integrates the natural ecological plateau landscape, Tibetan culture and historical relics of the Red Army revolution as additional interests. The whole scenic area is dominated by glaciers, surface calcification, plateau primitive forests, colored slopes, and plateau lakes. Moreover, it is a blend of Tibetan and Qiang culture, and was also one of the minority areas of the Red Army’s Long March. The cultural landscape of the scenic area mainly includes the national pastoral landscape, Tibetan village buildings, residential ancestral halls, and historical relics of the Red Army revolution (Table 1)。
2.2. Methodolgy
2.2.1. ASEB Grid Analysis
ASEB is a consumer-oriented management method that brings tourist experience into the analysis system. It is designed specifically for the problems caused by experiential consumption and is an upgrade of the traditional SWOT analysis [28]. ASEB is a sequential study of sixteen unit elements consisting of row-column crossovers from strength assessments of activities (SA) to threat assessments of Benefits (TB) [29] (Table 2). It can evaluate the four factors (activities, setting, experience and benefits) that affect tourists’ feelings from four dimensions (strengths, weaknesses, opportunities, and threats). The method fully considers the consumption experience at all levels and takes the improvement of consumer satisfaction as the final orientation. In addition, it can combine the tourism development with the tourists’ subjective perceptions, and afford ways for scenic areas to improve the resultant degree of satisfaction.
2.2.2. Analytic Hierarchy Process
Multi-criteria decision analysis (MCDA), one of the important parts of modern decision analysis theory, can be used to evaluate a series of alternatives on the basis of some irrelevant and inconsistent rules, and is further used to find the optimal plan in decision making [30]. It has been considered as a mathematical tool to guide policymakers to make wise choices based on more diverse factors or even conflicting criteria [31]. MCDA has three important procedures: firstly, to use known alternatives; then, multiple rules are used as the basis for evaluation, and decision makers express their preference information; and finally, arranging the sequence of alternatives. In fact, it allows multiple factors, multiple standards, and even contradictions [32]. Corresponding with MCDA, multi-criteria decision making (MCDM) currently includes at least four popular application methods, such as the Technique for Order Preference by Similarity to an Ideal Solution (TOPSIS) [33], VlseKriterijumska Optimizacija I Kompromisno Resenje (VIKOR) [34], Complex Proportional Assessment (COPRAS) [35] and Preference Ranking Organization Method for Enrichment Evaluation (PROMETHEE) [36].
VIKOR and TOPSIS are based on an aggregation function representing “the closest to the ideal scheme”, which originated from the compromise programming method [37]. Their similarities are to measure the advantages and disadvantages of the scheme according to the closeness between the scheme and the ideal result, but the difference is that the best scheme obtained by VIKOR is more likely closest to the ideal, and the best scheme obtained by TOPSIS method is not always close to the ideal scheme from the evaluation results [37,38]. However, they differ mostly in their operational approach to calculating distance and how the two methods consider the concept of proximity to the ideal solutions [39]. The TOPSIS method calculates the shortest distance between the scheme to be evaluated and the ideal solution and the maximum distance of alternatives from the reference elements, but it fails to consider the relative importance of these distances. The VIKOR method determines the preference stability ranking table, commitment solution and weight stability interval of a compromise solution based on the initial or given weight. The method focuses on sorting and selecting a set of alternatives in the presence of conflict standards, and successfully considers the relative importance of the distance between the general and the ideal value.
The COPRAS method, assuming a direct and proportional relationship of the importance of investigated variants on a system of criteria adequately describing the decision variants and values and weights of the criteria, is aimed at improving the overall efficiency of evaluation options [40]. Determining the most important indicators and standards used to assess the priority ranking of programs is an essential part of the COPRAS method. This method focuses on evaluating the order of schemes based on the information of these standards, which is usually applied to the ranking and selection of decision schemes where their relative importance has been shown, and especially considers the ranking of alternatives under conflicting standards [41]. The basic idea of the PROMETHEE method is that decision makers choose criteria or define preference functions according to their preferences. The method uses preference functions and criterion weight coefficients to define the priority degree of the two schemes, and finally use the priority relationship to determine the ranking of schemes [42]. When using the PROMETHEE method, two aspects are indispensable, namely: information on the relative importance of the criteria considered; and information on the decision-makers’ preference function, which they use when comparing the contribution of the alternatives in terms of each separate criterion [43]. The similarities between COPRAS and PROMETHEE are that both of them determine the order of schemes according to certain rules. However, COPRAS emphasizes utilization efficiency and indicator standards, while PROMETHEE emphasizes the preference attributes of decision makers.
In general, the above four application methods, with broadly similar analytical frameworks and similar ranking methods, are designed to determine the pros and cons of the sequence between programs and help the decision maker find a solution that best suits their preferences. Their difference is that VIKOR and TOPSIS both determine the order of schemes by measuring the distance between schemes and ideal schemes [39]; in contrast, COPRAS and PROMETHEE emphasize judging the quality of the scheme by defining the index rules or preference functions. It should be pointed out that COPRAS method successfully deals with the dilemma of choice under the conflicting standards. From the perspective of technical characteristics, the above four methods do not assign specific standardizations, which may lead to different results when using different standardization methods [39].
AHP, proposed by Saaty who was a professor at the University of Pittsburgh in the 1970s, can calculate the relative weight of each level of elements and the contribution weight to the goal, and can determine the importance of the underlying elements by constructing the realization factors of the goal according to the correlation and membership relationship to form a hierarchical model [44]. AHP has the advantages of qualitative and quantitative analysis, which can overcome the shortcomings of the relative separation of each element in ASEB and distinguish the relative importance of elements in grid analysis [45,46,47]. The implementation steps of AHP are as follows. Firstly, the total target, secondary target, secondary target elements and schemes according to the elements of ASEB are built. Secondly, the pair judgment matrix of the target layer and scheme layer is established. Thirdly, the consistency test with the Belton–Gear method is conducted and the contribution of the underlying scheme to the overall objective is calculated. Finally, the utilization direction and implementation method in accordance with improved contribution value are selected.
This study aims to decompose the overall goal of ice and snow tourism development under the background of experience economy by the ASEB method and determine the specific development path by the contribution of the decomposed elements to the overall goal. In addition, we are not likely to determine the optimal scheme in advance, nor is it likely to determine the preference function of all tourists in the research process, which is the fundamental reason why we chose AHP combined with ASEB instead of one of the above four methods.
2.2.3. Methods to Cope with Rank Reversal Phenomenon
It is generally agreed that the normalization process of relative weights when using the AHP method is the mathematical cause of rank inverse problems [48]. Different from the problem where the judgment matrix does not meet the consistency rules, the grade reversal phenomenon is a problem of using methods, which is not objective and can be properly handled and solved. At present, the methods to deal with rank reversal appearance are relatively mature, such as replacing standardized weight vector with weight proportion matrix [49], aggregation rules [50], and the AHP two-stage method [51]. The pros and cons of the scheme depend on the degree of satisfaction the scheme brings to decision makers. The essence of scheme ranking is based on the ideal scheme in their minds. The better the scheme, the closer it is to the ideal scheme in the minds of decision makers. As long as the ideal scheme of decision makers remains unchanged, the ranking results should not change actually.
The study uses the maximum weight proposed by Belton and Gear rather than the sum of ownership weights to standardize the weight vector [52]. The method is called B–G method. The formula is:
where is the eigenvector of the judgment matrix, and are the feature vectors normalized by the B–G method.
2.3. Data
Twenty experts were invited to participate in this research project, of which five were the operation and management personnel of the DGSS, another five were the operation personnel of similar scenic areas in western China, and the remaining ten were domestic scholars engaged in tourism development. We invited the above experts to fill out a questionnaire about the DGSS through online and field consultation. The questionnaire results of managers and scholars in the above twenty fields were used as the basic data source of this study. In addition, some data of this study came from the internal statistical report of the DGSS and the relevant government planning, which will be specify in the references.
3. Results
3.1. ASEB Grid Analysis Results of the DGSS
According to the ASEB method, the contents of ASEB grid analysis matrix of winter tourism development in the DGSS is presented as flows.
The evaluation results of strengths, weaknesses, opportunities, and threats of activities were as follows: 1. relatively rich snow celebrations and events (SA1); 2. unique Tibetan folk customs and varied folk arts (SA2); 3. repeated natural and cultural landscape natural and cultural landscape (WA1); 4. homogeneous competition with surrounding similar scenic spots (WA2); 5. far from the main source of passenger flows (WA3); 6. tourism product diversity development (OA1); 7. gradual perfection of operational management measures (OA2); 8. rapid progress of winter sports in China (OA3); 9. contradictions between the development of scenic spots and the life of local residents (TA1); 10. contradictions between ecological protection and tourism resources development (TA2); 11. low reputation and brand competitiveness (TA3).
The assessment results of strengths, weaknesses, opportunities, and threats of the setting were as follows: 1. a variety of winter natural landscape (SS1); 2. humanities building (SS2); 3. improved reception facilities (SS3); 4. the uplift of service level (SS4); 5. easily susceptible to natural disasters (WS1); 6. the surrounding economy is relatively underdeveloped (WS2); 7. high altitude areas, fragile ecological environment, large development costs (WS3); 8. low operational capacity (WS4); 9. favorable national and local tourism development strategies (OS1); 10. progressive reformation of traffic conditions (OS2); 11. gradually improved service level (OS3); 12. frequent occurrence of natural disasters (TS1); 13. traffic constraints (TS2); 14. single source of passenger flow (TS3); 15. substitute effect of tourism peak season (TS4).
The valuation results of strengths, weaknesses, opportunities and threats of experience were as follows: 1. a taste of plateau snow (SE1); 2. experiencing national culture (SE2); 3. expanding glacier knowledge (SE3); 4. acceptance of patriotic education (SE4); 5. inadequate infrastructure (WE1); 6. high food prices (WE2); 7. lack of emergency medical equipment (WE3); 8. human resource investment (OE1); 9. high-quality explanation services provided (OE2); 10. information platform construction (OE3); 11. operation with third parties (OE4); 12. fewer interactive projects (TE1); 13. homogenized tourism content (TE2); 14. lack of tourism product selling points (TE3).
The appraisal results of strengths, weaknesses, opportunities, and threats of benefits were as follows: 1. feeling nature (SB1); 2. the influence of national culture (SB2); 3. understanding local geomorphologic changes (SB3); 4. understanding the difficulties of the ancestors’ entrepreneurship (SB4); 5. lack of explanation service (WB1); 6. ticket prices of different channels (WB2); 7. deficient entertainment projects (WB3); 8. marketing promotion (OB1); 9. excavating the Red Army’s historical culture and minority cultures (OB2); 10. build the ice and snow brand, implant new media traffic (OB3); 11. cableway fares are higher (TB1); 12. channel ticket pricing is higher (TB2); 13. scenic revenue is less (TB3); 14. restrictions of local government financial investment (TB4).
3.2. Calculation and Inspection Results of AHP–ASEB for the DGSS
3.2.1. Building a Hierarchical Model
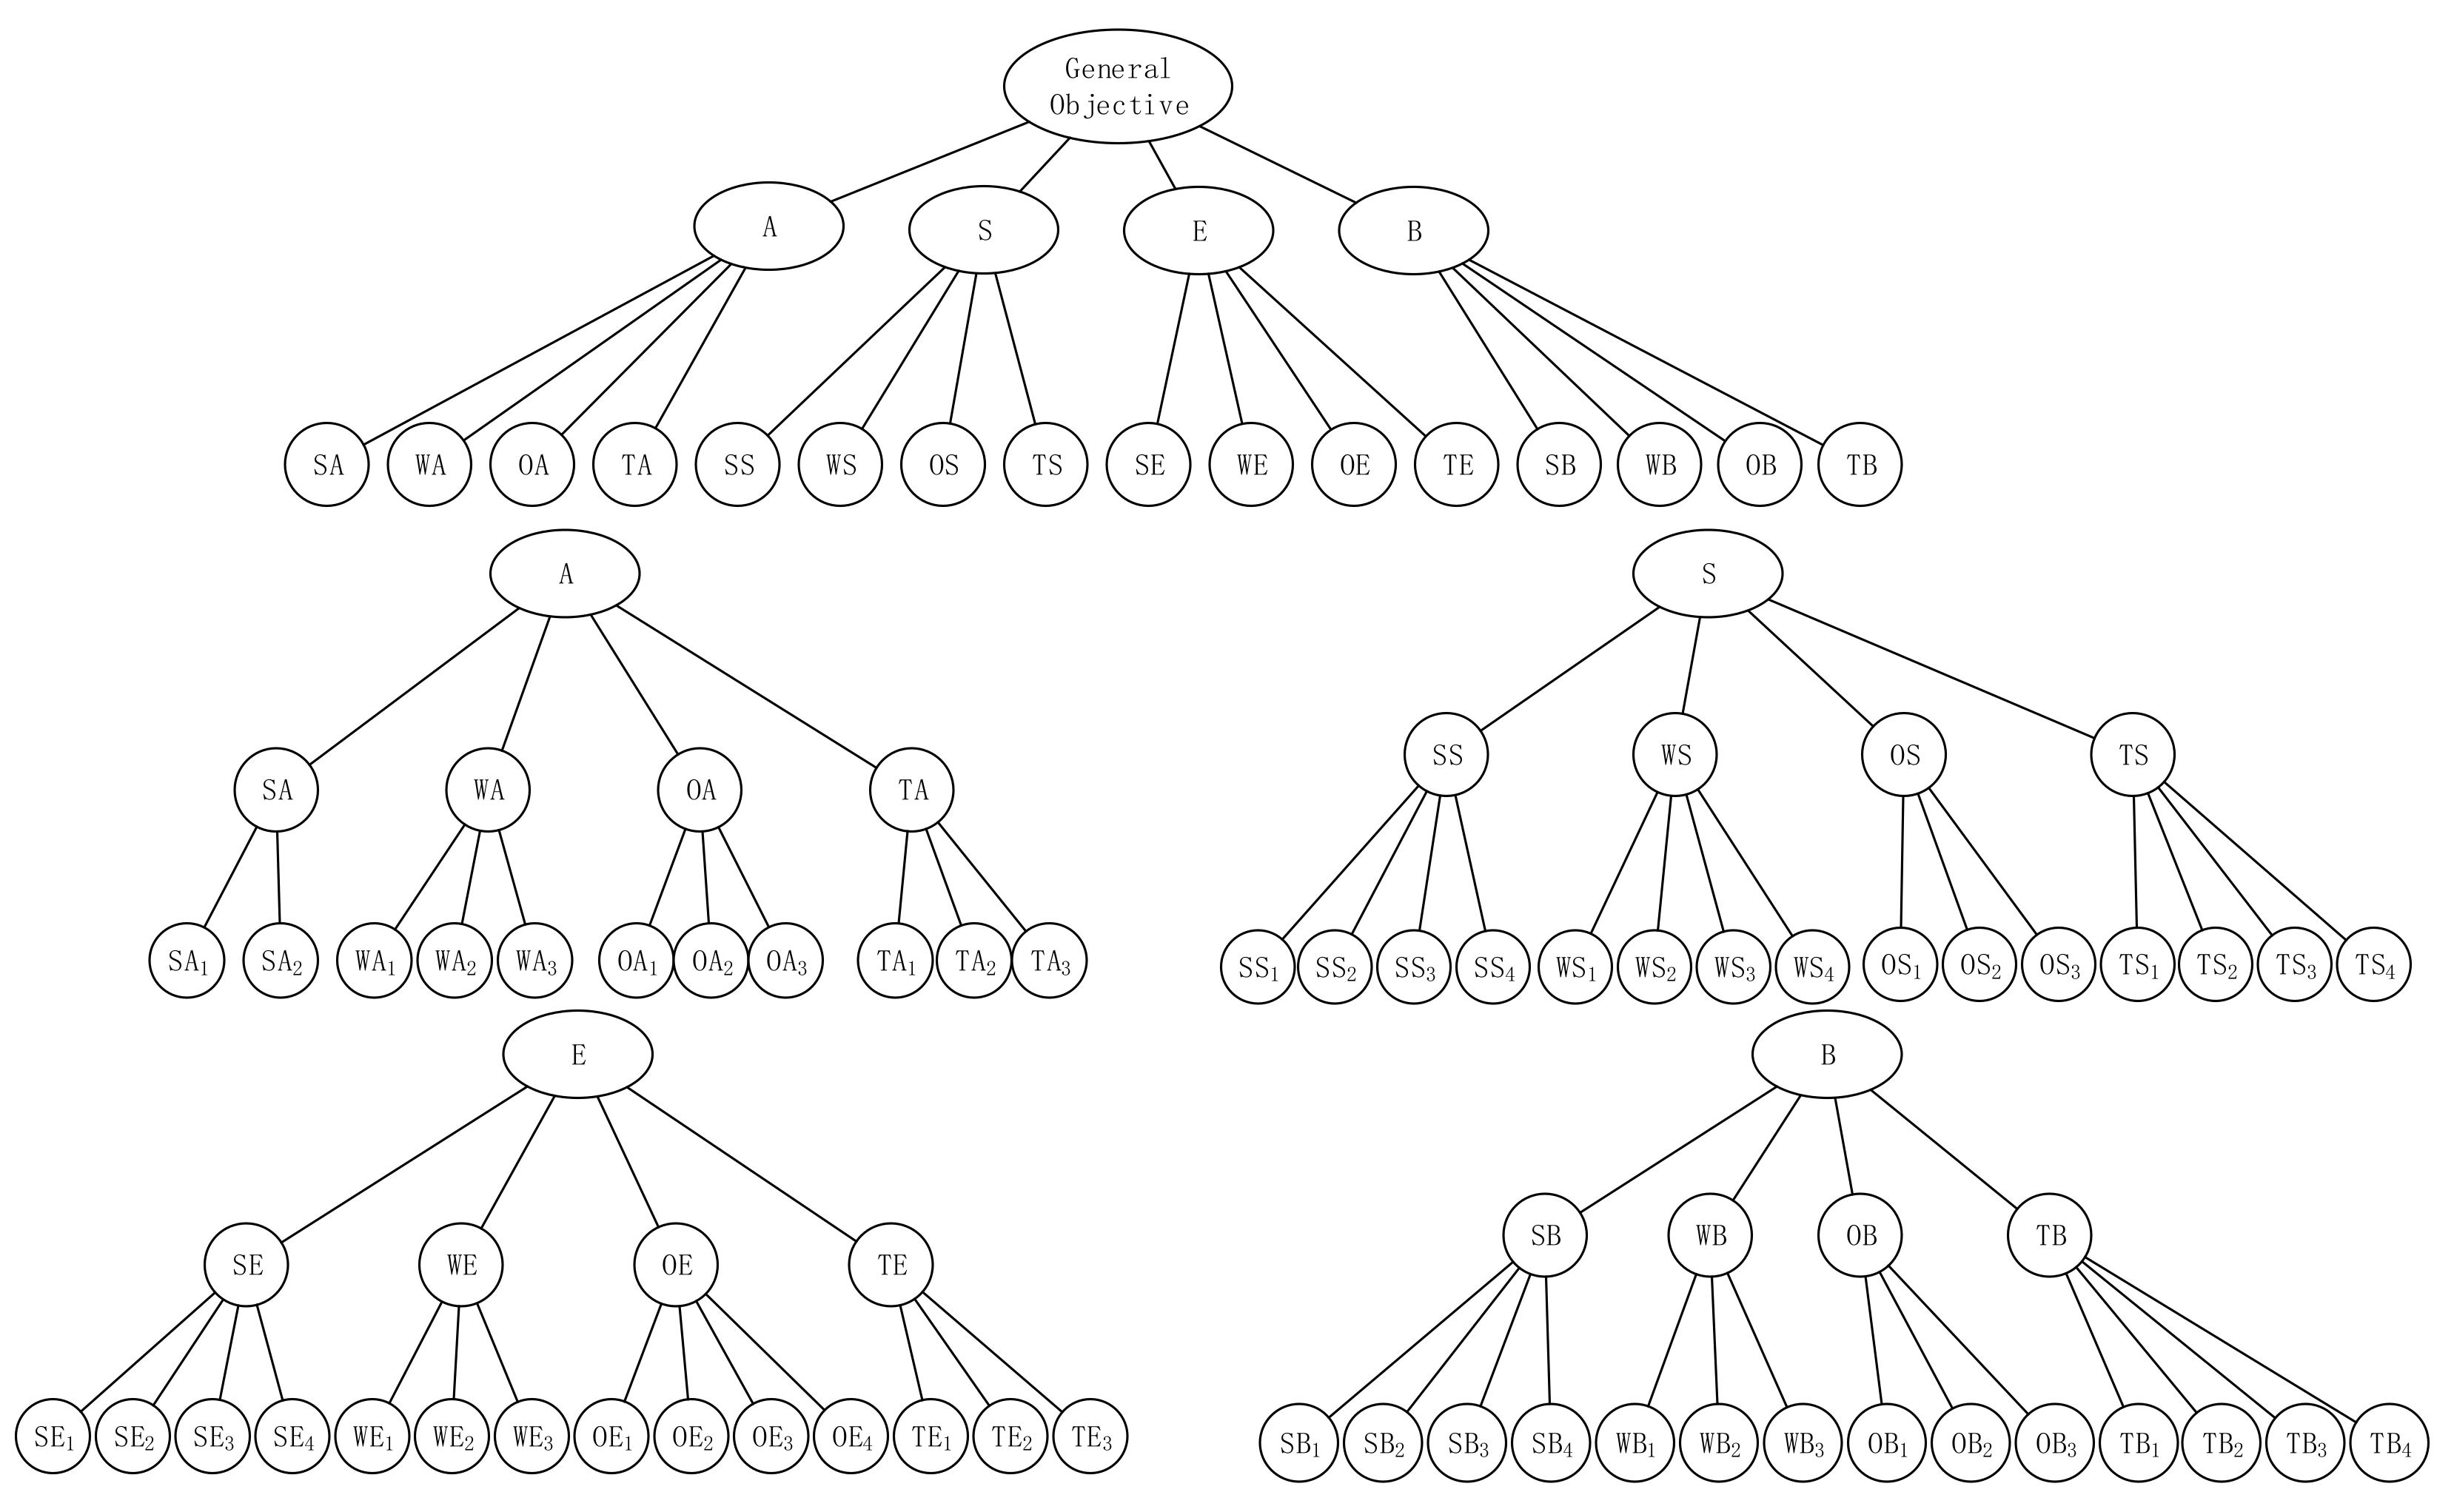
The activities (A), setting (S), experience (E) and benefits (B) are regarded as the criterion layer, and the strength evaluation of activities (SA) to the threat evaluation of benefits (TB) are regarded as the scheme layer; thus, the AHP–ASEB hierarchical model with the development of snow tourism in Dagu as the highest target layer was established. A second-level AHP–ASEB hierarchical structure model with activities (A) as sub-goals was established by taking strength assessment (SA) with threat assessment (TA) of activities as the criterion layer, and by collating SA elements (SA1) to TA elements (TA3) as the program layer. The approach to establishing a sub-goal of setting, experience and benefits is exactly the same as that for establishing an activity sub-goal. Based on the above process, the AHP–ASEB comprehensive hierarchical model for the development of ice and snow tourism in the DGSS was established. (Figure 2).
3.2.2. Constructing a Comparison Matrix
According to the Delphi method and scoring data of experts and operators, the criterion layer judgment matrix (T *) is founded by a 1–9 scale method [53] and establishing a judgment matrix (A * to B *) for the comprehensive assessment of activities, setting, experience and benefits. A judgment matrix (SA * to TB *) relating the programs of SA to the programs of TB was created.
3.2.3. Consistency Check
In this study, the consistency ratio is defined as follows:
where RI is the introduced random consistency index, and CI is the consistency indicator obtained by maximum eigenvalues of the matrix.
The degree of inconsistency of the judgment matrix is within the allowable range where it is generally considered to be CR < 0.1; when CR > 0.1, it is considered that the degree of inconsistency of judgment matrix is not within the allowable range [54].
AHP is used to analyze the judgment matrix, and we compute the weight and contribution to the target in the hierarchy model (Appendix A). The judgment matrix conforms to the consistency check rule after verification, and the degree of inconsistency is also within the satisfactory range.
3.3. Weight Analysis Results of AHP–ASEB for the DGSS
In the hierarchical model of the total target, the calculated value obtained by multiplying the weight of the scheme layer by the weight of the corresponding criterion layer is the weight of the scheme layer to the total target. (Table 3).
In the hierarchical model of four sub-goals, the calculated value obtained by multiplying the weight of scheme layer by the weight of criterion layer is the contribution value of the scheme layer to sub-goals. (Table 4).
The sub-goal scheme layer is regarded as the underlying scheme. The value obtained by multiplying the weight of the underlying scheme by the weight of the criterion layer of the corresponding sub-goal and multiplying the weight of the corresponding total goal is the contribution value of the underlying scheme to the total goal. Group A, group S, group E, and group B are the top three, the top three, the top five and the top five contribution values, respectively, according to the contribution value from large to small. (Table 5).
4. Discussion
This paper provides a basic and enforceable methodological system for similar scenic spots. The research method could be used to calculate and obtain development counter-measures suitable for the positioning and characteristics of other scenic spots according to the steps. The reason for choosing the AHP method is that the combination of AHP and ASEB can better decompose the factors affecting the tourist experience. Methods such as TOPSIS, VIKOR, and COPRAS can also be applied to the decision-making process, which will be used for more objective comparative study in follow-up research.
The scenic area operator is the supply side of ice and snow tourism, and tourists are the demand side of the tourism. From the comparative research perspective, most domestic research only stands on the position of the scenic operators, and only considers the supply factors. Meanwhile, the majority of the relevant research aims at guiding the scenic area operators as to how to organize and carry out scenic construction and tourism activities from top to bottom. However, some researchers do not specifically incorporate the demand side factors into the whole development process, resulting in many problems, as mentioned before. The problems have seriously reduced tourists’ satisfaction and goodwill towards scenic spots, and also seriously affected the sustainable development of scenic spots. This paper has not only decomposed the factors affecting the demand side in detail, but also incorporate the factors affecting the demand side into the development process of scenic spots. ly when the supply and demand match well can the supply side realize the value transformation. Therefore, the improved the research angle of the study provides a different perspective from the traditional research, which not only helps to optimize the development strategies and behaviors of tourism suppliers from the tourism demand side, but also helps the scenic area operators to accurately grasp the changes in tourist demand.
Most studies adopt a combination of AHP and SWOT. As mentioned above, SWOT analysis fails to consider the experience of tourists, which is the inherent defect of the method. However, more detrimental is that most of the domestic research does not consider the inherent shortcomings of the AHP method when using the tool. The AHP method has at least three shortcomings. Firstly, there may be a phenomenon of rank reversal, which may be the biggest defect of AHP. Secondly, hierarchy analysis assumes that the decision-making layers are independent of each other, and only considers the one-way relationship between the decision-making layers; that is, the influence of the lower layer to the upper layer [55,56]; Thirdly, the interactions within the decision-making hierarchy are not considered [57]. There are two improvements proposed in the study. Firstly, in order to investigate the demand side factors more carefully, we used the ASEB method rather than the SWOT method; Secondly, the rank reversal phenomenon in the AHP method may lead to our previous work becoming meaningless. Therefore, we adopted a method of combining improved AHP and ASEB methods. Specifically, the ASEB category is fixed, inducing a fixed intermediate criterion layer. However, the phenomenon of grade reversal may still exist in the bottom schemes. In order to overcome the rank reversal caused by the change of the underlying scheme, we synthesized the relevant research results and used the B–G method to avoid this phenomenon.
This paper indicates that the assessment of environmental opportunities (OS) and the assessment of environmental challenges (TS) play an indispensable role in improving tourist experience. Although it agrees with empirical intuition and conforms with most domestic research findings, this study further indicates that the national and local governments’ ice and snow tourism development plans (OS1) and the substitution effect of similar scenic spots in the peak season of snow tourism (TS4) play a far greater role in the development of scenic spots with the goal of improving tourist satisfaction than other aspects of environmental factors, especially the mutual competition and substitution effect of similar scenic spots, which is ignored by most studies. Competition between similar scenic spots and their alternative utility has suggested to scenic operators that the homogenization of development strategies is undesirable. In other words, only by fully exploiting the characteristics of their own resources and differentiating competition can it be possible to succeed. In addition, this paper further reveals the importance of the assessment of opportunities for benefits (OB), the assessment of threats to benefits (TB), the assessment of opportunities for experience (OE) and the assessment of threats to experience (TE) in the development of snow tourist attractions. More accurately, the results further suggest that the lack of tourism product selling points (TE3), the construction of a talent team (OE1) and the excavation of cultural heritage sites (OB2), and a single source of income in scenic spots (TB4) have very close contributions to the overall goal, and their contribution to the overall goal is more than 0.05 according to our research. Compared with other domestic studies, we are convinced that human capital investment in the development of scenic spots deserves much more attention than it has previously received.
AI, AR, VR and loT have gradually become more popular in recent years, and their contributions to promoting the development of tourism are also increasing. However, these technologies are for technical application; they are not methodologies that have a general guiding role. This study aims to provide a universally applicable methodology for ice and snow tourism suppliers. The relationship between the above techniques and the methods we use are as follows: The techniques can be used as specific content of OE or SE to improve the experience of tourists. On the other hand, this study shows that E and B are the main direction of ice and snow tourism development in scenic spots, which shows that the conclusion of the study is highly consistent with the above technology in improving the tourist experience. In OE3, we elaborated the importance of constructing an information platform for the development and operation of scenic spots. In fact, the technology mentioned above can be incorporated into the process of creating an information system for scenic spots as an application case, so as to further improve the ability of tourism suppliers to meet the needs of tourists and respond to external shocks.
The ASEB method, in fact, has relatively few limitations in evaluating tourist experience. Its disadvantage is that the scope is relatively wide, causing a small degree of correlation factors to consider, ignoring other more important factors. There are many factors influencing tourist experience. For example, Zeng [58] maintains that climate comfort is an important factor affecting tourist destination experience in related studies; Zhang [59] suggests that the linear layout of tourism industry is an important reason affecting tourism experience; Xie [60] analyzed the different categories of the concept of body and proposed that tourism experience is actually strictly dependent on the concept of body. Therefore, the conclusions obtained by the ASEB method may be biased. In addition, we failed to avoid the interference of human factors in the scoring process and ignored the impact of COVID-19. More importantly, the interaction between the criterion layer and the scheme layer have not been inspected, although this is one of the shortcomings of the AHP method itself. This aspect will be the direction of our next work.
5. Conclusions
This study selected sixteen grid elements and fifty-two decomposition elements corresponding to 16 grid elements from four aspects of activities (A), settings (S), experiences (E) and benefits (B), and used the AHP–ASEB process to establish a quantitative analysis framework of the underlying scheme under the condition of considering tourists’ perception. The following conclusions were reached:
- (1)
- Experiences (E) and benefits (B) goals are the main directions of ice and snow tourism development, with the goal of improving tourist experience. Assessment of the threat of benefits (TB), assessment of the threat of setting (TS), assessment of the threat of experience (TE), assessment of the opportunities of benefits (OB), assessment of the opportunities of setting (OS) and assessment of the opportunities of experience (OE) are the main objects of the path;
- (2)
- The selling points of tourism products (TE3), talent team construction (OE1), information platforms (OE3), high interaction and participation projects (TE1), third-party cooperation (OE4), and medical rescue systems (WE3) are the main factors affecting the experience goal. The role of human capital in the development of scenic spots is more prominent than other factors affecting experience, which is particularly emphasized;
- (3)
- Excavating historical and national culture (OB2), local government financial investment (TB4), channel and marketing promotion (OB1), new media flow (OB3), and a lack of entertainment projects (WB3) are the main factors restricting the benefits of tourists;
- (4)
- The national and local governments’ tourism development plans (OS1), and the substitution effects of similar scenic spots in the peak season of ice and snow tourism (TS4) are far greater than other aspects of environmental factors. Particularly, TS4 is the most urgent problem faced by the scenic area, and it is also one of the root causes that directly affects the income of the scenic area.
Author Contributions
Conceptualization, W.S.; methodology, W.S.; software, W.S.; data curation, W.S. and F.Z.; writing—original draft preparation, W.S.; writing—review and editing, W.S., F.Z., S.T., J.W., and Y.M. All authors have read and agreed to the published version of the manuscript.
Funding
The research was funded by the Strategic Priority Research Program of the Chinese Academy of Sciences (Grant No. XDA23060702).
Institutional Review Board Statement
Not applicable.
Informed Consent Statement
Not applicable.
Data Availability Statement
Data is contained within the article, the data presented in this study are available in Section 3.2.2.
Conflicts of Interest
In a unanimous agreement, all authors declare no conflict of interest in the present study.
Appendix A

Table A1.
Weight analysis and consistency verification of Dagu ice snow tourism development.
| Criteria Layer | Consistency Check (CR) | Maximal Characteristic Root (λmax) | Weight of the Criteria Layer | Plan Layer | Consistency Check (CR) | Maximal Characteristic Root (λmax) | Weight of Plan Layer |
|---|---|---|---|---|---|---|---|
| A | 0.013 | 4.034 | 0.06927 | SA | 0.045 | 4.135 | 0.07578 |
| WA | 0.17159 | ||||||
| OA | 0.39229 | ||||||
| TA | 0.36034 | ||||||
| S | 0.17224 | SS | 0.080 | 4.215 | 0.09852 | ||
| WS | 0.18336 | ||||||
| OS | 0.37341 | ||||||
| TS | 0.34470 | ||||||
| E | 0.35951 | SE | 0.054 | 4.144 | 0.05903 | ||
| WE | 0.11266 | ||||||
| OE | 0.40772 | ||||||
| TE | 0.42059 | ||||||
| B | 0.39898 | SB | 0.085 | 4.226 | 0.10344 | ||
| WB | 0.12651 | ||||||
| OB | 0.50956 | ||||||
| TB | 0.26049 |
Table A2.
Activity-based weight analysis and consistency check.
| Criteria Layer | Consistency Check (CR) | Maximal Characteristic Root (λmax) | Weight of the Criterion Layer | Plan Layer | Consistency Check (CR) | Maximal Characteristic Root (λmax) | Weight of the Plan Layer |
|---|---|---|---|---|---|---|---|
| SA | 0.045 | 4.135 | 0.07578 | SA1 | NULL | 2.000 | 0.75000 |
| SA2 | 0.25000 | ||||||
| WA | 0.17159 | WA1 | 0.052 | 3.054 | 0.52468 | ||
| WA2 | 0.14156 | ||||||
| WA3 | 0.33377 | ||||||
| OA | 0.39229 | OA1 | 0.000 | 3.000 | 0.45455 | ||
| OA2 | 0.45455 | ||||||
| OA3 | 0.09091 | ||||||
| TA | 0.36034 | TA1 | 0.037 | 3.039 | 0.63335 | ||
| TA2 | 0.26050 | ||||||
| TA3 | 0.10616 |
Table A3.
Weight analysis and consistency check for setting.
| Criteria layer | Consistency Check (CR) | Maximal Characteristic Root (λmax) | Weight of the Criterion Layer | Plan Layer | Consistency Check (CR) | Maximal Characteristic Root (λmax) | Weight of the Plan Layer |
|---|---|---|---|---|---|---|---|
| SS | 0.080 | 4.215 | 0.09852 | SS1 | 0.012 | 4.033 | 0.28482 |
| SS2 | 0.07411 | ||||||
| SS3 | 0.32054 | ||||||
| SS4 | 0.32054 | ||||||
| WS | 0.18336 | WS1 | 0.013 | 4.034 | 0.48313 | ||
| WS2 | 0.08028 | ||||||
| WS3 | 0.22854 | ||||||
| WS4 | 0.20805 | ||||||
| OS | 0.37341 | OS1 | 0.063 | 3.066 | 0.72351 | ||
| OS2 | 0.19319 | ||||||
| OS3 | 0.08331 | ||||||
| TS | 0.34470 | TS1 | 0.028 | 4.074 | 0.21501 | ||
| TS2 | 0.57932 | ||||||
| TS3 | 0.13926 | ||||||
| TS4 | 0.06641 |
Table A4.
Analysis and consistency verification of weights aimed at experience.
| Criteria Layer | Consistency Check (CR) | Maximal Characteristic Root (λmax) | Weight of the Criterion Layer | Plan Layer | Consistency Check (CR) | Maximal Characteristic Root (λmax) | Weight of the Plan Layer |
|---|---|---|---|---|---|---|---|
| SE | 0.054 | 4.144 | 0.05903 | SE1 | 0.039 | 4.105 | 0.45602 |
| SE2 | 0.15223 | ||||||
| SE3 | 0.06796 | ||||||
| SE4 | 0.32379 | ||||||
| WE | 0.11266 | WE1 | 0.028 | 3.029 | 0.40548 | ||
| WE2 | 0.11496 | ||||||
| WE3 | 0.47956 | ||||||
| OE | 0.40772 | OE1 | 0.085 | 4.228 | 0.39380 | ||
| OE2 | 0.08239 | ||||||
| OE3 | 0.38189 | ||||||
| OE4 | 0.14192 | ||||||
| TE | 0.42059 | TE1 | 0.003 | 3.003 | 0.29236 | ||
| TE2 | 0.09262 | ||||||
| TE3 | 0.61502 |
Table A5.
Weight analysis and consistency check with benefit as the goal.
| Criteria Layer | Consistency Check (CR) | Maximal Characteristic Root (λmax) | Weight of the Criterion Layer | Plan Layer | Consistency Check (CR) | Maximal Characteristic Root (λmax) | Weight of the Plan Layer |
|---|---|---|---|---|---|---|---|
| SB | 0.085 | 4.226 | 0.10344 | SB1 | 0.068 | 4.181 | 0.44898 |
| SB2 | 0.12656 | ||||||
| SB3 | 0.10311 | ||||||
| SB4 | 0.32135 | ||||||
| WB | 0.12651 | WB1 | 0.063 | 3.066 | 0.08331 | ||
| WB2 | 0.19319 | ||||||
| WB3 | 0.72351 | ||||||
| OB | 0.50956 | OB1 | 0.000 | 3.000 | 0.25000 | ||
| OB2 | 0.50000 | ||||||
| OB3 | 0.25000 | ||||||
| TB | 0.26049 | TB1 | 0.058 | 4.156 | 0.09375 | ||
| TB2 | 0.09375 | ||||||
| TB3 | 0.21875 | ||||||
| TB4 | 0.59375 |
References
- Wang, S. Glacier Tourism Resources Spatial Development and Planning in China; Science Press: Beijing, China, 2015. [Google Scholar]
- Trude Furunes, R.J.M. Frozen Adventure at Risk? A 7-year Follow-up Study of Norwegian Glacier Tourism. Scand. J. Hosp. Tour. 2012, 12, 324–348. [Google Scholar] [CrossRef]
- Ming, Q.; Lu, B. On systematic strategies of glacier tourism development. J. Yunnan Norm. Univ. 2019, 51, 48–57. [Google Scholar]
- Zhang, L. Research on ice-snow tourism and cultural integration from the perspective of tourism culture industry. Acad. Exch. 2013, 235, 106–109. [Google Scholar]
- Zhang, Z.; Zhang, J.; Zhang, J. Realistic Difficulty and Optimized Path of Mass Ice and Snow Tourism in China. Sports Cult. Guide 2020, 2, 89–96. [Google Scholar]
- Han, Y. Promoting Beijing Winter Olympics Strategy with Mass Ice and Snow Tourism. Tour. Trib. 2020, 4, 9–11. [Google Scholar]
- Xu, S.; Zhang, D.; Cheng, L. The Development Features of Snow Tourism Industry in Europe and Its Inspirations for China. Northeast Asia Forum 2011, 98, 120–127. [Google Scholar]
- Wang, L. A Summary on the Ice-Snow Tourism Development and Research at Home and Abroad. Ecol. Econ. 2010, 3, 66–69. [Google Scholar]
- Liu, L.; Zhong, L.; Yu, H. Progress of glacier tourism research and implications. Prog. Geogr. 2019, 38, 533–545. [Google Scholar]
- Zhang, C.; Gao, W.; Wu, J.; Li, Z.; Xiong, D.; Zhang, P. Strategy of China’s CBM industry based on ANP-SWOT model. Resour. Sci. 2015, 6, 1207–1217. [Google Scholar]
- Lai, J.; Zhao, J.; Liu, F.; Yin, H.; Zhuo, X.; Zhao, X.; Zhang, H.; Gao, J.; Hu, J. Rural tourism development strategy based on swot analysis in mountainous tobacco growing area under the background of rural revitalization strategy*—A case study in yuanyang tobacco sci-tech demonstration area, wushan county. Chin. J. Agric. Resour. Reg. Plan. 2020, 4, 235–242. [Google Scholar]
- Navarro-Martínez, Z.M.; Crespo, C.M.; Hernández-Fernández, L.; Ferro-Azcona, H.; González-Díaz, S.P.; McLaughlin, R.J. Using SWOT analysis to support biodiversity and sustainable tourism in Caguanes National Park, Cuba. Ocean Coast. Manag. 2020, 193, 1–5. [Google Scholar] [CrossRef]
- Wang, F. Research on Development of Experiencing Tourism of Qiao’s Courtyard Based on ASEB Grid Analysis. J. Northwest Sci.-Tech. Univ. Agric. For. 2011, 11, 85–88. [Google Scholar]
- Song, N.; Cui, H.; Zhang, J.; Zhang, M. Study on promotion of tourism experience in Tengtou Village of Fenghua City of Ningbo based on web text and ASEB grid analysis. Acta Agric. Zhejiangensis 2019, 11, 1935–1944. [Google Scholar]
- Yan, M.; Zhao, Y. Research of Canal Heritage Tourism Development Based on the Network Text and ASEB Grid Analysis—A Case Study of Qingming Bridge Scenic Area in Wuxi. J. Nanjing Norm. Univ. 2016, 3, 124–129. [Google Scholar]
- Zheng, L.; Guo, Y.; Li, G. ASEB/ANP evaluation of rural tourism transformation—A case study of yalu river scenic zone. J. China Agric. Resour. Reg. Plan. 2019, 2, 181–187. [Google Scholar]
- Zhu, Y.; Gao, Y.; Yu, X. Cultural Heritage Tourism Development of Intangible Value in Central Tarim Area—Based on ASEB Grid Analysis. Resour. Dev. Mark. 2015, 10, 1264–1267. [Google Scholar]
- Ai, C.; Feng, F.; Li, J.; Liu, K. AHP Method of Subjective Group Decision-making Based on Interval Number Judgment Matrix and Fuzzy Clustering Analysis. Stat. Decis. 2019, 2, 39–43. [Google Scholar]
- Shu, H.; Liu, Z.; Pei, X. AHP-SWOT Analysis of China-Pakistan Economic Corridor under “the Belt and Road” Initiative. J. Intell. 2020, 3, 22–28. [Google Scholar]
- Shen, H.; Ma, G.; Yi, Z.; Yan, J. Study on Urban Renewal Strategy for Construction of Historical and Cultural Type of Metro Stations in Urban Central Districts of Major Cities Based on AHP-SWOT Analysis:A Case Study of Tianjin Heping Road Station. Areal Res. Dev. 2019, 6, 68–73. [Google Scholar]
- Liu, W.; Xue, Y. Film and Television Base Developing Strategic Choice Based on AHP -SWOT Model: Taking Xiangshan/Movie &TV Town as an Example. Econ. Probl. 2018, 12, 94–101. [Google Scholar]
- Escobar, A.L.; Rueda Lopez, R.; Garcia Guerrero, J.E.; Salinas Cuadrado, E. Design of Strategies for the Implementation and Management of a Complementary Monetary System Using the SWOT-AHP Methodology. Sustainability 2020, 12, 6849. [Google Scholar] [CrossRef]
- Wang, S.; Qi, C.; Zhou, L.; Ren, Q. Spatiotemporal characteristics and structural optimization of the tourist source market:A case study of Dagu Glacier as a tourist destination in a problem-based perspective. J. Yunnan Norm. Univ. 2019, 2, 58–67. [Google Scholar]
- Song, W.; Li, J.; Zhang, W. Research on tourism spatial layout of national geological park based on development suitability evaluation—Taking Yulong Snow Mountain Glacier National Geological Park as an example. In Proceedings of the 2017 China Urban Planning Annual Conference, Dongguan, Guangdong, China, 18 November 2017. [Google Scholar]
- Ma, X.; Wang, S.; Qiong, D.; Yang, Y.; Wei, Y.; Zhou, L. Strategies of deep developing the glacier tourism resources in China:a case study of the Midui Glacier, Tibet. J. Glaciol. Geocryol. 2019, 5, 1264–1270. [Google Scholar]
- Liu, X.; Yang, Z.; Xie, T. Development and Conservation of Glacier Tourist Resources—A Case Study of Bogda Glacier Park. Chin. Geogr. Sci. 2006, 4, 365–370. [Google Scholar] [CrossRef]
- Yan, Y.; Lian, L.; Lin, M.; Lu, B. Research on Tourist Products Based on ASEB Method—A Case Study in Meizhou Island, Fujian Province. Resour. Dev. Mark. 2009, 8, 757–759. [Google Scholar]
- Deng, X.; Yan, Y. Deep exploration of tourism products based on ASEB Grid Analysis—A case of Hohhot, Inner Mongolia. J. Arid Land Resour. Environ. 2012, 1, 128–134. [Google Scholar]
- Lynn, C.; Harrison, W.H. Practicing Responsible Tourism: International Case Studies in Tourism Planning, Policy and Development; Nankai University Press: Tianjin, China, 2003. [Google Scholar]
- Fang, F.; Liang, X.; Li, C.; Xiong, Z. Review of spatial multi-criteria decision making. Sci. Surv. Mapp. 2014, 7, 9–12. [Google Scholar]
- Zopounidis, C. Multicriteria classification and sorting methods: A literature review. Eur. J. Oper. Res. 2007, 138, 231–232. [Google Scholar] [CrossRef]
- Malczewski, J. GIS-based multicriteria decision analysis: A survey of the literature. Int. J. Geogr. Inf. Syst. 2006, 20, 703–726. [Google Scholar] [CrossRef]
- Palczewskia, K.; Sałabun, W. The fuzzy TOPSIS applications in the last decade. Procedia Comput. Sci. 2019, 159, 2294–2303. [Google Scholar] [CrossRef]
- Opricovic, S.; Tzeng, G.-H. Extended VIKOR method in comparison with outranking methods. Eur. J. Oper. Res. 2007, 178, 514–529. [Google Scholar] [CrossRef]
- Mishra, A.R.; Rani, P.; Pandey, K.; Mardani, A.; Streimikis, J.; Streimikiene, D.; Alrasheedi, M. Novel Multi-Criteria Intuitionistic Fuzzy SWARA–COPRAS Approach for Sustainability Evaluation of the Bioenergy Production Process. Sustainability 2020, 12, 4155. [Google Scholar] [CrossRef]
- Brans, J.P.; Vincke, P.; Mareschal, B. How to select and how to rank projects: The PROMETHEE method. Eur. J. Oper. Res. 1986, 24, 228–238. [Google Scholar] [CrossRef]
- Opricovoc, S.; Tzeng, G. Compromise solution by MCDM methods: A comparative analysis of VIKOR and TOPSIS. Eur. J. Oper. Res. 2004, 156, 445–455. [Google Scholar] [CrossRef]
- Sun, H.; Zhang, Q. Interval-valued Fuzzy VIKOR Method. Fuzzy Syst. Math. 2011, 25, 122–128. [Google Scholar]
- Sałabun, W.; Watróbski, J.; Shekhovtsov, A. Are MCDA Methods Benchmarkable? A Comparative Study of TOPSIS, VIKOR, COPRAS, and PROMETHEE II Methods. Symmetry 2020, 12, 1549. [Google Scholar] [CrossRef]
- Pamuar, D.; Boani, D.; Lukovac, V.; Komazec, N. Normalized weighted geometric bonferroni mean operator of interval rough numbers—Application in interval rough dematel-copras model. Facta Univ. Ser. Mech. Eng. 2018, 16, 171–191. [Google Scholar]
- Wang, Q.; Geng, X. Multi-attribute Group Decision-making Method of Evaluation Based on Hesitant Fuzzy COPRAS. Stat. Decis. 2019, 3, 45–49. [Google Scholar]
- Ren, J.; Gao, Y.; Wang, J.; Bian, C. PROMETHEE II Method for Stochastic Multi-criterion Decision-making Problems. Chin. J. Manag. 2009, 10, 1319–1322. [Google Scholar]
- Macharis, C.; Springael, J.; Brucker, K.D.; Verbeke, A. PROMETHEE and AHP: The design of operational synergies in multicriteria analysis.Strengthening PROMETHEE with ideas of AHP. Eur. J. Oper. Res. 2004, 153, 307–317. [Google Scholar] [CrossRef]
- Yu, W.; Zhu, Y. Research on the Development Strategy of Social Sports Specialty in Non-physical Education Colleges Based on the AHP-SWOT Analysis. J. Nanjing Inst. Phys. Educ. 2017, 3, 6–11. [Google Scholar]
- Li, Y.; Wu, H. The Factors Analysis and Construction of Patent Strategy Based on AHP-SWOT Method. J. Inf. 2010, 7, 40–44. [Google Scholar]
- Chen, J.; Hu, S. Study on Strategic Development of Petroleum Enterprises Based on AHP-SWOT Analysis. Academics 2016, 2, 308–313. [Google Scholar]
- Lian, F.; Xu, S. Introduction to Analytic Hierarchy Process; People’s University of China Press: Beijing, China, 1999. [Google Scholar]
- Wang, L.; Zhu, F. A Summary of Rank Reversal in AHP. Syst. Eng.-Theory Pract. 1994, 6, 1–6. [Google Scholar]
- Barzilai, J.; Golany, B. AHP rank reversal, normalization and aggregation rules. INFOR 1994, 32, 57–63. [Google Scholar] [CrossRef]
- Zahir, S. Normalization and rank Reversals in the Additive Analytic Hierarchy Process: A New Analysis. Int. J. Oper. Res. 2009, 4, 446–467. [Google Scholar] [CrossRef]
- Yu, L.; Ding, R. The new method to avoid the rank reversal in AHP. Syst. Eng. 2000, 6, 71–74. [Google Scholar]
- Belton, V.; Gear, T. On a shortcoming of Saaty’s method of analytic hierarchies. Omega 1983, 11, 228–230. [Google Scholar] [CrossRef]
- Xu, J. Mathematical Methods in Contemporary Geography; Higher Education Press: Beijing, China, 2017. [Google Scholar]
- Zhou, Z.; Huang, Q.; Sun, J. Quantitative Methods of Information I can recommend; Nanjing University Press: Nanjing, China, 1992. [Google Scholar]
- Liu, H. The Evaluation of government performance Based on the Analytic Network Processs. Sci. Sci. Manag. S. T. 2006, 6, 111–115. [Google Scholar]
- Huang, B.; Peng, Y. R&D Project Selection Using the Analytic Network Process. Sci. Sci. Manag. S. T. 2003, 2, 5–7. [Google Scholar]
- Wen, L.; Lu, J.; Yang, M. Ways to Improve International Competitiveness of China’s Cross-border E-commerce Logistics Enterprises: Research Based on ANP-TOPSIS Model. Econ. Probl. 2019, 9, 45–52. [Google Scholar]
- Zeng, D.; Wu, J.; Mu, Y.; Li, H.; Deng, M.; Wei, Y.; Sun, W. An Assessment of Tourism Climate Comfort in the China–Pakistan Economic Corrido. Sustainability 2020, 12, 6981. [Google Scholar] [CrossRef]
- Zhang, Y.; Chen, X.; Yu, R.; Cheng, J.; Yu, X. The logic transformation of the scenic byway system to the linear experience space transformation. J. Nat. Resour. 2020, 2, 284–296. [Google Scholar]
- Xie, H.; Yang, Z. On the Phenomena and Cognition of the“Body”in the Research of Tourism Experience. Tour. Trib. 2020, 7, 117–132. [Google Scholar]
Figure 1.
Location of the Dagu Glacier Scenic Spot (DGSS).

Figure 2.
Analytic hierarchy process (AHP)–ASEB hierarchical model of ice and snow tourism development in the Dagu Scenic Area.
Figure 2.
Analytic hierarchy process (AHP)–ASEB hierarchical model of ice and snow tourism development in the Dagu Scenic Area.

Table 1.
Natural landscape resources in the Dagu Glacier Scenic Area.
| Type | Term | Content |
|---|---|---|
| the landscape of the sky | fog | cloud sea |
| snow wonders | snow sculptures and glaze | |
| landscape of the ground | large-scale topography | steep arch snow mountain |
| mountain scenery | knife-edge crest | |
| marvelous peaks | glacier angle peak | |
| geological landscape | roche moutonnée | |
| water landscape | rivers | Dagu river |
| waterfall | Ling Yun falls | |
| plateau lakes | Dagu lake | |
| glacier | glacier no. 1 | |
| biology and plants | wildwood | immense forest |
| climate | golden autumn charm | |
| plant ecology | rose willow beach | |
| animal community habitat | habitat of Tibetan macaque |
Table 2.
Activity, setting, experience and benefit (ASEB) grid analysis matrix.
| Activity (A) | Setting (S) | Experience (E) | Benefit (B) | |
|---|---|---|---|---|
| Strengths (S) | SA | SS | SE | SB |
| Weaknesses (W) | WA | WS | WE | WB |
| Opportunities (O) | OA | OS | OE | OB |
| Threats (T) | TA | TS | TE | TB |
Table 3.
The weight ranking of the secondary target to the total target.
| Scheme Layer | Weight of the Scheme Layer | Weight of the Scheme Layer to the Total Target |
|---|---|---|
| OB | 0.50956 | 0.20330 |
| TE | 0.42059 | 0.15121 |
| OE | 0.40772 | 0.14658 |
| TB | 0.26049 | 0.10393 |
| OS | 0.37341 | 0.06432 |
| TS | 0.34470 | 0.05937 |
| WB | 0.12651 | 0.05047 |
| SB | 0.10344 | 0.04127 |
| WE | 0.11266 | 0.04050 |
| WS | 0.18336 | 0.03158 |
| OA | 0.39229 | 0.02717 |
| TA | 0.36034 | 0.02496 |
| SE | 0.05903 | 0.02122 |
| SS | 0.09852 | 0.01697 |
| WA | 0.17159 | 0.01189 |
| SA | 0.07578 | 0.00525 |
Table 4.
The ranking of weight of scheme layer to sub-goals.
| Scheme Layer | Weight of the Scheme Layer | Weight of the Scheme Layer to Sub-Goals | Scheme Layer | Weight of the Scheme Layer | Weight of the Scheme Layer to Sub-Goals |
|---|---|---|---|---|---|
| TA1 | 0.63335 | 0.22822 | OS1 | 0.72351 | 0.27017 |
| OA1 | 0.45455 | 0.17832 | TS2 | 0.57932 | 0.19969 |
| OA2 | 0.45455 | 0.17832 | WS1 | 0.48313 | 0.08859 |
| TA2 | 0.26050 | 0.09387 | TS1 | 0.21501 | 0.07411 |
| WA1 | 0.52468 | 0.09003 | OS2 | 0.19319 | 0.07214 |
| WA3 | 0.33377 | 0.05727 | TS3 | 0.13926 | 0.04800 |
| SA1 | 0.75000 | 0.05684 | WS3 | 0.22854 | 0.04191 |
| TA3 | 0.10616 | 0.03825 | WS4 | 0.20805 | 0.03815 |
| OA3 | 0.09091 | 0.03566 | SS3 | 0.32054 | 0.03158 |
| WA2 | 0.14156 | 0.02429 | SS4 | 0.32054 | 0.03158 |
| SA2 | 0.25000 | 0.01895 | OS3 | 0.08331 | 0.03111 |
| WS2 | 0.08028 | 0.01472 | SS1 | 0.28482 | 0.02806 |
| SS2 | 0.07411 | 0.00730 | TS4 | 0.06641 | 0.02289 |
| TE3 | 0.61502 | 0.25867 | OB2 | 0.50000 | 0.25478 |
| OE1 | 0.39380 | 0.16056 | TB4 | 0.59375 | 0.15467 |
| OE3 | 0.38189 | 0.15570 | OB1 | 0.25000 | 0.12739 |
| TE1 | 0.29236 | 0.12296 | OB3 | 0.25000 | 0.12739 |
| OE4 | 0.14192 | 0.05786 | WB3 | 0.72351 | 0.09153 |
| WE3 | 0.47956 | 0.05403 | TB3 | 0.21875 | 0.05698 |
| WE1 | 0.40548 | 0.04568 | SB1 | 0.44898 | 0.04644 |
| TE2 | 0.09262 | 0.03896 | SB4 | 0.32135 | 0.03324 |
| OE2 | 0.08239 | 0.03359 | WB2 | 0.19319 | 0.02444 |
| SE1 | 0.45602 | 0.02692 | TB1 | 0.09375 | 0.02442 |
| SE4 | 0.32379 | 0.01911 | TB2 | 0.09375 | 0.02442 |
| WE2 | 0.11496 | 0.01295 | SB2 | 0.12656 | 0.01309 |
| SE2 | 0.15223 | 0.00899 | SB3 | 0.10311 | 0.01067 |
| SE3 | 0.06796 | 0.00401 | WB1 | 0.08331 | 0.01054 |
Table 5.
The weight ranking of the bottom schemes of ASEB grouping to the highest target.
| Group | Underlying Scheme | Weight of the Underlying Scheme | Weight of the Criterion Layer of Sub-Goal | Weight of the Total Goal | Weight of the Underlying Scheme to Total Goal |
|---|---|---|---|---|---|
| A | TA1 | 0.63335 | 0.36034 | 0.06927 | 0.01581 |
| A | OA2 | 0.45455 | 0.39229 | 0.06927 | 0.01235 |
| A | OA1 | 0.45455 | 0.39229 | 0.06927 | 0.01235 |
| S | OS1 | 0.72351 | 0.37341 | 0.17224 | 0.04653 |
| S | TS2 | 0.57932 | 0.34470 | 0.17224 | 0.03439 |
| S | WS1 | 0.48313 | 0.18336 | 0.17224 | 0.01526 |
| E | TE3 | 0.61502 | 0.42059 | 0.35951 | 0.09299 |
| E | OE1 | 0.39380 | 0.40772 | 0.35951 | 0.05772 |
| E | OE3 | 0.38189 | 0.40772 | 0.35951 | 0.05598 |
| E | TE1 | 0.29236 | 0.42059 | 0.35951 | 0.04421 |
| E | OE4 | 0.14192 | 0.40772 | 0.35951 | 0.02080 |
| B | OB2 | 0.50000 | 0.50956 | 0.39898 | 0.10165 |
| B | TB4 | 0.59375 | 0.26049 | 0.39898 | 0.06171 |
| B | OB3 | 0.25000 | 0.50956 | 0.39898 | 0.05083 |
| B | OB1 | 0.25000 | 0.50956 | 0.39898 | 0.05083 |
| B | WB3 | 0.72351 | 0.12651 | 0.39898 | 0.03652 |
Publisher’s Note: MDPI stays neutral with regard to jurisdictional claims in published maps and institutional affiliations. |
© 2021 by the authors. Licensee MDPI, Basel, Switzerland. This article is an open access article distributed under the terms and conditions of the Creative Commons Attribution (CC BY) license (http://creativecommons.org/licenses/by/4.0/).
Share and Cite
MDPI and ACS Style
Sun, W.; Zhang, F.; Tai, S.; Wu, J.; Mu, Y. Study on Glacial Tourism Exploitation in the Dagu Glacier Scenic Spot Based on the AHP–ASEB Method. Sustainability 2021, 13, 2614. https://0-doi-org.brum.beds.ac.uk/10.3390/su13052614
AMA Style
Sun W, Zhang F, Tai S, Wu J, Mu Y. Study on Glacial Tourism Exploitation in the Dagu Glacier Scenic Spot Based on the AHP–ASEB Method. Sustainability. 2021; 13(5):2614. https://0-doi-org.brum.beds.ac.uk/10.3390/su13052614
Chicago/Turabian StyleSun, Weibing, Fu Zhang, Shuya Tai, Jinkui Wu, and Yaqiong Mu. 2021. "Study on Glacial Tourism Exploitation in the Dagu Glacier Scenic Spot Based on the AHP–ASEB Method" Sustainability 13, no. 5: 2614. https://0-doi-org.brum.beds.ac.uk/10.3390/su13052614
Note that from the first issue of 2016, this journal uses article numbers instead of page numbers. See further details here.