Article

Activation of Nano Kaolin Clay for Bio-Glycerol Conversion to a Valuable Fuel Additive

1
HICoE—Center for Biofuel and Biochemical Research, Institute of Self-Sustainable Building, Department of Chemical Engineering, Universiti Teknologi PETRONAS, Seri Iskandar 32610, Perak, Malaysia
2
School of Mechanical, Aerospace and Automotive Engineering, Faculty of Engineering, Environmental and Computing, Coventry University, Coventry CV1 5FB, UK
*
Author to whom correspondence should be addressed.
Sustainability 2021, 13(5), 2631; https://0-doi-org.brum.beds.ac.uk/10.3390/su13052631
Submission received: 16 December 2020 / Revised: 19 January 2021 / Accepted: 20 January 2021 / Published: 1 March 2021
(This article belongs to the Special Issue Hybrid Energy System)

Abstract

:
High production of biodiesel results in a surplus of glycerol as a byproduct that leads to a drastic decline in the glycerol price as well as overall biodiesel production. Alternative methods must be introduced for the economical process for biodiesel production via utilization of crude glycerol into valuable chemicals or fuel additives. This study introduces an ecofriendly process of solketal synthesis from glycerol and acetone in the presence of a novel metakaolin clay catalyst, which is a useful additive in biodiesel or gasoline, in order to enhance the octane number and to control the emissions. Moreover, kaolin clay catalysts are low cost, abundantly available, eco-friendly and one of the more promising applications for solketal synthesis. In this study, raw kaolin clay was activated with an easy acid activation technique, modification in physicochemical and textural properties were determined by using X-ray diffraction (XRD), Fourier Transform Infra-Red (FTIR) spectroscopy, Brunauer–Emmett–Teller (BET) and Field Emission Scanning Electron Microscope. Among all acid-treated catalysts, metakaolin K3 have shown best catalytic properties, high surface area and pore size after acid activation with 3.0 mol/dm3 at 98 °C for 3 h. Acetalization of glycerol with acetone carried out in the presence of an environmentally friendly and inexpensive novel metakaolin K3 catalyst. The maximum yield of solketal obtained was 84% at a temperature of 50 °C, acetone/glycerol molar ratio 6/1 and for 90 min with novel metakaolin clay catalyst. Effect of various parameters (time, temperature, acetone/glycerol molar ratio, catalyst loading) on the solketal yield and glycerol conversion was discussed in detail. This approach offers an effective way to transform glycerol into solketal—a desirable green chemical with future industrial applications.

1. Introduction

Natural gas, petroleum and their derivatives are fuels that make it possible to provide efficient and faster means of transportation, as well as play a significant role in manufacturing [1]. Though they may not survive more than a few decades as their supplies are limited, and their usage is the primary source of CO2, gas correlated with global warming and climate change diverges attention towards alternative fuels [2,3]. Global production of biodiesel has improved in recent years of growing competition for green sustainable or renewable energy, and biodiesel produces approximately 10% of glycerol as a byproduct [4]. Global production of glycerol has been estimated to increase from 5 million tons in 2005 to 36 million tons in 2020 [5]. It is imperative to find some applications of glycerol into a useful product and valuable chemicals. Several efforts have been made to transform glycerol into environmentally friendly products and many feasible synthetic pathways have been identified, such as hydrogenolysis [6], esterification [7,8], carbonation [9], oxidation [10], etherification [11], and either aldehyde or ketone acetalization [12].
Glycerol acetalization is a promising application and is commercially feasible for the use of glycerol [13]. During the process of acetalization, glycerol reacts with ketones or aldehydes in the presence of an acidic catalyst to form a five-ring ketal (solketal) and six-ring ketal [14]. Solketal is an odorless and colorless liquid, stable at room temperature and fully soluble in water. It is widely used as a fuel additive to increase the octane number and control the gum formation when added in gasoline. Moreover, it reduces the corrosion, particulate emission and improves oxidation stability [15]. It is used as a versatile solvent in pharmaceutical preparations and for cleaning various substrates (plastic, metallic and electrical) [16]. Previously, ketalization was carried out with homogenous catalysts (H2SO4, HCl, HF and p-toluene sulphonic acid), but this process has some serious shortcomings, such as environmental and economic concerns for the disposal of effluent and corrosion. The usage of heterogeneous catalysts (Amberlyst-15, Amberlyst-36, montmorillonite K-10, zeolites and silica-supported heteropoly catalysts) has the benefits of resolving these drawbacks. The acetalization of glycerol with acetone carried out in the presence of a heterogeneous catalyst results in heterocyclic compounds mixture, solketal (2,2-dimethyl-1,3-dioxolane-4-methanol) and six-ring ketals (2,2-dimethyl-1,3-dioxan-5-ol) as shown in Figure 1 [17].
Generally, the solketal yield depends on the surface acidity of catalysts [18]. Compared to our previous research, clay catalysts are versatile materials and the catalytic properties of clay catalyst (montmorillonite, kaolin and meta kaolin) may be modified by varying the concentration of acid [19,20]. Previously used clay catalysts have shown low thermal stability, hindrance in regeneration, low glycerol conversion and long reaction time in previous findings [21]. These limitations motivate researchers to use another eco-friendly clay catalyst and resolve these issues. Consequently, the kaolin catalyst Bronsted’s acidity increased during the formation of octahydro-2H-chromen-4-ol in Prinz cyclization of isopulegol with vanillin [22]. Kaolin is most frequently found in clay and generally mined in Malaysia due to its plentiful abundance, resulting in a significant quantity of industrial kaolin waste during the kaolin production process [23]. It has few impurities and is classified as natural clay, as it can be easily found near its source, and is the main feedstock used to produce porcelain.
In this work, a natural kaolin clay purchased from Kaolin (Malaysia) Sdn. Bhd. located in Malaysia (Negeri Perak) and their catalyst activity enhanced by treating with HCl acid. Acid-activated metakaolin clay was investigated as a novel catalyst for the first time in the synthesis of solketal. The literature showed kaolin catalysts is eco-friendly in nature, abundantly available, low cost, regeneratable and acidity can be improved by acid activation. However, the research on kaolin clay catalysts is very restricted, which has prompted us to investigate the impact of the surface acidity in this reaction, as the acetalization of glycerol requires acid catalysts. In addition, the influence of the concentration of acid on the surface acidity, the textural properties and the catalytic activity of kaolin clay was observed in this study. Physicochemical properties and their impact on the rate of reaction and yield of solketal were discussed. Improved catalyst activity of novel catalysts metakaolin results in high glycerol conversion and yield in solvent-free conditions. Notably, the process is ecofriendly and non-corrosive, perhaps promising green catalysts for the glycerol acetalization process.

2. Experimental

2.1. Materials

Glycerol (99.5%), acetone (≥99.5% for analysis) and HCl (ACS reagent 37%) were purchased from Sigma Aldrich. The natural clay was chemically hydrated aluminum silicate kaolin bought from the Kaolin (Malaysia) Sdn. Bhd their bed located in Perak, Malaysia. The properties of raw kaolin were shown in Table 1.

2.2. Methodology

2.2.1. Activation of Kaolin Clay

The kaolin was calcined in protherm furnace at 650 °C for 4 h to improve the physical properties (altering the shape and size), increase the hardness and whiteness of the clay and electrical properties of the raw clay to form the required metakaolin. For acid treatment, 4 g of kaolin clay was suspended in 200 cm3 of 1.0–7.0 mol/dm3 (1 M, 3 M, 5 M and 7 M) HCl aqueous solution. The mixture was heated at 98 °C for 3 h with constant stirring. Then, the prepared metakaolin clay catalysts (K1, K3, K5 and K7) were filtered and washed with deionized water to achieved required pH. Then, after separation, clay catalysts were dried at 100 °C for 60 min in a drying oven to remove the moisture contents.

2.2.2. Catalyst Characterization

FTIR

FTIR is a commonly used vibrational spectroscopic technique. FTIR can achieve an infrared spectrum in a wide variety of wave numbers simultaneously by using the Fourier transform technique. A Thermo Scientific Nicolet Is5 FTIR Spectrometer was equipped with EZ OMNIC software with Infrared spectra λ = 400 to 4000 cm−1 to study the decomposition in the functional group analysis of the raw kaolin and activated kaolin clay [24]. The sample of clay powder was placed on the cleaned platform, and the sample detector was calibrated to contact the surface of the catalyst. From the typical peaks of the FTIR absorption spectra, estimation on the specific functional group was indicated.

XRD

A Philips X’ Pert MPD X-ray diffractometer instrument was used to determine the mineralogical composition of raw Kaolin [25]. XRD analysis of activated clay catalysts was conducted by using monochromatic Cu-Kα radiation (operation modes: λ = 0.154 nm, 5–60° 2 θ range, 0.05° step size, 2.995 s step time). The obtained X-ray diffraction patterns were analyzed by using data from Joint Committee on Powder Diffraction Standards (JCPDS) files as reference to determine the metal oxides present on the catalysts. The XRD study determined the presence of kaolinite, quartz and a small quantity of illite phase in the kaolin powder.

FESEM

The fresh kaolin and the impact of acid activation on the morphology of kaolin clay was studied by Field Emission Scanning Electron Microscope (FESEM). The change in the structure of the catalyst was observed by SUPRA 55VP FESEM [26].

Brunauer-Emmett-Teller Isotherm (BET)

The Micromeritics ASAP-2010 instrument was used to BET analysis at a temperature of −196 °C for liquid N2. Catalyst physical properties (surface area and pore analysis) were determined by the physisorption of gas molecules. The clay samples were degassed by nitrogen flow for 24 h at 300 °C prior to the study to eliminate impurities and moisture on the surface of catalyst. The surface area was calculated from the adsorption isotherm while pore size and pore volume were determined from the desorption isotherm of BJH (Barret-Joyner-Halenda) [27]. All characterizations of prepared catalysts and product took place in the Central Analytical Laboratory, UTP.

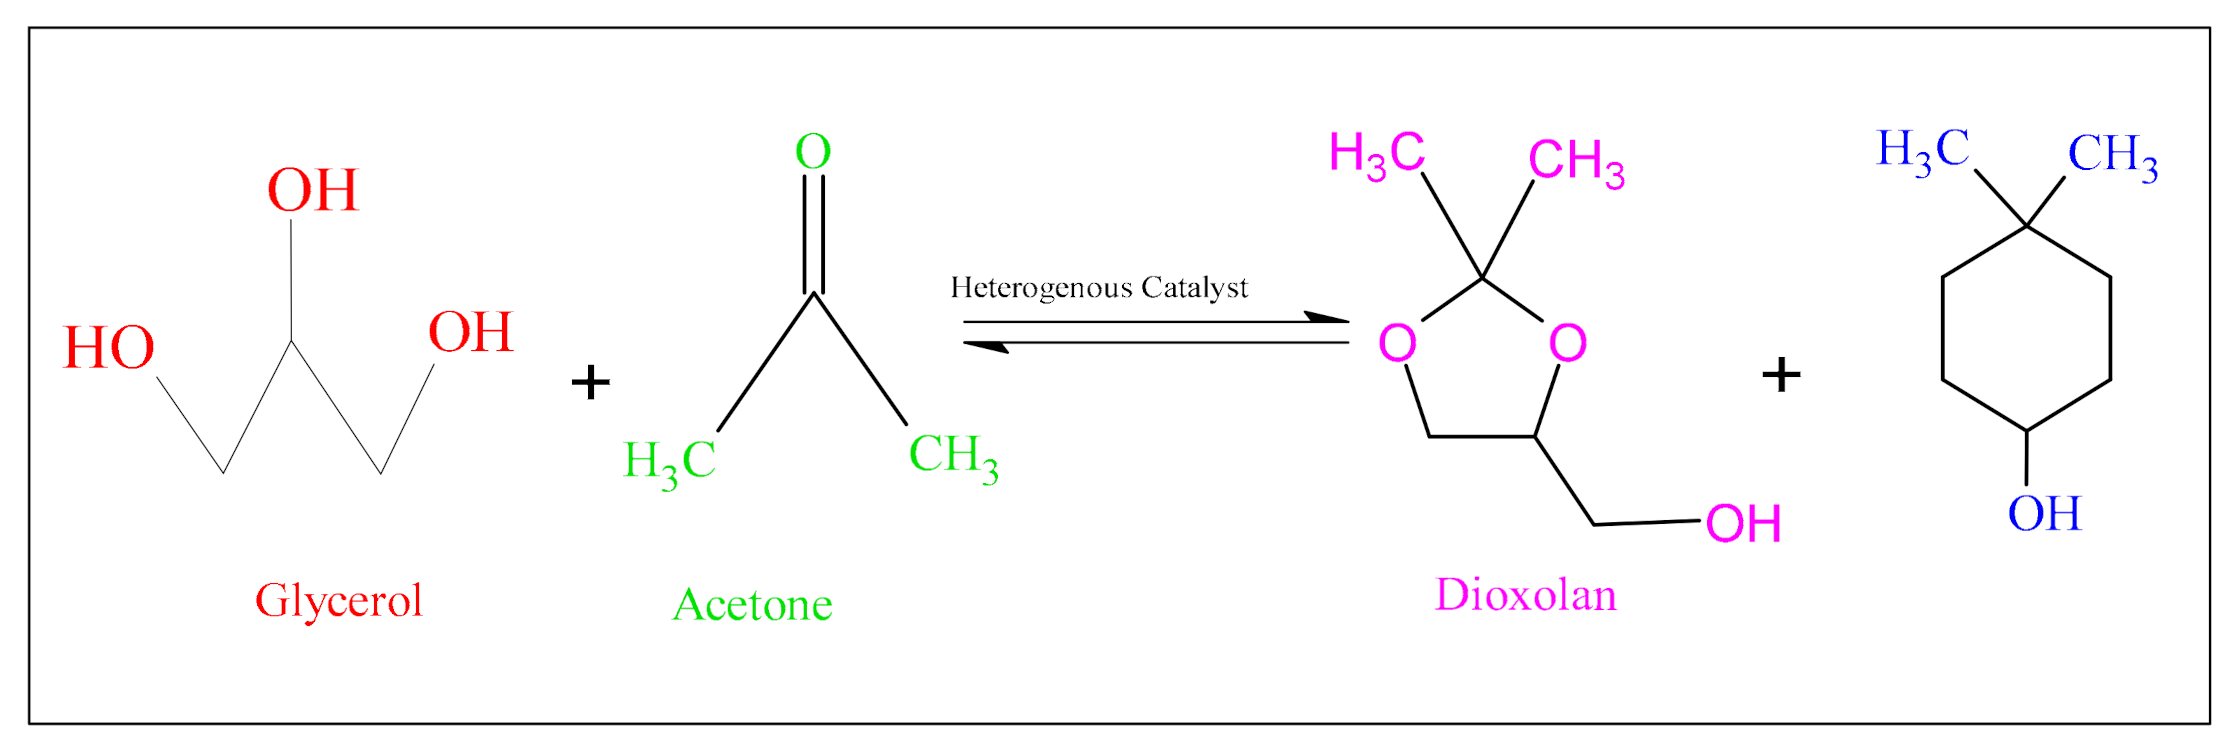
2.2.3. Synthesis and Analysis of Solketal

The general procedure was as follows: glycerol, acetone and catalyst were added in the three-neck glass flask consist of reflux condenser and magnetic stirrer. Aliquots were taken at various time intervals, separated from the catalyst by centrifugation and analyzed. The reactor setup is shown in Figure 2.
The reaction procedure was as follows: glycerol 0.108 mmol (10.01 g), acetone 0.648 mmol (38.10 g) and catalyst loading 0.48 g (1 wt.% of the total mixture) were added in the three-neck glass flask consist of reflux condenser and magnetic stirrer. Reaction condition was the following: acetone/glycerol ratio 6/1, time 60 min and temp 50 °C in the presence of acid-activated metakaolin catalysts. The reaction was carried out in solvent-free conditions at an atmospheric pressure and stirring speed was 500 rpm in all experiments. Aliquots were taken at various time intervals, separated from the catalyst by centrifugation and analyzed by gas chromatography–mass spectrometric. The yield of solketal and conversion of glycerol were calculated by using Equations (1) and (2), [28].
S o l k e t a l   y i e l d % = m o l e s   o f   p r o d u c e d   s o l k e t a l i n i t i a l   m o l e s   o f   g l y c e r o l × 100
G l y c e r o l   C o n v e r s i o n % = m o l e s   o f   g l y c e r o l   r e a c t e d m o l e s   o f   g l y c e r o l   t a k e n   × 100
The components present in higher amount in the product were identified by using a gas chromatograph, equipped with a mass selective detector (Varian 1200 Quadrupole GC/MS (EI), Varian CP-3800 GC equipped with VF-5 MS column (30 m × 0.25 mm × 0.25 μm) and He (helium) was used as a carrier gas. The oven temperature was constantly maintained for 2 min at the temperature of 120 °C, after that it was raised to 200 °C with the increasing rate of 40 °C/min. Injector and detector block temperature was constantly kept at 300 °C [29]. The component identification and yield of solketal were calculated by using the NIST 14 MS library.

3. Results and Discussion

3.1. Surface Chemistry Analysis

The unreacted kaolin and acid-treated metakaolin clay samples FTIR analysis is shown in Figure 3. The raw kaolin RK showed high peak intensities which refers to the high moisture content in the clay [28]. After the acid activation process, a change in peak intensities was observed due to structural disorder in the activated sample (K1, K3, K5 and K7) as shown in Figure 3. In O-H stretching, raw kaolin RK and acid-activated metakaolin showed three prominent bands at region 3696, 3653 and 3620 cm−1 which assigned to AL-OH stretching. As clay is activated with acid the peaks intensity decreases in IR spectra of K1, K3, K5 and K7 with an increase in the acid concentration. A band at 3653 cm−1 showed the weak absorption correspond to out-of-plane stretching vibrations and the strong band showed phase symmetrical stretching such as band 3696 cm−1 [30]. The broad band in activated clay represents a small amount of water. The absorption band at 3620 cm−1 showed the hydroxyl groups present between the tetrahedral and octahedral layer. At higher concentrations, the samples K5 and K7 showed extreme weak bands, which represents the proton penetration, which results in dihydroxylation of the structure and leaching of the Al ion (Figure 3). The intense peak at 1634 cm−1 in the bending region corresponds to water adsorbed on the free silica surface. Other IR peaks at 1073, 914, 795 and 754 cm−1 attributes to Si-O, Al–Al–OH, Al–Mg–OH and Si–O–Al vibration in sheets of clay [31].
It was noted that overlapping of band 795 cm−1 with a band at 800 cm−1 represents the presence of unaltered quartz or free silica in the sample. Moreover, the band at 700 cm−1 and 474 cm−1 corresponds to the Si-O and Si-O-Al vibrations. In addition, the band are observed in the kaolinite spectrum 940 cm−1 which attribute to the inner hydroxyl bending of the surface hydroxyl group. In K5 and K7 clay samples, the 914 cm−1 peak intensity reduced due to the dealumination process that occurred during acid activation by increasing the concentration of acid (more than 3 M). Noteworthy, the intense peaks between 1000 and 1120 cm−1 regions reveal the Si-O bond stretching in the raw kaolin RK. However, after activation, the peak diminished and decrease in peaks of the acid-activated clay as shown in Figure 4 which represents the change in tetrahedral cations and changes in chemical composition. In activated samples, K3, K5 and K7 bands at 500–400 cm−1 attributes to the Si-O and Si-O-Al stretching [32]. It was notable that in Figure 3 the comparison of raw and activated samples represents the existence of a structural disorder during the acid treatment process with heavy hydrochloric acid, which consequently disturbed the crystalline character of the kaolin clays. And after activation K7 showed lowest band intensity due to the least volume of water physiosorbed on the surface of the metakaolin clay. Additionally, the unaltered and unshifted band intensities for other activated metakaolin clay show the well-preserved structural and functional surface of the catalysts following acid treatment with a high concentration of hydrochloric acid.

3.2. Morphology of Raw Kaolin and Acid Activated Metakaolin

The raw kaolin and effect of acid activation on the morphology of metakaolin clay were examined with a Field emission scanning electron microscope (FESEM). The raw kaolin reveals the piles of long flaky-like structure while having a rough surface. This is because the powder has a natural composition that causes various shapes and sizes which might adjust according to the preparation of the process [33]. The kaolin structure consists of sheets with visible edges of the pseudohexagonal habitus, which, when piled together, forms a smooth surface [34]. However, after acid activation, the sheets broken into smaller irregular parts with rough edges and the surface become presumably imperfect due to defects in the surface. The acid treatment results in the deformation of kaolinite sheets and filled the surface gaps [35,36]. Figure 4 shows that acid-activated metakaolin has a different morphology than the parent kaolin [37]. Moreover, the micrograph of raw kaolin showed the structure consists of large size particles, the formation of agglomerates due to a stacked needle-like structure which causes poor dispersion of particles [38]. After acid activation, the morphological differences are apparent at high magnification. In the activated metakaolin micrograph showed the small particles and well-bonded aggregates rather than scattered particles [27]. There was minor particle dispersion in the activated K1 sample into the plate-like shaped particle. However, the particle size appeared in the K1 sample micrograph was larger than other metakaolin samples which may indicate the presence of blocky kaolinite agglomerates.
As shown in Figure 4, the small particles scattered after the acid treatment process and formed plate-like filaments in the K3 metakaolin sample. However, the morphology of the acid-activated metakaolin clays was partially seen by the presence of various paper sizes. As compared to other samples, the K3 clay sample had a smoother base and more uniform edges and the flakes were more easily exfoliated than other acid-activated samples which tended to have higher crystallization characteristics [39]. Meanwhile, the K5 sample has shown the similar structure of large plates and their stacks in the micrograph. However, there was a significant increase in needle-like structures at high acid concentration. In the K7 FESEM micrograph, the stacks of spherical particles start appearing in the acid-activated metakaolin clay. Figure 4 demonstrates the phenomenon of flake-like particle agglomeration and they stacked together to form large molecules which hinder the acetalization reaction. Metakaolin samples had retained a similar habit, but they showed a small inclination in plate-like structure and appearance of a needle or fiber-shaped particles in the micrograph [40].

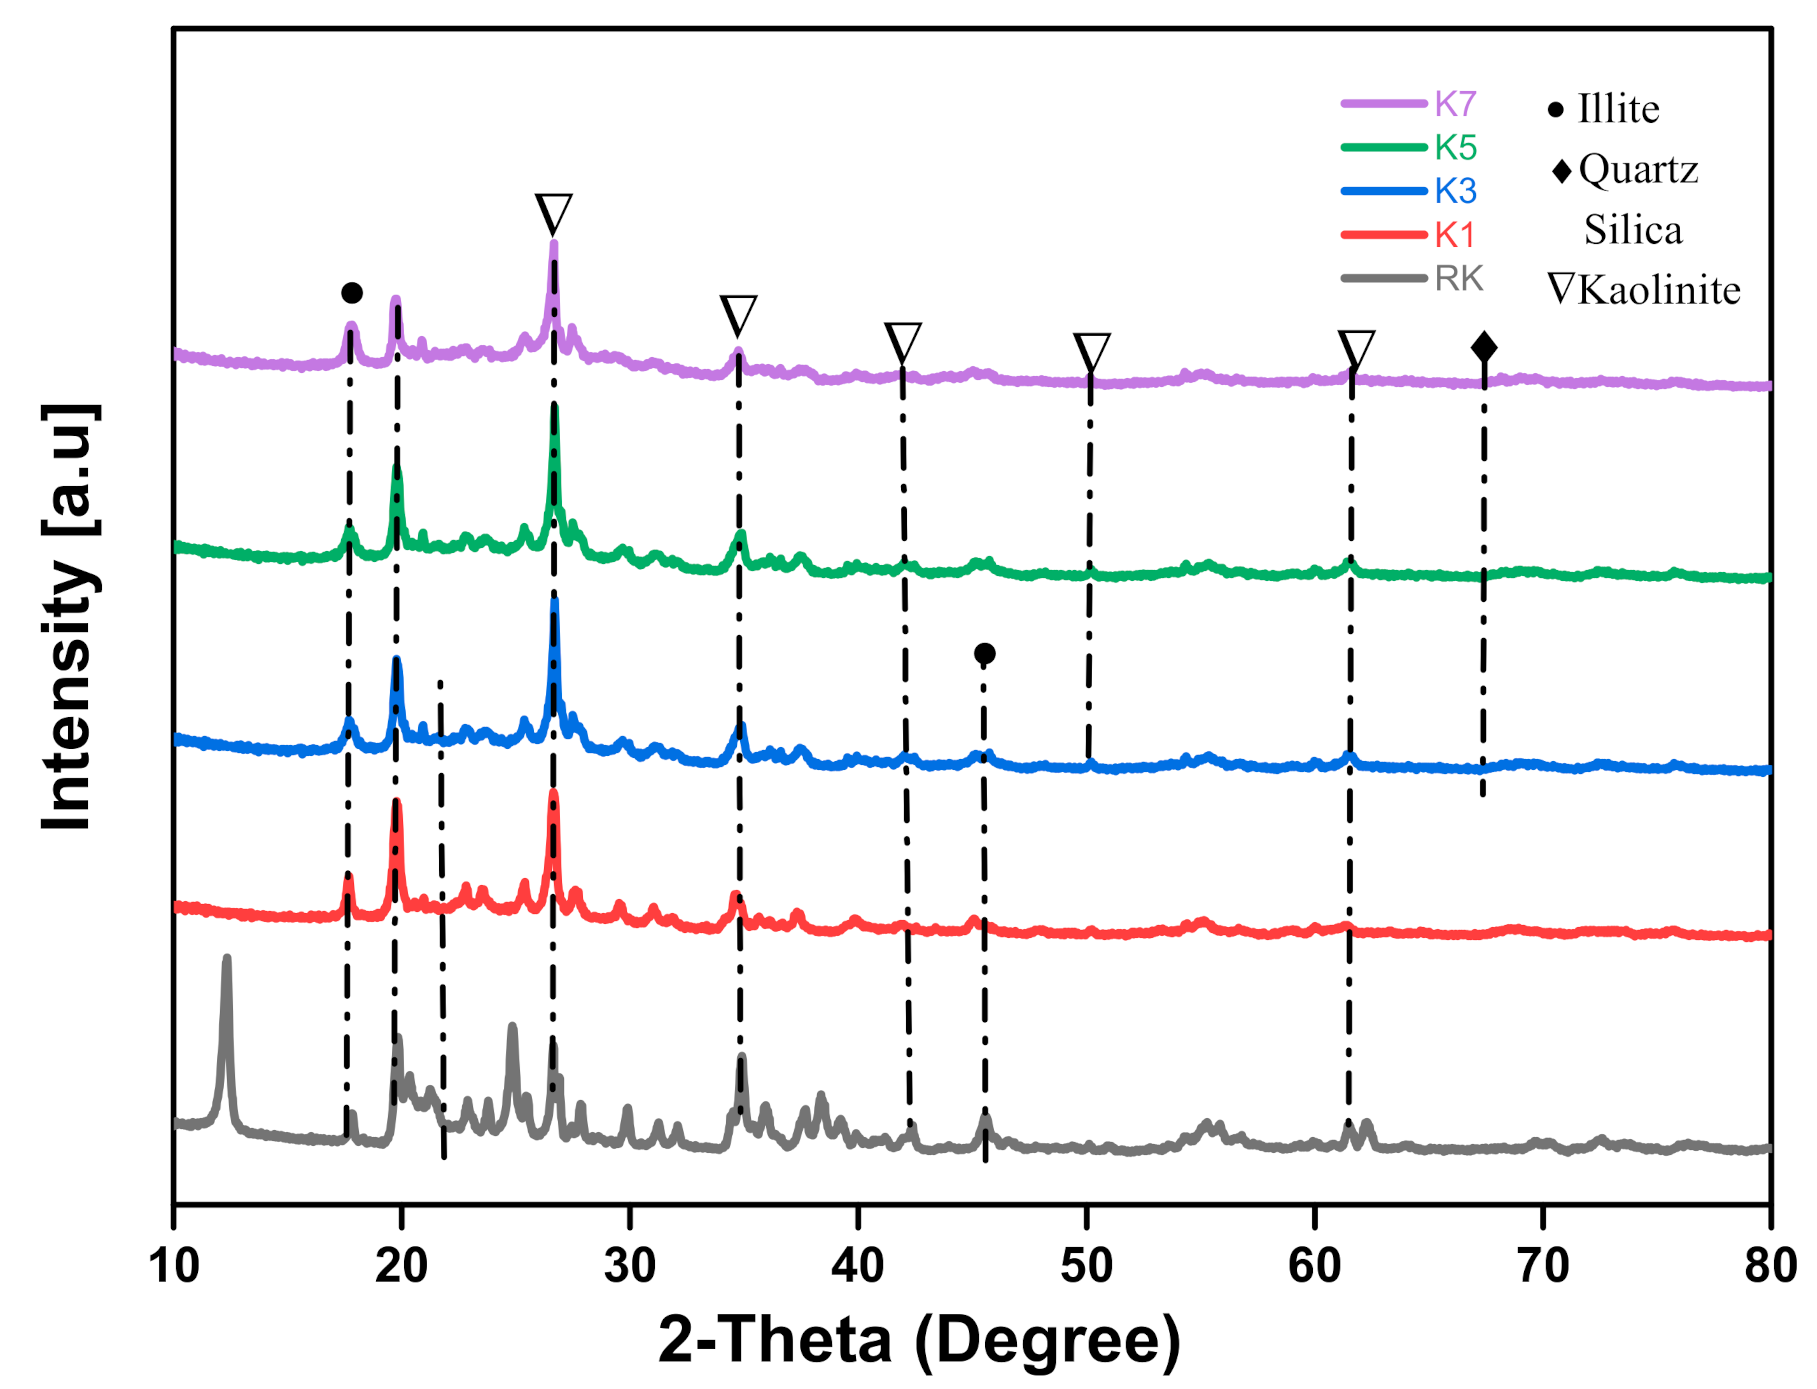
3.3. Mineral Composition

The Kaolin structure is hydrous aluminosilicate that is composed of an octahedral and tetrahedral layer (1:1), with basal spacing d (001) of 7.15 Å and neural structure. The structural improvements that occurred in the clay content after treatment with acid or alkali were analyzed using an X-ray diffraction technique. Figure 5 shows the XRD graph of raw kaolin, various acid-activated samples and the crystalline phases of the kaolin clays consist of four types of phases, namely silica, kaolinite, quartz and illite. In fact, these peaks are associated with the standard characteristic peaks of kaolinite, the reflections of (0 0 1) [36]. As stated by Kuentag [41], Nuntiya and Prasanphan [36], the majority of the peaks can be accounted for by kaolin minerals; the high peaks at 7.14, 3.57 and 1.49 A are equal to kaolinite d001, d002 and d060, and the peaks at 4.45, 2.56, 2.49, 2.34, 1.99, 1.66 and 1.49 are all compatible with kaolinite. After acid activation of the kaolin clay, the peaks’ intensity was observed to steadily decrease and structural disorder occurred which affects the crystalline structure of clay as shown in Figure 5. Due to structural disorder, many peaks disappeared after the acid activation of clay catalyst. In addition, the peaks reported between the 34 and 36°, 38 and 42°, 45 and 50° and 54 and 63° ranges also apply to the kaolinite phases of the samples [42]. The occurrence of amorphous silica in kaolin clay samples can be explained by the presence of humps, peaks or large bands within the range of 15–25°.
Meanwhile, the peak observed in the X-ray diffractograms at the 2 θ range above than 66° represents the quartz phase and 2 θ range less than 15° reflects the presence of illite phase [27]. As seen in Figure 5, alternation occurs in the peaks of the catalysts after acid activation. At low acid concentration, the reflections of the inactive kaolin became smaller (K1 and K3 M) and the index of the two kaolinites improved to 0.7. The reduction in the peak height was due to a decrease in the mean lattice strain/increase in crystalline size [40]. This phenomenon was described by the hydrochloric acid activation of kaolin which results in the emergence of structural disorder of clay structure. Acid activation leads to aluminum leaching of kaolin clay which reduced the crystallinity [27]. Kaolin clay treated with high-strength acid, i.e., 5 M and 7 M, has not been seen to have a well-defined peak in X-ray diffractograms. This shows that these compounds are amorphous in nature and that there is a high degree of structural disruption in these samples. As the acidic intensity of the leaching is very extreme, the layered structure of the clay content disintegrates to give an amorphous phase. By comparing the results of all raw kaolin and activated metakaolin samples, the peak intensity decreases by increasing the acid concentration. Figure 5 showed the structural disorder after acid leaching which affect the crystalline phase and decline in peak intensities in the following order RK > K1 > K7 > K5 > K3.

3.4. BET Surface Area and Pore Volume

The Kaolin has a layer structure consisting of one octahedral sheet and one tetrahedral sheet which stripped at high temperature during calcination. Calcination at 550–900 °C results in the loss of structural water and reorganization of the structure which formed more reactive tetra-coordinated unit. Moreover, the prominent changes observed after calcination at 650 °C for 4 h which indicates the deterioration of the layer structure [43]. This describes at high calcination temperature increased the surface area and facilitates the lamellar layer formation. The tetrahedra consists of Si (IV) as the central atom with some Al (III) substitution, whereas the main center positions in the octahedral sheets are occupied by Al (III) partially substituted with Fe (III) and Mg (II). On the layers balanced by hydrated exchangeable cations (mostly Ca2+, Mg2+, and Na+) present in the interlayers and on the edges of the particle, non-equivalent substitution produces a negative charge. It was stated that after acid activation with HCl acid, Bronsted acid sites are formed. The first step is to substitute interchangeable cations of Na+ and Mg2+ with H+ ions (kaolinite has a relatively low number of interchangeable cations but traces of smectite mixtures can dramatically enhance the amount of such cations). The second step is attributed to the formation of bridging of hydroxyl group between the nearest neighbor Al atoms of the Si atom and its bridge depends on the atomic Si/Al molar ratio. By basic ion exchange process, natural occurring cations could be substituted with various organic cationic surfactants, usually alkylammonium cations [44].
However, at 1050 °C kaolin clay structure collapsed. The surface area, pore volume and pore size of raw kaolin and acid-treated metakaolin obtained by N2 adsorption-desorption isotherms shown in Table 2. It can be noted that acid activation has improved the physical attribute and catalytic activity of the nano metakaolin clay. This fact might be related to the dealumination process which results in surface disintegration during the acid activation process. Besides that, activation led to an increase in pore diameter which showed particle aggregation occurred and thus led to a reduction in the surface area [45]. The activated clay after acid treatment with strong acid showed the composition of the amorphous SiO2 phase, as demonstrated by their chemical composition. Hence, the texture of SiO2 might result in the reduction of surface area. In addition, the leaching and destruction in the kaolin clay structure formed the finely scattered Si oxides or the removal of various cations blocking surface pores or interlaminar spaces, surface pores/cracks formation and have contributed to an improvement in the physical properties of kaolin clay after acid activation [46].
The raw kaolin showed a 12.49 m2/g surface area, pore volume 0.06 cm3/g and pore size 11.95 nm. After acid activation, the nano metakaolin K3 sample have shown the highest physical properties with surface area 100.64 m2/g, pore volume of 0.09 cm3/g and pore size of 16.09 nm. On the other hand, the relatively low surface area was shown by metakaolin K5 clay sample in Table 2 which indicates the crystalline nature of clay that is influenced by the structural distortion. The structural distortion indicates that acid leaching happened during the acid treatment process [47]. In the meantime, the lowest change in physical properties marked by activated K7 can be associated with failed acid activation process on this sample. It is reported that the inappropriate selection of acid and the lack of acid intensity of the HCl acid for metakaolin K7 during the acid treatment process. Highest surface area and reduction in pore volume after acid activation of nano metakaolin clay provide better catalysts properties for the acetalization of glycerol. Increased surface area and reduction in pore volume describe in following sequence K3 > K1 > K5> K7 > RK. The physical properties of raw kaolin and different acid-activated clay catalysts are shown in Table 2.

3.5. Catalytic Test

The acetalization of glycerol and acetone over fresh kaolin and various acid-activated metakaolin clay (RK, K1, K3, K5 and K7) catalysts has been studied under solvent-free condition. For the determination of the optimum condition of acetalization reaction, the effect of different acid-activated metakaolin clay catalysts on the yield of solketal were studied. The reaction was performed at 50 °C with acetone to glycerol molar ratio 6/1 and for 60 min reaction time. The reaction of glycerol with acetone has a high viscosity in the presence of a high volume of glycerol, which hinders the homogenization of the reaction medium [48]. The acetalization of glycerol with acetone with acid clay catalysts yields six-membered acetal and five membered [49]. Comparison of inactive and active clay catalysts was shown in Figure 6. The efficiency of activated metakaolin clay catalysts was analyzed on the base of their yield of solketal and conversion of glycerol. In contrast, the catalytic efficiency of the catalysts decreases in the following pattern of K3 > K5 > K7 > K1 > RK. The K3 sample had shown the highest yield of solketal 60% can be attributed with its excellent physical properties as shown by the characterization analysis. As observed from the various analysis, K3 clay samples have shown successful acid activation by forming plate-like fragments, high pore volume, pore size and high surface area. The glycerol conversion rises by increasing acetone/glycerol molar ratio from 1 to 6 but further increases in the molar ratio did not result in a further increase in the glycerol conversion.
Meanwhile, the raw kaolin clay and acid-activated metakaolin sample K1 have shown the lowest yield of solketal 13.57% and 36.22%. The result showed the failure of acid activation procedure due to strong acid use during the acid activation of clay. Acid activation of kaolin clay modified by HCl acid described by the following reasons. The first explanation can be linked due to the difference in surface acidity based on an increased in the catalytic activity that was investigated by FTIR. The yield of solketal and conversion of glycerol depends on the surface acidity of catalysts in this reaction. Nanda [50] performed the acetalization reaction in the continuous flow reactor and investigated that the activity of the catalysts related to the amount of acid sites present on the catalysts. The second reason could be the access of reactants to the acid sites present on the surface of acid-activated catalysts. Moreover, the metakaolin sample K5 and K7 have shown the yield of solketal 47.90% and 45.31% which was not satisfactory. The poor yield explained by the structural distortion due to strong acidity used during the activation of clay. Eventually, this resulted in a failure to improve the physical properties of the activated clay catalysts, thus affecting its overall catalytic efficiency. So, the metakaolin K3 sample was selected based on high catalytic activity and physiochemical properties to investigate the effect of parameters on the yield of solketal.

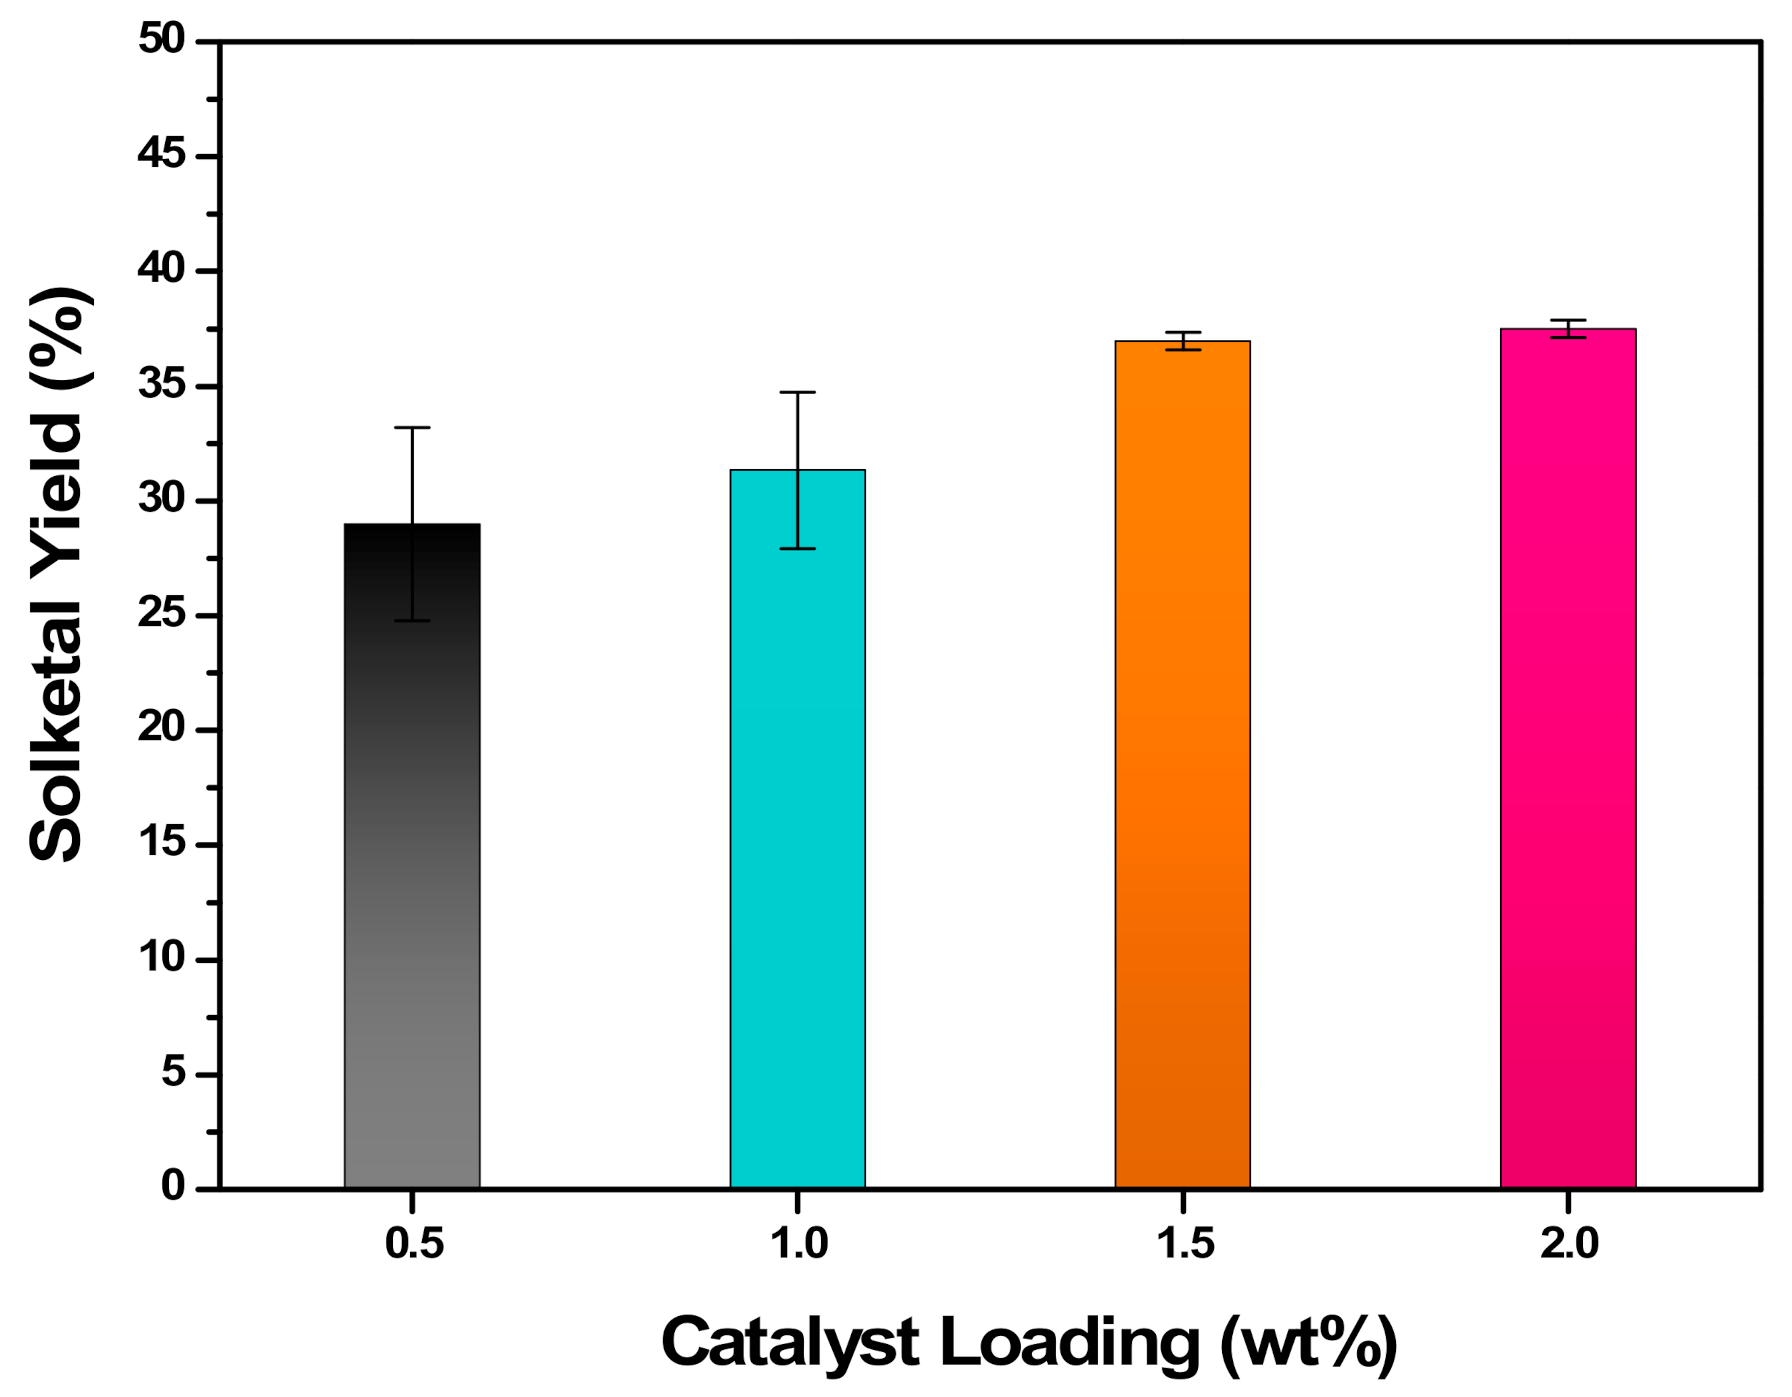
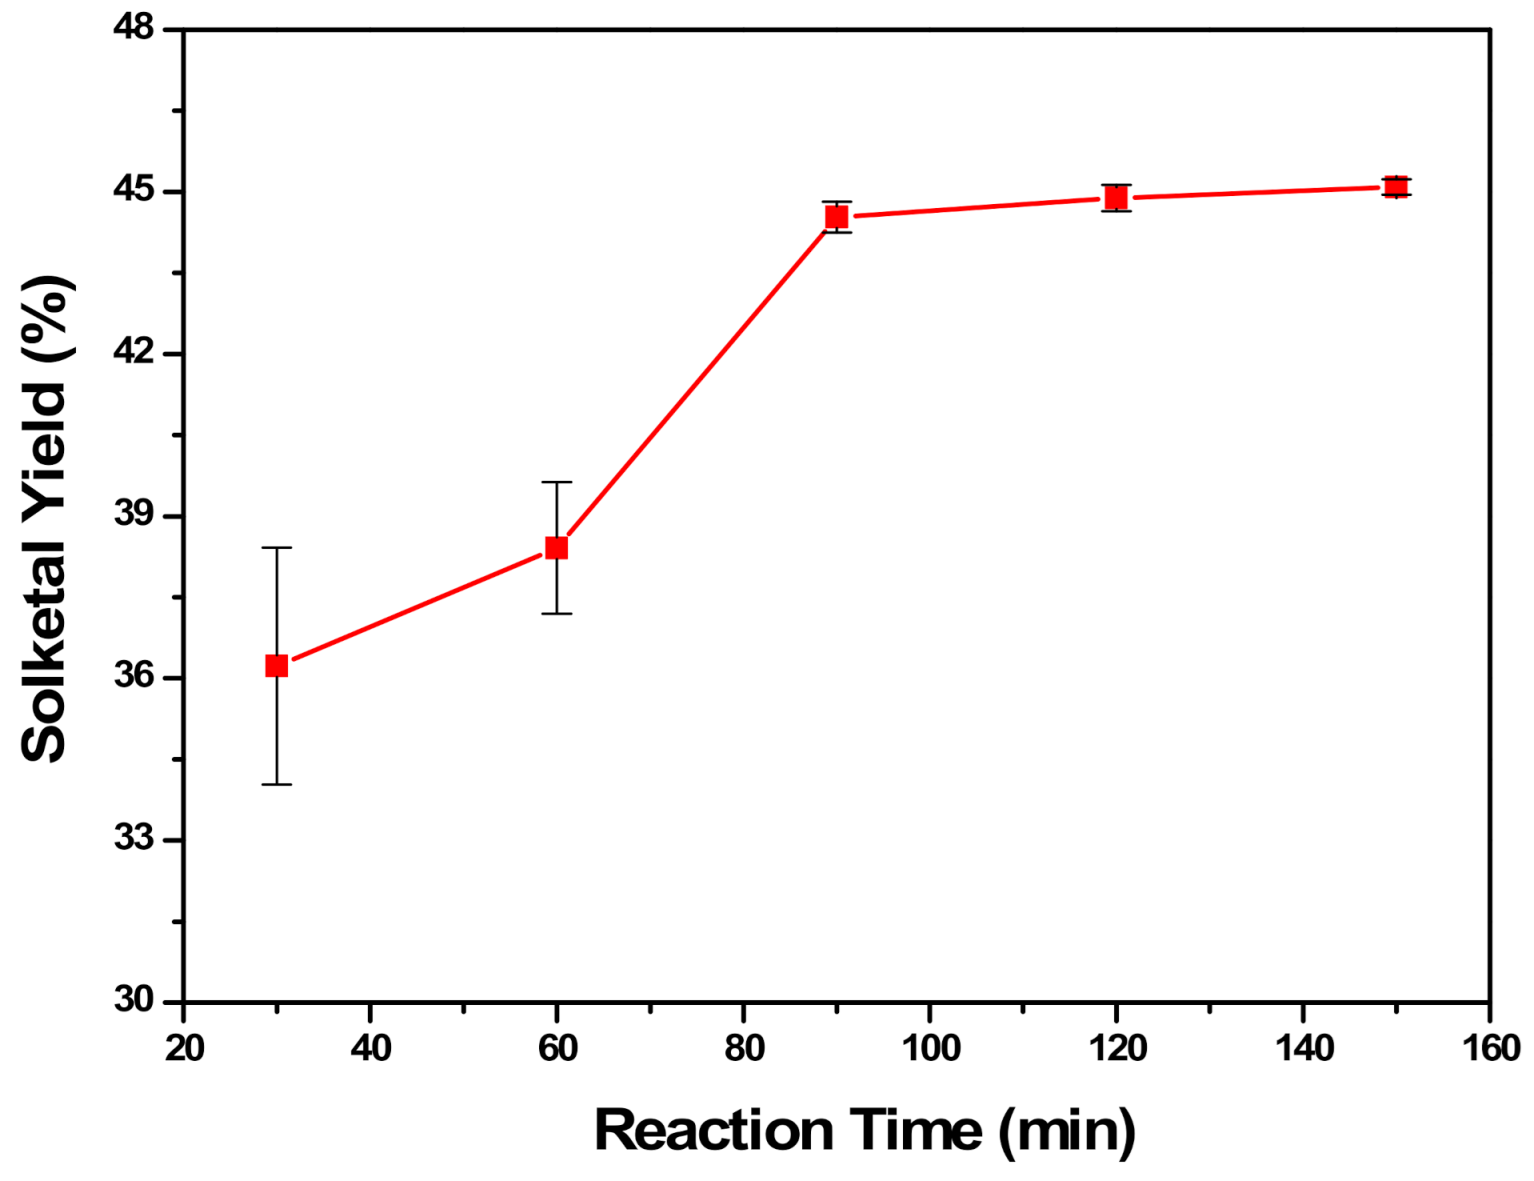
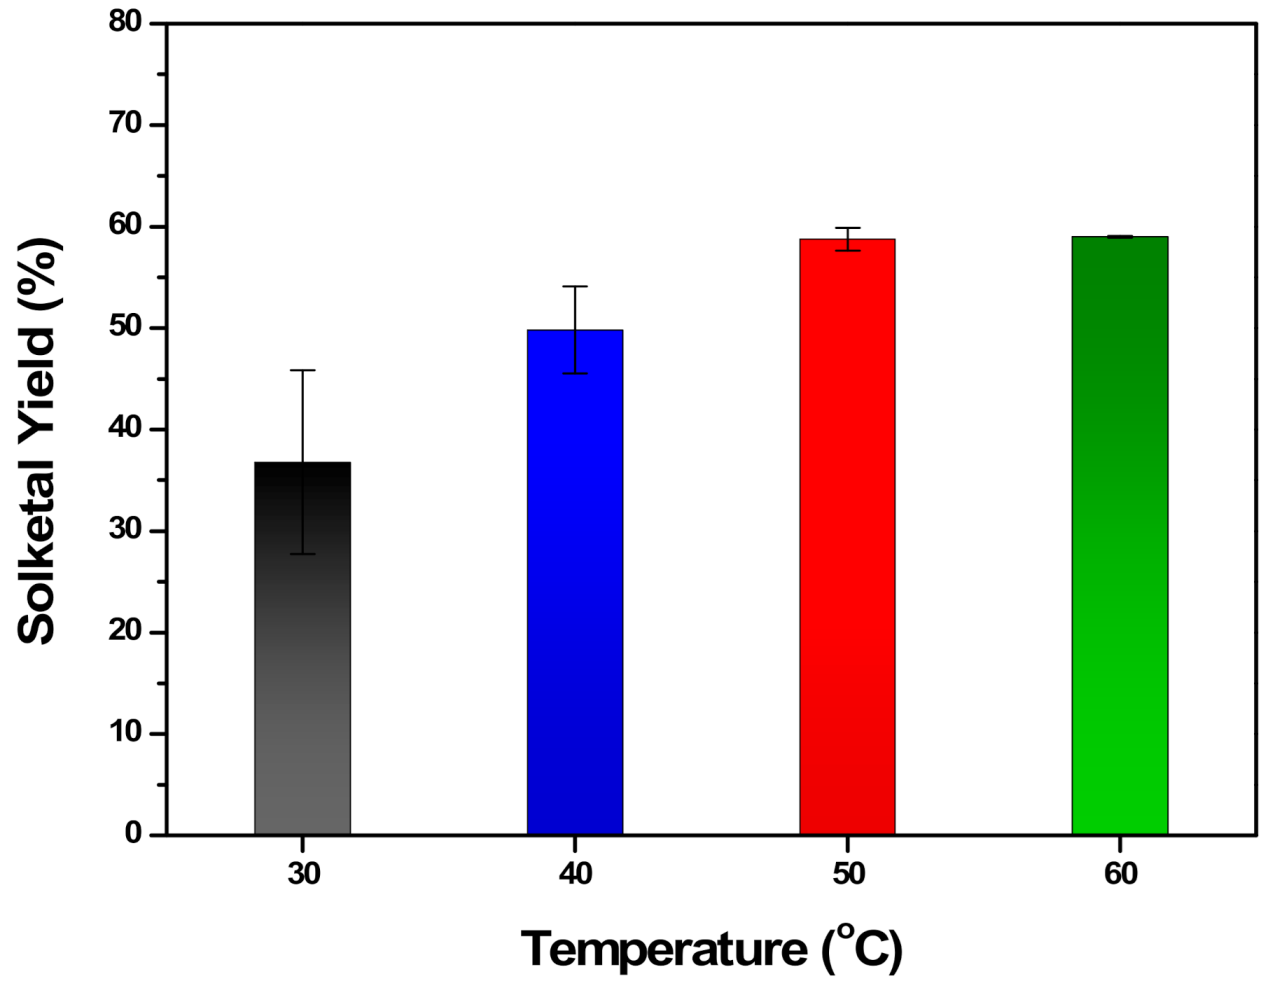
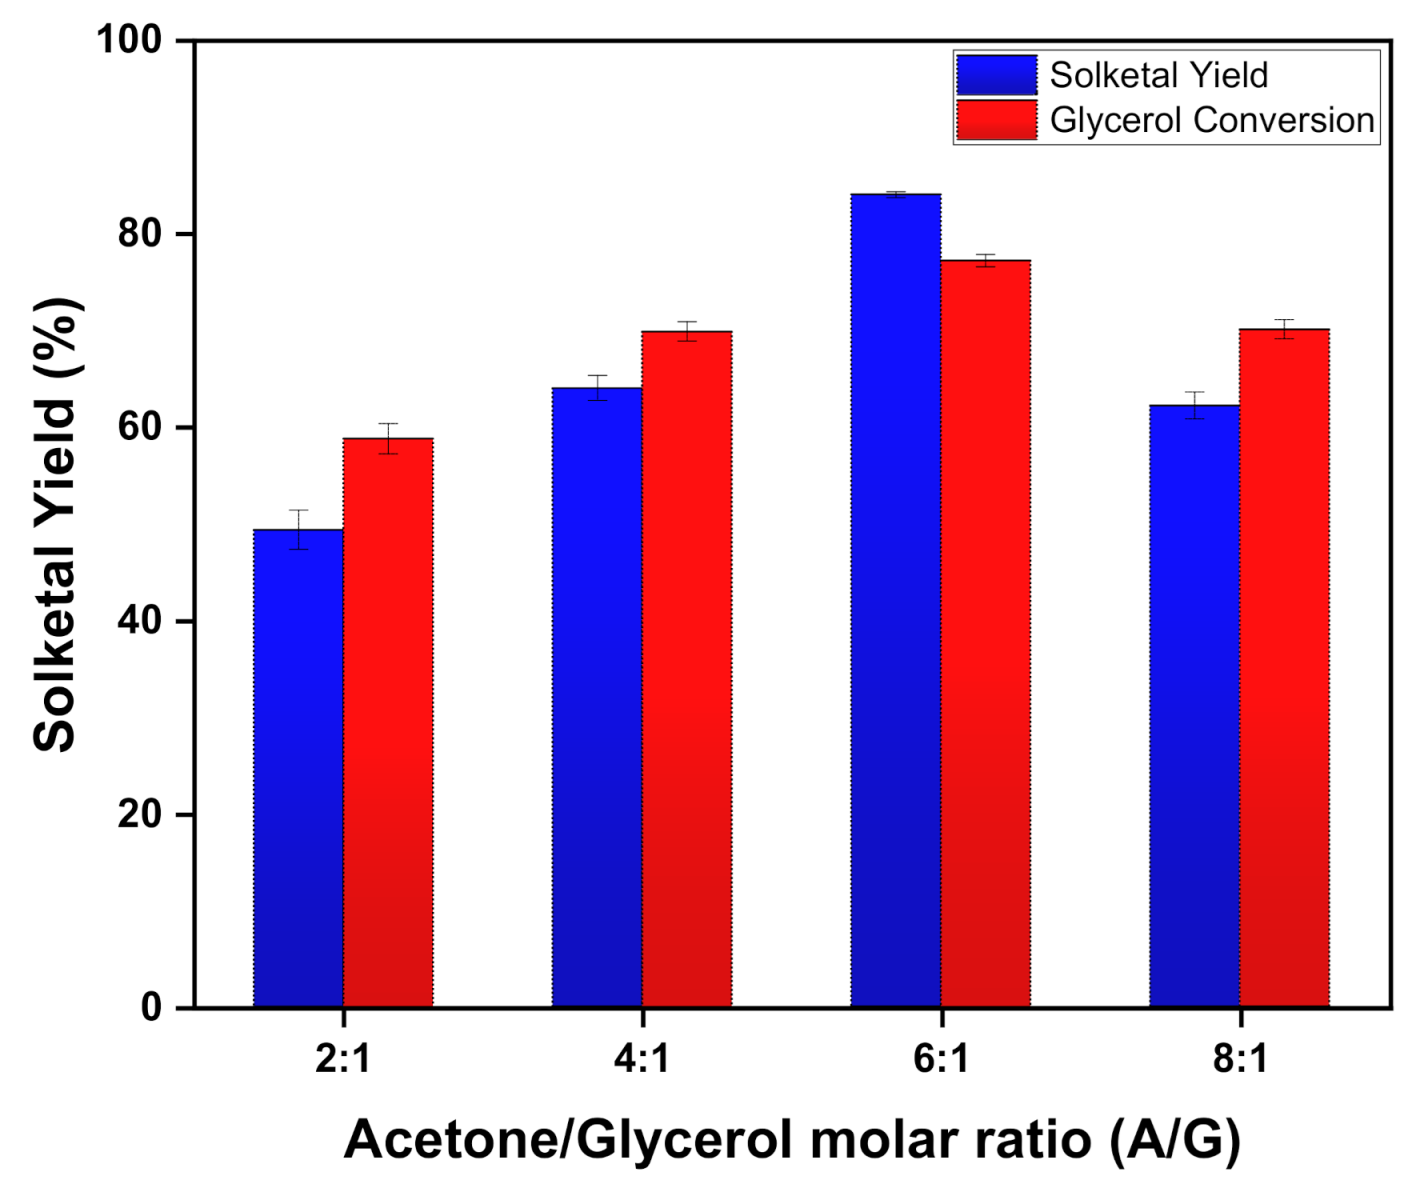
3.6. Optimization of Solketal Synthesis

Acetalization of glycerol and acetone over acid-activated kaolin (K3 sample) catalyst provided to reach the desired product solketal. To determine the optimum reaction conditions, reaction temperature, acetone/glycerol molar ratio, reaction time and catalyst loading were investigated. All parameters effects and ranges were taken into account from previously available data [21]. In the presence of acid catalysts, the acetalization reaction of glycerol and acetone starts at room temperature. During the acetalization reaction, the major product 1,3-dioxolan (solketal) have high selectivity while the other product 1,3-dioxane was formed less than 2–3%. The side product six-membered ring (1,3-dioxane) start decreasing as the reaction proceed because it is kinetically unstable as one of the methyl group occupied axial position and the main product solketal selectivity increased because it is more kinetically favourable than the side product. Related findings have been published in previous research [51]. Mentioned data in the figures are an average of three values and have less than 5% experimental error.
Effect of catalyst amount on the yield of solketal was observed by varying the kaolin catalyst loading from 0% (w/w) to 2% (w/w) as shown in Figure 7. Initially, the reaction carried out without catalysts and results in less than 5% solketal yield which indicate that catalysts mediate the acetalization of glycerol reaction towards solketal yield. When the reaction takes place, the solketal yield starts increasing with the increase in the catalysts loading till the equilibrium achieved followed to a constant state. As shown in Figure 7, the highest solketal yield obtained was 36% at a catalyst loading 1.5% (w/w). However, with a further increase in the amount of the catalyst, the solketal yield showed minor changes, as shown in the bar graph. This was attributed to the fact that the reaction had already achieved equilibrium at 1.5% (w/w) and a further increase in the catalyst amount will not increase the solketal yield. So, 1.5% (w/w) catalysts loading was used for the following experiments. For the optimum conditions, the effect of time on the yield of solketal was investigated at various reaction times in Figure 8.
The effect of time on the product yield was observed on the following reaction conditions (time: 30–150 min, acetone/glycerol molar ratio, 6/1; temperature 50 °C and catalyst loading 1.5% (w/w)). Initially, the reaction had shown very low yield which steadily increased with the increase in reaction time and became constant as shown in Figure 8. Further, the increase in temperature had not shown any further changes that depict that reaction already achieved equilibrium conditions. In this experiment, the reaction had reached equilibrium at 90 min, acetone to glycerol molar ratio 6/1 with catalyst amount of 1.5% (w/w). Overall, the graph shows the increasing trend until equilibrium with the increase in the reaction time. According to the observed results, the optimum reaction time was 90 min for the acetalization of glycerol with acetone in the presence of activated kaolin catalysts. In this study, the acetalization reaction carried out at relatively low temperatures as the reaction is an exothermic reversible reaction and thermodynamically unfavorable at high temperatures [52]. Figure 9 shows the variation in the yield of solketal by varying the temperature.
It can be observed from Figure 9, the solketal yield grew steadily by increasing the temperature from 30 to 60 °C but a further increase in the temperature results in a decline in the yield of solketal. A relatively lower yield was observed at 30 °C and then a significant rise was observed at high temperatures. Moreover, the rate of reaction escalates with the increase in reaction temperature while low temperature needs a long reaction time to reach the equilibrium yield. A further increase in temperature has not shown any significant change in the product yield. Moreover, the effect of the acetone to glycerol molar ratio (A/G) on the yield of solketal was investigated in Figure 10 at four various molar ratios. As stated in previous studies, more than one mole of acetone is required to shift the equilibrium toward the product and to improve the solketal yield.
The molar ratio of acetone/glycerol plays a crucial part in regulating the formation of solketal as in chemical reaction the ratio of the reactants has a vital role, and it is important to optimize the molar ratio in order to achieve high glycerol conversion and solketal yield. The bar graph had shown the upward trend for the yield of solketal by varying the molar ratio from 2:1, 4:1, 6:1 and 8:1. Initially, at a low acetone to glycerol molar ratio (A/G = 2/1) the product yield was not satisfying, but by increasing the molar ratio significantly, a rise in solketal yield was observed, as seen in Figure 10. At a higher acetone to glycerol molar ratio (A/G) of 6/1, the highest solketal yield obtained was 84% but a further increase in the molar ratio showed constant yield. This can be described as the saturation of acetone over the active sites of catalysts with which glycerol can react and equilibrium already achieved. Moreover, the conversion of glycerol rises with the acetone/glycerol molar ratio until 1/6, but a further increase did not increase the glycerol conversion (supporting information) [53]. These results suggest that the acid concentration influences the catalytic activity of acid-activated clays.

4. Conclusions

Glycerol transformed into eco-friendly fuel additives—a solketal, which is an octane booster and combustion improver. The synthesis of solketal from glycerol carried out in the presence of acid-activated metakaolin catalysts and the best performance was shown by metakaolin clay sample namely K3, activated with 3 mol/dm3 of HCl aqueous solution. The improved catalytic activity was described with the help of various characterization techniques. This study introduced non-corrosive, inexpensive, easily recoverable and reusable catalysts for the acetalization of glycerol. Moreover, the highest solketal yield obtained by the novel metakaolin catalyst was 84% and glycerol conversion was 77% at 50 °C, catalysts loading 1.5 wt.% and for a 90 min reaction time. On the other hand, the lowest yield of solketal 13% was shown by raw kaolin but after acid treatment of catalysts, the solketal yield start increasing. The parameters effects on the yield of solketal and glycerol conversion were briefly explained in this study. Solketal obtained may be formulated from synthetic resources, such as glycerol and acetone produced from waste, and may tend to be a suitable candidate for various uses, such as fuel additives, pharmaceuticals, paints and polymer industries. The results highlight the possibility of solketal as a gasoline additive to increase the octane number and reduce the gum formation.

Author Contributions

Conceptualization, I.Z. and M.H.N.; writing—article I.Z.; supervision, M.A., and B.B.A.; data addition, F.S. and M.A.K.; editing, I.Z., Z. and M.H.N. All authors have read and agreed to the published version of the manuscript.

Funding

The funding was provided by Yayasan Universiti Teknologi Petronas (YUTP) under project number (015LC0-144).

Institutional Review Board Statement

Not applicable.

Informed Consent Statement

Not applicable.

Data Availability Statement

Data sharing is not applicable.

Acknowledgments

Acknowledgements: The authors are gratefully acknowledged to University Teknologi PETRONAS, Centre for Biofuel and Biochemicals Research (CBBR), Centralized Analytical Lab (CAL) and the financial support offered by YUTP grant (015LC0-144) and the Ministry of Higher Education (MOHE), Malaysia, to support financially under the FRGS grant (0153AB-L63) for all facilities provided to support postgraduate students.

Conflicts of Interest

The authors declare no conflict of interest.

References

  1. Ayoub, M.; Abdullah, A.Z. Critical review on the current scenario and significance of crude glycerol resulting from biodiesel industry towards more sustainable renewable energy industry. Renew. Sustain. Energy Rev. 2012, 16, 2671–2686. [Google Scholar] [CrossRef]
  2. Hamza, M.; Ayoub, M.; Bin Shamsuddin, R.; Mukhtar, A.; Saqib, S.; Zahid, I.; Ameen, M.; Ullah, S.; Al-Sehemi, A.G.; Ibrahim, M. A review on the waste biomass derived catalysts for biodiesel production. Environ. Technol. Innov. 2020, 101200. [Google Scholar] [CrossRef]
  3. Rezania, S.; Oryani, B.; Park, J.; Hashemi, B.; Yadav, K.K.; Kwon, E.E.; Hur, J.; Cho, J. Review on transesterification of non-edible sources for biodiesel production with a focus on economic aspects, fuel properties and by-product applications. Energy Conv. Manag. 2019, 201, 112155. [Google Scholar] [CrossRef]
  4. Sun, F.; Chen, H. Organosolv pretreatment by crude glycerol from oleochemicals industry for enzymatic hydrolysis of wheat straw. Bioresour. Technol. 2008, 99, 5474–5479. [Google Scholar] [CrossRef]
  5. Bozkurt, Ö.D.; Tunç, F.M.; Bağlar, N.; Çelebi, S.; Günbaş, I.D.; Uzun, A. Alternative fuel additives from glycerol by etherification with isobutene: Structure–performance relationships in solid catalysts. Fuel Process. Technol. 2015, 138, 780–804. [Google Scholar] [CrossRef]
  6. Clarkson, J.S.; Walker, A.J.; Wood, M.A. Continuous Reactor Technology for Ketal Formation: An Improved Synthesis of Solketal. Org. Process. Res. Dev. 2001, 5, 630–635. [Google Scholar] [CrossRef]
  7. Vicente, G.; Melero, J.A.; Morales, G.; Paniagua, M.; Martín, E. Acetalisation of bio-glycerol with acetone to produce solketal over sulfonic mesostructured silicas. Green Chem. 2010, 12, 899–907. [Google Scholar] [CrossRef]
  8. Zulqarnain; Ayoub, M.; Yusoff, M.H.M.; Nazir, M.H.; Zahid, I.; Ameen, M.; Sher, F.; Floresyona, D.; Budi Nursanto, E. A Comprehensive Review on Oil Extraction and Biodiesel Production Technologies. Sustainability 2021, 13, 788. [Google Scholar] [CrossRef]
  9. Li, L.; Korányi, T.I.; Sels, B.F.; Pescarmona, P.P. Highly-efficient conversion of glycerol to solketal over heterogeneous Lewis acid catalysts. Green Chem. 2012, 14, 1611–1619. [Google Scholar] [CrossRef]
  10. Ayoub, M.; Abdullah, A.Z. LiOH-modified montmorillonite K-10 as catalyst for selective glycerol etherification to diglycerol. Catal. Commun. 2013, 34, 22–25. [Google Scholar] [CrossRef]
  11. Zhang, X.; Cui, G.; Feng, H.; Chen, L.; Wang, H.; Wang, B.; Zheng, L.; Hong, S.; Wei, M. Platinum–copper single atom alloy catalysts with high performance towards glycerol hydrogenolysis. Nat. Commun. 2019, 10, 1–12. [Google Scholar] [CrossRef] [PubMed]
  12. Ilham, Z.; Saka, S. Esterification of glycerol from biodiesel production to glycerol carbonate in non-catalytic supercritical dimethyl carbonate. SpringerPlus 2016, 5, 923. [Google Scholar] [CrossRef] [PubMed] [Green Version]
  13. Park, C.-Y.; Nguyen-Phu, H.; Shin, E.W. Glycerol carbonation with CO2 and La2O2CO3/ZnO catalysts prepared by two different methods: Preferred reaction route depending on crystalline structure. Mol. Catal. 2017, 435, 99–109. [Google Scholar] [CrossRef]
  14. Dodekatos, G.; Schünemann, S.; Tüysüz, H. Recent Advances in Thermo-, Photo-, and Electrocatalytic Glycerol Oxidation. ACS Catal. 2018, 8, 6301–6333. [Google Scholar] [CrossRef]
  15. Liu, J.; Daoutidis, P.; Yang, B. Process design and optimization for etherification of glycerol with isobutene. Chem. Eng. Sci. 2016, 144, 326–335. [Google Scholar] [CrossRef]
  16. Ayoub, M.; Abdullah, A.Z. Diglycerol synthesis via solvent-free selective glycerol etherification process over lithium-modified clay catalyst. Chem. Eng. J. 2013, 225, 784–789. [Google Scholar] [CrossRef]
  17. Talebian-Kiakalaieh, A.; Tarighi, S. Hierarchical faujasite zeolite-supported heteropoly acid catalyst for acetalization of crude-glycerol to fuel additives. J. Indust. Eng. Chem. 2019, 79, 452–464. [Google Scholar] [CrossRef]
  18. Crotti, C.; Farnetti, E.; Guidolin, N. Alternative intermediates for glycerol valorization: Iridium-catalyzed formation of acetals and ketals. Green Chem. 2010, 12, 2225–2231. [Google Scholar] [CrossRef]
  19. Maksimov, A.L.; Nekhaev, A.I.; Ramazanov, D.N.; Arinicheva, Y.A.; Dzyubenko, A.A.; Khadzhiev, S.N. Preparation of high-octane oxygenate fuel components from plant-derived polyols. Pet. Chem. 2011, 51, 61–69. [Google Scholar] [CrossRef]
  20. da Silva, C.X.; Gonçalves, V.L.; Mota, C.J. Water-tolerant zeolite catalyst for the acetalisation of glycerol. Green Chem. 2009, 11, 38–41. [Google Scholar] [CrossRef]
  21. Mallesham, B.; Sudarsanam, P.; Raju, G.; Reddy, B.M. Design of highly efficient Mo and W-promoted SnO2solid acids for heterogeneous catalysis: Acetalization of bio-glycerol. Green Chem. 2013, 15, 478–489. [Google Scholar] [CrossRef]
  22. Stawicka, K.; Díaz-Álvarez, A.E.; Calvino-Casilda, V.; Trejda, M.; Banares, M.A.; Ziolek, M. The Role of Brønsted and Lewis Acid Sites in Acetalization of Glycerol over Modified Mesoporous Cellular Foams. J. Phys. Chem. C 2016, 120, 16699–16711. [Google Scholar] [CrossRef]
  23. Timofeeva, M.N.; Panchenko, V.N.; Volcho, K.P.; Zakusin, S.V.; Krupskaya, V.; Gil, A.; Mikhalchenko, O.S.; Vicente, M. Ángel Effect of acid modification of kaolin and metakaolin on Brønsted acidity and catalytic properties in the synthesis of octahydro-2H-chromen-4-ol from vanillin and isopulegol. J. Mol. Catal. A Chem. 2016, 414, 160–166. [Google Scholar] [CrossRef]
  24. Aragaw, T.A. The Effect of Mechanical Treatment and Calcination Temperature of Ethiopian Kaolin on Amorphous Metakaolin Product. In International Conference on Advances of Science and Technology; Springer: Cham, Switzerland, 2020; pp. 662–671. [Google Scholar]
  25. Torres-Luna, J.A.; Carriazo, J.G. Porous aluminosilicic solids obtained by thermal-acid modification of a commercial kaolinite-type natural clay. Solid State Sci. 2019, 88, 29–35. [Google Scholar] [CrossRef]
  26. Ullah, S.; Ahmad, F.; Shariff, A.M.; Bustam, M.A. Synergistic effects of kaolin clay on intumescent fire retardant coating composition for fire protection of structural steel substrate. Polym. Degrad. Stab. 2014, 110, 91–103. [Google Scholar] [CrossRef]
  27. Timofeeva, M.N.; Panchenko, V.N.; Gil, A.; Zakusin, S.V.; Krupskaya, V.; Volcho, K.P.; Vicente, M. Ángel Effect of structure and acidity of acid modified clay materials on synthesis of octahydro-2H-chromen-4-ol from vanillin and isopulegol. Catal. Commun. 2015, 69, 234–238. [Google Scholar] [CrossRef]
  28. Kowalska-Kus, J.; Held, A.; Frankowski, M.; Nowinska, K. Solketal formation from glycerol and acetone over hierarchical zeolites of different structure as catalysts. J. Mol. Catal. A Chem. 2017, 426, 205–212. [Google Scholar] [CrossRef]
  29. Nanda, M.; Yuan, Z.; Qin, W.; Poirier, M.; Chunbao, X. Purification of crude glycerol using acidification: Effects of acid types and product characterization. Austin J. Chem. Eng. 2014, 1, 1–7. [Google Scholar]
  30. Alaba, P.A.; Sani, Y.M.; Daud, W.M.A.W. Kaolinite properties and advances for solid acid and basic catalyst synthesis. RSC Adv. 2015, 5, 101127–101147. [Google Scholar] [CrossRef]
  31. Fatimah, I.; Sahroni, I.; Fadillah, G.; Musawwa, M.M.; Mahlia, T.M.I.; Muraza, O. Glycerol to Solketal for Fuel Additive: Recent Progress in Heterogeneous Catalysts. Energies 2019, 12, 2872. [Google Scholar] [CrossRef] [Green Version]
  32. Nanda, M.R.; Yuan, Z.; Qin, W.; Ghaziaskar, H.S.; Poirier, M.-A.; Xu, C.C. Thermodynamic and kinetic studies of a catalytic process to convert glycerol into solketal as an oxygenated fuel additive. Fuel 2014, 117, 470–477. [Google Scholar] [CrossRef]
  33. Garcia-Valles, M.; Alfonso, P.; Martínez, S.; Roca, N. Mineralogical and thermal characterization of kaolinitic clays from Terra Alta (Catalonia, Spain). Minerals 2020, 10, 142. [Google Scholar] [CrossRef] [Green Version]
  34. Duarte-Silva, R.; García, M.; Ángeles, V.; Rendueles, M.; Diaz, M. Structural, textural and protein adsorption properties of kaolinite and surface modified kaolinite adsorbents. Appl. Clay Sci. 2014, 90, 73–80. [Google Scholar] [CrossRef]
  35. Zhang, C.; Zhang, Z.-J.; Tan, Y.; Zhong, M. The effect of citric acid on the kaolin activation and mullite formation. Ceram. Int. 2017, 43, 1466–1471. [Google Scholar] [CrossRef]
  36. Tunde, A.A. Adsorption of ciprofloxacin HCl from aqueous solution using activated kaolin. World Sci. News 2020, 145, 62–73. [Google Scholar]
  37. Kumar, S.; Panda, A.K.; Singh, R. Preparation and characterization of acids and alkali treated kaolin clay. Bull. Chem. React. Eng. Catal. 2013, 8, 61–69. [Google Scholar] [CrossRef] [Green Version]
  38. Safitri, L.E.; Zuryati, U.K.; Rohma, H.N.; Ni’Mah, Y.L.; Prasetyoko, D. Synthesis zeolite y from kaolin bangka belitung: Activation of metakaolin with various concentration of sulfuric acid. J. Phys. Conf. Ser. 2020, 1567, 032099. [Google Scholar] [CrossRef]
  39. Hu, P.; Yang, H. Insight into the physicochemical aspects of kaolins with different morphologies. Appl. Clay Sci. 2013, 74, 58–65. [Google Scholar] [CrossRef]
  40. Belver, C.; Muñoz, A.M.A.B.; Vicente, M.A. Chemical Activation of a Kaolinite under Acid and Alkaline Conditions. Chem. Mater. 2002, 14, 2033–2043. [Google Scholar] [CrossRef]
  41. Panda, A.K.; Mishra, B.; Mishra, D.; Singh, R. Effect of sulphuric acid treatment on the physico-chemical characteristics of kaolin clay. Colloids Surf. A Physicochem. Eng. Asp. 2010, 363, 98–104. [Google Scholar] [CrossRef]
  42. Masuda, H.; Higashitani, K.; Yoshida, H. Powder Technology: Fundamentals of Particles, Powder Beds, and Particle Generation; CRC Press: Boca Raton, FL, USA, 2006. [Google Scholar]
  43. Lambert, J.F.; Millman, W.S.; Fripiat, J.J. Revisiting kaolinite dehydroxylation: A silicon-29 and aluminum-27 MAS NMR study. J. Am. Chem. Soc. 1989, 111, 3517–3522. [Google Scholar] [CrossRef]
  44. Centi, G.; Perathoner, S. Catalysis by layered materials: A review. Microporous Mesoporous Mater. 2008, 107, 3–15. [Google Scholar] [CrossRef]
  45. Nuntiya, A.; Prasanphan, S. The rheological behavior of kaolin suspensions. Chiang Mai J. Sci. 2006, 33, 271–281. [Google Scholar]
  46. Dudkin, N.; Loukhina, I.V.; Avvakumov, E.G.; Isupov, V.P. Application of mechnochemical treatment of disintegration of kaolinite with sulphuric acid. Chem. Sustain. Dev. 2004, 12, 327–330. [Google Scholar]
  47. Gao, W.; Zhao, S.; Wu, H.; Deligeer, W.; Asuha, S. Direct acid activation of kaolinite and its effects on the adsorption of methylene blue. Appl. Clay Sci. 2016, 126, 98–106. [Google Scholar] [CrossRef]
  48. Zahid, I.; Ayoub, M.; Abdullah, B.B.; Nazir, M.H.; Ameen, M.; Zulqarnain; Yusoff, M.H.M.; Inayat, A.; Danish, M. Production of Fuel Additive Solketal via Catalytic Conversion of Biodiesel-Derived Glycerol. Ind. Eng. Chem. Res. 2020, 59, 20961–20978. [Google Scholar] [CrossRef]
  49. Tang, A.; Su, L.; Li, C.; Wei, W. Effect of mechanical activation on acid-leaching of kaolin residue. Appl. Clay Sci. 2010, 48, 296–299. [Google Scholar] [CrossRef]
  50. Nanda, M.R.; Yuan, Z.; Qin, W.; Ghaziaskar, H.S.; Poirier, M.-A.; Xu, C.C. A new continuous-flow process for catalytic conversion of glycerol to oxygenated fuel additive: Catalyst screening. Appl. Energy 2014, 123, 75–81. [Google Scholar] [CrossRef]
  51. Nanda, M.R.; Yuan, Z.; Qin, W.; Ghaziaskar, H.S.; Poirier, M.-A.; Xu, C.C. Catalytic conversion of glycerol to oxygenated fuel additive in a continuous flow reactor: Process optimization. Fuel 2014, 128, 113–119. [Google Scholar] [CrossRef]
  52. Reichardt, C.; Welton, T. Solvents and Solvent Effects in Organic Chemistry; Wiley: Hoboken, NJ, USA, 2010; p. 5. [Google Scholar]
  53. Timofeeva, M.N.; Panchenko, V.N.; Krupskaya, V.; Gil, A.; Vicente, M. Ángel Effect of nitric acid modification of montmorillonite clay on synthesis of solketal from glycerol and acetone. Catal. Commun. 2017, 90, 65–69. [Google Scholar] [CrossRef]
Figure 1. Synthesis of solketal from glycerol and acetone.
Sustainability 13 02631 g001
Figure 2. Batch reactor experimental setup.
Sustainability 13 02631 g002
Figure 3. FTIR graph of raw kaolin and acid-activated metakaolin (RK = raw kaolin, K1 = activated with 1 M, K3 = activated with 3 M, K5 = activated with 5 M, K7 = activated with 7 M).
Sustainability 13 02631 g003
Figure 4. FESEM images of raw kaolin and acid-activated meta kaolin samples; (RK, K1, K3, K5, K7 = 10 um and RK*, K1*, K3*, K5*, K7* = 1 um).
Sustainability 13 02631 g004
Figure 5. XRD pattern of raw kaolin and acid-activated metakaolin clay (RK = raw kaolin, K1 = activated with 1 M, K3 = activated with 3 M, K5 = activated with 5 M, K7 = activated with 7 M).
Sustainability 13 02631 g005
Figure 6. Effect of acid concentration on solketal yield with following reaction conditions; acetone/glycerol molar ratio, 6:1; catalyst amount, 1 wt.%; reaction time: 60 min at 50 °C.
Sustainability 13 02631 g006
Figure 7. Effect of catalyst loading on the solketal yield (reaction conditions: temperature 50 °C, acetone/glycerol molar ratio, 6/1 and reaction time 60 min).
Sustainability 13 02631 g007
Figure 8. Effect of time on the solketal yield (reaction conditions: acetone/glycerol molar ratio, 6/1, temperature 50 °C and catalyst loading 1.5% (w/w)).
Sustainability 13 02631 g008
Figure 9. Effect of temperature on the solketal yield (reaction conditions: acetone/glycerol molar ratio, 6/1, catalyst loading 1.5% (w/w) and reaction time 90 min).
Sustainability 13 02631 g009
Figure 10. Effect of acetone/glycerol molar ratio on solketal yield (reaction conditions: temperature 50 °C, catalyst loading 1.5% (w/w) and reaction time 90 min).
Sustainability 13 02631 g010
Table 1. Physical properties of clay catalysts.
CatalystRaw Kaolin (RK)
Average particle size (μ)1.0–1.5
Surface area (m2/g)12.49
pH4.00
Table 2. Physical properties of raw kaolin and acid-activated metakaolin clay catalyst.
Kaolin SamplesSurface Area (m2/g)Pore Size (nm)Pore Volume (cm3/g)
RK12.4911.950.06
K168.5914.570.08
K3100.6416.090.09
K523.4120.890.05
K716.8422.510.07
Publisher’s Note: MDPI stays neutral with regard to jurisdictional claims in published maps and institutional affiliations.

