Article

E-Learning Services to Achieve Sustainable Learning and Academic Performance: An Empirical Study

by
Mohammad Mahtab Alam
1,*,
Naim Ahmad
2,
Quadri Noorulhasan Naveed
2,
Ayyub Patel
3,
Mohammed Abohashrh
1 and
Mohammed Abdul Khaleel
2
1
College of Applied Medical Science, King Khalid University, Abha 62529, Saudi Arabia
2
College of Computer Science, King Khalid University, Abha 62529, Saudi Arabia
3
College of Medicine, King Khalid University, Abha 62529, Saudi Arabia
*
Author to whom correspondence should be addressed.
Sustainability 2021, 13(5), 2653; https://0-doi-org.brum.beds.ac.uk/10.3390/su13052653
Submission received: 25 January 2021 / Revised: 24 February 2021 / Accepted: 25 February 2021 / Published: 2 March 2021
(This article belongs to the Special Issue Information Systems, E-learning and Knowledge Management)

Abstract

:
E-Learning has proven to be the only resort as a replacement of traditional face-to-face learning methods in the current global lockdown due to COVID-19 pandemic. Academic institutions across the globe have invested heavily into E-Learning and the majority of the courses offered in traditional classroom mode have been converted into E-Learning mode. The success of E-Learning initiatives needs to be ensured to make it a sustainable mode of learning. The objective of the current study is to propose a holistic E-Learning service framework to ensure effective delivery and use of E-Learning Services that contributes to sustainable learning and academic performance. Based on an extensive literature review, a proposed theoretical model has been developed and tested empirically. The model identifies a broad range of success determinants and relates them to different success measures, including learning and academic performance. The proposed model was validated with the response from 397 respondents involved with an E-Learning system in the top five public universities in the southern region of Saudi Arabia through the Partial Least Squares regression technique using SmartPLS software. Five main factors (Learner’s Quality, Instructor’s Quality, Information’s Quality, System’s Quality and Institutional Quality) were identified as a determinant of E-Learning service performance which together explains 48.7% of the variance of perceived usefulness of ELS, 71.2% of the variance of use of the E-Learning system. Perceived usefulness of ELS and use of ELS together explain 70.6% of learning and academic performance of students. Hence the framework will help achieve the sustainable and successful adoption of E-Learning services.

1. Introduction

Achievements in the fields of information and communication technology (ICT) have brought about significant changes in all related fields. ICT has capitalized on new paradigms such as cloud computing [1], the internet of things [2], big data [3], social-networking, and block chain to boost its sustainability [4]. ICT-led innovations have created new marketplaces, products, processes, and services [5]. The education field has also capitalized on this wave of ICT led innovations. ICT has brought many new learning paradigms into the folds of education, such as E-Learning and mobile learning [6,7,8]. The E-Learning paradigm is said to be an extension of the distance learning mode of education started in the 1980s [9]. E-Learning has proven to be the only resort to allow a continuation of learning in the current global lockdown due to coronavirus disease 2019 (COVID-19) pandemic [10]. All institutions across the globe have invested heavily into E-Learning and many of the courses offered in traditional classroom-mode have been converted into E-Learning mode.
E-Learning and mobile-learning is supporting all forms of learning [11], such as formal, non-formal, and informal. Individuals are gaining information from mobile devices at a very fast pace in different formats on practically every sphere. This technology assisted learning paradigm has provided a pervasive environment for learning at any time and anywhere, to promote the cause of inter-generational education for sustainable development (SD) [12]. Sustainability is measured in three dimensions, i.e., economic, social and environmental, which are referred to as the triple bottom line (TBL) [13]. Education has been defined as one of the five indicators for social sustainability by the United Nations (UN) [14]. This paradigm will support social sustainability by providing sustainable means for learning.
The success of E-Learning initiatives has been studied in many previous articles [15,16]. The literature shows that studies utilize different theoretical frameworks, such as technology acceptance model (TAM) [17,18], information systems success (ISS) [19], SERVQUAL [20], decomposed theory of planned behavior (DTPB) [21], and 5Q’s model [22]. Furthermore, many E-Learning models of success and quality have been proposed such as E-Learning systems success (ELSS) [23], evaluating E-Learning systems success (EESS) [24], E-Learning quality (ELQ) [25,26], E-Learner satisfaction (ELS) [27,28], and user satisfaction model (USM) [29]. Similarly, different dimensions and constructs of E-Learning have been considered, such as information, system, users, learners, instructors, stakeholders, course design, multimedia, interactions, reliability, responsiveness, user interface, etc. On the dependent side, factors have been perceived such as usefulness, perceived satisfaction, grade expectation, benefits, system use, adoption, and acceptance. Furthermore, the related work section gives more details of the studies in this area.
The objective of this research is to develop E-Learning Success Instrument in a holistic fashion considering the following constructs: Learner’s quality, Instructor’s quality, Information quality, System quality, Institutional quality. The role of the learner is one of the important key factors for the successful implementation of E-Learning. The quality of E-Learning services highly depends on various aspects of the learner. To measure the learner’s quality, the current study identified four parameters—learner’s attitude, behavior, self-efficacy, and peer interaction. Likewise, instructors are important stakeholders of E-Learning and their quality may be measured through four parameters—reliability, assurance, empathy, and responsiveness. These parameters are adapted from the Parasuraman et al. service quality SERVQUAL model [20] which is widely recognized to measure the quality of services.
Similarly, the quality of the E-Learning system and information therein, represent two important constructs. System quality is evaluated in four dimensions—multimedia support, interface design, functionality, and ease of use. Likewise, information quality has been assessed in four dimensions—contents, instructions, language, and mode of communication. The fifth important dimension or stakeholder is an institution offering E-Learning services. Its quality has also been measured through four constructs—administrative support, financial support, stakeholders’ training, and environmental support.
Furthermore, nine demographic questions have been included to illustrate the context of the respondents. Four are related to age, satisfaction, area of study and universities in southern Saudi Arabia. The remaining five are related to the experience of E-Learning such as acquaintance and its level, usage and its period, and type of E-Learning such as blended in certain ratios or full. Finally, the determinants of E-Learning services have been related to three dependent constructs, namely perceived usefulness and use of E-Learning services, and learning and academic performance [30]. The proposed model has been tested with the help of a Partial Least Squares regression technique using SmartPLS software. The data was gathered through an online survey from the top five public universities in the southern region of Saudi Arabia.
The rest of the article is divided into the following sections: theoretical foundation, development of the conceptual model, research methodology, data analysis and results, discussion, conclusion, limitations, and future research.

2. Theoretical Foundation

E-Learning is the most commonly used pedagogy to access resources with the help of computers, laptop, smartphones, and tablets. Technology provides added advantage in education and the teaching-learning environment. E-Learning has a lot of advantage over the traditional ways of learning, such as wider accessibility of learning material, fast communication and academic collaboration. Continuous technological innovation and advancements have made it difficult to find a unique definition of E-Learning. Many studies have defined E-Learning in different ways. Some studies [24,31] defined E-Learning as the use of technology during the learning process while others [32,33] defined it as an information system which can assimilate a variety of instructional material through email, discussion, assignment, quizzes, and live chat sessions. In this study, we will adopt E-Learning as an information system. Thus, the success of an E-Learning system is viewed as an information system (IS) success. The most commonly used method to evaluate E-Learning system success is the information systems success (IS) model by DeLone and McLean [19], Technology Acceptance (TAM) Model by Davis [34], User Satisfaction (US) Models by Cyert and March [35], and E-Learning Quality (ELQ) Models by Al-Fraihat [24].

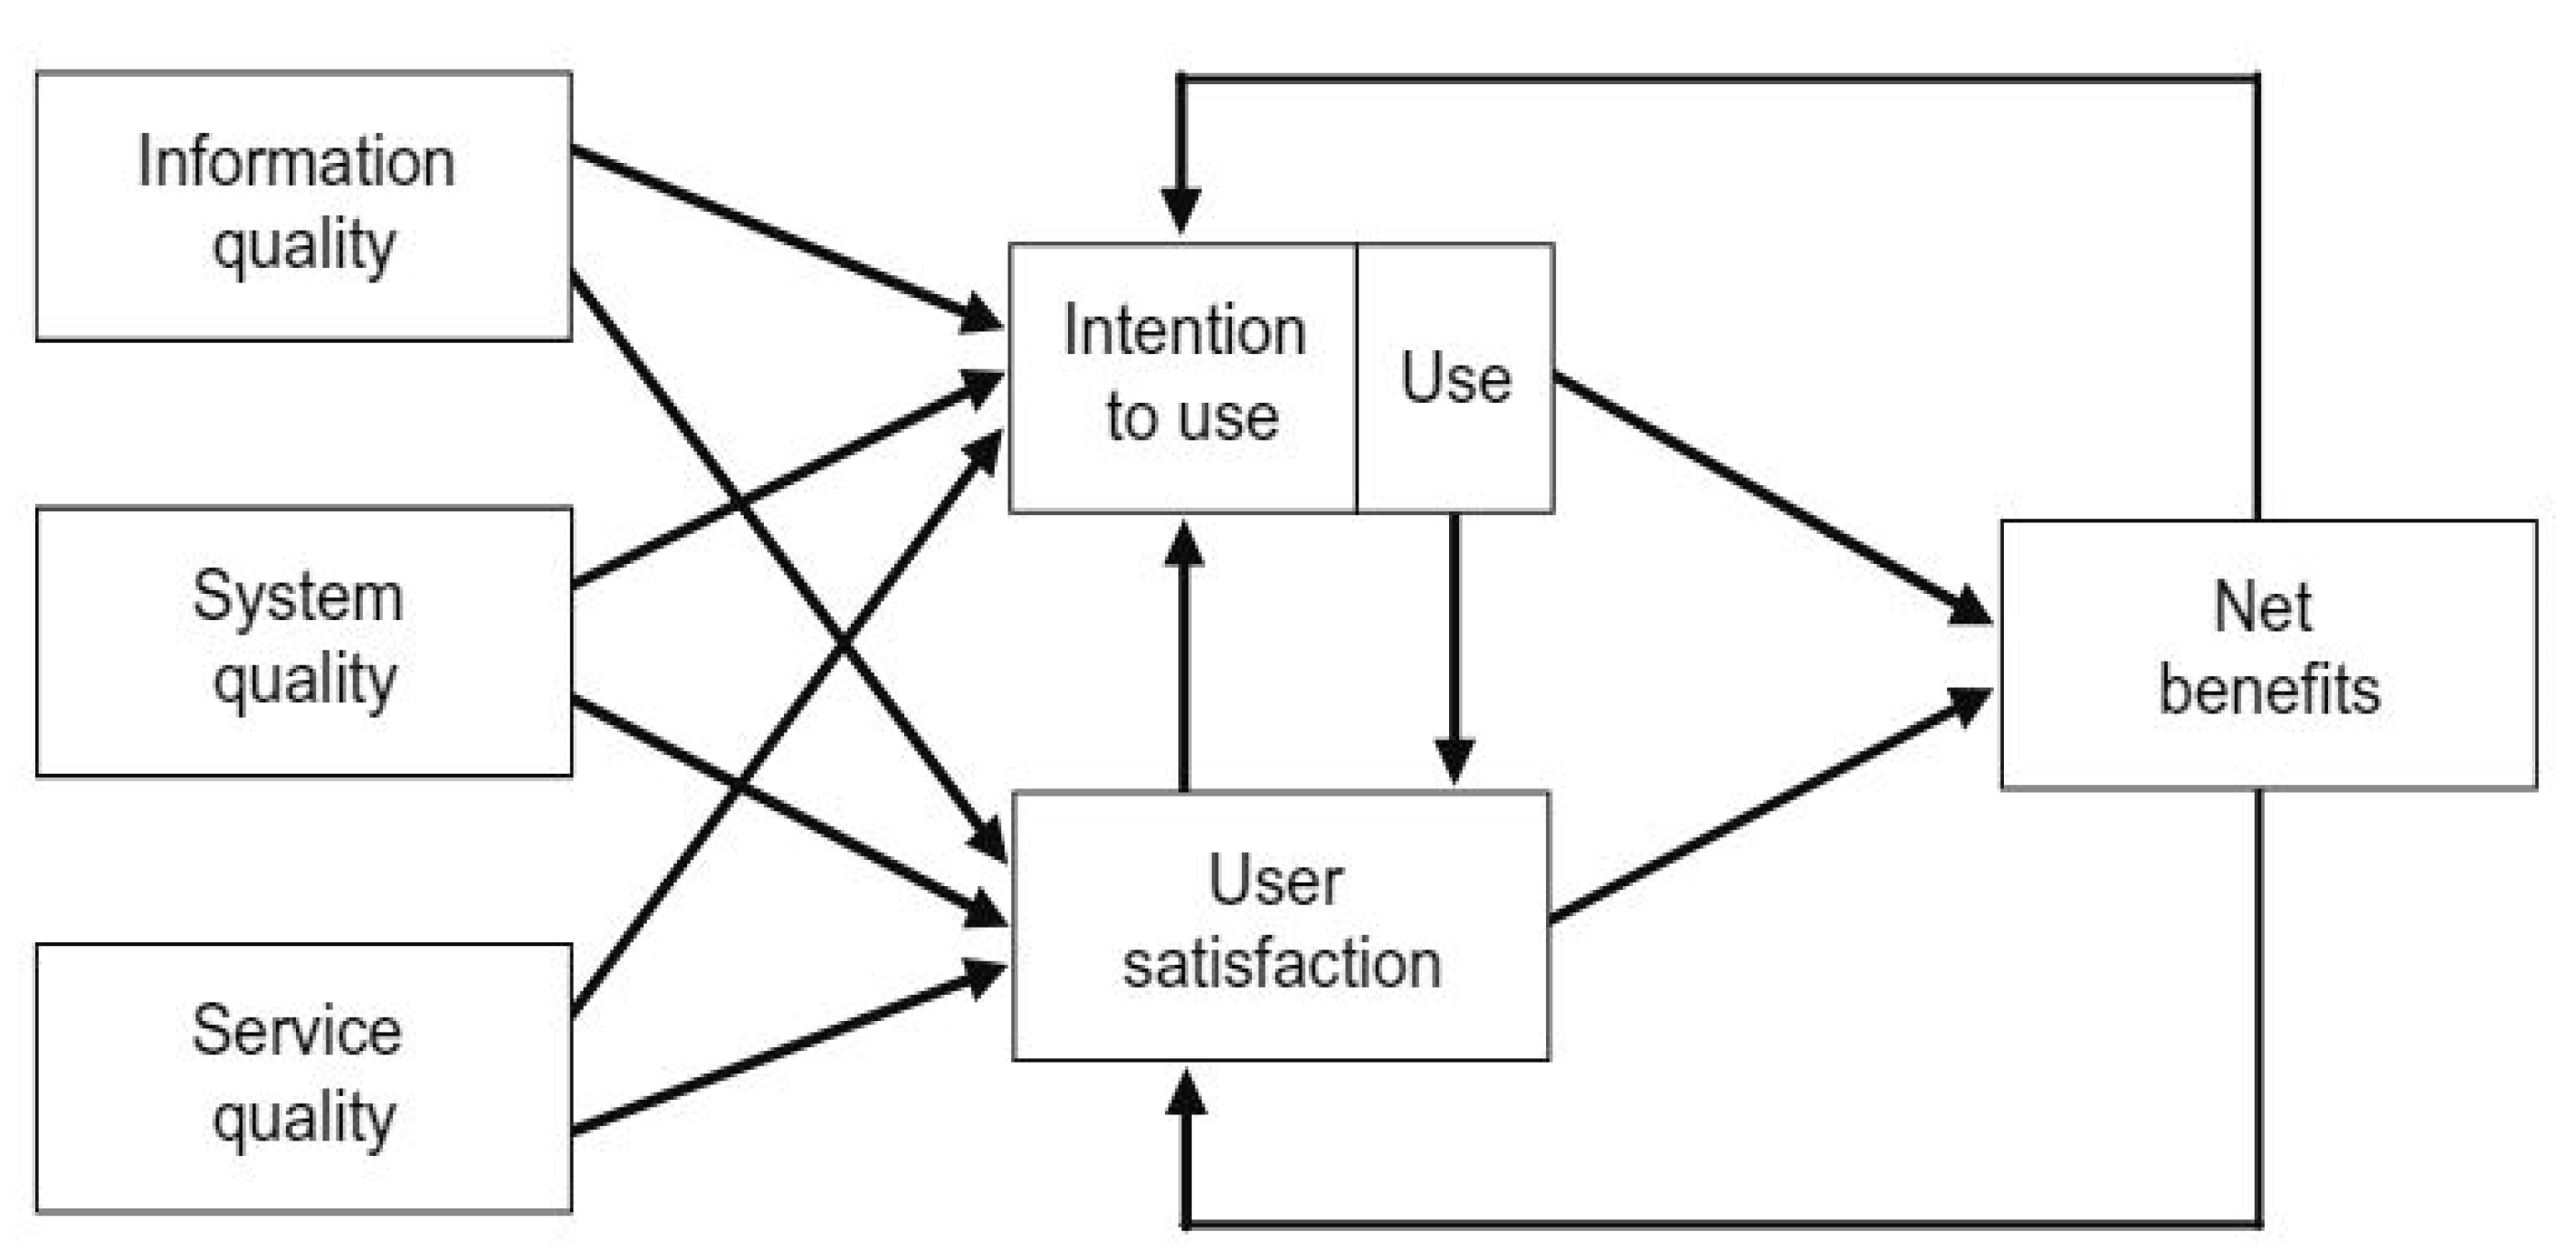
2.1. E-Learning Success Based on IS Model

DeLone and Mclean [19] proposed a model to measure E-Learning success in 1992 on the basis of an extensive review of the literature. Their proposed model was based on six variables—namely information quality, system quality, service quality, use, intention to use, user satisfaction, and net benefits (Figure 1). Later their proposed model was tested empirically by some researchers [36] who suggested to add service quality to the existing model. Some researchers [37] have suggested replacing “system use” with “perceived usefulness” and “use” with “intention to use”. Considering the suggestions of researchers, DeLone and Mclean updated their model in the year 2002 with “service quality” as a new construct and merged the “individual and organizational impact” into “benefits”. Their model became popular and has been used by researchers [38] to measure E-Learning system success. There is no doubt about the reliability and validity of the model, but it provides contradictory results. More precisely, there have been contradictions based on some unexplained intervening variables in the model. Some researchers [38] have critically evaluated DeLone and Mcleans’ IS model and suggested further enquiry to find out quality factors to improve the explanatory power of the existing model.

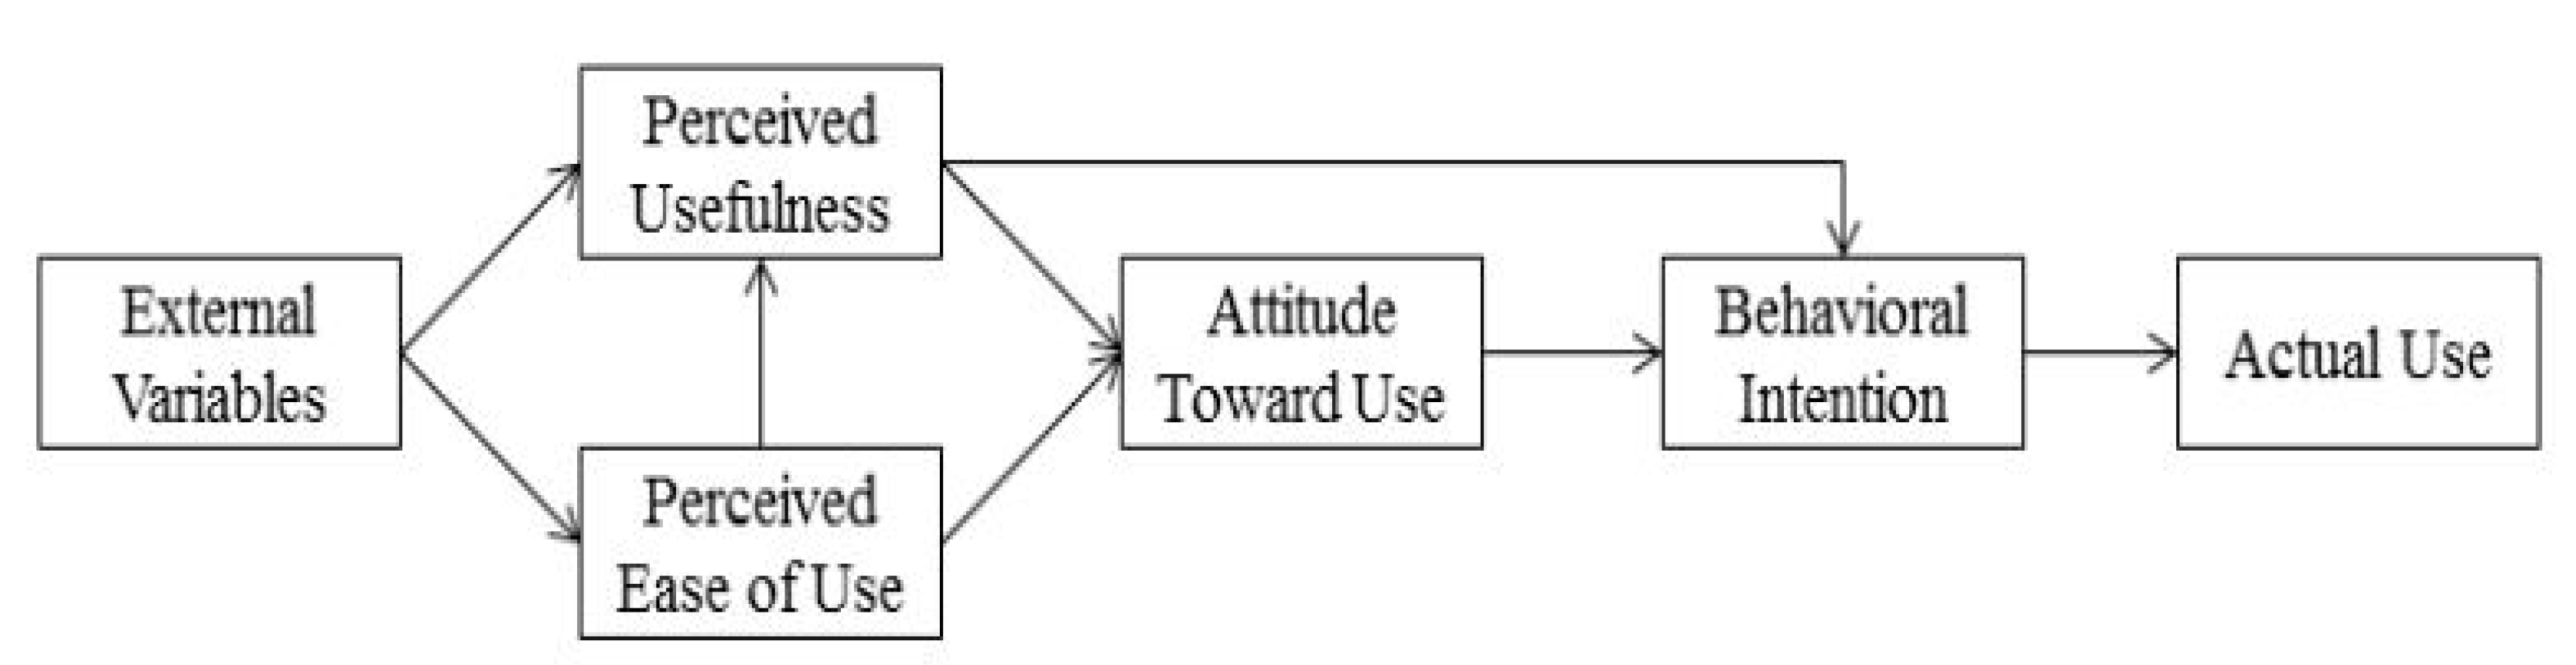
2.2. E-Learning Success Based on TAM Model

The second major development to evaluate the success of an information system was proposed by Devis et al., (1989) [34] (Figure 2). Later, it became the most popular theory to evaluate the success and use of new technology. The main determinants of this model are external factors like perceived usefulness, perceived ease of use, and intention to use. Technology Acceptance Model was considered as one of the mostly used models adopted in E-Learning acceptance by researchers over a period of time. Despite its wide adoption in E-Learning, many researchers have critically evaluated this model regarding the fact that it has poor fitness, limited predictive power, and a lack of practical value.

2.3. E-Learning Success Based on User Satisfaction Model:

Cyert and March (1963) [35] introduced the concept of user satisfaction model to assess information systems success (Equation (1)). This model was empirically tested by Baily and Pearson (1983) [39] with the inclusion of 39 instruments to measure computer user satisfaction. For the assessment of satisfaction, the sum of user’s weighted reactions to a set of factors was used as given below.
S i = j = i n R i j W i j
where Rij = The reaction to factor j by individual I; Wij = The importance of factor j to individual i.
Different approaches with a variety of scale were introduced over a period of time to measure computer user satisfaction. In its continual development, Sun et al. (2008) [40] introduced six dimensions to measure E-Learning system success—namely learners, instructors, course, technology, design, and environment. Furthermore, they have defined six dimensions into thirteen factors—namely instructor attitude, computer anxiety, course quality, perceived usefulness, perceived ease of use, and diversity. Many studies have tested this model empirically and suggested some advancement.

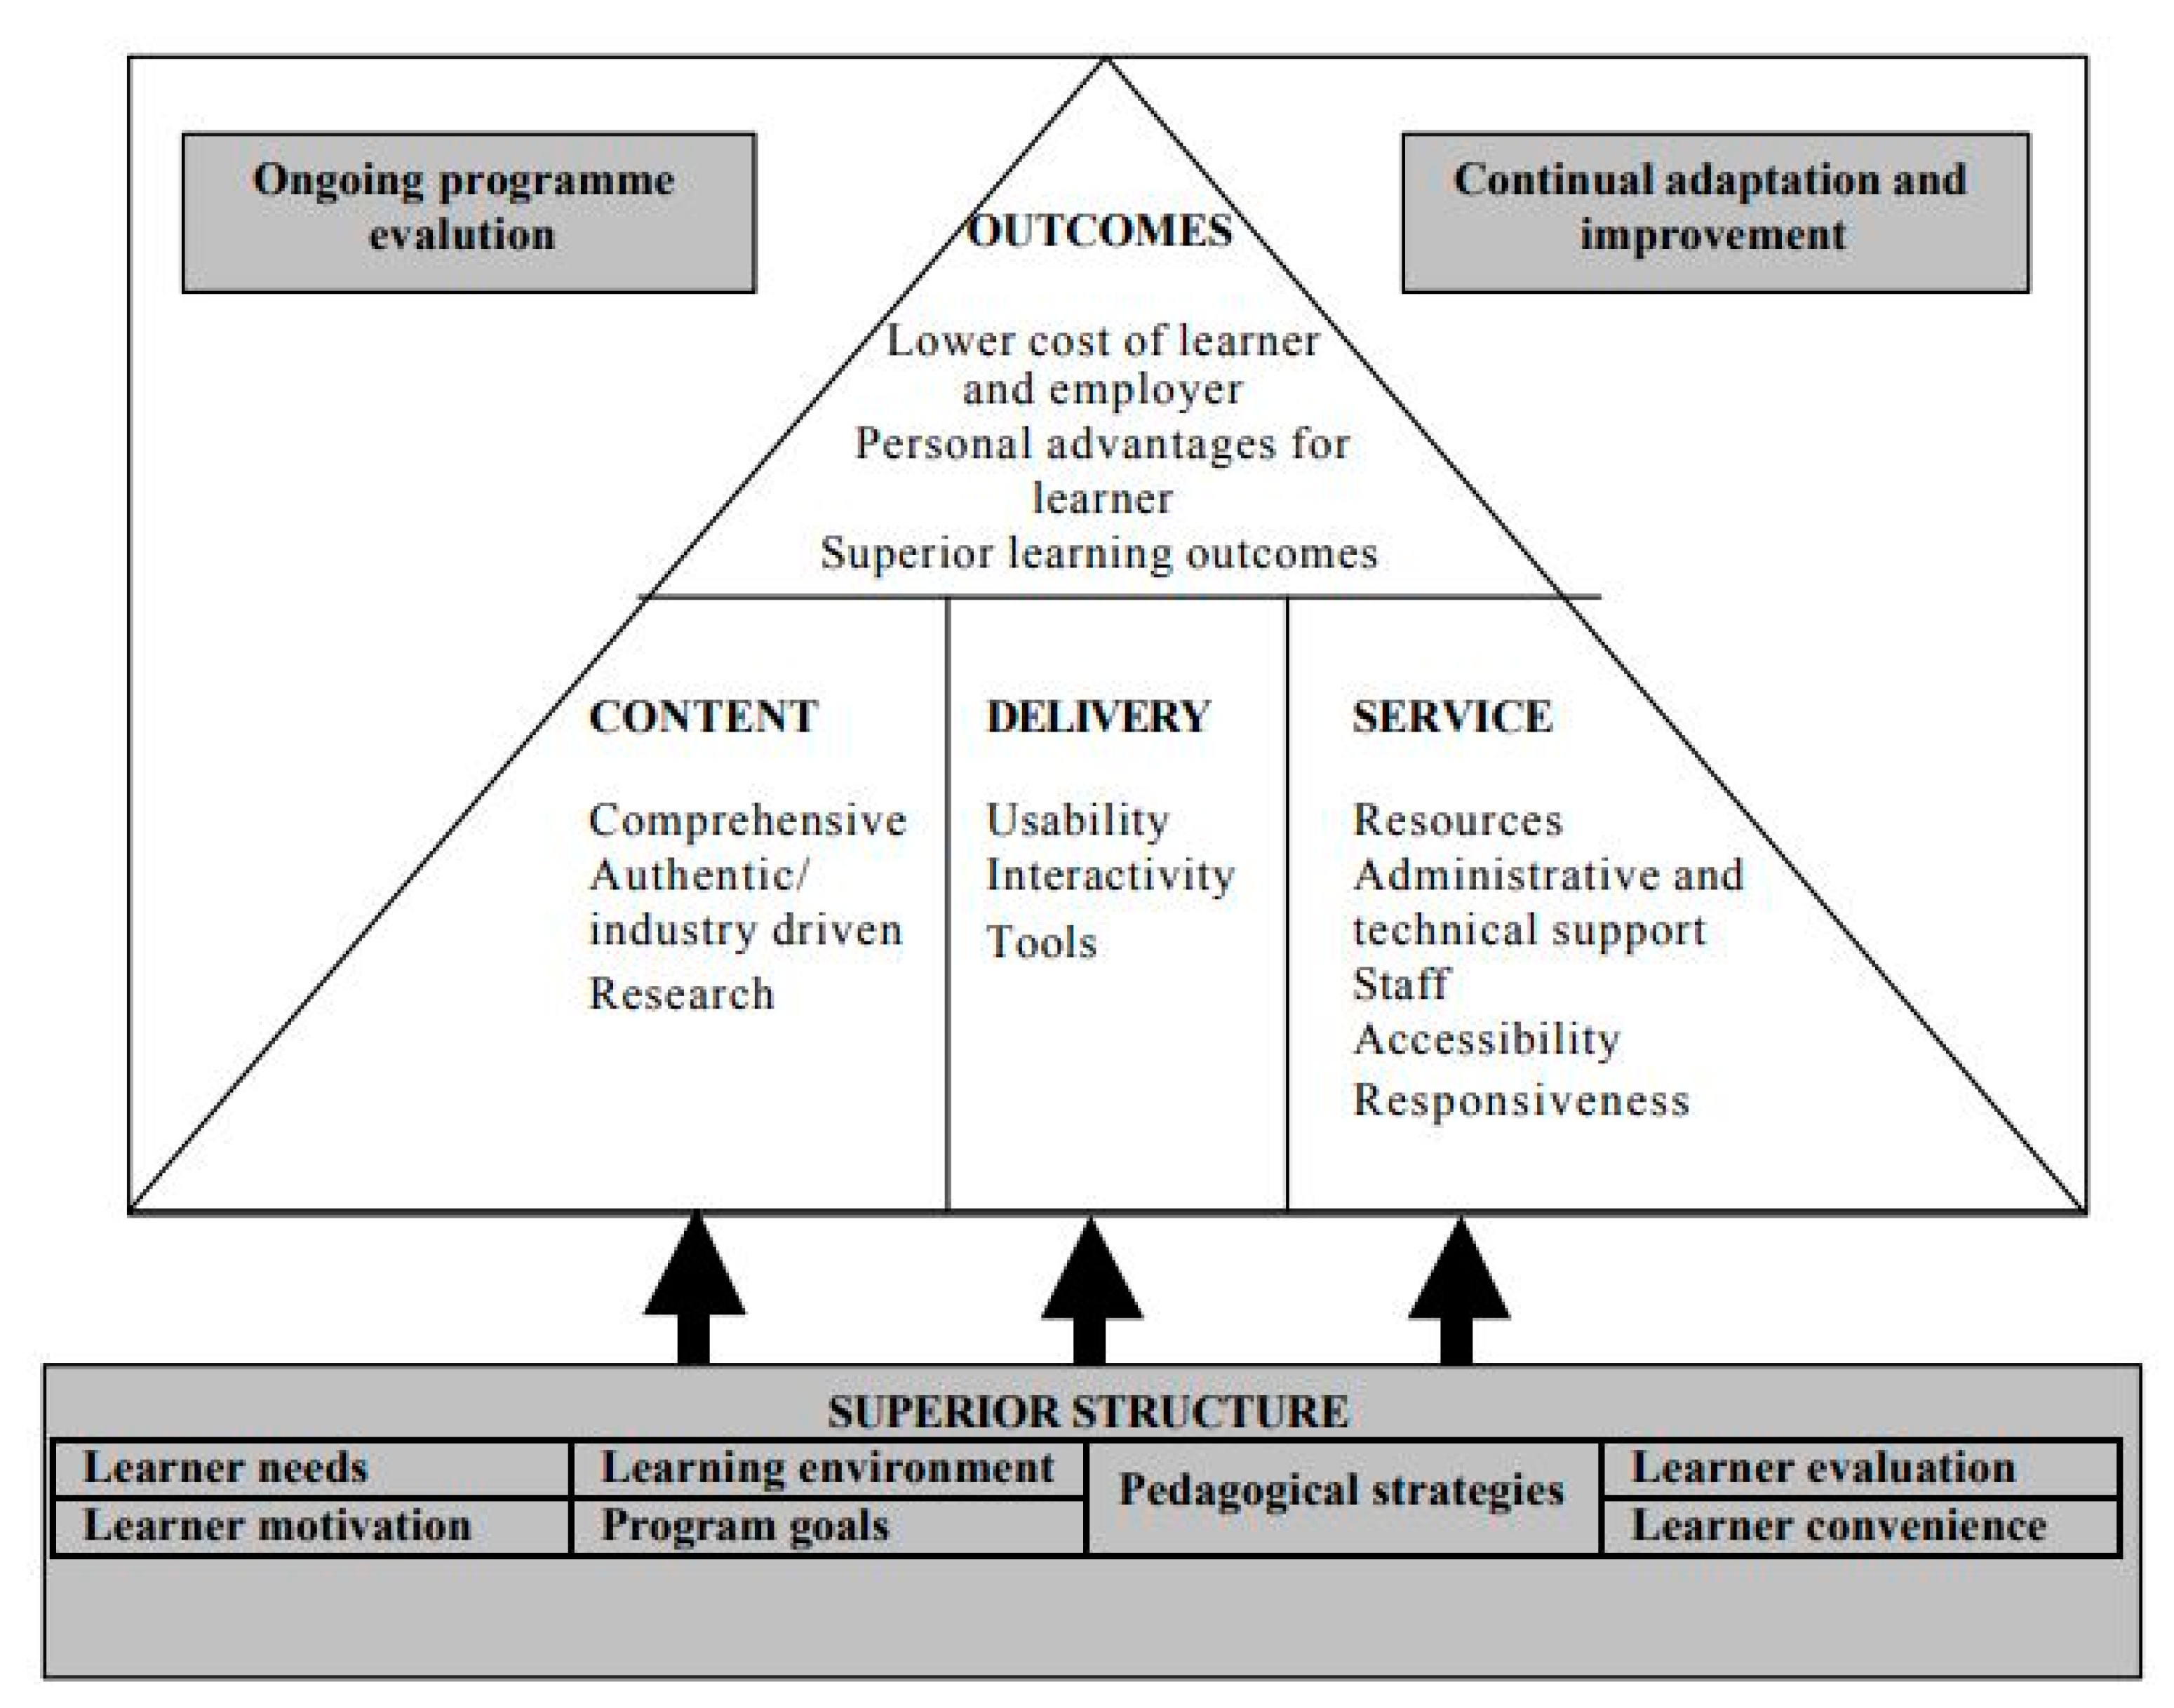
2.4. E-Learning Success Based on ELQ Model

E-Learning Quality Model was proposed by MacDonald et al. (2001) [41], to evaluate web-based learning (Figure 3). Many studies have been conducted using this E-Learning quality model and critically commented on its lacunas, complexion, diversity, and generalizability. Additionally, it becomes challenging to identify precise measurements suitable to evaluate E-Learning systems based on quality approaches as the criteria varies from one organization to another.
In proposing E-Learning success frameworks, most studies have adopted the intention to use or continuance measure as a token of success. Few studies have included the influence on learning or academic performance measures. There is a study that has shown the influence of perceived usefulness of E-Learning service on the academic performance of learners [42]. And one study has extended the TAM constructs to perceived learning assistance and perceived community building assistance, which in turn influence academic performance [43]. This study comprehensively explores different dimensions of E-Learning services and proposes constructs to measure them. Furthermore, to gauge success, two constructs are considered—perceived usefulness, and use of ELS, that in turn influence learning and academic performance as proposed in the next section.

3. Development of the Conceptual Model

With the help of extensive review of literature and application of these (TAM model [17], IS model [19], ELSS model [23], EESS model [24], ELQ model [25,44], ELS model [27], USM model [29]) models to evaluate E-Learning success and its impact on the learning and academic performance of students, the current study will focus on a four dimensional approach (Figure 4).
E-Learning service quality is considered as independent variables and will be measured with the help of five parameters, namely Learner’s Quality, Instructor’s Quality, Information Quality, System’s Quality, and Institutional Quality. Perceived usefulness and ease of use are considered as the moderating variables and academic performance is considered as the dependent variable. A detailed explanation of dependent, independent, and moderating variable is as follows.

3.1. E-Learning Service Quality/E-Learning Success Factors

The current study re-structures pre-defined parameters [24,32] to evaluate E-Learning success. Each parameter is further divided into four categories and each category into three instruments with its source of origin.

3.1.1. Learner’s Quality

Learner’s Quality is considered as one of the most important and highly influential parameters used by various researchers in previous studies to evaluate E-Learning success [45,46]. Many studies have been carried out with the inclusion of learner’s quality and concluded that it has a significant relationship with perceived usefulness and perceived ease of use, and has an influence on the academic performance of students [43]. The outcome of previous studies clearly indicates that learner’s quality has a positive influence on E-Learning success and its quality. Learner’s quality will be assessed using eight instruments in four categories. The four categories are learner’s attitude [24], learner’s behavior [47], learner’s self-efficacy [48], and learner’s peer interaction [49] as mentioned in Table 1. This study identifies the following hypothesis to check the learners’ influence on perceived usefulness, perceived satisfaction, and benefits of E-Learning.
Hypothesis 1a (H1a):
There is no significant impact of learner’s quality on perceived usefulness of ELS.
Hypothesis 1b (H1b):
There is no significant impact of learner’s quality on the use of ELS.

3.1.2. Instructor’s Quality

Instructor’s Quality is the second most important and widely used parameter [24] to assess E-Learning service quality. To evaluate instructor quality, all listed instruments with its origin were divided into four categories—namely reliability [47], assurance [50], empathy [50], and responsiveness [53] of the instructors. These four categories are the most commonly used parameters to measure service quality. Some of these studies found that instructor quality has a significant influence on perceived usefulness, perceived ease of use and academic performance of students. To cross-check the previous findings the current study proposes the following hypotheses with the inclusion of broader aspects of the Instructor’s Quality parameter.
Hypothesis 2a (H2a):
There is no significant impact of instructor’s quality on perceived usefulness of ELS.
Hypothesis 2b (H2b):
There is no significant impact of instructor’s quality on use of ELS.

3.1.3. Information Quality

Information quality is the third most important element and is given full consideration [24] to determine E-Learning success. High quality information and its logical presentation is an essential requirement for E-Learning success. Several studies have pointed out the significant relationship between information quality and perceived usefulness, perceived ease of use, and academic performance. The current study uses four different categories to assess information quality—namely contents [45], instructions [54], language [50], and modes of information [50], as mentioned in Table 1. Considering the importance of information and previous findings the current study also proposes the following hypotheses with the inclusion of broader aspects of information quality;
Hypothesis 3a (H3a):
There is no significant impact of information quality on perceived usefulness of ELS.
Hypothesis 3b (H3b):
There is no significant impact of information quality on use of ELS.

3.1.4. System’s Quality

Previous studies have also considered the educational system in terms of system quality [31] and examined its influence on perceived usefulness and perceived ease of use. Several studies developed a model to measure E-Learning success with the inclusion of system quality [50]. The current study considers system quality differently and gives full consideration to Learning Management Systems (LMS) under system quality. In the Kingdom of Saudi Arabia, most universities use Blackboard as a Learning Management System. To measure LMS quality all instruments are divided into four categories—namely multimedia support [54], interface design [55], functionality, and ease of use [51,56] as depicted in Table 1. To check the influence of LMS on perceived usefulness, perceived ease of use, and academic performance, the current study proposes the following hypotheses;
Hypothesis 4a (H4a):
There is no significant impact of system quality on perceived usefulness of ELS.
Hypothesis 4b (H4b):
There is no significant impact of system quality on use of ELS.

3.1.5. Institution’s Quality

Several studies have examined support system quality and its influence on perceived usefulness, perceived ease of use during E-Learning usage. During the literature search it was difficult to find any studies that used this construct separately and check its influence on academic performance. Instead of using this construct they have used support system quality [31] and environmental quality separately, and examined their influence on the use of E-Learning. The current study uses institutional quality as one of the important constructs to measure the successful implementation of E-Learning. All pre-defined instruments are grouped into four different categories—namely administrative support, financial support, stakeholder support, and environmental support. Environmental and administrative support are used frequently in their different forms [55]. None of the previous researchers introduced and used financial and stakeholder support. The current study also uses self-designed instruments to measure financial and stakeholder support as depicted in Table 1. The current study proposes the following hypothesis to examine the influence of institutional quality on perceived usefulness, perceived ease of use, and academic performance in a broader aspect.
Hypothesis 5a (H5a):
There is no significant impact of institution quality on perceived usefulness of ELS.
Hypothesis 5b (H5b):
There is no significant impact of institution quality on use of ELS.

3.2. Perceived Usefulness and Use of ELS

Perceived usefulness and ease of use are adopted from the TAM model and considered as independent constructs [17] in examining E-Learning success. To measure perceived usefulness, two instruments are identified—namely Blackboard increases my knowledge and Blackboard is useful and helpful to complete the task easily. To measure ease of use three constructs are defined as depicted in Table 1. Several studies found that perceived usefulness and use of ELS were positively associated with E-Learning success. The current study proposes the following hypothesis to examine the association between perceived usefulness and use of ELS and its direct influence on academic performance.
Hypothesis 6a (H6a):
There is no significant impact of perceived usefulness on use of ELS.
Hypothesis 6b (H6b):
There is no significant impact of perceived usefulness on learning and academic performance.
Hypothesis 6c (H6c):
There is no significant impact of use of ELS on learning and academic performance.

3.3. Learning and Academic Performance

The ultimate objective of E-Learning use is to enhance learning pedagogy and improve academic performance [42,43]. Other studies have been carried out to check the successful implementation of E-learning and its impact on the academic performance of students. Four instruments are designed to measure the academic performance of students using the E-Learning system as depicted in Table 1. The current study will make an attempt to examine the nature and magnitude of the association between E-Learning success and its impact on the academic performance of students. To check the association between the dependent and independent variables and their significance level, the current study proposes the following hypothesis with the help of the indirect path coefficient:
Hypothesis 7a (H7a):
There is no significant impact of Learner’s Quality on learning and academic performance.
Hypothesis 7b (H7b):
There is no significant impact of Instructor’s Quality on learning and academic performance.
Hypothesis 7c (H7c):
There is no significant impact of Information Quality on learning and academic performance.
Hypothesis 7d (H7d):
There is no significant impact of System Quality on learning and academic performance.
Hypothesis 7e (H7e):
There is no significant impact of Institutional Quality on learning and academic performance.

4. Materials and Methods

4.1. Design of Questionnaire and Its Process

An online survey was used to collect data for empirical testing. The constructs and its items were selected from the extensive literature review, expert opinion, and user’s feedback. A structured closed-ended questionnaire on five-point Likert scale was circulated among E-Learning experts and users with the help of Blackboard pop-up. An initial draft of the questionnaire was sent to the experts with three constructs—namely instructor quality, information quality, and system quality, for their opinion. Experts suggested the inclusion of learners’ quality to enhance and cover the broader aspects of evaluating E-Learning system success. Considering the suggestions from the experts, the second draft of the questionnaire with four constructs—instructor quality, information quality, system quality, and learner’s quality—was sent for pilot survey with an open-ended question “what are the other factors which are important to evaluate E-Learning system success”. The majority of experts suggested the inclusion of institutional quality as one of the separate constructs to measure E-Learning system success at any academic institute. After receiving many suggestions with the second draft, the third draft of the questionnaire was prepared and circulated among experts once again for their valuable suggestions. A meeting was arranged at the center of E-Learning at King Khalid University to discuss various constructs and their items—finalized in the third draft to assess E-Learning system success. After a healthy and fruitful discussion with the experts at the center of E-Learning, a final and fourth draft was prepared with 68 main questions divided into different constructs and items, plus nine questions in demographic sections. The questionnaire was sent to an expert once again to check the validity of the construct and its items. Some minor suggestions were received to modify the item statements for the simplicity and were incorporated accordingly. All five main constructs were equally divided into four categories to maintain uniqueness and simplicity as per the suggestions received by the E-Learning expert, and are presented in Table 1.

4.2. Study Design and Data Collection

The design of the study was empirical in nature. To test the proposed theoretical model, a structured and close-ended questionnaire was designed based on an extensive review of the latest related studies. A pilot survey was conducted with the final draft of the questionnaire to check the validity and reliability of constructs, the category, and their items. Cronbach’s alpha was used to determine the reliability of the questionnaire. Cronbach’s alpha coefficient for pilot study responses was calculated as 0.947. The final and fifth draft was sent for translation in the local language of Saudi Arabia (Arabic). The questionnaire was translated into the Arabic language to generate an exact response from the students. The accuracy of Arabic translation was checked by retranslating the Arabic version of the questionnaire into English. The survey was conducted online using Google Forms. The link of the Google Form was distributed among respondents using a Pop-up on universities’ websites, college websites, Blackboard, and through personal contacts (Table 1).

4.3. Study Variables and Their Items

The first section of the questionnaire focused on the sociodemographic information of participants such as gender, knowledge about E-Learning, level of E-Learning knowledge, whether they were currently using E-Learning, satisfaction from E-Learning, types of E-Learning use, year of E-Learning usage, area of study, and university. The second section of the questionnaire consisted of five independent variables—namely learner quality, instructor quality, information quality, system quality, and instructor quality. The third section of the questionnaire was formulated with the help of two intervening/moderating variables—namely perceived usefulness and use of E-Learning services. The fourth and last section of the questionnaire contained the information related to the dependent variable—namely learning and academic performance of students (Table 1).

4.4. Target Population and Sample

The target population for this study was enrolled students of five universities of the southern province of Saudi Arabia—namely King Khalid University, Albaha University, Jazan University, Najran University, and Bisha University. The size of the target population was roughly calculated as 250,000 students which was difficult to cover. To get an appropriate number, true representative of target population, and easy handling at various stages, a minimum required sample size was determined by using the following formula:
n = z 2 ( p ) ( q ) e 2
where, n = Sample Size; z = 1.96 (95% confidence level); p = prevalence level (0.5 used for sample size needed); q = (1 − p); e = error term (0.05)
By inserting values into the formula, the sample size would be:
n = 1.96 2 ( 0.50 ) ( 0.50 ) 0.05 2
n = 3.8416   ( 0.25 ) 0.0025
n = 0.9604 0.0025
Sample Size (n) = 384.16.
The calculated sample size was verified by using an online sample size calculator named raosoft. The raosoft produced a 384 sample size with a target population of 250,000. Hence any number greater than or equal to 384 was considered as the minimum required sample size for this study.

4.5. Data Collection, Preparation and Management

To commence the survey procedure, English and Arabic versions of the questionnaire were uploaded on Blackboard as a pop-up link with the help of E-Learning centers at the different universities. During a one-month period, a total of 462 responses were received. Responses were downloaded in Excel sheets and checked for appropriateness of response for further analysis. After exclusion of 65 incomplete responses, a total of 397 responses were deemed fit for further analysis and found to be sufficient [44,45,46]. Demographic items with the descriptions of the respondents were presented (Table 2).

4.6. Statistical Analysis
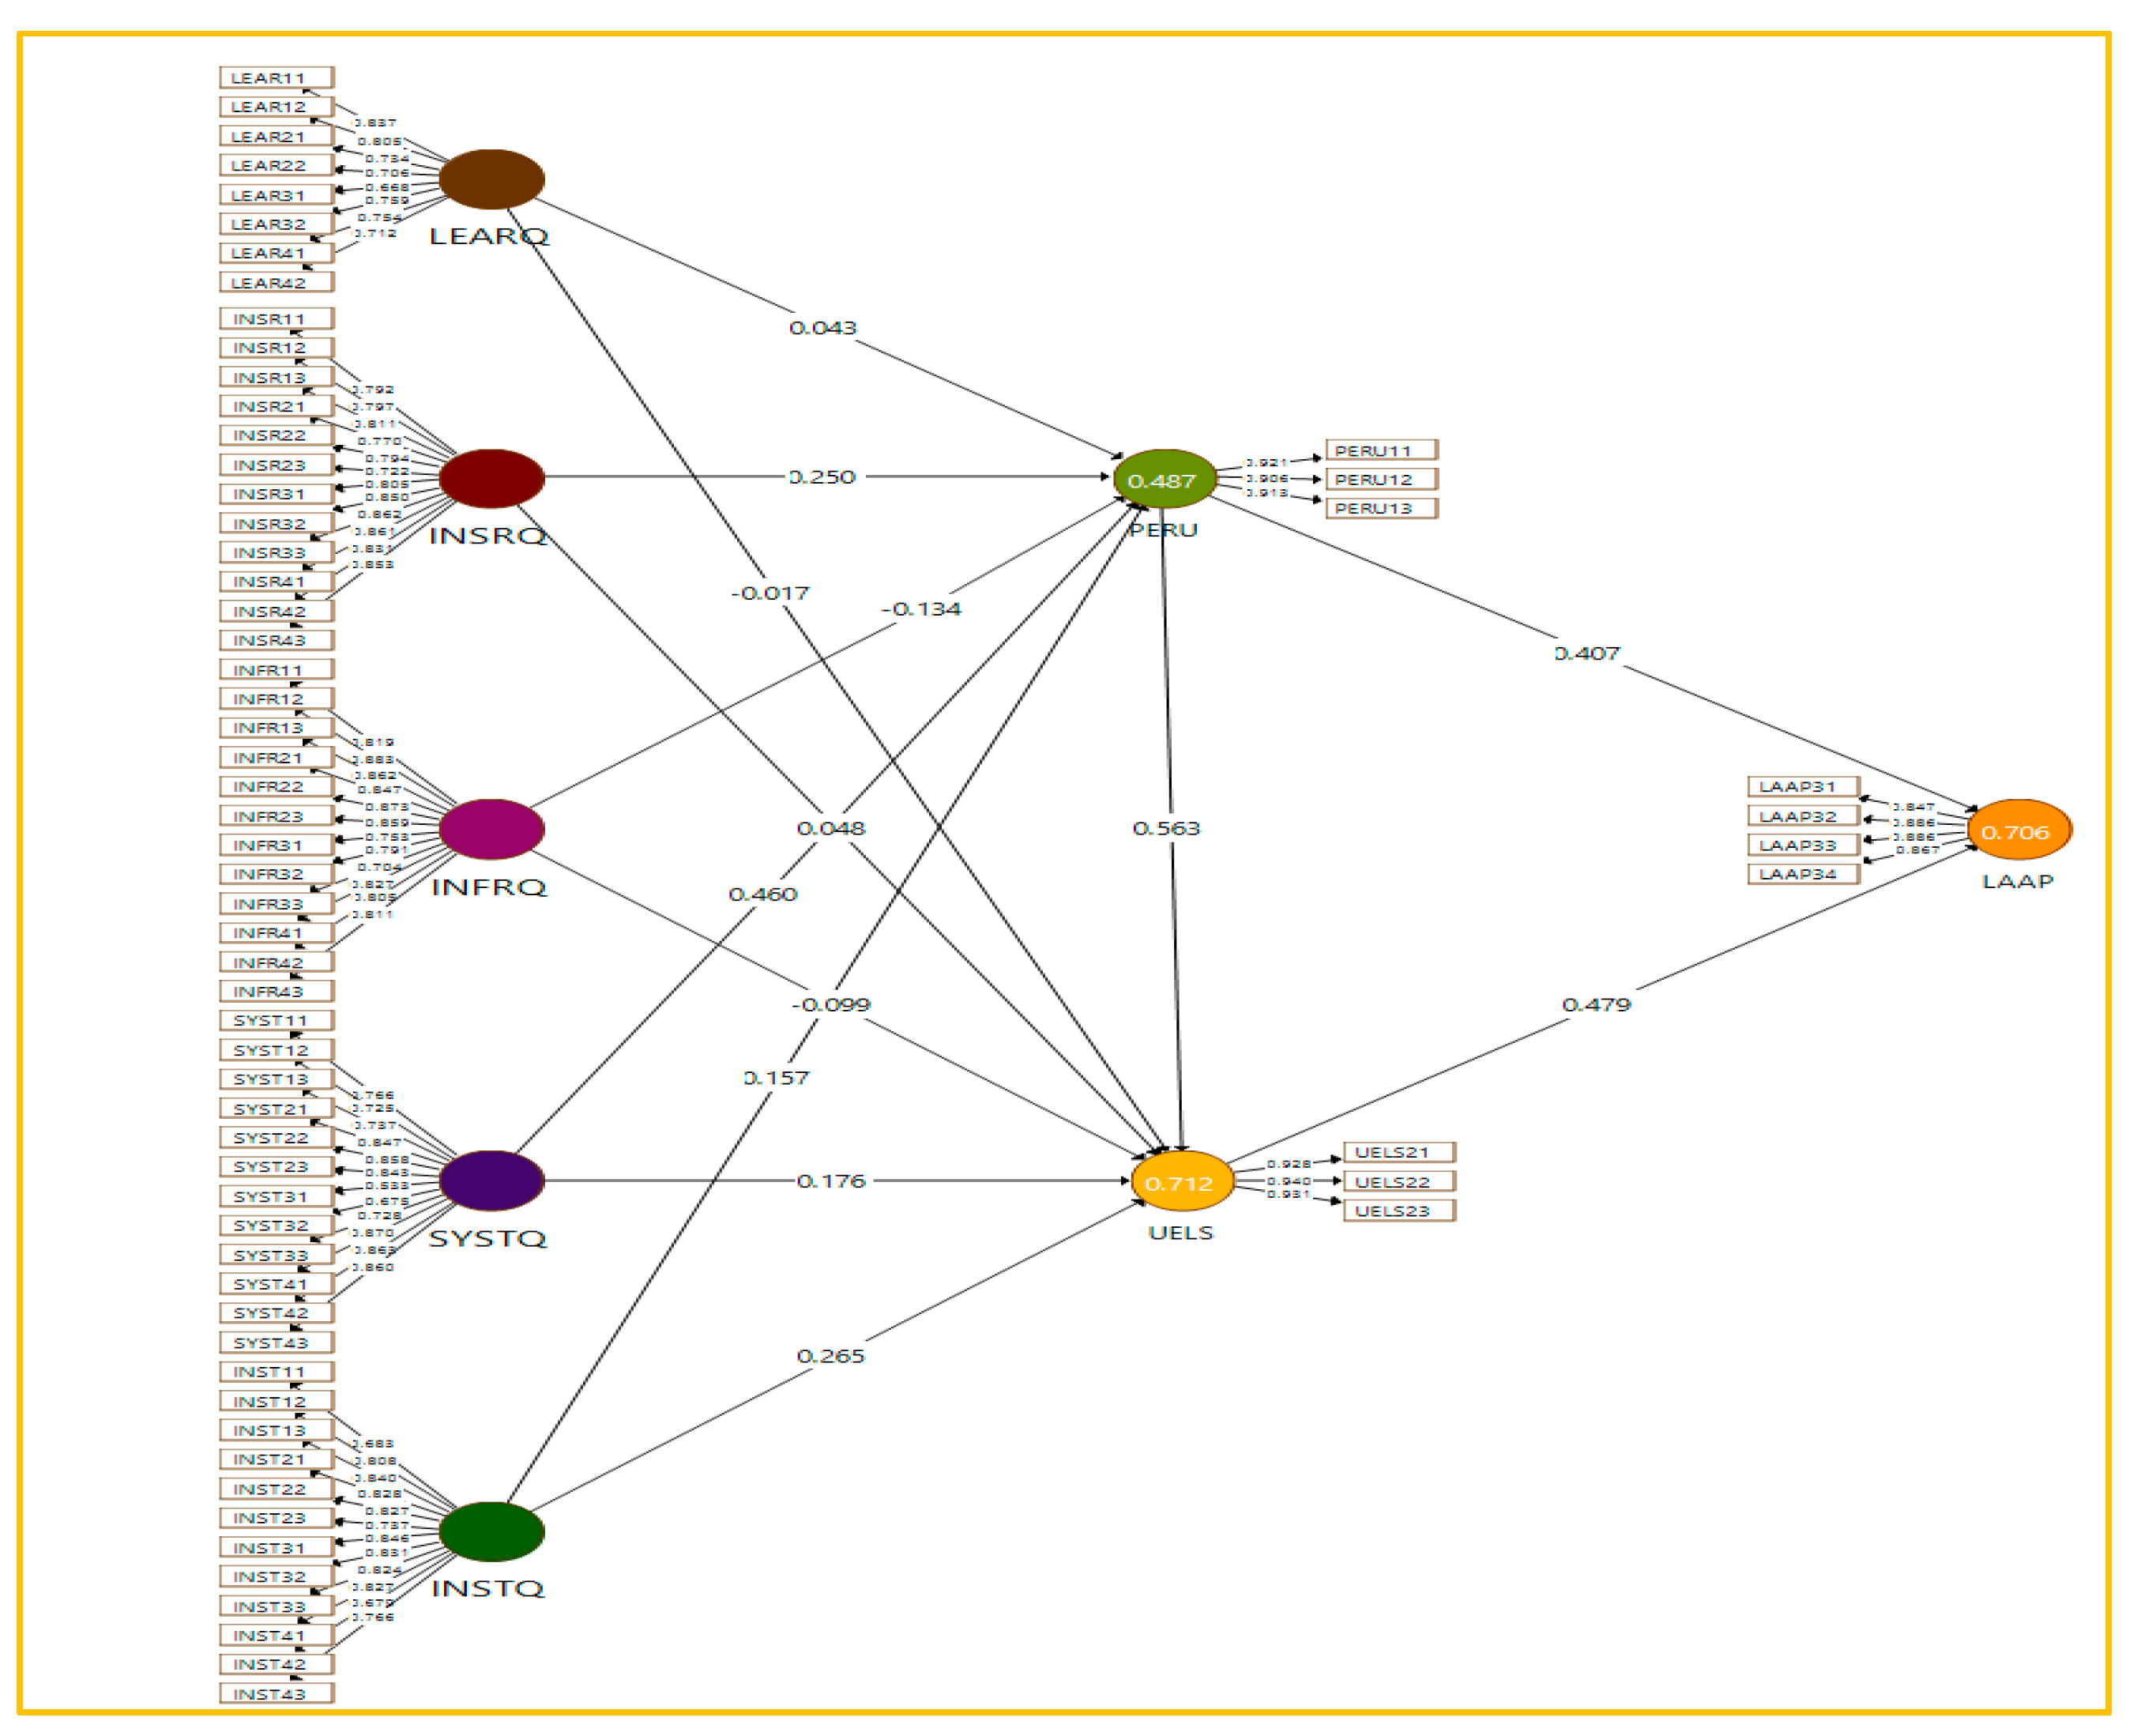
Data were analyzed by using SmartPLS version 3.2.9. PLS-SEM largely focuses on the interaction between prediction and theory testing and results should be validated accordingly. Initial Factor Loading, Cronbach’s Alpha, Composite Reliability, and Average Variance Extracted were calculated to check the reliability of the model followed by Fornell–Larcker discriminant validity and Heterotrait–Monotrait (HTMT) correlation analysis was applied to check the validity of items, constructs, and proposed model. The first step of analysis involves examining the measurement models. The proposed model is reflective in nature, so indicator loading was calculated to assess the model. Secondly, Cronbach’s alpha and composite reliability was calculated to assess the internal consistency of the model. Thirdly, convergent validity of each construct was calculated with the help of average variances extracted for all items of each construct to explain the variance of its items. Next, discriminant validity was calculated for each construct to check the validity of the model as proposed by Fornell–Larcker (1981) [57]. Finally, the mean value of item correlation of each construct was calculated with the help of Heterotrait–Monotrait (HTMT) ratio as suggested by Henseler et al. (2015) [58]. Hypothesis were tested with the help of t test and their significance level using p value.

5. Results

A different pedagogy was used to develop a theoretical model and its empirical testing. More precisely, researchers were categorized into two group on the basis of adoption of statistical tools for validation of model. The first group of the researchers used factor analysis and regression analysis in the past to confirm their research findings which seems basic, preliminary, and outdated in the current advanced era, while the second group used Structured Equation Modelling (SEM) which is the latest, most refined, and has multiple added advantages over the former. Further, SEM used were two types, Partial Least Square SEM and Covariance-Based SEM. The current study used partial least square structural equation modelling (PLS-SEM) as a statistical tool with the help of SmartPLS advanced version 3.2.9 to test the measurement structure, reliability, and validity of the model.
The model was assessed and examined using the following steps:
  • Indicator reliability with the help of outer loadings which should be ≥0.70 for each indicator.
  • Internal Consistency Reliability with the help of Cronbach’s alpha (α) and composite reliability (CR). The minimum threshold value ≥ 0.70 for both test.
  • Validity was examined and assessed with the following two criterion;
  • Convergent Validity was checked with the help of Average Variance Extracted (AVE) should be ≥ 0.50.
  • Discriminant Validity was examined with the help of Fornell–Larcker Criterion, Cross Loadings and Heterotrait–Monotrait (HTMT) ratio.
First, The Outer Loading of all 70 items were analyzed (Table 3). Six items had outer loading between 0.40 and 0.70 and were also retained based on the following suggestion of Hair et al. (2010): Outer loading <0.40 delete the item from the model.
  • Outer loading >0.70 retain the item.
  • Outer loading ≥0.40 <0.70 then analyze the impact of deleting items on Average Variance Extracted and Composite Reliability. If the impact is minimum retain the items otherwise delete the items from model.
As a result, all 70 items were retained in original form to measure the E-Learning Service and its impact on academic performance.
Second, to test the internal consistency and validity of the model, Cronbach’s Alpha (α), composite reliability (CR), and Average Variance Extracted (AVE) were calculated (Table 3). The outcome demonstrates that Cronbach’s alpha (α) and composite reliability (CR) for all constructs was greater than the minimum required value (0.70) [59]. All constructs were found reliable for the model of this study. The Average Variance Extracted (AVE) was analyzed (Table 3). As depicted in the results, the AVE of all constructs was more than 0.50, hence convergent validity was acceptable for all constructs [57].
Third, Fornell–Larcker coefficient of correlation was determined (Table 4) to check the discriminant validity. The result of Fornell–Larcker correlation clearly indicates that the correlation value in diagonal is higher among all in the same column (highlighted with bold). As proposed by [58], HTMT analysis was carried out to re-examine and confirm discriminant validity (Table 5). HTMT correlation is the relationship for the same construct, just like autocorrelation. The outcome of HTMT analysis demonstrates the value of correlation with the same construct under acceptable range, i.e., less than or equal to 0.90.
Fourth, Structural Path Coefficients (β values) were calculated using SmartPLS to express the relationship between constructs and their items (Figure 5). Value of t test and their significance level was used to test whether the path coefficient (β- values) were statistically significant or not with 5% level of significance. The result of direct path coefficient (β values), t value, and p-value were determined and presented (Table 6) to examine the nature and strength of association. Indirect path coefficient (β-values), t value and p value were calculated and presented (Table 7) to check the influence of independent construct on learning and academic performance of students. As depicted in direct path coefficient (Figure 3) 48.7% perceived usefulness of ELS were explained by the five constructs—namely learner’s quality, instructor’s quality, information quality, system quality, and institutional quality. In total, 71.2% use of ELS is explained by all five constructs while 56.3% use of ELS is explained by only perceived usefulness of ELS. Learning and academic performance (LAAP) of students highly (48.7%) depends on the perceived usefulness of ELS, while learning and academic performance of students explained with the use of ELS is 47.9%. Perceived usefulness of ELS and use of ELS together explain 70.6% of learning and academic performance of students.

6. Discussion

The outcome of the study strongly supported H0 1a and H0 1b with a higher p-value (0.427) and (0.882) respectively, which clearly indicates that perceived usefulness of ELS and use of ELS does not depend on learner’s quality. Learner’s quality is not significantly associated with perceived usefulness of ELS and use of ELS. As many studies [60] have pointed out, the importance of learner’s influence on perceived usefulness of ELS and use of ELS in a global context are recorded, but findings of the current study contradict the finding of previous studies at the local level. First, the most important driving force behind the insignificant influence of learner’s quality on perceived usefulness of ELS and use of ELS is a variety of types of E-Learning users as indicated in Table 2. In total, 53.90% of respondents categorized themselves as the blended-1 type of E-Learning users which states that they are using only 30% E-Learning, while the remaining 70% is in a traditional mode. More specifically blended-1 can be categorized as a beginner category of E-Learning users, where they are using only the basics of E-Learning like course information, course contents, assessment criteria, assignments, and discussions. Blended-2 type of E-Learning users constitute 14%, and this means 50% E-Learning and the remaining 50% through traditional mode. Full E-Learning users are only 17%, and can better understand the perceived usefulness of ELS and use of ELS than the other type of users of E-Learning. The second important reason behind the insignificant influence of learner’s quality on perceived usefulness of ELS and use of ELS is a low level of E-Learning knowledge. A total of 44% of respondents reported average or below average knowledge of E-Learning and this might be one of the important reasons that the learner is not able to decide whether E-Learning is useful or not. The third reason for the insignificant influence of learner’s quality on perceived usefulness of ELS and use of ELS is the low level of experience of using E-Learning services. A total of 30% respondents just started using E-Learning services so they might be in a dilemma to decide whether it is useful or not.
Hypothesis H0 2a and H0 2b are not supported which demonstrates that the instructor’s quality is directly and significantly associated with perceived usefulness of ELS and use of ELS. The current finding confirms the previous findings [24,61] which state that the instructor is considered as one of the most important factors for the successful adoption and implementation of E-Learning systems at academic institutions. The reliability, responsiveness, assurance, and empathy of instructors provide support, guidance, and motivation to the learners towards the use of E-Learning system. Perceived usefulness of ELS highly (25%) depends on the instructor’s quality, whereas on the other side, use of ELS is only 4.8% influenced by the instructor’s quality. One of the important reasons behind the lesser influence of instructor’s quality on use of ELS is the respondents’ area of study as indicated in Table 2. More than half of the respondents belong to the Medical and Applied Medical science category and their course design focuses on clinical or laboratory training; hence it becomes difficult for the beginners to use E-Learning services.
The outcome of the study has supported null hypotheses H0 3a with a p-value greater than 0.05 which clearly indicates that perceived usefulness of ELS is not significantly influenced by information quality. As depicted in Table 6, β coefficient states that 100% variation in information quality leads to a 13.4% adverse impact on perceived usefulness of ELS. This might be possible due to the mode of study being in English language but their understanding of English is very basic, so they might be confused with variety and quality of information and unable to decide whether it is useful or not. Hypothesis H0 3b is not supported by the data which indicates that the use of ELS is significantly influenced by the quality of information. This might be due to some essential, motivating, and interactive usage of information through Blackboard by the learner in the form of announcements, discussions, assignments, quizzes, and access to learning materials.
Hypotheses H04a and H04b are not supported with a lower p-value (0.001) which confirms that multimedia support, interface design, functionality, and ease of use have a greater influence on perceived usefulness of ELS and use of E-Learning system. System quality items like proper use of audio, video, animation, text font, color and style, speed and capacity of the system attract learners toward E-Learning usage and contribute to their perceived satisfaction of E-Learning systems. The current study confirms the finding of [24,28,31,62].
Hypotheses H0 5a and H0 5b are not supported by the data with lower p-values 0.040 and 0.001 respectively, which demonstrates that institutional quality has a direct and significant impact on perceived usefulness of ELS and use of E-Learning system. This result confirms the outcome of previous studies [24]. Administrative support like top management, effective policy to promote E-Learning, and conducive environment are positively associated with perceived usefulness of ELS and use of E-Learning system. Financial support like funding for hardware and software updates, and monetary benefits to stakeholders have a greater influence on perceived usefulness of ELS and use of E-Learning system. Stakeholder training like knowledge of trainers and modes of training are positively associated with perceived usefulness of ELS and use of E-Learning system. Environmental Support by an academic institution like incentives for E-Learning adoption, deanship to handle E-Learning, and social recognition for best performer have a greater influence on perceived usefulness of ELS and use of E-Learning system.
Hypotheses H0 6a, H0 6b, and H0 6c are not supported by the data with a lower p-value (0.001) which states that perceived usefulness of ELS has a significant positive influence on the use of ELS. β coefficient value (0.563) states that 100% increase in perceived usefulness of ELS will lead to 56.3% increase in the use of ELS and vice versa. Perceived usefulness of ELS is one of the most important determinants in determining the use of ELS. Among all five independent constructs, perceived usefulness of ELS highly depends on the system’s quality (46%) followed by the instructor’s quality (25%) and institution quality (15%). Altogether these three independent constructs explain 86% of perceived usefulness of ELS. In other words, it can be concluded that the use of ELS highly depends on system quality, instructor quality, and institution quality.
Hypotheses H07a is supported by the data with higher p-value (0.610), which states that learning and academic performance of students does not depend on learner’s quality. The outcome of this hypothesis contradicts the findings of previous studies [24]. There are many possible reasons behind the negative impact of learner’s quality on learning and academic performance of students. The most important among all are the student’s interest in using ELS, types of ELS use, duration of E-Learning use, and the area of study as indicated in Table 2.
Hypothesis H07b, H07c, H07d, and H07e are not supported with a lower p-value than 0.05 as indicated in Table 7, which clearly indicates that learning and academic performance of students have a positive and significant association with instructor quality, system quality, and institution quality while showing a negative significant association with information quality. Learning and academic performance of students are determined 19.2% with instructor quality, 23.3% with institution quality, and 39.6% with system quality. More specifically, it can be concluded that in an E-Learning environment and its impact on learning and academic performance, the most influential construct is system quality followed by institution quality and instructor quality.

7. Conclusions

Firstly, an attempt has been made to develop E-Learning service determinants with a self-defined instrument within the periphery of existing instruments to ensure success of E-Learning. Secondly, to evaluate the impact of E-Learning service on sustainable learning and academic performance of students, a model was proposed. The proposed model includes a broader aspect of quality measures with five main determinants (construct) namely learner’s quality, instructor’s quality, system quality, information quality, and institutional quality. Each construct is further divided into four subgroups for the sake of simplicity and then three items for each subgroup were defined to measure E-Learning Service success at academic institutes. The proposed model was empirically tested with the help of a survey from stakeholders of E-Learning from existing universities in the southern region of Saudi Arabia. The study concludes that in determining the E-Learning service at academic institutes, the most important constructs are perceived usefulness of ELS followed by institutional quality, system quality, and instructor quality. To determine the learning and academic performance of students the most influential construct is the use of E-Learning system (71.2%), followed by perceived usefulness (48.7%), system quality (46%), institutional quality (26.5%), and instructor quality (25%). The proposed model is the advancement of ISSM model, TAM model, User satisfaction model, E-Learning quality model and EESS model. The proposed model is unique with its bi-dimensional features. On one hand it provides more scientific explanation and easy understanding of each instrument to evaluate E-Learning service success at academic institutes, while on the other hand, the proposed model allows for assessing the impact of E-Learning service on learning and academic performance of students.
The major limitation of this proposed model to measure E-Learning service performance and its impact on learning and academic performance of students is the inclusion of all types of E-Learning users in different blended ratios from partial to full. For a better and fair evaluation of the model, only full E-Learning users should be included in future studies. The current study was limited to the existing universities in the southern region of Saudi Arabia. Future studies could explore in a broader geographical context with a larger sample size. The items of determinant constructs explain only 71% use of E-Learning services so there is a need to include more extraneous instruments in each construct. More external factors need to be examined to determine more accurately the success of the E-Learning system. On the other hand, the proposed model predicts only 70% to assess learning and academic performance of students by including all determinant constructs so there is a need of further investigation about external factors responsible for learning and academic performance of students in E-Learning environments.

Author Contributions

Conceptualization, M.M.A., N.A., M.A.K. and Q.N.N.; methodology, M.M.A. and Q.N.N.; software, M.M.A., M.A.K. and Q.N.N.; writing—original draft preparation, M.M.A., N.A and Q.N.N.; writing—review and editing, M.M.A. and N.A.; supervision, A.P., M.A.K. and M.A.; project administration, M.A. and A.P. All authors have read and agreed to the published version of the manuscript.

Funding

This research was funded by Deanship of Scientific Research, King Khalid University, Abha, grant number G.R.P-138–40.

Institutional Review Board

Not applicable.

Informed Consent Statement

Not applicable.

Data Availability Statement

The data presented in this study are available on request from the corresponding author. The data are not publicly available due to Institutional Policy.

Acknowledgments

The authors extend their appreciation to the Deanship of Scientific Research at King Khalid University for funding this work through the General Research Project under grant number G.R.P-138–40.

Conflicts of Interest

The authors declare no conflict of interest.

References

  1. Ahmad, N. Cloud computing: Technology, security issues and solutions. In Proceedings of the 2nd International Conference on Anti-Cyber Crimes (ICACC), Abha, Saudi Arabia, 26–27 March 2017; pp. 30–35. [Google Scholar] [CrossRef]
  2. Irfan, M.; Ahmad, N. Internet of medical things: Architectural model, motivational factors and impediments. In Proceedings of the 15th Learning and Technology Conference (L&T), Jeddah, Saudi Arabia, 25–26 February 2018; pp. 6–13. [Google Scholar]
  3. Khan, N.; Naim, A.; Hussain, M.R.; Naveed, Q.N.; Ahmad, N.; Qamar, S. The 51 V’s of Big Data: Survey, Technologies, Characteristics, Opportunities, Issues and Challenges. In Proceedings of the International Conference on Omni-Layer Intelligent Systems, Crete, Greece, 5–7 May 2019; pp. 19–24. [Google Scholar]
  4. Ahmad, N.; Mehmood, R. Enterprise systems: Are we ready for future sustainable cities. Supply Chain Manag. Int. J. 2015, 20, 264–283. [Google Scholar] [CrossRef]
  5. Ahmad, N.; Mehmood, R. Enterprise Systems for Networked Smart Cities. In Deep Learning and Edge Computing Solutions for High Performance Computing; Springer International Publishing: Berlin/Heidelberg, Germany, 2019; pp. 1–33. [Google Scholar]
  6. Naveed, Q.N.; Qureshi, M.R.N.M.; Shaikh, A.; Alsayed, A.; Sanober, S.; Mohiuddin, K. Evaluating and Ranking Cloud-Based E-Learning Critical Success Factors (CSFs) Using Combinatorial Approach. IEEE Access 2019, 7, 157145–157157. [Google Scholar] [CrossRef]
  7. Noorulhasan, Q.; Muhammad, A.; Sanober, S.; Rafik, M.; Shah, A.; Naveed, Q.N.; Qureshi, M.R.N. A Mixed Method Study for Investigating Critical Success Factors (CSFs) of E-Learning in Saudi Arabian Universities. Int. J. Adv. Comput. Sci. Appl. 2017, 8, 171–178. [Google Scholar] [CrossRef] [Green Version]
  8. Ahmad, N.; Hoda, N.; AlAhmari, F. Developing a Cloud-Based Mobile Learning Adoption Model to Promote Sustainable Education. Sustainability 2020, 12, 3126. [Google Scholar] [CrossRef] [Green Version]
  9. Hassanzadeh, A.; Kanaani, F.; Elahi, S. A model for measuring e-learning systems success in universities. Expert Syst. Appl. 2012, 39, 10959–10966. [Google Scholar] [CrossRef]
  10. Sawangchai, A.; Prasarnkarn, H.; Kasuma, J.; Polyakova, A.G.; Qasim, S. Effects of COVID-19 on digital learning of entrepreneurs. Pol. J. Manag. Stud. 2020, 22, 502–517. [Google Scholar] [CrossRef]
  11. Smoląg, K.; Ślusarczyk, B.; Kot, S. The Role of Social Media in Management of Relational Capital in Universities. Prabandhan Indian J. Manag. 2016, 9, 34. [Google Scholar] [CrossRef]
  12. Zhang, T.; Shaikh, Z.A.; Yumashev, A.V.; Chłąd, M. Applied Model of E-Learning in the Framework of Education for Sustainable Development. Sustainability 2020, 12, 6420. [Google Scholar] [CrossRef]
  13. Elkington, J. The triple bottom line for twenty-first-century business. In Companies in a World Conflict: NGOs, Sanctions and Corporative Responsibility; Earthscan: London, UK, 1998. [Google Scholar]
  14. United Nations. Indicators of Sustainable Development: Guidelines and Methodologies; United Nations Division for Sustainable Development: Geneva, Switzerland, 2001. [Google Scholar]
  15. Muhammad, A.; Shaikh, A.; Naveed, Q.N.; Qureshi, M.R.N. Factors Affecting Academic Integrity in E-Learning of Saudi Arabian Universities. An Investigation Using Delphi and AHP. IEEE Access 2020, 8, 16259–16268. [Google Scholar] [CrossRef]
  16. Ahmad, N.; Quadri, N.N.; Qureshi, M.R.N.; Alam, M.M. Relationship Modeling of Critical Success Factors for Enhancing Sustainability and Performance in E-Learning. Sustainability 2018, 10, 4776. [Google Scholar] [CrossRef] [Green Version]
  17. Davis, F.D.; Venkatesh, V. A critical assessment of potential measurement biases in the technology acceptance model: Three experiments. Int. J. Human Comput. Stud. 1996, 45, 19–45. [Google Scholar] [CrossRef] [Green Version]
  18. Sarbaini, S. Managing e-learning in public universities by investigating the role of culture. Pol. J. Manag. Stud. 2019, 20, 394–404. [Google Scholar]
  19. Delone, W.H.; McLean, E.R. The DeLone and McLean Model of Information Systems Success: A Ten-Year Update. J. Manag. Inf. Syst. 2003, 19, 9–30. [Google Scholar] [CrossRef]
  20. Parasuraman, A.; Zeithaml, V.; Berry, L. SERVQUAL: A multiple-item scale for measuring consumer perceptions of service quality. Retail. Crit. Concepts 2002, 64, 140. [Google Scholar]
  21. Sadaf, A.; Newby, T.J.; Ertmer, P.A. Exploring Factors that Predict Preservice Teachers’ Intentions to Use Web 2.0 Technologies Using Decomposed Theory of Planned Behavior. J. Res. Technol. Educ. 2012, 45, 171–196. [Google Scholar] [CrossRef]
  22. Cardona, M.M.; Bravo, J.J. Service quality perceptions in higher education institutions: The case of a colombian university. Estud. Gerenc. 2012, 28, 23–29. [Google Scholar] [CrossRef] [Green Version]
  23. Alsabawy, A.Y.; Cater-Steel, A.; Soar, J. IT infrastructure services as a requirement for e-learning system success. Comput. Educ. 2013, 69, 431–451. [Google Scholar] [CrossRef]
  24. Al-Fraihat, D.; Joy, M.; Masa’Deh, R.; Sinclair, J. Evaluating E-learning systems success: An empirical study. Comput. Hum. Behav. 2020, 102, 67–86. [Google Scholar] [CrossRef]
  25. Waheed, M.; Kaur, K.; Qazi, A. Students’ perspective on knowledge quality in eLearning context: A qualitative assessment. Internet Res. 2016, 26, 120–145. [Google Scholar] [CrossRef]
  26. Vasconcelos, P.; Furtado, E.S.; Pinheiro, P.; Furtado, L. Multidisciplinary criteria for the quality of e-learning services design. Comput. Hum. Behav. 2020, 107, 105979. [Google Scholar] [CrossRef]
  27. Asoodar, M.; Vaezi, S.; Izanloo, B. Framework to improve e-learner satisfaction and further strengthen e-learning implementation. Comput. Hum. Behav. 2016, 63, 704–716. [Google Scholar] [CrossRef]
  28. Yilmaz, R. Exploring the role of e-learning readiness on student satisfaction and motivation in flipped classroom. Comput. Hum. Behav. 2017, 70, 251–260. [Google Scholar] [CrossRef]
  29. Kanwal, F.; Rehman, M. Measuring Information, System and Service Qualities for the Evaluation of E-Learning Systems in Pakistan. Pak. J. Sci. 2016, 68, 302–307. [Google Scholar]
  30. Stuss, M.M.; Szczepańska-Woszczyna, K.; Makieła, Z.J. Competences of Graduates of Higher Education Business Studies in Labor Market I (Results of Pilot Cross-Border Research Project in Poland and Slovakia). Sustainability 2019, 11, 4988. [Google Scholar] [CrossRef] [Green Version]
  31. Cidral, W.A.; Oliveira, T.; Di Felice, M.; Aparicio, M. E-learning success determinants: Brazilian empirical study. Comput. Educ. 2018, 122, 273–290. [Google Scholar] [CrossRef] [Green Version]
  32. Klobas, J.E.; McGill, T.J. The role of involvement in learning management system success. J. Comput. High. Educ. 2010, 22, 114–134. [Google Scholar] [CrossRef]
  33. Eom, S.; Ashill, N.J.; Arbaugh, J.; Stapleton, J.L. The role of information technology in e-learning systems success. Hum. Syst. Manag. 2012, 31, 147–163. [Google Scholar] [CrossRef]
  34. Davis, F.D. Perceived usefulness, perceived ease of use, and user acceptance of information technology. MIS Q. 1989, 13, 319–340. [Google Scholar] [CrossRef] [Green Version]
  35. Cyert, R.M.; March, J.G. A Behavioral Theory of the Firm; M.E. Sharpe: Englewood Cliffs, NJ, USA, 1963; Volume 2. [Google Scholar]
  36. Surendran, P. Technology acceptance model: A survey of literature. Int. J. Bus. Soc. Res. 2012, 2, 175–178. [Google Scholar]
  37. Venkatesh, V.; Davis, F.D. A Theoretical Extension of the Technology Acceptance Model: Four Longitudinal Field Studies. Manag. Sci. 2000, 46, 186–204. [Google Scholar] [CrossRef] [Green Version]
  38. Abdullah, F.; Ward, R. Developing a General Extended Technology Acceptance Model for E-Learning (GETAMEL) by analysing commonly used external factors. Comput. Hum. Behav. 2016, 56, 238–256. [Google Scholar] [CrossRef]
  39. Bailey, J.E.; Pearson, S.W. Development of a Tool for Measuring and Analyzing Computer User Satisfaction. Manag. Sci. 1983, 29, 530–545. [Google Scholar] [CrossRef]
  40. Sun, P.-C.; Tsai, R.J.; Finger, G.; Chen, Y.-Y.; Yeh, D. What drives a successful e-Learning? An empirical investigation of the critical factors influencing learner satisfaction. Comput. Educ. 2008, 50, 1183–1202. [Google Scholar] [CrossRef]
  41. MacDonald, C.J.; Stodel, E.J.; Farres, L.G.; Breithaupt, K.; Gabriel, M.A. The demand-driven learning model: A framework for web-based learning. Internet High. Educ. 2001, 4, 9–30. [Google Scholar] [CrossRef]
  42. McDowall, T.; Jackling, B. The Impact of Computer-Assisted Learning on Academic Grades: An Assessment of Students’ Perceptions. Account. Educ. 2006, 15, 377–389. [Google Scholar] [CrossRef]
  43. Islam, A.N. Investigating e-learning system usage outcomes in the university context. Comput. Educ. 2013, 69, 387–399. [Google Scholar] [CrossRef]
  44. Yeung, C.; Zhou, L.; Armatas, C. An Overview of Benchmarks Regarding Quality Assurance for eLearning in Higher Education. In Proceedings of the 2019 IEEE Conference on e-Learning, e-Management & e- Services (IC3e), Pulau Pinang, Malaysia, 19–21 November 2019; pp. 1–6. [Google Scholar]
  45. Hadullo, K.; Oboko, R.; Omwenga, E. A model for evaluating e-learning systems quality in higher education in developing countries. Int. J. Educ. Dev. Using ICT 2017, 13, 185–204. [Google Scholar]
  46. Naveed, Q.N.; Alam, M.M.; Tairan, N. Structural Equation Modeling for Mobile Learning Acceptance by University Students: An Empirical Study. Sustainability 2020, 12, 8618. [Google Scholar] [CrossRef]
  47. Udo, G.J.; Bagchi, K.K.; Kirs, P.J. Using SERVQUAL to assess the quality of e-learning experience. Comput. Hum. Behav. 2011, 27, 1272–1283. [Google Scholar] [CrossRef]
  48. Khasawneh, M. Factors Influence e-Learning Utilization in Jordanian Universities—Academic Staff Perspectives. Procedia Soc. Behav. Sci. 2015, 210, 170–180. [Google Scholar] [CrossRef] [Green Version]
  49. Shafiq, M.; Lasrado, F.; Islam, A. Service Quality scale Development for Higher Education Institutions: The Asian Context. J. Qual. Technol. Manag. 2018, 15, 37–55. [Google Scholar]
  50. Uppal, M.A.; Ali, S.; Gulliver, S.R. Factors determining e-learning service quality. Br. J. Educ. Technol. 2018, 49, 412–426. [Google Scholar] [CrossRef]
  51. Lee, B.-C.; Yoon, J.-O.; Lee, I. Learners’ acceptance of e-learning in South Korea: Theories and results. Comput. Educ. 2009, 53, 1320–1329. [Google Scholar] [CrossRef]
  52. Nikolić, V.; Kaljevic, J.; Jović, S.; Petković, D.; Milovančević, M.; Dimitrov, L.; Dachkinov, P. Survey of quality models of e-learning systems. Phys. A Stat. Mech. Appl. 2018, 511, 324–330. [Google Scholar] [CrossRef]
  53. Haryaka, U.; Agus, F.; Kridalaksana, A.H. User satisfaction model for e-learning using smartphone. Procedia Comput. Sci. 2017, 116, 373–380. [Google Scholar]
  54. Wu, H.-Y.; Lin, H.-Y. A hybrid approach to develop an analytical model for enhancing the service quality of e-learning. Comput. Educ. 2012, 58, 1318–1338. [Google Scholar] [CrossRef]
  55. Martínez-Argüelles, M.; Castán, J.; Juan, A. How do students measure service quality in e-learning? In A case study regarding an internet-based university. In Proceedings of the 8th European Conference on Learning 2009, Bari, Italy, 29–30 October 2009; University of Bari: Bari, Italy, 2009; Volume 8, pp. 366–373. [Google Scholar]
  56. Trenholm, S.; Juan, A.A.; Simosa, J.; Oliveira, A. Long-Term Experiences in Mathematics E-Learning in Europe and the USA. In Teaching Mathematics Online; IGI Global: Hershey, PA, USA, 2012; pp. 238–257. [Google Scholar]
  57. Fornell, C.; Larcker, D.F. Evaluating structural equation models with unobservable variables and measurement error. J. Mark. Res. 1981, 18, 39–50. [Google Scholar] [CrossRef]
  58. Henseler, J.; Ringle, C.M.; Sarstedt, M. A new criterion for assessing discriminant validity in variance-based structural equation modeling. J. Acad. Mark. Sci. 2015, 43, 115–135. [Google Scholar] [CrossRef] [Green Version]
  59. Hair, J.; Black, W.; Babin, B.; Anderson, R. Exploratory Factor Analysis. Multivariate Data Analysis, 7th ed.; UK Pearson Education: Harlow, UK, 2014. [Google Scholar]
  60. Chen, W.S.; Yao, A.Y.T. An Empirical Evaluation of Critical Factors Influencing Learner Satisfaction in Blended Learning: A Pilot Study. Univers. J. Educ. Res. 2016, 4, 1667–1671. [Google Scholar] [CrossRef]
  61. Cheng, Y. Effects of quality antecedents on e-learning acceptance. Internet Res. 2012, 22, 361–390. [Google Scholar] [CrossRef] [Green Version]
  62. Naveed, Q.N.; Qureshi, M.R.N.; Tairan, N.; Mohammad, A.; Shaikh, A.; Alsayed, A.O.; Shah, A.; Alotaibi, F.M. Evaluating critical success factors in implementing E-learning system using multi-criteria decision-making. PLoS ONE 2020, 15, e0231465. [Google Scholar] [CrossRef]
Figure 1. DeLone and Mclean model.
Sustainability 13 02653 g001
Figure 2. Technology Acceptance Model.
Sustainability 13 02653 g002
Figure 3. E-Learning Quality Model.
Sustainability 13 02653 g003
Figure 4. A Proposed Conceptual Model for Evaluating E-Learning Success and its Impact on Academic Performance.
Sustainability 13 02653 g004
Figure 5. Structural path model coefficient.
Sustainability 13 02653 g005
Table 1. Construct, measures and their coding.
Construct CategoryMeasureCodeReference
Learner’s QualityLearner’s AttitudeLearner believes LMS is good for learning.LEAR11[24]
Learner has a positive attitude toward LMS.LEAR12
Learner’s BehaviorLearner is not intimidated by using LMS.LEAR21[24]
Learner’s previous experience with LMS is helpful.LEAR22
Learner’s Self-efficacyLearner’s ICT skillsLEAR31[43]
Learner’s communication skillsLEAR32
Learner’s Peer-InteractionLearner enjoys interacting with peers.LEAR41[31]
Learner trusts the knowledge of Peers.LEAR42
Instructor QualityReliabilityInstructor are dependable for the course contents.INSR11[9]
Instructors provide services at the time they promise to do so.INSR12
Instructors’ intended communications are always clear.INSR13
AssuranceInstructors are knowledgeable in their fields.INSR21[29,47]
Instructors are experienced to deliver course content.INSR22
Instructors are fair and impartial in academics.INSR23
EmpathyInstructors are genuinely concerned with their students. INSR31[29,47]
Instructor understand the individual needs of their students.INSR32
Instructors encourage and motivate students to do their best.INSR33
ResponsivenessInstructors efficiently respond to individual students.INSR41[24,29,47]
Instructors welcome student’s questions and comments. INSR42
Instructor utilize all possible ways to help students.INSR43
Information QualityContent LMS offers relevant information.INFR11[9,24,31]
LMS offers up-to-date information.INFR12
LMS offers complete information.INFR13
InstructionsLMS provides clear instructions.INFR21[29,31]
LMS provides objective instructions.INFR22
LMS provides actionable instructions.INFR23
LanguageLMS uses easy language.INFR31[50]
LMS uses professional language.INFR32
LMS uses multilingual communication.INFR33
ModesLMS contains multimedia information.INFR41[50]
LMS gives proper feedback information.INFR42
LMS facilitates flexible learning.INFR43
System QualityMultimedia SupportLMS uses audio elements properly.SYST11[47]
LMS uses video elements properly.SYST12
LMS uses animations properly.SYST13
Interface DesignLMS fonts, style, color, meet the quality standards.SYST21[9,51]
Structure of LMS is easy to understand.SYST22
LMS interface is intuitive and familiar.SYST23
FunctionalityLMS does not sign out automatically.SYST31[52]
LMS operates gracefully during peak loads.SYST32
LMS gives similar experience on desperate devices.SYST33
Ease of UseEase of communication with peers.SYST41[24,50]
Ease of sharing data and information.SYST42
Ease of sharing learning experience.SYST43
Institutional QualityAdministrative SupportInstitution has Top management support for E-Learning.INST11[45]
Institution has effective policy to promote E-Learning.INST12
Provides conducive environment to implement E-Learning.INST13
Financial SupportInstitution provide financial support for E-LearningINST21[45]
Provides timely funding for hardware and software updates.INST22
Institution provides monetary benefits to stakeholders.INST23
Stakeholder TrainingInstitution is providing training to stakeholders.INST31[9]
Trainers of stakeholders are knowledgeable.INST32
Modes of stakeholders training are appropriate.INST33
Environmental SupportMinistry provides incentives for E-Learning adoption.INST41[48]
Executive body such as Deanship to handle E-Learning.INST42
Best performing stakeholder gain social recognition. INST43
Perceived Usefulness of ELS Blackboard helps me to complete my tasks easilyPERU11[9,24,51]
Blackboard increases my knowledgePERU12
Blackboard is useful PERU13
Use of ELS I use Blackboard frequentlyUELS21[24]
I use Blackboard for my studyUELS22
I use Blackboard for my communicationUELS23
Learning and Academic Performance Academic performance using ELS is satisfactoryLAAP31[42,43]
I am happy with the learning experience using ELSLAAP32
ELS helped me in achieving learning goalsLAAP33
ELS is efficient for learningLAAP34
Table 2. Demographic information of the respondents.
ItemsDescriptionN%
GenderMale/Female180/21745.30/54.7
Knowledge About E-LearningYes/No379/1895.50/04.5
Level of
E-Learning Knowledge
Very Poor2406.00
Poor2205.50
Average13133.00
Good9624.20
Very Good12431.20
Currently using E-LearningYes/No397/0100.00/0.00
Satisfaction from E-LearningHighly Dissatisfied1804.50
Dissatisfied4310.80
Neutral10526.40
Satisfied 16040.30
Highly Satisfied 7117.90
Types of E-Learning UseBlended–1 21453.90
Blended–2 5614.10
Blended–3 5914.90
Full E-Learning6817.10
Years of
E-Learning Usage
01 or less12130.50
02–0521052.90
06–093909.80
09–Above2706.80
Area of StudyMedical 22757.20
Humanities and Social Science6416.10
Engineering, Computer and Science4210.60
Others6416.10
University King Khalid University11829.72
Albaha University7619.14
Jazan University8120.40
Najran University 6315.87
Bisha University 5914.86
Table 3. Construct Code, reliability, composite reliability and validity for construct.
Construct CodeCronbach Alpha
α ≥ 0.70
CR
CR ≥ 0.70
AVE
AVE ≥ 0.50
Learner’s Quality (LEARQ)0.8880.7100.560
Instructor Quality (INSRQ)0.7530.8590.661
Information Quality (INFRQ)0.8240.8610.674
System Quality (SYSTQ)0.7370.8490.611
Institutional Quality (INSTQ)0.8460.8530.630
Perceived Usefulness of ELS (PERU)0.8010.8380.734
Use of ELS (UELS)0.9060.8530.771
Learning and Academic Performance (LAAP)0.7950.7270.760
Table 4. Fornell–Larcker discriminant validity.
12345678
INFRQ0.821
INSRQ0.6830.813
INSTQ0.5690.5980.794
LAAP0.5970.6020.6280.872
LEARQ0.6640.6110.4390.490.748
PERU0.5310.5950.5580.7890.4730.913
SYSTQ0.8170.6880.6770.6470.6430.6560.782
UELS0.5180.5840.6640.8030.4420.7950.6680.933
Table 5. Heterotrait–Monotrait (HTMT) Correlation Matrix.
1234567 8
INFRQ
INSRQ0.718
INSTQ0.580.615
LAAP0.6420.6440.665
LEARQ0.7150.6570.4630.526
PERU0.5640.6340.5880.8740.495
SYSTQ0.8560.7220.710.6870.6960.694
UELS0.5430.6170.6980.880.4710.8670.701
Table 6. Direct path coefficient analysis and hypothesis testing.
HypothesisPathβ CoefficientsT Statistics P ValuesSupport
H0 1aLEARQ > PERU0.0430.7960.427Supported
H0 1bLEARQ > UELS–0.0170.1480.882Supported
H0 2aINSRQ > PERU0.2503.8730.000Not Supported
H0 2bINSRQ > UELS0.0483.0600.002Not Supported
H0 3aINFRQ > PERU−0.1341.7240.085Supported
H0 3bINFRQ > UELS−0.0992.3970.017Not Supported
H0 4aSYSTQ > PERU0.4605.7500.001Not Supported
H0 4bSYSTQ > UELS0.1765.2470.001Not Supported
H0 5aINSTQ > PERU0.1572.0590.040Not Supported
H0 5bINSTQ > UELS0.2655.2020.001Not Supported
H0 6aPERU > UELS0.56311.2670.001Not Supported
H0 6bPERU > LAAP0.4076.3310.001Not Supported
H0 6cUELS > LAAP0.4797.9800.001Not Supported
Table 7. Indirect path coefficient between dependent and independent variables and hypothesis testing.
HypothesisPathβ CoefficientsT StatisticsP ValuesSupport
H0 7aLEARQ > LAAP0.0210.5100.610Supported
H0 7bINSRQ > LAAP0.1923.9020.000Not Supported
H0 7cINFRQ > LAAP−0.1382.5510.011Not Supported
H0 7dSYSTQ > LAAP0.3966.1140.000Not Supported
H0 7eINSTQ > LAAP0.2333.8800.000Not Supported
Publisher’s Note: MDPI stays neutral with regard to jurisdictional claims in published maps and institutional affiliations.

