
Improvement of Road Safety through Appropriate Cargo Securing Using Outliers


1
Department of Logistics, University of Defence, 662 10 Brno, Czech Republic
2
Department of Quantitative Methods, University of Defence, 662 10 Brno, Czech Republic
*
Author to whom correspondence should be addressed.
Sustainability 2021, 13(5), 2688; https://0-doi-org.brum.beds.ac.uk/10.3390/su13052688
Submission received: 30 December 2020
/
Revised: 5 February 2021
/
Accepted: 22 February 2021
/
Published: 2 March 2021
(This article belongs to the Special Issue Traffic Safety within a Sustainable Transportation System)
Abstract
:The article focuses on evaluating a transportation experiment that intends to improve road safety by analyzing transport shocks that significantly affect the system of securing the load, vehicle, driver, and other aspects. Within Europe, improper or insufficient securing of loads causes up to 25% of all cargo vehicle accidents. Our transport experiment consists of eight rides of a Tatra truck. The measured values of shocks (acceleration coefficients) are statistically evaluated. Three hypotheses are established for these purposes. First, it is proven that the probability distributions of the shocks values differ statistically significantly among individual rides, namely in their shape and median value. Thus further statistical analyses are performed separately for the individual rides, axes, and the accelerometer locations. These analyses prove significant exceedances of the normatively set limits given by the EN 12195-1:2010 standard, which is potentially risky. Especially for the z axis and y axis, the set 20% limit was exceeded in 75.0% and 56.3% of cases, respectively. In the case of the x axis, the established 20% limit was practically not exceeded at all. The analysis of exceeding the permitted limits (the statistical evaluation of the second and third established hypothesis) is based on boxplots that graphically describe the individual rides, as well as on the found contaminated log-normal distribution of the values of the acceleration coefficients in the individual rides. The last hypothesis regarding exceeding the double value of the permitted limit is rejected. Methods of statistical comparison are used during data analysis. The probability distribution of acceleration coefficients is modeled using a contaminated log-normal distribution.
1. Introduction
The cargo vehicle accident rate is a long-term problem in most countries of the European Union (EU), and the Czech Republic (CZ) is no exception. The total number of traffic accidents in the CZ increased throughout the last monitored period (2018) by nearly 3% (from 21,263 to 21,889), while over the last five years (2014–2018), this value has more or less stagnated [1]. Globally (year 2018), road traffic accidents are the eighth most common cause of unnatural death among people of all ages, however, it is the number one cause of death for the population from 5 to 29 years old [2]. In the same year, the number of cargo vehicle accidents in the CZ was a total of 11,542, representing nearly 53% of all traffic accidents [3]. According to estimates published by the Directorate-General for Mobility and Transport of the European Commission, based on statistics from most EU states, 25% of cargo vehicle accidents are caused by improper or insufficient securing of the cargo [4]. Recalculated to the CZ in 2018, it is estimated that 2886 traffic accidents had a cause related to securing cargo, representing 13% of the total number of traffic accidents in the CZ in 2018. Although the intentional/careless improper securing of the cargo may be considered a larger problem, it is more of an issue of management and the absence of controls and appropriate sanctions. This article focuses on the segment of cargo vehicle traffic accidents or a general problem with securing cargo, where the responsible person (usually the driver) secures the cargo according to the requirements of current legislation, and yet the cargo becomes loose or causes an accident. The cause may be random influences but, more frequently, it lies in an improper estimate of the number of inertial forces affecting the transport. The inclusion of a relevant estimate of the acceleration coefficients (follow-up inertial forces) in the choice of the securing system has a positive effect on the “behavior of the cargo” within the transport, which will potentially reduce the number of accidents in the context of incorrect or insufficient cargo securing. However, these measures are unlikely to affect securing problems due to an intentional breach of cargo securing requirements.
The research offers a new perspective on the impact of shocks on cargo securing, with argumentation based on statistical analysis. Better enlightenment in the given area will allow to take into account the limited validity of the discussed standard EN 12195-1: 2010 (at the national and European level) and thus increase the safety of cargo transport (not only) by road. This fact also offers the possibility of including specifics into internal directives and documents of transport companies and shippers, which is closely related to [4]). The subject of the article is a discussion of the potential magnitude deviations of the expected shocks, which may negatively affect the transport and, in an extreme case, lead to a traffic accident. However, the article does not address intentional breaching of measures connected with cargo securing.
Additionally, securing cargo to the vehicles has its specifics, for example, depending on the type of vehicle used or the type of cargo transported. The article focuses on the operation of vehicles permitted to travel off-road, such as army vehicles or emergency services vehicles. In the case of such vehicles, the goal is not the maximization of profit. This results in a relatively low regular loading of the vehicle to its maximum capacity (ideally, it is fully loaded and in operation at minimum five days per week), but rather the fulfillment of specific tasks depending on the purpose of the individual units (e.g., delivery of emergency supplies, transport of cargo for military units or facilities). The Tatra 815-7 vehicle is intended both for use on regular roads and for off-road use, while there is an expectation that it will be operated only partly loaded (not using the maximum utility weight of the vehicle). It may be concluded that the hypothetically worst case (basal variant from the perspective of cargo securing) is the operation of an empty vehicle traveling at maximum velocity on the road. Generally, a loaded vehicle generates smaller shocks [5], and off-road, it is typically impossible to use the maximum velocity (85 km·h−1 with a speed limiter), which also decreases the number of shocks affecting the transport.
The following relationships are essential for the securing system. As is apparent from them, the amount of the cargo securing force in the given system of attachment must be greater, or at least equal, to the expected amount of inertial forces on the given axis:
where Fsx, Fsy, Fsz are the amounts of securing forces on the individual axes (x—longitudinal, y—transverse, and z—vertical toward the motion of the vehicle), and Fx, Fy, Fz are the amounts of inertial forces affecting the cargo during transport. According to regulation EN 12195-1:2010, value Fz is not included and is considered the least problematic given the type of securing system used (Top-Over Lashing) and the effect of the weight force [6].
Fsx ≥ Fx
Fsy ≥ Fy
Fsz ≥ Fz
However, the acceleration coefficient cz enters the calculation of inertial forces (required securing forces) on axes x and y; these are the relationships for the calculation according to regulation EN 12195-1:2010 [7]:
where Fx is the longitudinal inertia force to the vehicle movement, Fy is the transverse, and cx, cy, cz are the acceleration coefficients in the individual axes. µ is the friction coefficient, m is the mass of the cargo, g is the gravity acceleration, fs is the coefficient of safety for frictional lashing, n is the required number of lashing straps, and α is the angle between the lashing strap and the deck of the vehicle.
The regulatory established range of acceleration coefficients stipulated by norm EN 12195-1:2010 [7] is indicated for the individual axes:
c = (cx, cy, cz) = (0.8; 0.6; 1.0)
Given the shift of coordinates in the case of the measuring device used, which is given through only the formal inclusion of weight acceleration g, the corresponding regulatory-stipulated acceleration coefficient value of the z axis: cz = 2.0. Analogically, value cz = 3.0 was used for double exceeding.
For simplification, it is possible to directly compare the experimentally established acceleration coefficient values in the individual axes with the regulatory-stipulated limits. The probability of exceeding the regulatory-stipulated ranges, the degree of excess and possible extremes that exceed the expected rangers multifold are essential in this case.
This article aims to answer the research question of whether the securing system on the Tatra 815-7 vehicle corresponds to the expectations of the EN 12195-1:2010 norm. The vehicle is tested at maximum velocity in ordinary traffic (with the use of a speed limiter) on an ideal surface without cargo, where there is the expectation of the maximum effect of shocks (inertia forces on to cargo). A comparison of results from measuring devices located in the corners of the vehicle cargo spaces was performed simultaneously.
2. Literature Review
The subject of cargo securing is discussed rather sporadically in professional articles (e.g., [8,9,10]), and it is assumed that particularly the available regulations (on the European or possibly national level) [7,11], as well as Best Practices EU [4] and other sources [12,13], are more or less sufficient for adequate securing of the cargo. A certain exception makes up the consideration of specific conditions (e.g., transports of specific types of commodities, movement on poor quality transport infrastructure) or a large extent of detail-determination of a specific securing method and its practical verification that is generally applicable to any cargo, vehicle, extension, container, and so forth. This shortage is to some extent eliminated by selected monographs or by the directives and documents of transport companies, shippers, and interested associations. A practical discussion with applications of calculations of securing forces, including the consideration of the effectiveness of the usage of selected restraining methods, is presented in a monograph by T. Lerher [14]. A book by G. Grossmann and M. Kassmann [15] has a similar practical purpose; this book introduces instructions for packaging and the creation of handling units, including their safe fixation and transportation. The monograph also points out some of the complexities of packaging and securing. The specifics of oversize cargo transport and the methods of its attachment in various types of transport are addressed in the monograph by W. Galor [16].
Despite the large number of sources, some statistical analyzes point out the shortages in cargo securing (see also the estimated number of cargo vehicle accidents caused by cargo securing above), including the conclusions of selected professional articles, such as [17,18,19]. Listed publications discuss, among other things, the differences between the parametric approach of the relevant standards and directives (usage of averaged coefficients), the practical requirements for cargo securing, and the cargo layout and the choice of its securing system. On the basis of our own executed transport experiments and analyses (e.g., [20,21,22]), it is apparent that, particularly in the case of lesser quality roads, selected vehicles (e.g., those with off-road capabilities), or in the case of vehicles with a cargo of less than 50% of the utility weight of the vehicle, the shock values may significantly exceed the limits stipulated by regulations [5]. This fact can have an impact not only on the costs associated with transport, but in extreme situations it can also lead to a traffic accident and have impacts not only economical, but also impacts associated with human health or the environment [23,24].
Research in the broader field of road safety focuses primarily on the simulation of driver behavior, possibly of specific situations in traffic, using suitable case studies (typically from selected urban agglomerations) [25,26], or applications of simulation tools (software), such as MSC Adams [27,28,29], that enable the simulation of vehicle movement dynamics. The usage of simulations can well describe the technical impacts on the vehicle or infrastructure, including its effect on cargo behavior. However, the usage of parameters from the producer, which may not correspond to real transport conditions, can be considered a certain shortage. The reason is mainly the wear on the vehicle or its worse technical condition compared to the new vehicle, driving style of the driver, or other factors that were not included in the simulation or could not be included.
The subject of several professional publications is the identification of outliers and their evaluation, specifically their imaging using boxplots [30,31,32]. These methods are applied to data from natural, technical, as well as social sciences [33,34,35], including transportation, where subjects such as urban traffic [36,37] and the evaluation of psychological and physical parameters of drivers [38,39] are discussed. Professional publications do not cover the use of these methods for the identification of outliers and their statistical evaluation in terms of shocks in road cargo transport. However, the significant (as well as singular) exceeding of regulatory-stipulated limits in transport may cause the loosening of the cargo and its damage, possibly leading to a road accident, as shown by statistics of cargo vehicle accidents at the beginning of this article. Nevertheless, the exceeding of the stipulated limits may result from the fact that upon a changed road surface or its unevenness, the standard acceleration coefficients change. This causes the probability distribution of these coefficients to be a mixture of two probability distributions, where the resulting mixture is then referred to as the contaminated probability distribution [40,41].
3. Materials and Methods
3.1. Transport Experiment–Measured Data
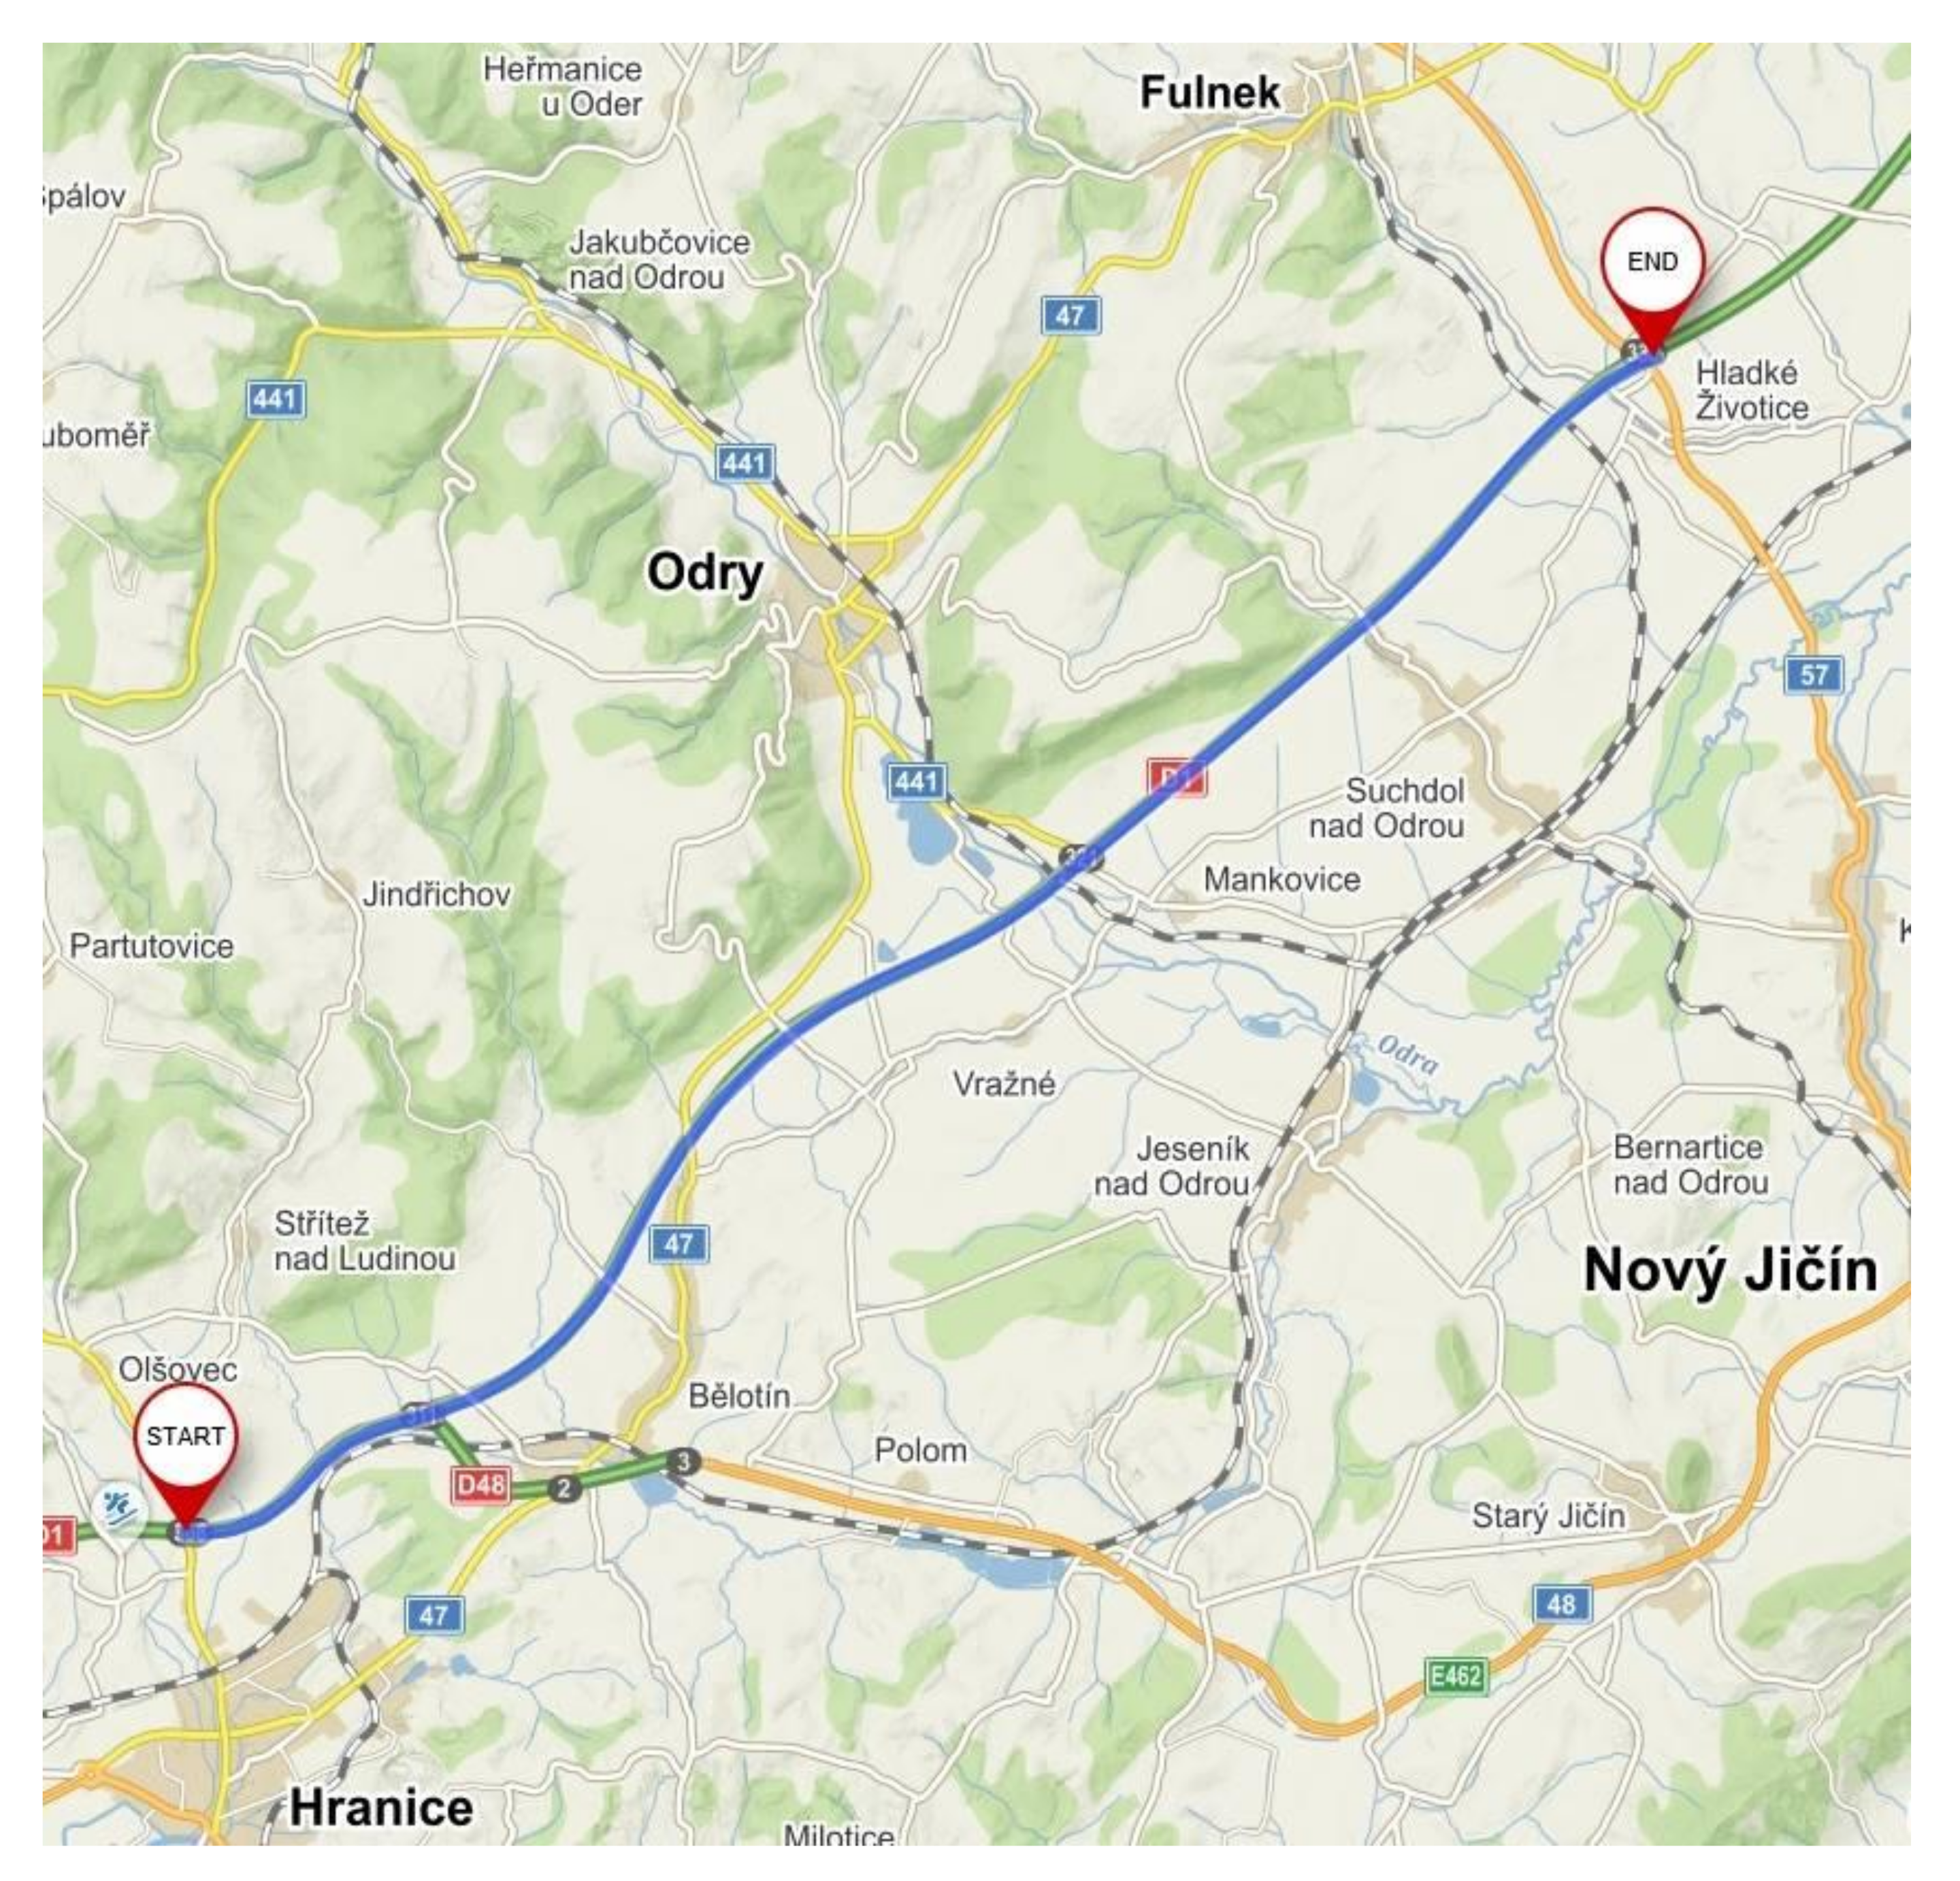
The primary data for the statistical evaluation was obtained from the executed transport experiment using vehicle T-815-7 M3R31 6x6.1R without cargo. By the time of the transport experiment, the vehicle had covered nearly 12,000 km. A 21.2 km route of the D1 highway, which is in good technical condition with a homogeneous surface, between the cities of Hranice and Fulnek was selected for the experiment (Figure 1). Eight Rides on the D1 highway (without highway exit ramps) were used to evaluate shocks. Four three-axis accelerometers OMEGA OM-CP-ULTRASHOCK-5 with a data logger and calibration certificates were used as measuring devices, located in all four corners of the vehicle cargo space. The accelerometers’ measuring ranges were ±5g, and always the worst value was recorded (in the absolute value) per second. In the case of the z axis, the measuring range was limited to the value of 1g. Thus, the value of 1 and the hypothetical negative values are outside the accelerometers’ measuring range.
The transport conditions were chosen regarding the possibility of repeating the transport experiment, and at the same time, to correspond to the real situation of the road network in the Czech Republic. The aim of the article is the practical impact of the obtained statistical evaluations on cargo securing, which to some extent contrasts with the approach of using dynamic simulations (e.g., in MSC Adams [27]), which uses “laboratory” conditions that may not correspond to real traffic situations.
The transport experiment took place during ideal climatic conditions at temperatures between 9 and 15 °C; the highway surface was dry, without snow and ice. No rain or snow precipitation was recorded throughout the experiment. The highway traffic was small and did not affect the transport experiment. During the transport experiment, the vehicle did not overtake and moved only in the right lane.
During the transport experiment, the vehicle was driven by an experienced professional driver with almost 10 years of experience of driving the given vehicle or similar types of vehicles. In addition, the driver’s experiences were from driving on both the normal road network and in terrain, including overcoming specific obstacles for off-road vehicles.
With regard to these facts, therefore in a situation when the transport experiment was performed under comparable conditions, outliers occurred in the data files, which may be a potential source of traffic accidents caused by incorrect or insufficient cargo securing. These extreme values were statistically evaluated, their frequency was described, and their characteristics were determined regardless of driving conditions, the curve of the road, pavement conditions, traffic sudden braking, and so forth. Thereby, the sources of extreme values were assessed for individual axes and locations, and therefore significant statistical characteristics were obtained, which can represent a very important factor in cargo securing. Accordingly, no attention was paid to individual partial situations during the drive and to their corresponding extreme values, but all extreme values were evaluated statistically.
The experiment’s premise is the existence of unevenness on the highway, which generates a high level of shocks (acceleration coefficient values), particularly at higher speeds. The subsequent evaluation subjects are the bumps (prospectively generally road geometry and road inclinations) that cause the resulting probability distribution of acceleration coefficient values to be contaminated by the probability acceleration distribution of the coefficient values measured on the given bumps.
The primary data from the experiment is available https://www.unob.cz/en/fml/structure/k109/Pages/default.aspx.
3.2. Methods
This article is based on the review of transport experiments conducted on cargo vehicles used by the army and departments of emergency services in the CZ, including the use of identical undercarriages abroad (e.g., France, Israel). This research is based on the analysis of identified acceleration coefficient values that are statistically evaluated in terms of the requirements of the respective regulation [7]. The statistical evaluation and testing were carried out at the level of significance α = 0.05.
Given the nature of the data, the nonparametric Kruskal–Wallis test was used to compare the probability distributions of acceleration coefficients for individual rides [43]. Goodness-of-fit tests, specifically the Cramer–Von Mises and Anderson–Darling tests, were used to assess the suitability of probability distribution models [44,45].
The probability distribution of the acceleration values was modeled using a contaminated log-normal distribution (see [40,41]) with the density of:
where is the density of the log-normal distribution with parameters and that corresponds to the acceleration coefficient values measured on the road (highway) without unevenness, and is the density of the log-normal distributions with parameters and , which corresponds to the measured acceleration coefficient values measured on larger bumps on the road. Further, in Equation (8), corresponds to the ratio of the acceleration values upon the vehicle traveling on the road without unevenness, and corresponds to the ratio of contaminated acceleration coefficient values caused by unevenness of the road:
The following was chosen for the described model:
where is the amount of values (measurements) lesser or equal to the value of b, is the amount of measurements greater than b, and is the total number of measurements. The choice of b as the delimiting constant will be later clarified in Equation (10).
3.3. Hypotheses
Three null hypotheses (formally identified as H1, H2, H3) were established to evaluate the measured data, along with their alternative hypotheses that correspond to the invalidity of the respective null hypotheses.
H1:
The probability distributions of the values of acceleration coefficients between the individual rides does not differ, meaning that the acceleration coefficient values are comparable for the individual rides of the same type.
H2:
The probability of exceeding the regulatory-stipulated limit in the respective axis, which is a risk threshold, is not greater than 20%.
H3:
The probability of exceeding the regulatory-stipulated limit by twofold, which is considered potentially dangerous, is not greater than 1%.
4. Results
A total of 85,356 acceleration coefficient values were recorded in three axes (28,452 values on each axis) on all four accelerometers (corners of the vehicle cargo space). A total of 35 values that exceeded the limits stipulated by norm EN 12195-1:2010 more than a double were recorded during this transport experiment, representing a (relatively) insignificant figure. However, a total of 27,498 values exceeded the regulatory-stipulated acceleration coefficient values (32.2% of the total amount of values recorded), where the z axis prevailed (a total of 19,069 values from the total number of exceeding records, 67.0%). The x axis showed a total of 1,138 cases of exceeding limits (4.0%). In the case of the y axis, it was 7,291 values (25.6%). The average velocity of the vehicle in all eight segments was 85.84 km∙h−1. The differences in the average speeds between the individual segments were insignificant; the divergence from the average velocity in all segments was less than 1%. The average speed corresponds to the implemented speed limiter set to 85 km∙h−1.
For illustration, Table 1 indicates the measured extreme values for the individual axes. In the case of all three axes, the maximum values exceeded regulatory-stipulated limits more than double. However, these were relatively sporadic peaks; the overall evaluation was carried out to verify the above stated statistical hypotheses.
4.1. Results H1
The nonparametric Kruskal–Wallis test was used to assess the comparability of individual rides in terms of the magnitude of shocks. The comparison was carried out for the absolute values of measured values (acceleration coefficient amount). It is apparent from the obtained results that the probability distribution of acceleration coefficients statistically significantly differs between the individual rides and that the individual rides thus cannot be considered comparable. The corresponding p-values are significantly lower than the stipulated level of significance 0.05. The differences between the individual rides are graphically demonstrated using boxplots in Figure 2.
4.2. Results H2
As is apparent from the boxplots in Figure 2, the data contains a large number of outliers. Given the asymmetric distribution of the analyzed data sets from the logarithms of the measured values, limit b for the evaluation of an outlier was selected using the upper quartile and lower quartile along with the interquartile range , according to the formula:
Further, it was possible to identify the model probability distribution using chi-squared tests (Anderson–Darling, Cramer–von Mises), enabling the datasets’ description. Normal distribution was considered, particularly, asymmetric distribution with heavy tails (log-normal, Gamma, Weibull). Upon executing the chi-square tests, none of the above probability distributions proved to be a suitable model for the description of the distribution of the studied data sets. The chi-squared tests performed negated each of these hypothetical distributions. However, the chi-squared tests’ results have also shown that of all the studied distributions, the log-normal distribution is the most suitable for the description of the monitored acceleration coefficient values in the individual rides, particularly, in situations where the data does not include substantial contamination of outlier values. Thus, given the large number of outliers caused primarily by the unevenness of the road surface and higher velocity of the vehicle during the transport experiment, possibly caused by the technical parameters of the vehicle (e.g., the rigidity of the undercarriage, type and pressure of the tires), the contaminated log-normal distribution with density (7) was considered for modeling the distribution of the measured data. The contaminated distribution of acceleration coefficient values (7) was subsequently used for modeling the amounts of acceleration coefficients of the individual rides. Given the considerable number of measurements in each ride, it was found that the contaminated distribution suitably characterizes the acceleration coefficient values. The total number of executed tests was 96 (Anderson–Darling rejected the hypothetical distribution with density (7) in 10 cases, p-values in case of rejections ranged between 0.005–0.042; Cramer–von Mises rejected the hypothetical distribution with density (7) in 10 cases, p-values in case of rejections ranged between 0.009–0.044).
The above process is demonstrated in two cases. The first case corresponds to a situation where the density is not rejected by the chi-square test, the second to a situation where the estimated density was rejected. Data for the first ride was used as a case of a good fit, the measurement is shown on the x axis, the accelerometer location was the right front corner of the vehicle’s cargo space. The outlier comparisons that are to be modeled using density are graphically shown in Figure 3 in red.
The estimate of the mixture density is depicted in Figure 4. The chi-squared tests for the given density estimate do not reject the null hypothesis (p-value from Anderson–Darling test is 0.2573, p-value from the Cramer–von Mises test is 0.2183).
The case of an unsuitable fit is shown in Figure 5, the detected outlier findings are shown in Figure 6. These were measurements for the fifth ride, measured on the y axis, the accelerometer was located in the vehicle’s cargo space’s left front corner. The chi-squared tests for the above density estimate f(x) reject the null hypothesis (p-value of Anderson–Darling test is 0.0051, the p-value of the Cramer–von Mises test is 0.0085).
In the context of the difference between the individual rides, hypothesis H2 was verified for the individual rides, axes, and the individual measuring devices separately. Subsequently, relative frequencies of exceeding the limits were established for the individual axes and individual locations of the measuring devices, and the statistical test of the null hypothesis was carried out, where the probability of exceeding the limit is equal to a maximum of 0.20 (respectively 20%) as opposed to the alternative hypothesis that the probability is greater than 0.20 (respectively 20%).
Table 2 covers the overall results. The first column (“Tests”) indicates the number of performed tests (meaning from all eight rides), the second column (“Cases”) indicates the number of cases where the relative frequency was greater than 0.20, and finally, the last column (“Significant Cases”) expresses the number of cases where it can be said that the probability of exceeding the limit was greater than 0.20 (respectively 20%).
As is apparent from the results shown, there are almost no cases of exceeding the limit in the x axis (the exceeding of the limit was only detected in one case (in the fifth ride, in the accelerometer located in the Right-Front). However, the value of 0.2009 is not statistically greater than 0.20.
The situation is different in the other two axes. In the y axis, 18 cases of probability exceeded the limit while being statistically significantly higher than 0.20 (20%), which is in more than half of the cases (56.3 %). The most significant exceeding of the permitted limit was shown on the z axis, a total of 24 cases (75.0%). The results also identify anomalies in the case of the measuring device located in the Left-Rear in z, where, in paradox, the shocks were lesser than in the other three accelerometers. As a result, the monitored limit of 0.20 was not exceeded in any round of the test. A subsequent examination of the vehicle showed a problem with the left rear wheel that was not in the same technical condition as the remaining wheels, including different tire pressures. This problem was reflected in the z axis.
Table 3 contains average values (and determinant divergences) of 80% of quantiles. Included are both values calculated from the mixture of log-normal distributions and empirical values.
As is evident from the results, the differences between the modeled and empirical values are small. Quantile indicates a value that is not exceeded with 80% probability. Should these values be higher than the limit values, it may be assumed that the permitted limit was exceeded. Axis x, on average, does not show the exceeding of the permitted limit value 0.8. However, the results are not as evident on axis y, and in the case of axis z (except for the Left-Rear position), the permitted limit is exceeded.
The z axis is visually depicted in Figure 7, showing the comparison of density graphs of mixtures from selected accelerometers (Left-Right, Left-Rear) in the case of data from first ride.
In a view of the fact that the theoretical model based on the contaminated distribution with the density (7) very well statistically describes extreme values during transport regardless of the partial situation on the roadway during individual journeys, it is possible for the performed transport experiment to state expected values, standard deviations, and probabilities corresponding to the ratio of contaminated acceleration coefficient values caused by the driving conditions, curve of the road, pavement conditions, traffic sudden braking, and so forth. The results are listed in Table 4, where 100p2 indicates the percentage of outliers. It is clearly noticeable from the table, that the highest percentage of outliers, greater than 2%, was in the Left-Front axis y 2855% (expected value of contaminated density is 0.901778), then in Left-Rear, axis z 2670% (expected value of contaminated density is 2.449605) and finally in Right-Rear, axis z 2.334% (expected value of contaminated density is 2.926286). The table also noticeably shows the expected value of the contaminated distribution in comparison with the expected value of the uncontaminated data, which correspond to the stationary part of the drive.
4.3. Results H3
The last hypothesis focuses on the probability of exceeding the double of the limit value. We proceeded similarly to verifying hypothesis H2. The null hypothesis that the probability of exceeding the limit twofold is equal at maximum 0.01 (respectively 1%) was tested against the alternative hypothesis that the probability of exceeding is greater than this value. On the basis of the statistical test results, it may be concluded that H3 was not rejected by any of the tests on the selected 5% level of significance. Thus, the double values of the limits are exceeded only sporadically, particularly on the y axis. Of the total number of measurements (85,356 acceleration coefficient values), there was only one instance of exceeding the limit twofold in axis x, 30 instances in case of axis y, and at the z axis, the limit was exceeded in four cases.
5. Conclusions
The executed transport experiments have proven the existence of significant shocks in the tested vehicle. The transport experiment was carried out in real-life conditions, meaning in an ordinary highway network during ordinary traffic. Contaminated distribution was selected for modeling the measure data, particularly because it was necessary to consider the existence of the outliers that most affect cargo securing. The transport experiment’s average velocity, corresponding to the built-in speed limiter’s capability, also affected the existence of outliers. In other words, the transport experiment was executed at a maximum technically usable speed.
As is evident from the results, the rides cannot be considered as comparable (H1). Even though only rides in one direction were evaluated, the individual rides were subject to divergences in traffic, temperature change (approximately by 6 °C) etc. The analysis of the two key hypotheses (H2 and H3) was carried out per the individual rides, individual axes, and individual locations of the measuring devices.
Concerning the second hypothesis (H2), a statistically significant exceeding of the regulatory-stipulated values was shown, particularly in axes z and y, confirming previous results of experiments (for example [21,22]). Thus, the z axis measurement results are also essential for the cargo-securing system selection, as well as the overall approach to cargo securing. The acceleration coefficient values results of axis z show that the limit was exceeded only on three wheels. The accelerometer located in the Left-Rear showed a lesser number of exceeding instances in comparison with the other measuring devices. Upon investigation of the cause, it was found that the tire was in a different technical condition in comparison with others. Verifying whether this was the only cause, as well as the reason for a ‘positive’ divergence of shocks generated in one wheel, will be the subject of further research.
The last hypothesis (H3) was not rejected; the double limits were exceeded only sporadically. The highest occurrence of twofold limit exceeding was found on axis y, and this only in 30 cases from the total number of measurements, which may be considered statistically insignificant. Although a twofold exceeding of the regulatory-stipulated limit may be considered dangerous, in such a small amount, these risks are negligible, including the impact on the lifespan of the individual elements of the securing system, particularly on tying straps.
The results have shown that the contaminated probability distribution may be successfully used to evaluate shocks for the purposes of cargo securing.
Influence of the elements related to driving conditions as curve of the road, pavement conditions, traffic, sudden braking, and so forth were evaluated statistically—by a model created with the use of a contaminated probability distribution. The obtained theoretical model matched well with empirical data for individual situations. It was successfully shown to which placement of the cargo one needs to pay close attention during the transport. The obtained characteristics of the contaminated distribution, their share, and comparison with driving in stationary conditions (when there are no extreme values) are well usable in the choice of securing in the road transport.
Author Contributions
The transport experiment was carried out using the Tatra 815-7 vehicle, with usage rights entitled to the Ministry of Defence of the Czech Republic. The usage rights to the measuring devices (accelerometers) are held by the Department of Logistics of the University of Defence in Brno. The transport experiment was planned and executed by J.M. (Jiří Malíšek) and M.V., including basic processing of primary data. The subject of the effect of shocks and formulation of the tested hypotheses was carried out by M.V., with a partial contribution by J.M. (Jiří Malíšek). The statistical processing and data evaluation was handled by statistics experts J.N. and J.M. (Jaroslav Michálek). Formal review and final revisions are the work of all co-authors, including the settlement of multiple remarks and comments. All authors have read and agreed to the published version of the manuscript.
Funding
This research was funded by Ministry of Defence of the Czech Republic, grant ROZVOLOG: Development of Capabilities and Sustainability of Logistics Support and by the Ministry of Education, Youth and Sports of the Czech Republic under specific research grant No. SV19-FVL-K109-SVA: Optimisation of the system of supplying units with material in multinational operations focusing on operational and tactical level. The APC was funded by Ministry of Defence of the Czech Republic.
Institutional Review Board Statement
Not applicable.
Informed Consent Statement
Not applicable.
Data Availability Statement
Data are available at the official website of the Department of Logistics.
Conflicts of Interest
The authors declare no conflict of interest. The funders had no role in the design of the study; in the collection, analyses, or interpretation of data; in the writing of the manuscript, or in the decision to publish the results.
References
- Ministry of Transport of the Czech Republic. Transport Yearbook. 2018. Available online: https://www.sydos.cz/cs/rocenka-2018/rocenka/htm_cz/cz18_621000.html (accessed on 20 October 2020).
- Calvo-Poyo, F.; Navarro-Moreno, J.; de Oña, J. Road Investment and Traffic Safety: An International Study. Sustainability 2020, 12, 6332. [Google Scholar] [CrossRef]
- Police of the Czech Republic. Accident Statistics 2018. Available online: https://www.policie.cz/clanek/statistika-nehodovosti-900835.aspx?q=Y2hudW09Mg%3d%3d (accessed on 22 October 2020).
- European Commision—Directorate-General for Energy and Transport. European Best Practice Guidelines on Cargo Securing for Road Transport. Available online: www.uirr.com/fr/component/downloads/downloads/302.html (accessed on 22 October 2020).
- Vlkovský, M. A Comparison of Cargo Securing on Laden/Unladen Container Trucks. Int. J. Log. Syst. Manag. 2021, 67, 1015–1023. [Google Scholar]
- Vlkovsky, M.; Binar, T.; Svarc, J.; Nemec, P.; Bucsuhazy, K. Impact of Shocks on Cargo Securing during the Road Transport. In IOP Conference Series: Materials Science and Engineering—Proceedings of the 4th World Multidisciplinary Civil Engineering, Architecture and Urban Planning Symposium; IOP Publishing Ltd: Prague, Czech Republic, 2019. [Google Scholar]
- EN 12195-1. Load Restraining on Road Vehicles—Safety—Part 1: Calculation of Securing Forces; European Committee for Standardization: Brussel, Belgium, 2010.
- Nieoczym, A.; Caban, J.; Vrábel, J. The Problem of Proper Cargo Securing in Road Transport—Case Study. Transport Research Procedia. In Proceedings of the 13th International Scientific Conference on Sustainable, Modern and Safe Transport, Nový Smokovec, Slovakia, 29–31 May 2019. [Google Scholar]
- Grzesica, D. Measurement and Analysis of Truck Vibrations during Off-Road Transportation. In Proceedings of the 14th International Conference on Vibration Engineering and Technology of Machinery, Lisbon, Portugal, 10–13 September 2018. [Google Scholar]
- Cieśla, M.; Hat-Garncarz, G. The Problem of Proper Cargo Securing in Road Transport—Case Study. Transp. Prob. 2013, 8, 27–33. [Google Scholar]
- EN 12640 (F draft). Securing of Cargo on Road Vehicles—Lashing Points on Commercial Vehicles for Goods Transportation—Minimum Requirements and Testing; European Committee for Standardization: Brussel, Belgium, 2019.
- United Nations Economic Commission for Europe. IMO/ILO/UNECE Code of Practice for Packing of Cargo Transport Units (CTU Code). Available online: https://www.unece.org/fileadmin/DAM/trans/doc/2014/wp24/CTU_Code_January_2014.pdf (accessed on 28 October 2020).
- VDI 2700. Securing of Loads on Road Vehicles—Securing of Skips on Skip Loader Vehicles and their Trailers; Verlag: Berlin/Heidelberg, Germany, 2009. [Google Scholar]
- Lerher, T. Cargo Securing in Road Transport Using Restraining Method with Top-Over Lashing; Nova Science Publishers: New York, NY, USA, 2015; ISBN 978-1-61122-002-5. [Google Scholar]
- Grossmann, G.; Kassmann, M. Transportsichere Verpackung und Ladungssicherung, 3rd ed.; Expert Verlag: Renningen, Germany, 2018; ISBN 978-3-8169-3334-2. [Google Scholar]
- Galor, W.; Galor, A.; Jóźwiak, Z.; Wiśnicki, B.; Woś, K.; Galor, P. Carriage and Securing of Oversize Cargo in Transport; Akademia Morska: Szczecin, Poland, 2011; ISBN 978-83-899901-59-0. [Google Scholar]
- Jagelčák, J. Equation of the standard EN 12195-1 Stipulates Unreasonable Demands for Cargo Securing. Communications 2007, 9, 30–33. [Google Scholar]
- Jagelčák, J.; Vrábel, J.; Nieuwesteeg, M. Draft for Revision of the Standards EN 12640 and EN 12641 Regarding the Securing of Cargo on Road Means of Transport. LOGI Sci. J. Transp. Log. 2017, 8, 41–46. [Google Scholar] [CrossRef] [Green Version]
- Bańka, M.; Droździel, P.; Nieoczym, A. Lashing Methods—Mathematical Basis of the Process of Selecting the Number of Lashings. In Proceedings of the 23rd International Scientific Conference on Transport Means, Palanga, Lithuania, 2–4 October 2019. [Google Scholar]
- Vlkovský, M.; Veselík, P. Cargo Securing—Comparison of Different Quality Roads. Acta Univ. Agri. Silvi. Mendel. Brunensis 2019, 67, 1015–1023. [Google Scholar] [CrossRef] [Green Version]
- Vlkovský, M.; Koziol, P.; Grzesica, D. Wavelet Based Analysis of Truck Vibrations during Off-road Transportation. In Proceedings of the 14th International Conference on Vibration Engineering and Technology of Machinery, Lisbon, Portugal, 10–13 September 2018. [Google Scholar]
- Vlkovský, M.; Šmerek, M.; Michálek, J. Cargo Securing during Transport Depending on the Type of a Road. In Proceedings of the 2nd World Multidisciplinary Civil Engineering, Architecture and Urban Planning Symposium, Prague, Czech Republic, 12–16 June 2017. [Google Scholar]
- Vlkovský, M.; Veselík, P.; Grzesica, D. Cargo Securing and Its Economic Consequences. In Proceedings of the 22nd International Scientific Conference on Transport Means—Part I, Kaunas, Lithuania, 3–5 October 2018. [Google Scholar]
- De Oliveira, L.P.; Alonso, F.J.; da Silva, M.A.V.; de Gomes Garcia, B.T.; Lopes, D.M.M. Analysis of the Influence of Training and Feedback Based on Event Data Recorder Information to Improve Safety, Operational and Economic Performance of Road Freight Transport in Brazil. Sustainability 2020, 12, 8139. [Google Scholar] [CrossRef]
- Demasi, F.; Loprencipe, G.; Moretti, L. Road Safety Analysis of Urban Roads: Case Study of an Italian Municipality. Safety 2018, 4, 58. [Google Scholar] [CrossRef] [Green Version]
- Tsoutsi, V.; Dikeos, D.; Basta, M.; Papadakaki, M. Driving Behaviour in Depression: Findings from a Driving Simulator Study. Safety 2019, 5, 70. [Google Scholar] [CrossRef] [Green Version]
- Neumann, V. Possibilities of Vehicle Movement Evaluation. In Proceedings of the 19th International Scientific Conference on Transport Means, Kaunas, Lithuania, 22–23 October 2015. [Google Scholar]
- Zong, C.Q.; Zhang, H.W.; Huang, C.Z.; Dong, J.S. Research on the Influence of Cargo Securing Force with Typical Road Alignments and Vehicle Working Conditions. In Proceedings of the 4th International Conference on Transportation Information and Safety, Banff, AB, Canada, 8–10 August 2017. [Google Scholar]
- García, L.O.; Wilson, F.R.; Innes, J.D. Heavy Track Dynamic Rollover—Effect of Load Distribution, Cargo Type, and Road Design Characteristics. Transp. Res Rec. 2003, 1851, 25–31. [Google Scholar] [CrossRef]
- Breunig, M.M.; Kriegel, H.P.; Ng, R.T.; Sander, J. LOF: Identifying density-based local outliers. ACM Sigmoid Record 2000, 29, 93–104. [Google Scholar] [CrossRef]
- Adam, M.B.; Babura, B.I.; Gopal, K. Range-Box Plotting Relating to Discrete Distribution. Matematika 2018, 2, 187–204. [Google Scholar] [CrossRef]
- Vaghefi, M.; Mahmoodi, K.; Akbari, M. Detection of Outlier in 3D Flow Velocity Collection in an Open-Channel Bend Using Various Data Mining Techniques. Iran J. Sci. Technol. Trans. Civ. Eng. 2019, 43, 197–214. [Google Scholar] [CrossRef]
- Mahmoodi, K.; Ghassemi, H. Outlier Detection in Ocean Wave Measurements by Using Unsupervised Data Mining Methods. Polish Maritime Res. 2018, 1, 44–50. [Google Scholar] [CrossRef] [Green Version]
- Zmuk, B. Speeding Problem Detection in Business Surveys: Benefits of Statistical Outlier Detection Methods. Croatian Oper. Res. Rev. 2017, 8, 33–59. [Google Scholar] [CrossRef]
- Fu, W.J.; Zhao, K.L.; Zhang, C.S.; Wu, J.S.; Tunney, H. Outlier identification of soil phosphorus and its implication for spatial structure modeling. Precis. Agric. 2016, 17, 121–135. [Google Scholar] [CrossRef]
- Barbato, G.; Barini, E.M.; Genta, G.; Levi, R. Robust methods and conditional expectations for vehicular traffic count analysis. Eur. Trans. Res. Rev. 2020, 12, 10. [Google Scholar]
- Bakowski, A.; Radziszewski, L.; Skrobacki, Z. Analysis of Urban Traffic for Various Sets of Vehicles. In Proceedings of the 3rd World Multidisciplinary Civil Engineering, Architecture, Urban Planning Symposium, Prague, Czech Republic, 18–22 June 2018. [Google Scholar]
- Buendia, R.; Forcolin, F.; Karlsson, J.; Sjöqvist, B.J.; Anund, A.; Candefjord, S. Deriving Heart Rate Variability Indices from Cardiac Monitoring—An Indicator of Driver Sleepiness. Traf. Injury Prev. 2019, 20, 249–254. [Google Scholar] [CrossRef] [PubMed] [Green Version]
- Forcolin, F.; Buendia, R.; Candefjord, S.; Karlsson, J.; Sjöqvist, B.A.; Anund, A. Comparison of Outlier Heartbeat Identification and Spectral Transformation Strategies for Deriving Heart Rate Variability Indices for Drivers at Different Stages of Sleepiness. Traf. Injury Prev. 2019, 19, 112–119. [Google Scholar] [CrossRef]
- Staudte, R.G.; Sheather, S.J. Robust Estimation and Testing, 1st ed.; Wiley-Interscience: New York, NY, USA, 1990. [Google Scholar]
- Jurečková, J.; Picek, J.; Schindler, M. Robust Statistical Methods with R; Chapman & Hall/CRC: Boca Raton, FL, USA, 2006. [Google Scholar]
- Maps.cz. Transport Route. Available online: https://mapy.cz/zakladni?planovani-trasy&x=17.9175146&y=49.6482511&z=12&rc=9oWdWxVBCV9p2IWxVisy&rs=coor&rs=coor&ri=&ri=&mrp=%7B%22c%22%3A111%7D&xc=%5B%5D (accessed on 25 September 2020).
- Hollander, M.; Wolfe, D.A. Nonparametric Statistical Methods; John Wiley & Sons: New York, NY, USA, 1973. [Google Scholar]
- Mises, R. Mathematical Theory of Probability and Statistics; Academic Press: New York, NY, USA, 1964. [Google Scholar]
- Anderson, T.W.; Darling, D.A. A Test of Goodness of Fit. J. Amer. Stat. Assoc. 1954, 49, 765–769. [Google Scholar] [CrossRef]
- Řehák, D.; Slivkova, S.; Pittner, R.; Dvorak, Z. Integral approach to assessing the criticality of railway infrastructure element. Int. J. Crit. Infra. 2020, 16, 107–129. [Google Scholar] [CrossRef]
- Řehák, D.; Hromada, M.; Novotny, P. European Critical Infrastructure Risk and Safety Management: Directive Implementation in Practice. In Proceedings of the 15th International Symposium on Loss Prevention and Safety Promotion, Freiburg, Germany, 5–8 June 2016. [Google Scholar]
Figure 1.
Transport route of the experiment Hranice–Fulnek (Highway D1) [42]
Figure 1.
Transport route of the experiment Hranice–Fulnek (Highway D1) [42]

Figure 2.
Acceleration coefficient box plots for the individual rides for the Right-Front location (the red dashed line signifies the limit value).
Figure 2.
Acceleration coefficient box plots for the individual rides for the Right-Front location (the red dashed line signifies the limit value).


Figure 3.
Detected outliers (in red) on axis x.

Figure 4.
Mixture density on axis x.

Figure 5.
Mixture density on axis y.

Figure 6.
Detected outliers (red) on axis y.

Figure 7.
Mixture densities in axis z, first ride (accelerometer location Left-Front and Left-Rear).
Figure 7.
Mixture densities in axis z, first ride (accelerometer location Left-Front and Left-Rear).


Table 1.
Extremes.
| x | y | z | |
|---|---|---|---|
| max | 1.69 | 1.74 | 4.64 |
| min | −1.30 | −1.82 | 1.41 |
Table 2.
H2 Hypothesis results.
| Tests | Cases | Significant Cases | |
|---|---|---|---|
| Axis x-All | 32 | 1 | 0 |
| Axis x-Right-Front | 8 | 1 | 0 |
| Axis x-Right-Rear | 8 | 0 | 0 |
| Axis x-Left-Front | 8 | 0 | 0 |
| Axis x-Left-Rear | 8 | 0 | 0 |
| Axis y-All | 32 | 20 | 18 |
| Axis y-Right-Front | 8 | 8 | 7 |
| Axis y-Right-Rear | 8 | 4 | 4 |
| Axis y-Left-Front | 8 | 5 | 4 |
| Axis y-Left-Rear | 8 | 3 | 3 |
| Axis z-All | 32 | 24 | 24 |
| Axis z-Right-Front | 8 | 8 | 8 |
| Axis z-Right-Rear | 8 | 8 | 8 |
| Axis z-Left-Front | 8 | 8 | 8 |
| Axis z-Left-Rear | 8 | 0 | 0 |
Table 3.
Descriptive characteristics of 80% of quantiles (mean—arithmetic mean, SD—standard deviation).
Table 3.
Descriptive characteristics of 80% of quantiles (mean—arithmetic mean, SD—standard deviation).
| Mean of x0.80 | Sd | Mean of Empirical x0.80 | Sd | |
|---|---|---|---|---|
| Axis x-All | 0.62898 | 0.09664 | 0.62938 | 0.09788 |
| Axis x-Right-Front | 0.74548 | 0.05544 | 0.74750 | 0.05701 |
| Axis x-Right-Rear | 0.51386 | 0.00951 | 0.51375 | 0.01188 |
| Axis x-Left-Front | 0.57569 | 0.01948 | 0.57375 | 0.01923 |
| Axis x-Left-Rear | 0.74548 | 0.05544 | 0.74750 | 0.05701 |
| Axis y-All | 0.61731 | 0.03378 | 0.61844 | 0.03264 |
| Axis y-Right-Front | 0.66319 | 0.03231 | 0.66125 | 0.03091 |
| Axis y-Right-Rear | 0.59898 | 0.01650 | 0.60125 | 0.01808 |
| Axis y-Left-Front | 0.60605 | 0.01267 | 0.60750 | 0.01389 |
| Axis y-Left-Rear | 0.66319 | 0.03231 | 0.66125 | 0.03091 |
| Axis z-All | 2.21461 | 0.18686 | 2.21406 | 0.18557 |
| Axis z-Right-Front | 2.29579 | 0.10898 | 2.29250 | 0.10951 |
| Axis z-Right-Rear | 2.34138 | 0.03978 | 2.34000 | 0.04071 |
| Axis z-Left-Front | 2.30595 | 0.04865 | 2.30625 | 0.04838 |
| Axis z-Left-Rear | 1.91531 | 0.03153 | 1.91750 | 0.03370 |
Table 4.
Expected values, standard deviations (Sd) and ratio of outliers of the estimated mixture of log-normal distributions.
Table 4.
Expected values, standard deviations (Sd) and ratio of outliers of the estimated mixture of log-normal distributions.
| Expected Value 1 | Sd 1 | Expected Value 2 | Sd 2 | Ratio of Outliers p2 | |
|---|---|---|---|---|---|
| Axis x-all | 0.56452 | 0.34560 | 0.89463 | 0.54579 | 0.01245 |
| Axis x-Right-Front | 0.65251 | 0.40161 | 1.09803 | 0.66673 | 0.00873 |
| Axis x-Right-Rear | 0.46645 | 0.28488 | 0.72740 | 0.44543 | 0.01463 |
| Axis x-Left-Front | 0.52168 | 0.31864 | 0.82881 | 0.50847 | 0.01744 |
| Axis x-Left-Rear | 0.61746 | 0.37727 | 0.92427 | 0.56254 | 0.00900 |
| Axis y-all | 0.55355 | 0.33862 | 0.91089 | 0.55815 | 0.02078 |
| Axis y-Right-Front | 0.58948 | 0.36125 | 0.95456 | 0.58122 | 0.01745 |
| Axis y-Right-Rear | 0.54221 | 0.33119 | 0.89838 | 0.55322 | 0.01955 |
| Axis y-Left-Front | 0.54190 | 0.33146 | 0.90178 | 0.55325 | 0.02855 |
| Axis y-Left-Rear | 0.54062 | 0.33059 | 0.88886 | 0.54492 | 0.01757 |
| Axis z-all | 2.08370 | 1.26715 | 2.64994 | 1.61213 | 0.01782 |
| Axis z-Right-Front | 2.13525 | 1.30027 | 2.56050 | 1.55425 | 0.00647 |
| Axis z-Right-Rear | 2.20397 | 1.33997 | 2.92629 | 1.78253 | 0.02334 |
| Axis z-Left-Front | 2.19647 | 1.33440 | 2.66335 | 1.61614 | 0.01478 |
| Axis z-Left-Rear | 1.79912 | 1.09395 | 2.44961 | 1.49559 | 0.02670 |
Publisher’s Note: MDPI stays neutral with regard to jurisdictional claims in published maps and institutional affiliations. |
© 2021 by the authors. Licensee MDPI, Basel, Switzerland. This article is an open access article distributed under the terms and conditions of the Creative Commons Attribution (CC BY) license (http://creativecommons.org/licenses/by/4.0/).
Share and Cite
MDPI and ACS Style
Vlkovský, M.; Neubauer, J.; Malíšek, J.; Michálek, J. Improvement of Road Safety through Appropriate Cargo Securing Using Outliers. Sustainability 2021, 13, 2688. https://0-doi-org.brum.beds.ac.uk/10.3390/su13052688
AMA Style
Vlkovský M, Neubauer J, Malíšek J, Michálek J. Improvement of Road Safety through Appropriate Cargo Securing Using Outliers. Sustainability. 2021; 13(5):2688. https://0-doi-org.brum.beds.ac.uk/10.3390/su13052688
Chicago/Turabian StyleVlkovský, Martin, Jiří Neubauer, Jiří Malíšek, and Jaroslav Michálek. 2021. "Improvement of Road Safety through Appropriate Cargo Securing Using Outliers" Sustainability 13, no. 5: 2688. https://0-doi-org.brum.beds.ac.uk/10.3390/su13052688
Note that from the first issue of 2016, this journal uses article numbers instead of page numbers. See further details here.