1. Introduction
Rivers provide a broad range of benefits to people and support diverse and productive ecosystems [
1]. However, river systems have experienced high levels of alteration and degradation by various economic activities—for example, only one-third of long rivers remain free-flowing [
2]—with steep declines in both populations of freshwater species and ecosystem services [
3]. Further, rivers face a range of ongoing and future threats, including dam construction, water extraction, overfishing, and pollution [
4,
5]. Due to these ongoing declines and future threats, there is a heightened call for investment and action to halt and reverse the freshwater biodiversity crisis, including through formal global targets for protection [
6]. The Aichi Biodiversity Targets, under the Convention on Biological Diversity, called for the protection of 17% of inland water areas by 2020 [
7]. Recent studies suggest that the world may be close to, or has already surpassed, that level of protection [
8,
9,
10]. However, an emphasis on a single metric of protection with an arbitrary numerical level as an overarching global target (e.g., 17% of inland water areas under protection) risks overlooking finer-scale values or processes that should underpin global conservation goals [
11]. In this paper, we examine the levels and spatial patterns of protection for a specific type of inland water area—rivers that are designated as free-flowing (sensu Grill and others [
2])—to provide some greater resolution and insights on the extent of inland waters that are protected.
Free-flowing rivers (FFRs) are defined as those “where ecosystem functions and services are largely unaffected by changes to the fluvial connectivity, allowing unobstructed movement and exchange of water, energy, material, and species within the river system and with surrounding landscapes” (p. 216, [
2]). Free-flowing rivers are identified by an index (the Connectivity Status Index or CSI) measuring the level of connectivity across four dimensions: lateral, longitudinal, vertical (connectivity with groundwater), and temporal (connectivity based on flow patterns over time). Grill and others [
2] found that just over one-third of rivers longer than 1000 km can be considered free-flowing and dams were the primary driver of the loss of free-flowing status for rivers, due to both fragmentation of longitudinal connectivity and the alteration of flow patterns.
Rivers support a range of processes that maintain ecosystems and provide value to people [
1]. For example, rivers sustain some of the world’s most productive freshwater fisheries, providing food and livelihoods to hundreds of millions of people [
12]. Rivers also deliver the sediment needed to maintain deltas, which are home to more than 500 million people and are among the most productive agricultural regions in the world [
13].
Free-flowing rivers are particularly important for maintaining many of these values [
14]. Migratory fish are an important component of many fisheries, including fish that require long-distance migrations between the ocean and rivers (e.g., anadromous fish such as salmon) and within river systems (e.g., fish that make long-distance migrations within the Amazon, Irrawaddy, and Mekong). Dams can disrupt these migrations, as demonstrated by the widespread decline in salmon populations from dammed rivers [
15]. A global index of migratory fish populations reported a 76% decline since 1970 [
16]. Dams also capture sediment and reduce its delivery to downstream floodplains, deltas, and near-shore marine environments. Nearly a quarter of global annual sediment flux is deposited within reservoirs and, in some river systems, such as the Nile, nearly all sediment is trapped behind dams [
17]. As a result, several deltas with dense human populations are experiencing an accelerated loss of land, subsidence, and saltwater intrusion. A loss of river connectivity has also contributed to the decline of freshwater species and populations, as measured by the Living Planet Index and the International Union for Conservation of Nature’s (IUCN’s) Red List [
3].
Loss of river connectivity, and associated impacts on species, ecosystems, and their services to people, are projected to continue. For example, Zarfl and others [
5] mapped over 3600 hydropower dams around the world that are in some stage of planning or construction. If all of these dams were developed, they would fragment the majority of the remaining long free-flowing rivers in temperate and tropical river regions. Projected increases of hydropower to meet climate targets, such as within energy forecasts in reports by the Intergovernmental Panel on Climate Change (IPCC), would require an increase in global hydropower capacity 50 to 100% greater than the aggregate capacity of dams identified by Zarfl and others [
5]; the level of hydropower development required to meet these climate targets would alter and fragment hundreds of thousands of kilometers of rivers worldwide [
18].
To address both past losses and future risks, governments have committed to increasing the protection of inland water areas. Target 11 of the Aichi Targets states that “by 2020, at least 17% of inland water areas, especially areas of particular importance for biodiversity and ecosystem services, are conserved through systems of protected areas and other effective area-based conservation measures.” Juffe-Bignoli and others [
10] found that 20.7% of inland water areas—including lakes, wetlands, and rivers—are within protected areas, while, using somewhat different categories of inland waters, Bastin and others [
8] found that 15 to 16.4% of inland waters were within protected areas. Focusing specifically on rivers, Abell and others [
9] reported that 16% of global river length was found within protected area boundaries (referred to as “local protection”).
Although these estimates suggest that the world has already achieved, or is close to achieving, the 17% global target, these assessments highlight the variability among countries and regions, with some countries far above the target and some well below [
8,
9]. Further, Juffe-Bignoli and others [
11] emphasize that the proportional protection level (17%) of Target 11 can receive too much attention and that, in fact, the target is far more comprehensive than just an area goal. The target describes that the protection should be in the form of “ecologically representative and well-connected systems”, encompassing “especially areas of particular importance for biodiversity and ecosystem services”. Juffe-Bignoli and others [
11] recommend a range of actions aimed at fulfilling the more comprehensive objectives of Target 11 and recommend how to better measure progress toward those objectives. Additionally, targets are currently under revision and Target 11 will be revised and updated in the post-2020 framework of the Convention on Biological Diversity (CBD). The current version of the proposed target focused on protection aims to “protect and conserve, through a well-connected and effective system of protected areas and other effective area-based conservation measures, at least 30% of the planet, with the focus on areas particularly important for biodiversity” by 2030.
Free-flowing rivers represent a specific category of inland waters and, by definition, these rivers are well-connected and provide the conditions that are more likely to allow species to persist into the future, particularly in a changing climate. Therefore, an assessment of the proportion and distribution of free-flowing rivers within protected areas will provide some further insights into progress toward the more comprehensive objectives of Target 11, beyond the inclusion of 17% of inland waters within protected areas. Here we quantify the length of rivers, and free-flowing rivers specifically, that are within the boundaries of protected areas. There are some limitations to defining those rivers that occur within protected areas as “protected”, including the fact that protected areas are often defined by, and managed primarily for, terrestrial resources and may not actually protect rivers from major impacts, such as damming [
19]. In this paper, we explore some of these limitations with case studies.
Further, we acknowledge that protected areas are just one mechanism for river protection, and it is the mechanism quantified by the various studies cited here [
8,
9,
10]. However, there are other mechanisms to protect rivers, including river-specific policies, such as the Wild and Scenic Rivers Act in the United States or the Salmon Rivers of Norway [
20,
21,
22]. These types of policies can provide strong protections for rivers, but these mechanisms are not always included in global databases of protected areas. Perry and others [
21], in this special issue, review the global extent of these river-specific policies. Further, there are water management or water allocation policies, such as Environmental Water Reserves in Mexico, that are officially focused on volumes of water, not rivers per se, but that function as de facto river protections [
23,
24]. Thus, a more comprehensive assessment of the extent of global protection for free-flowing rivers will need to consider these other categories that are not quantified in this paper.
4. Discussion
The global proportion of all river kilometers in protected areas is just below the 17% protection for inland waters expressed by Aichi Target 11, and the proportion of FFR kilometers within protected areas equals that target. However, the full text of Target 11 indicates that the protection should be implemented in a system that is “ecologically representative” (e.g., across river size and habitat types). Two main results in this analysis suggest that, even though the current global proportion of FFRs in protected areas has reached the 17% target, ecological representation is currently not achieved.
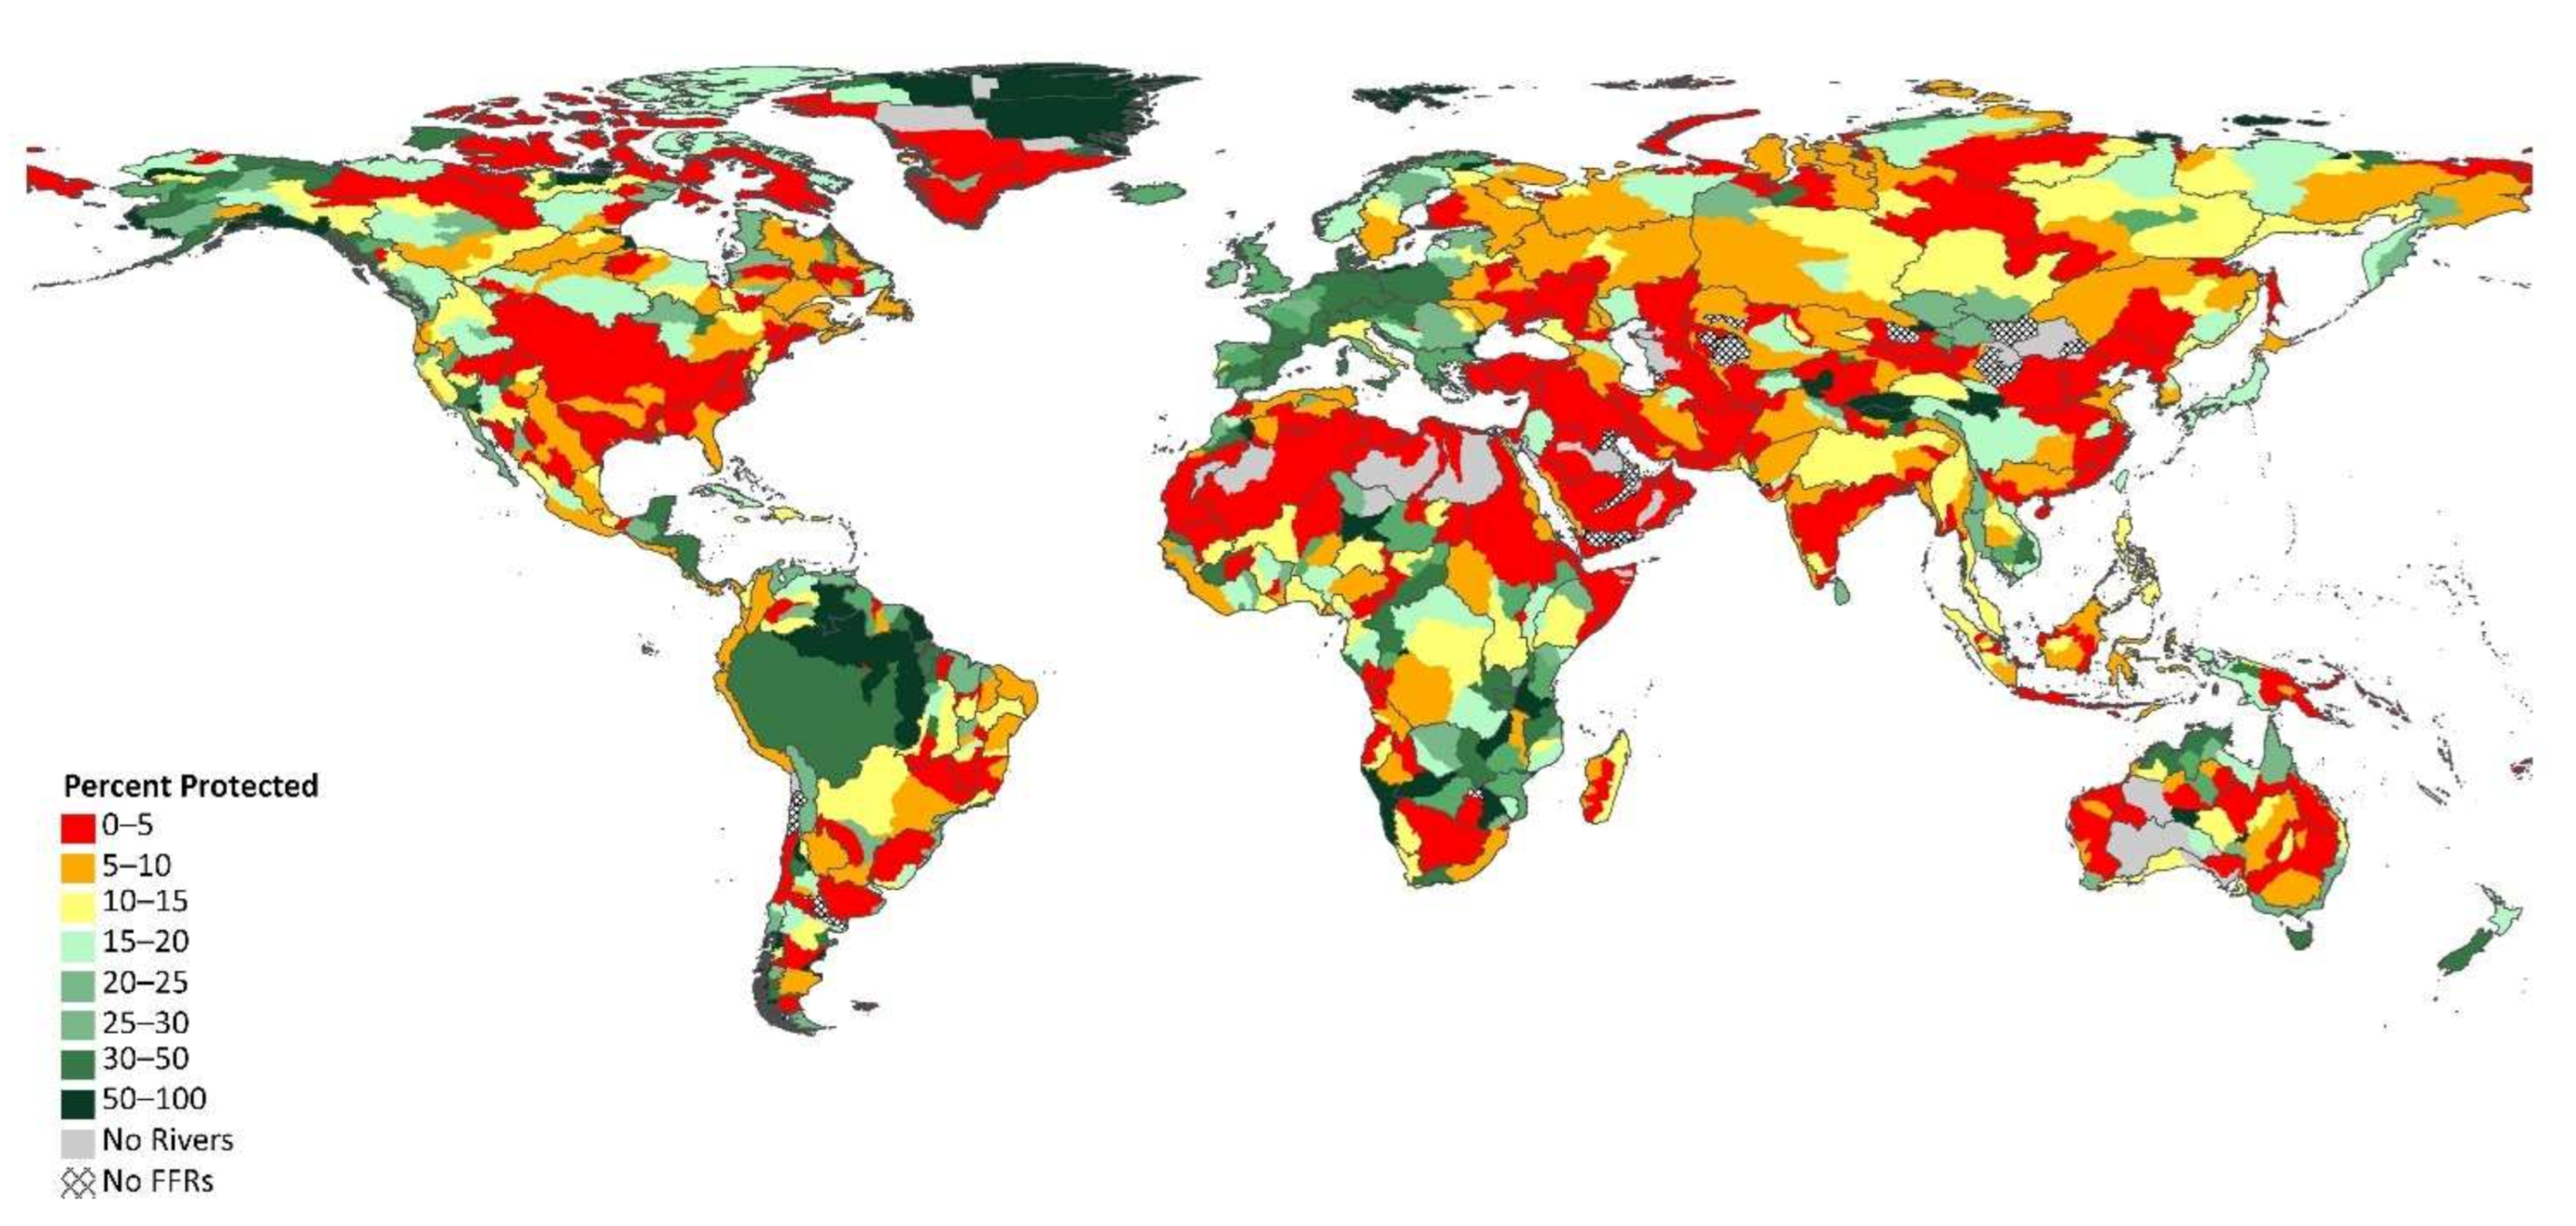
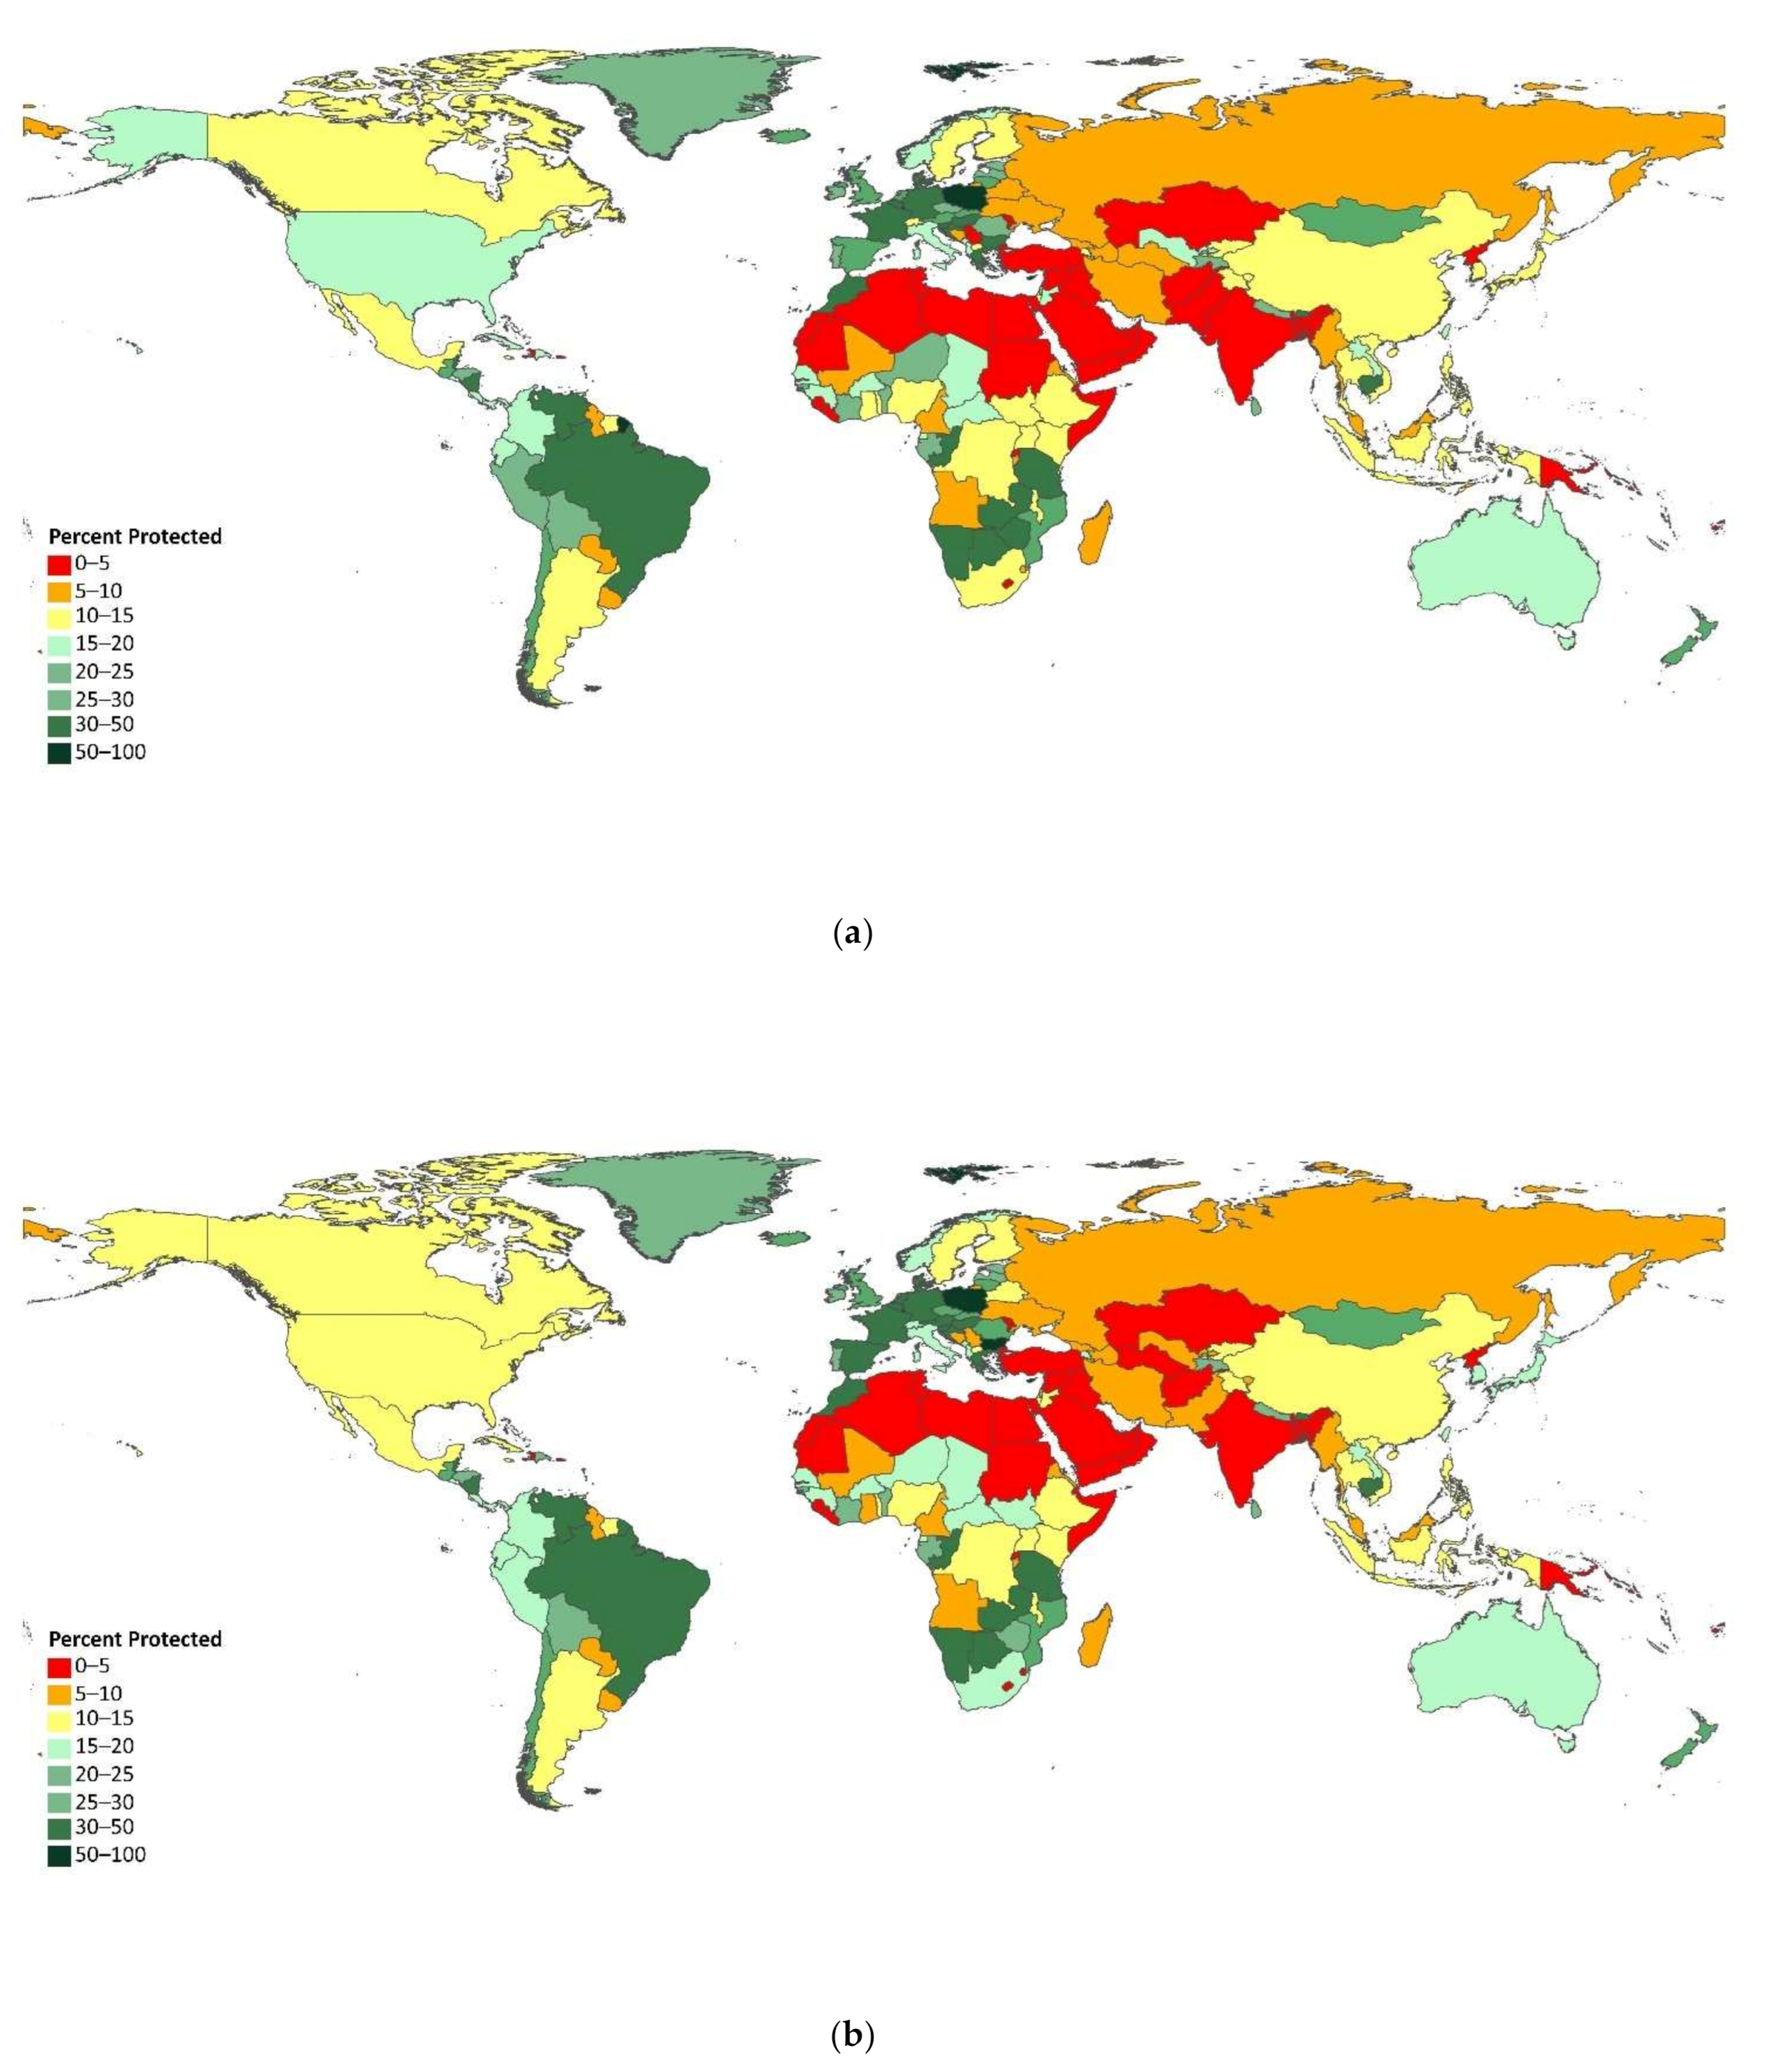
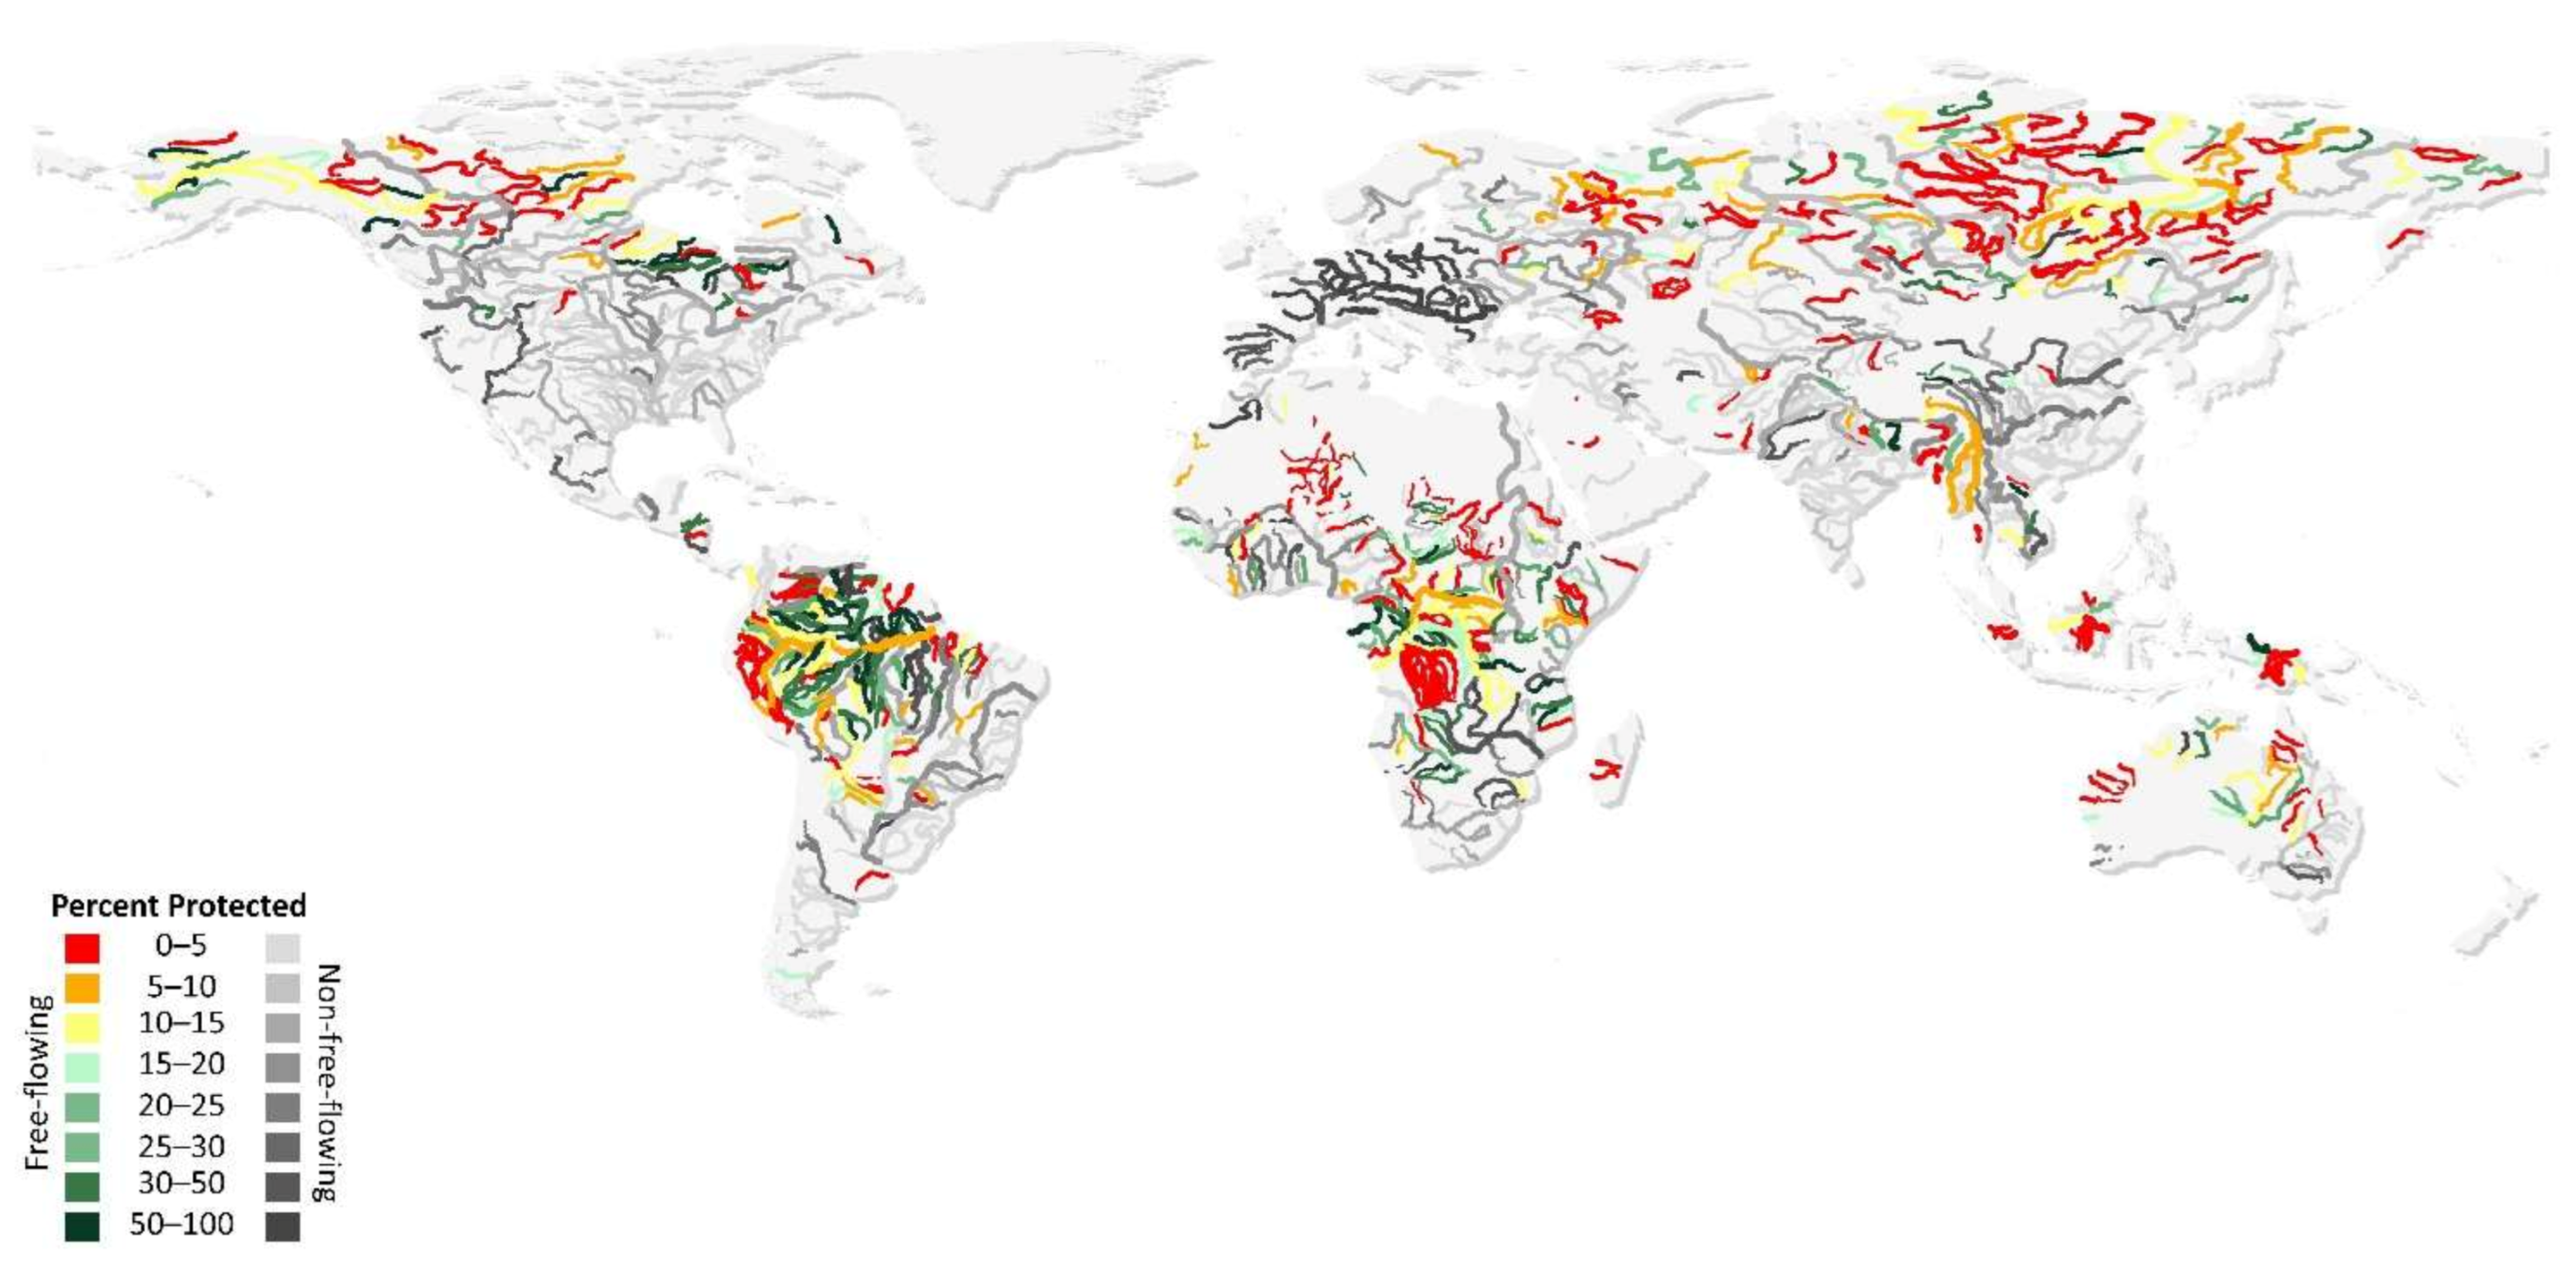
First, there is a wide variability of levels of protection across river basins, countries, and continents. Whole regions of the world, including North Africa and the Middle East, and South and Central Asia, have consistently low levels of protection (
Figure 2). The distinct species, populations, and ecosystems that occur in rivers across these regions are therefore likely to be found in systems with far less protection than the 17% target. Similarly, large river basins across the world—ranging from the Niger (4%) to the Ob (7%), Salween (7%), Mackenzie (8.5%), and Parana (9.4%)—have very low levels of protection for rivers, and free-flowing rivers, across their basins.
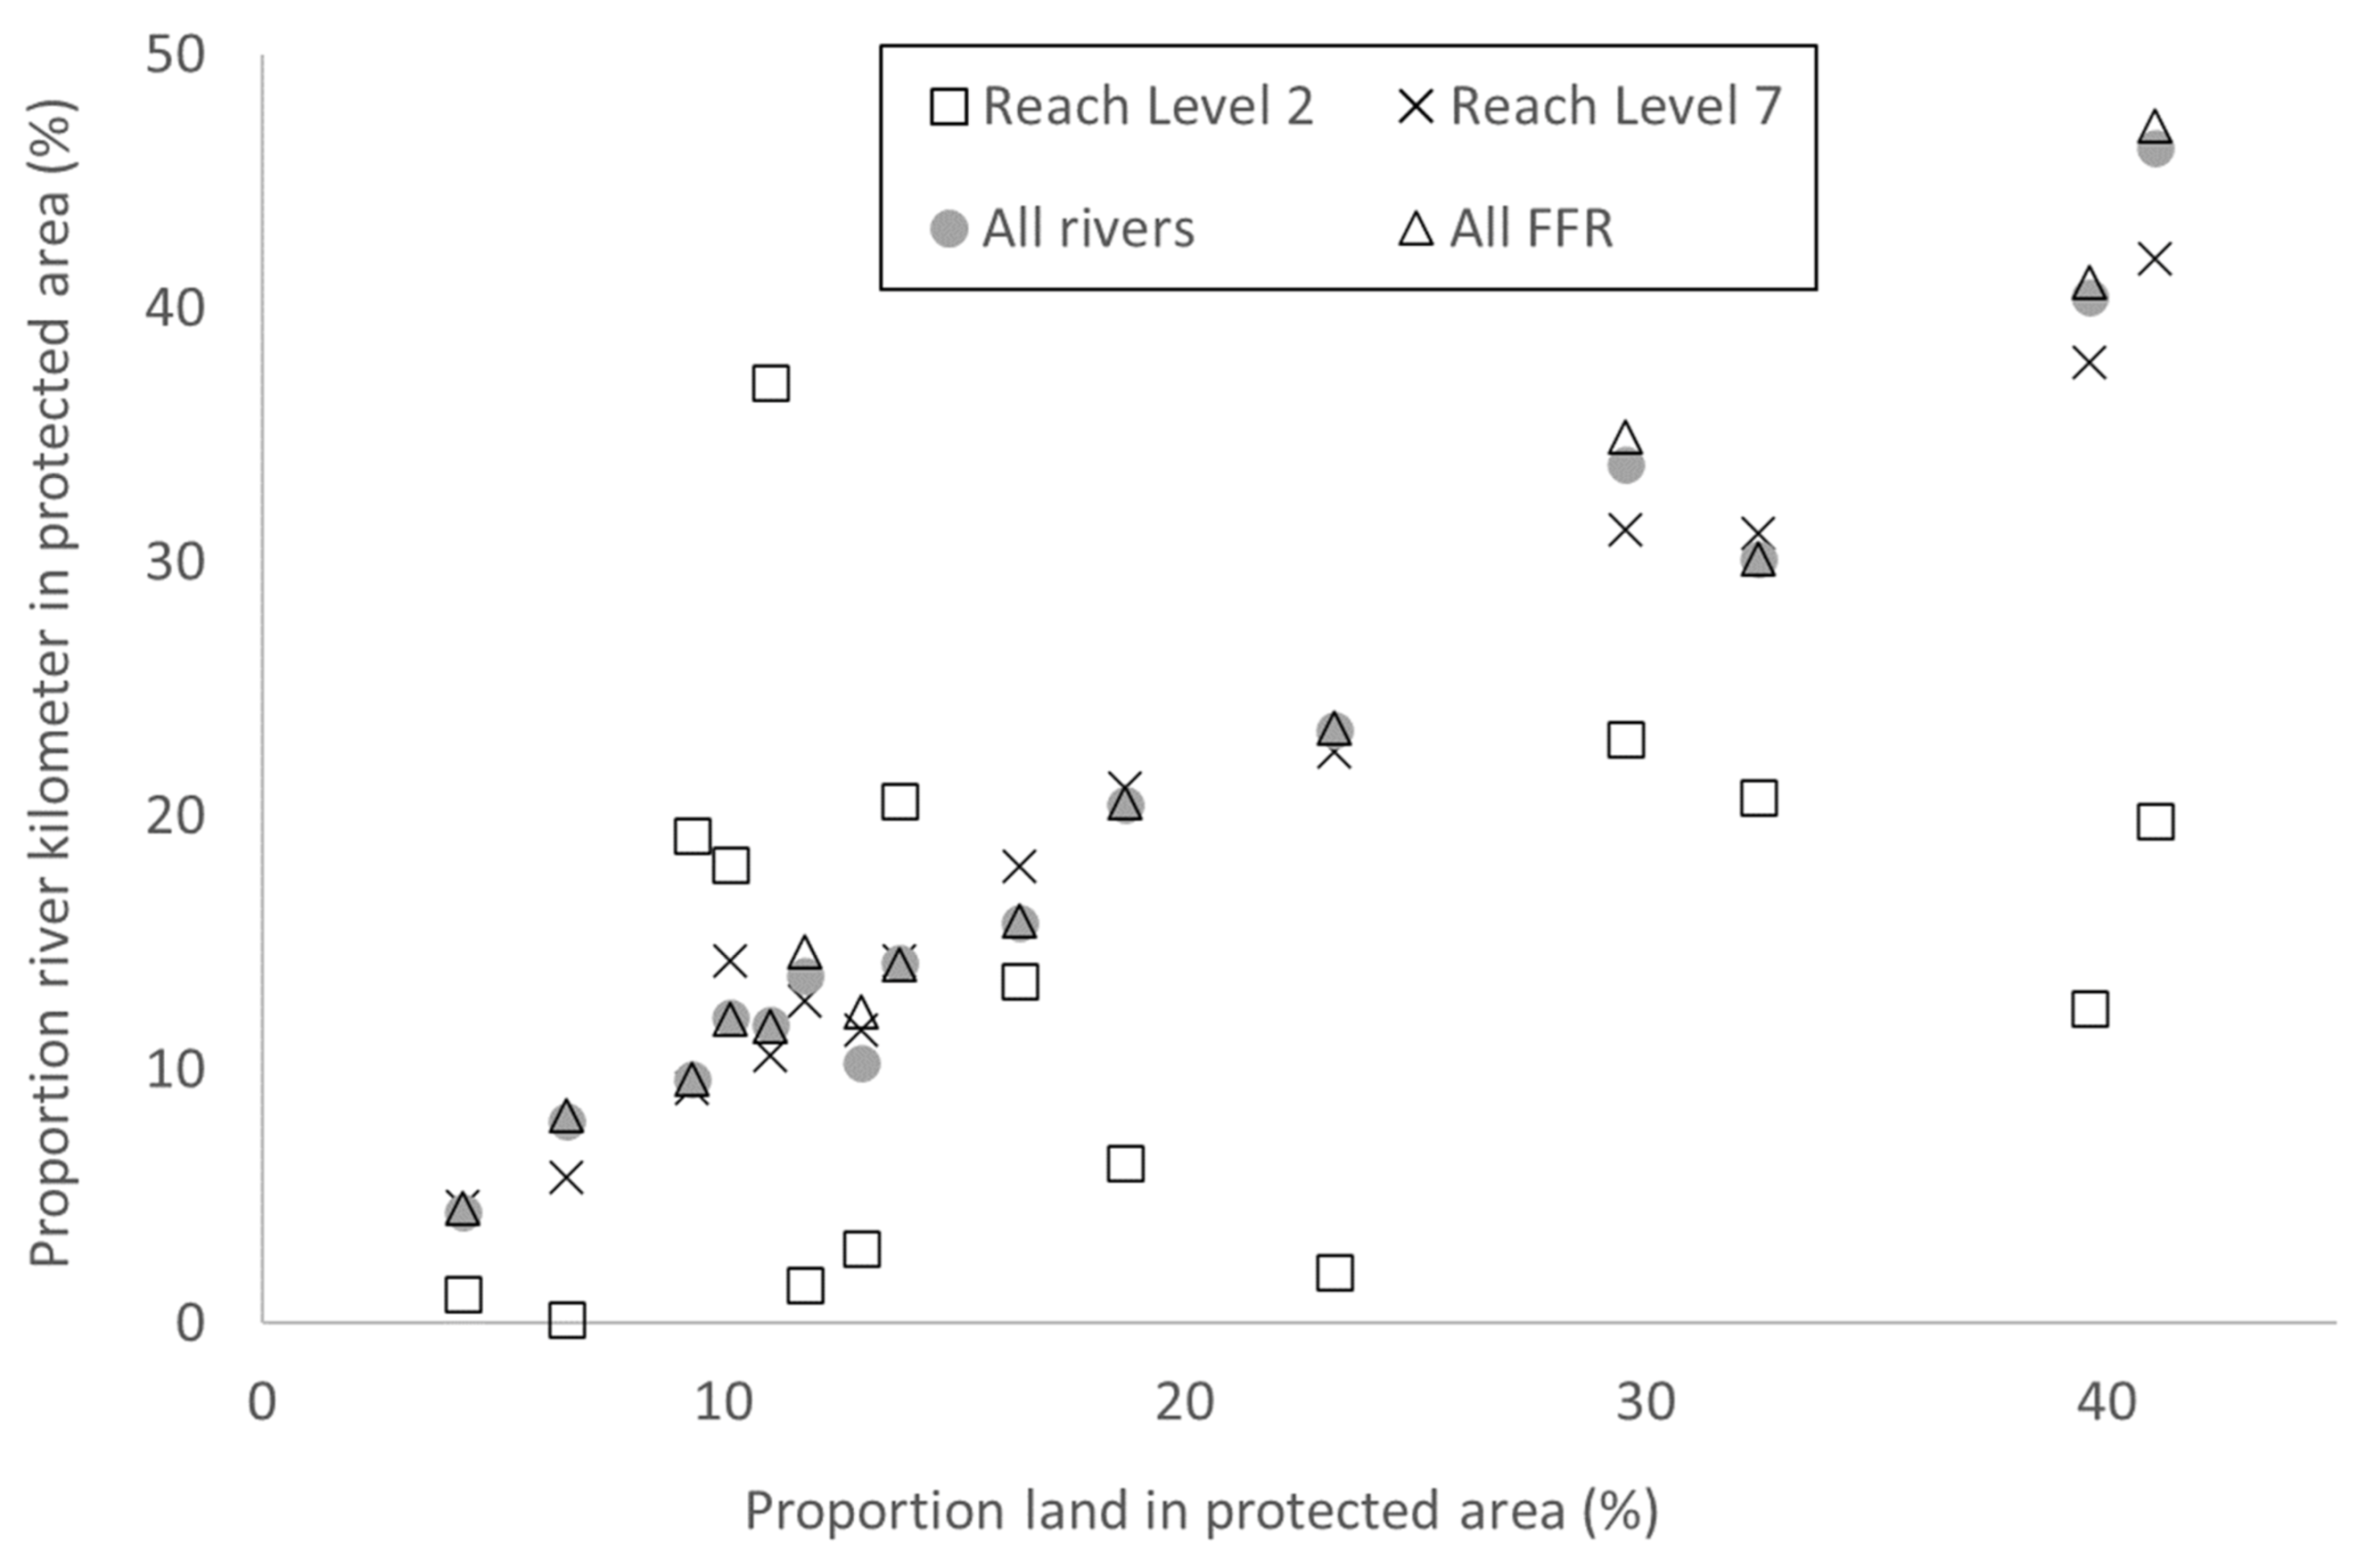
Second, there are wide differences in protection for river reaches of different sizes, based on length or discharge. This is most apparent when looking at patterns within individual countries. There are 15 countries with reaches of the size of Reach Level 2 (very high discharge). In these countries, an average of 20% of all FFR kilometers are within protected areas. However, for kilometers within reaches of Level 2, that drops to an average of 13% (see
Figure 5). That is, countries with large free-flowing rivers tend to have lower levels of protection for the high discharge mainstem reaches of those rivers than they do for the reaches and tributary rivers with lower discharge distributed throughout the basin upstream of those mainstem reaches. Species richness increases with discharge [
30] and these mainstem, high discharge reaches often have distinct processes (e.g., long-duration connectivity to extensive floodplains) and distinct species, populations, and services shaped by those processes (e.g., the highly productive fisheries of mainstem rivers with extensive floodplains) Reach Levels 1, 2, and 3 comprise just under 200,000 kilometers globally—less than 2% of river kilometers in this study—yet they encompass much of the diversity, productivity, and cultural importance associated with rivers around the world. For example, these high discharge mainstem reaches (and associated floodplains) encompass the most productive freshwater fisheries in the world, including the Irrawaddy River and the lower Mekong River (Reach Levels 2 and 3). These high discharge mainstem reaches also include many of the most prominent examples of rivers important to cultures, such as the Victoria Falls on the Zambezi River, the Nile as it flows through the Valley of the Kings, and the site of the Kumbh Mela along the Ganges River, a spiritual event dubbed “the largest gathering of humans” on the planet [
31]. Thus, an “ecologically representative” system that protects “especially areas of particular importance for biodiversity and ecosystem services” (not to mention cultural and social values) should ensure sufficient protection for these distinct ecosystems within river networks, and our results indicate that currently, these river types have lower protection than do rivers, or free-flowing rivers, overall.
The fact that these high discharge river reaches, by aggregate length, are a very small portion of the world’s total river kilometers—yet they encompass resources and values that are among the most important among rivers—underscores the risk of placing too much emphasis on a simple metric and target, such as protecting 17% of rivers. Global targets could incorporate specific goals for various sizes of rivers, as well as striving to achieve geographic distribution.
The fact that short rivers or small discharge reaches represent the highest proportion of rivers in the world by length raises a similar point about tracking progress toward global targets. If a target for global river protection defines “river” as a general term to include a wide range of river sizes, then tracking the target will essentially track the status of small rivers. Further, the extent of small rivers will generally scale proportionally to the extent of land area. Thus, most countries that achieve 17% of land area within protected areas will also achieve approximately 17% of river kilometers under protection. And because most small rivers are classified as free-flowing, then the country will also have achieved approximately 17% protection of free-flowing rivers. That is, as long as one defines “river” to include a broad range of sizes, tracking the extent of land under protection will essentially also track the extent of rivers under protection. However, there is little relationship between a country’s proportion of land protected and proportion of high discharge mainstem reaches rivers in protected areas, although these reaches have environmental and social values that are disproportionately high (e.g., species richness and fisheries) relative to their share of global river kilometers.
Designating protected areas that include rivers is one mechanism for protecting rivers. Other mechanisms include river-specific policies, such as the Wild and Scenic Rivers Act (USA) and National Salmon Rivers (Norway) [
20,
21]. The database (WDPA) used in this and other studies of river protection (e.g., [
8,
9]) includes some but not all of these areas and so this study potentially misses some length of river under protection. Higgins and others [
22]) reviewed a set of policies, regulations, judicial actions, water and land rights, and community-based efforts that can provide protection to rivers but are often not included in the WDPA and thus in most global tracking of protection [
22]. Further, water allocation mechanisms or other water-management policies can serve as de facto river protection policies. For example, the Environmental Water Reserves (EWR) in Mexico establish a monthly flow allocation for rivers. Proposed infrastructure, such as a dam, must demonstrate that its operation can be consistent with the monthly flows prescribed by the EWR. Rivers with EWRs that are close to natural flow levels functionally have a high level of protection, and proposals for hydropower dams were withdrawn from the San Pedro and Usumucinta rivers because they could not comply with the EWR [
23]. In Mexico, a total of 44,000 kilometers of FFRs have EWR defined for them [
24].
A more complete assessment of the extent of global protection of FFRs will need to include rivers in protected areas (e.g., this study), rivers protected by river-specific mechanisms not included in the WDPA, and rivers with water-management policies that function as de facto protection mechanisms. There is ongoing work to expand the assessment of types of protection and to map Other Effective Area-based Conservation Measures (OECM), such as EWR, in order to better account for the full range of interventions that support conservation goals. (An OECM is defined as a “geographically defined area other than a Protected Area, which is governed and managed in ways that achieve positive and sustained long-term outcomes for the in situ conservation of biodiversity, with associated ecosystem functions and services and where applicable, cultural, spiritual, socio-economic, and other locally relevant values”) [
32].
A more comprehensive assessment should also consider some of the limitations of defining as “protected” those river reaches that are within the boundaries of protected areas. While in many countries national parks provide strict protection for rivers, including a prohibition on dam development and other activities that would degrade rivers, not all protected areas across the world actually protect rivers from major impacts, such as dam construction. Thieme and others [
19] found that at least 1249 large dams are located within PAs and that 14% of planned geolocated hydropower dams (509 dams) are located within PAs. There are also several examples of where protected areas were altered (e.g., downsized or decommissioned) to allow dam construction [
19,
33].
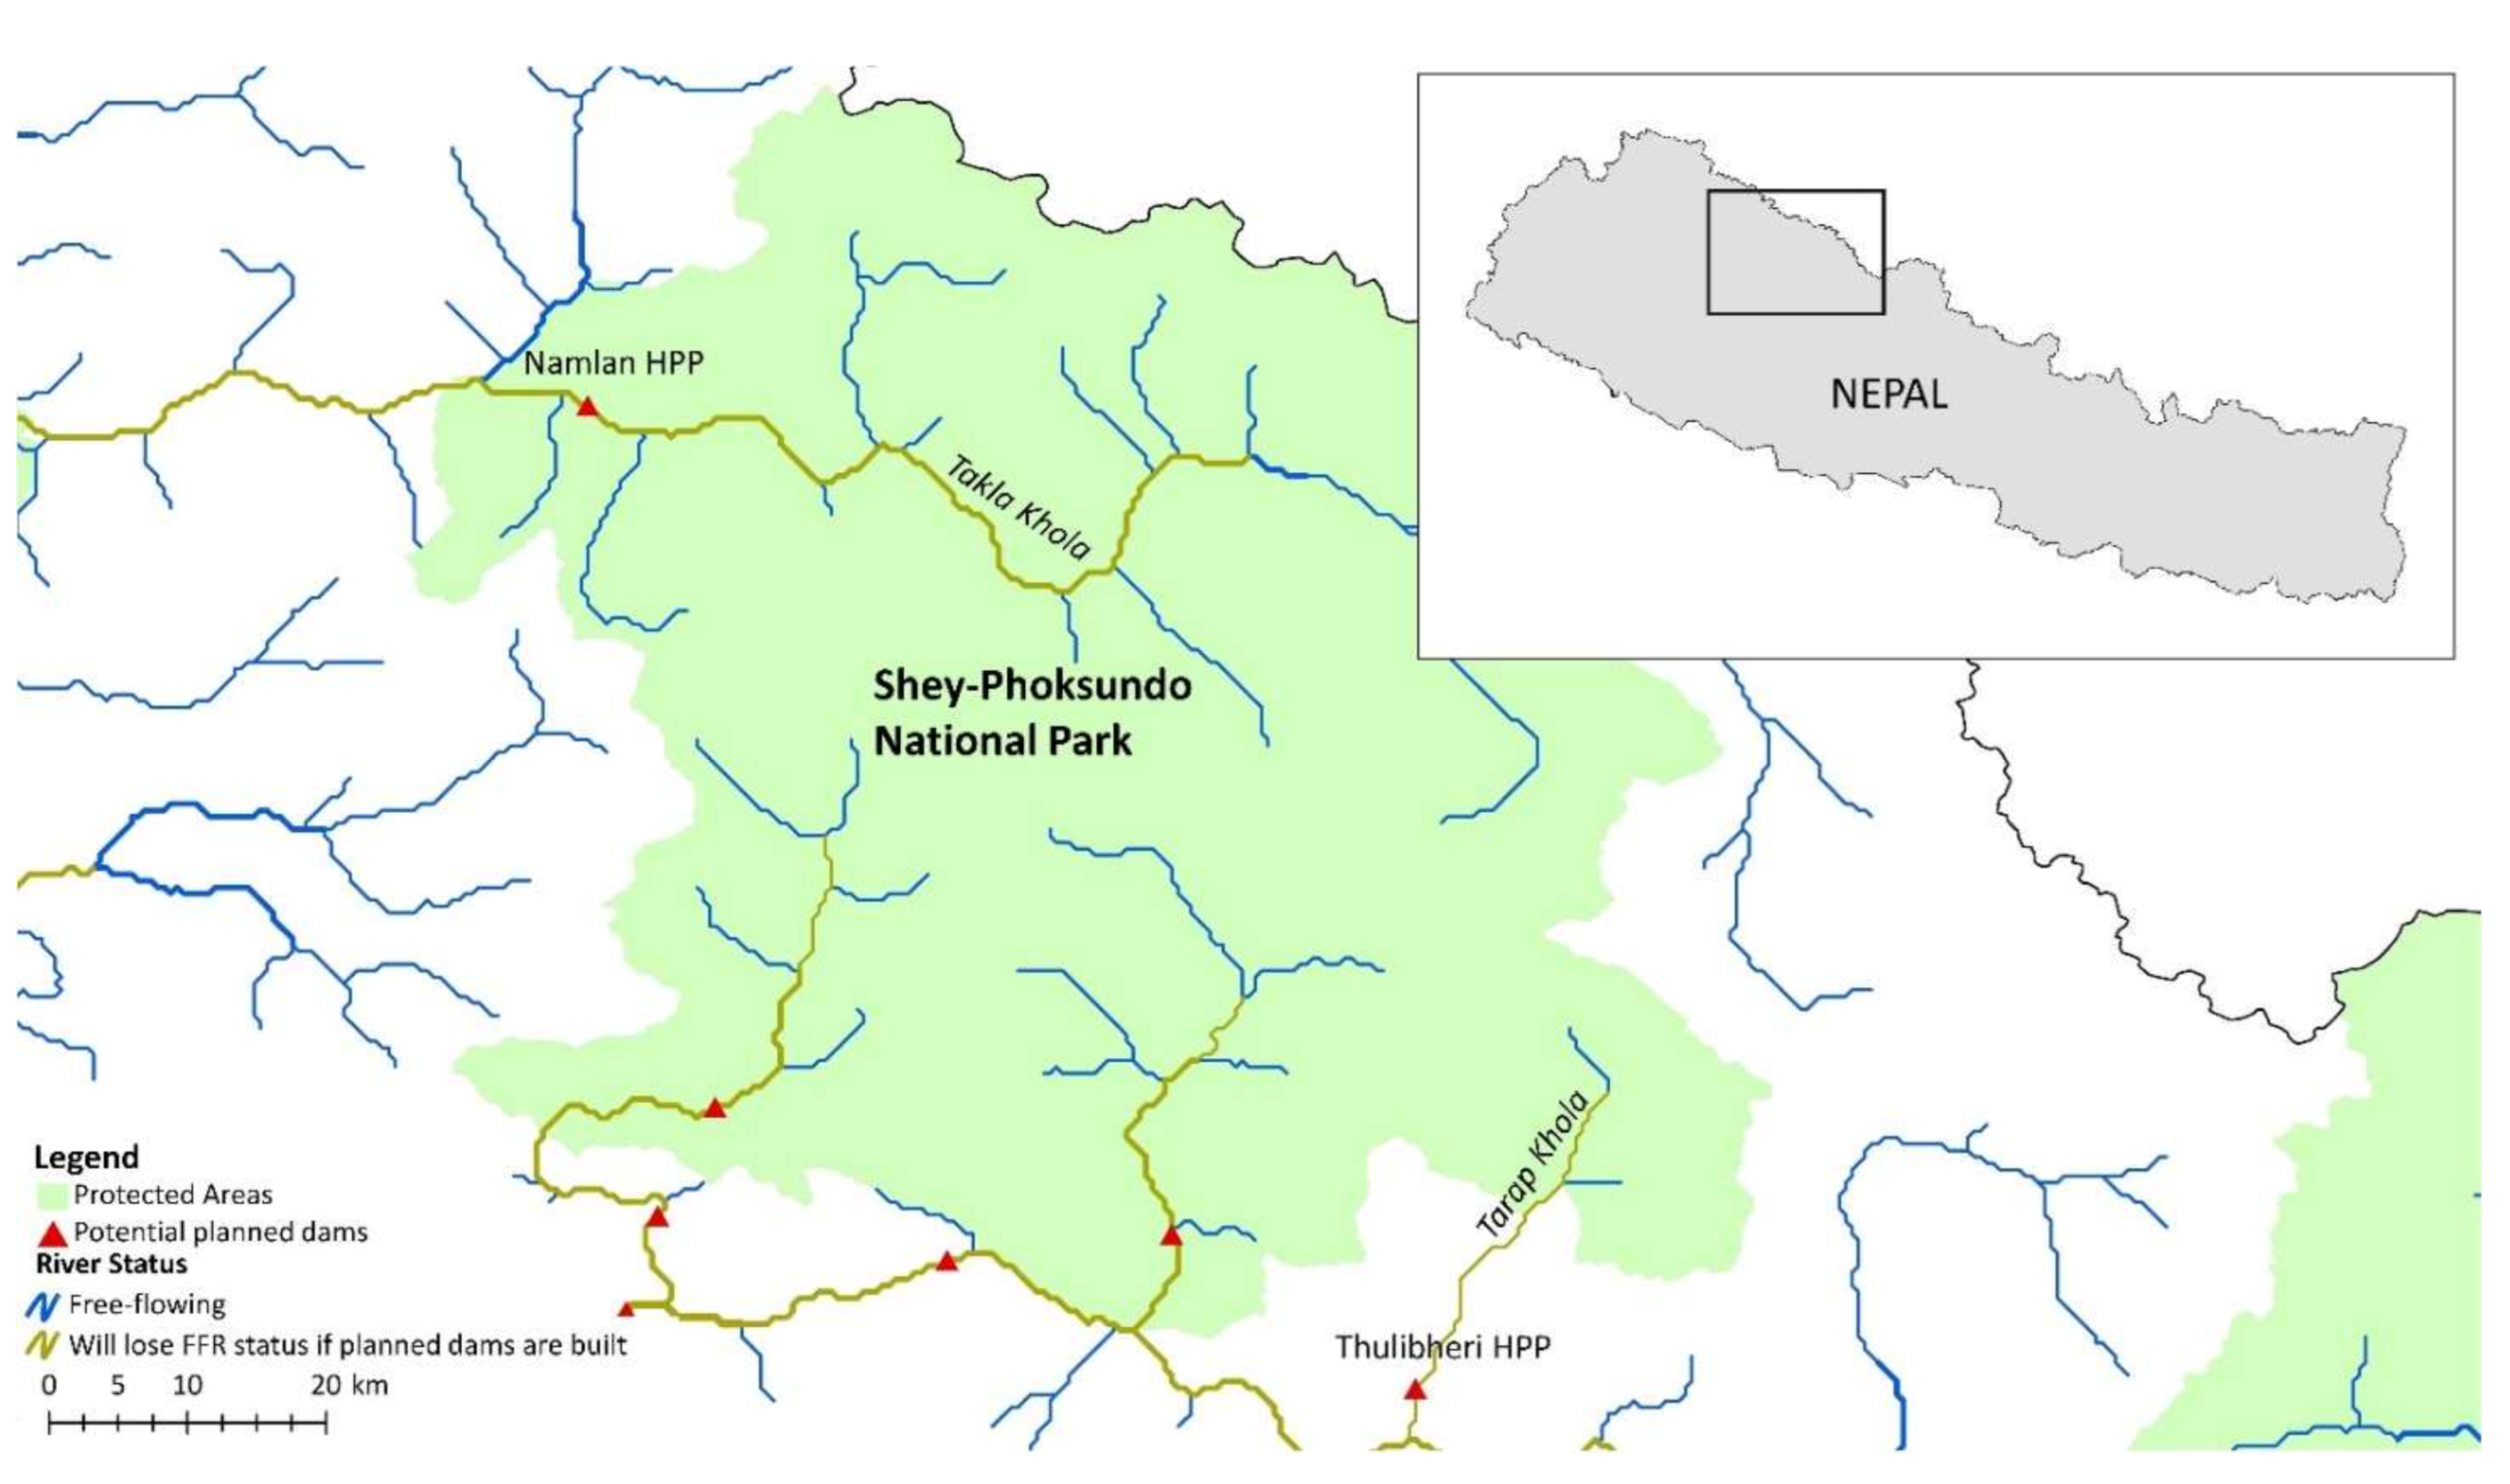
In the Nepal case study in this paper, we found that the development of proposed hydropower dams would cause 40% of river kilometers in Nepal’s protected areas to lose their FFR status, and much of that loss was from dams proposed to be built inside protected areas (note that it is not certain how many of these dams may actually get built, but they are within government planning documents and have generally received initial licenses). In general, the river-specific protection mechanisms, such as a Wild and Scenic designation, do not allow dam development on protected rivers.
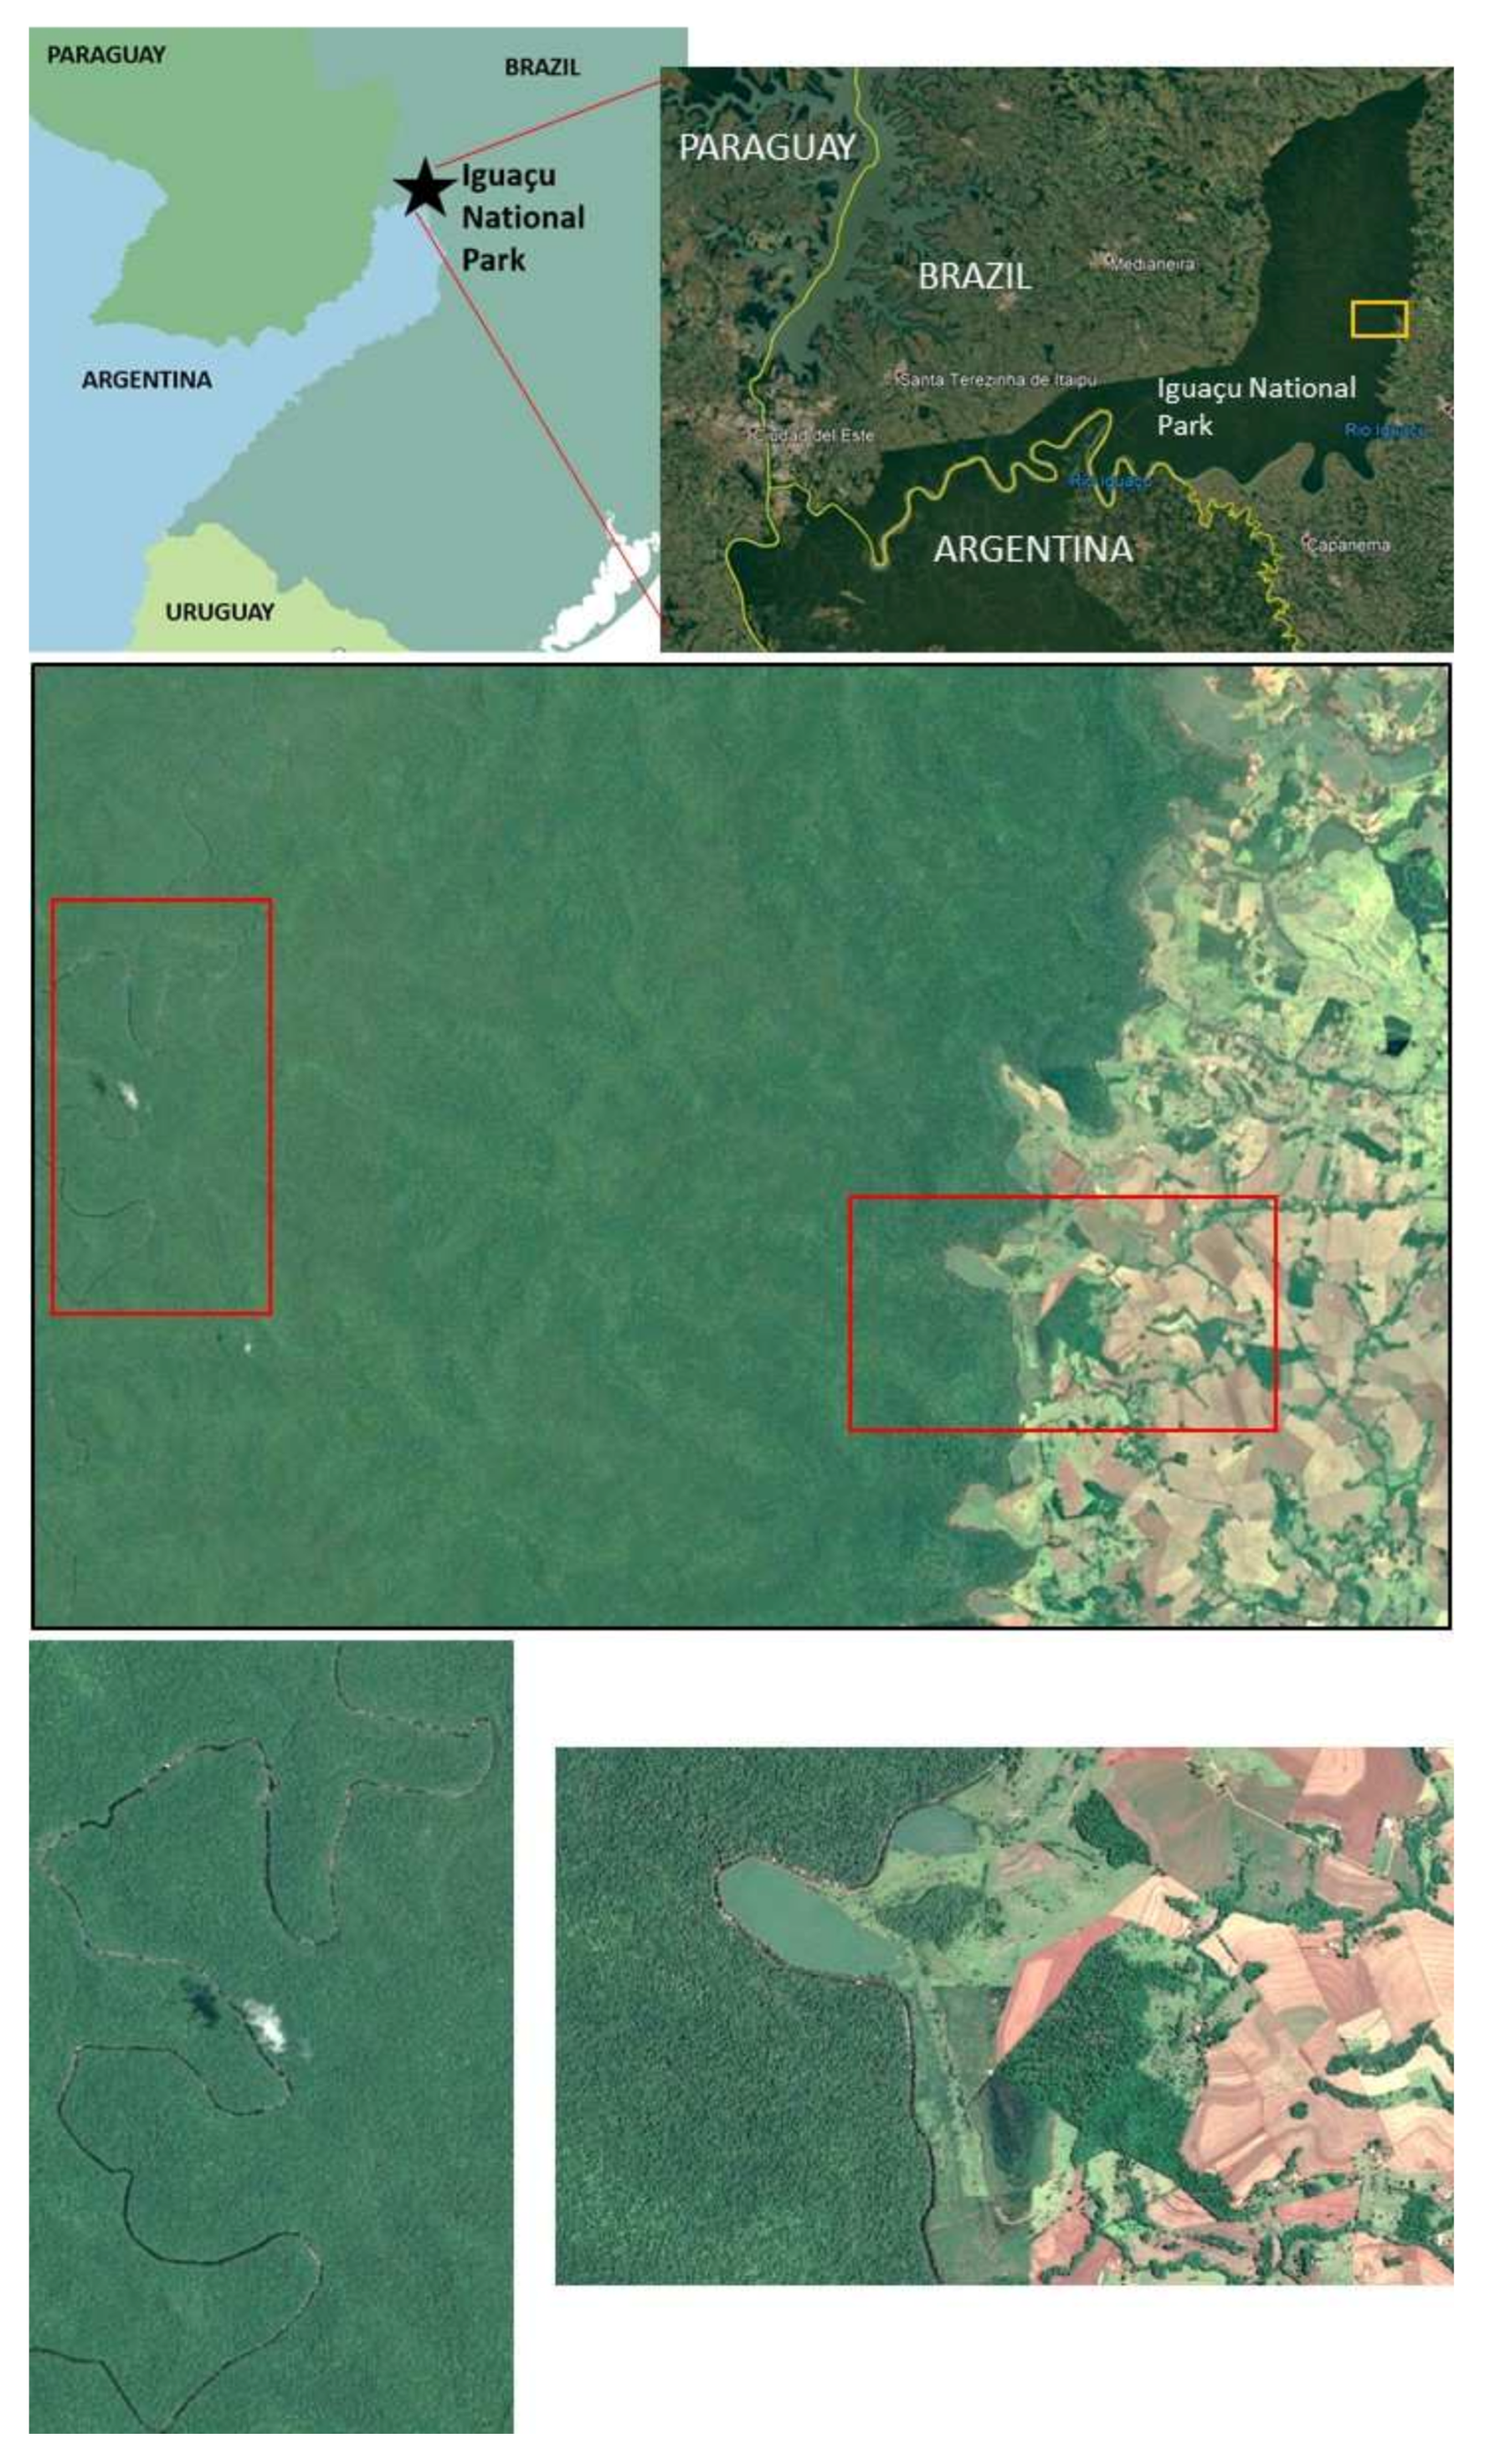
As indicated by the case study in Brazil, rivers often form the boundary of a protected area, but many mapping methods (including in this paper’s global assessment) would consider those rivers to be within, and thus protected by, the protected area. However, there may be distinct limitations for the degree of protection afforded to rivers that form boundaries, because one side of the river, and perhaps a portion of the river itself, may actually fall outside of the jurisdiction of the protected area and be subject to impacts from land-use or activities such as fishing (see
Figure 7). This issue merits further investigation, both in terms of global mapping of rivers as protected area boundaries and studies of the management implications of rivers as boundaries.
Finally, this study focused on the protection of free-flowing rivers, a status that derives from characteristics across multiple spatial scales. The designation of a free-flowing river is based on the Connectivity Status Index (CSI) value for a given reach, which is influenced by both local conditions (e.g., floodplain development that constricts lateral connectivity) and conditions throughout the network, such as upstream flow alteration, up- and/or downstream fragmentation of longitudinal connectivity, and sediment dynamics. Using the CSI effectively highlights the limitations of classifying a free-flowing river as “protected” if it falls within the boundaries of a protected area; the CSI, and thus, the free-flowing status of a reach inside a protected area, also depends on the conditions outside of the formally “protected” reach [
9,
34]. The Nepal case study illustrates this, as dozens of rivers in Nepalese protected areas would lose their FFR status if proposed hydropower dams (planned outside of a protected area) were constructed up- or downstream of the protected area, affecting the rivers within protected areas by flow alteration or fragmentation of connectivity. In other words, a given protected area can be managed as effectively as possible, yet the rivers within it could lose their FFR status due to decisions and actions outside of the protected area. Note that river-specific mechanisms (e.g., designating a stretch of river as Wild and Scenic) generally also have this vulnerability, in that they do not necessarily prevent impacts, such as dam construction, from occurring downstream or on upstream tributaries, in ways that would compromise the free-flowing nature of the river that the mechanism is intended to protect.
This limitation of protected areas for fully protecting FFRs suggests that broader concepts—beyond inclusion within the boundaries of a protected area or river-specific protection mechanisms—are needed to determine the level of protection, or degree of vulnerability, of an FFR. Abell and others [
9] began to explore this needed expansion, proposing the concepts of “local protection” for a given reach (i.e., what is mapped in this study) along with “comprehensive protection”, which is a function of the extent of protection of the area of the upstream drainage area above the given reach. This concept could be expanded in a few ways. First, the comprehensive protection of Abell and others [
9] focuses on upstream conditions, but an FFR is also vulnerable to changes that take place downstream (e.g., from a dam blocking fish migration in the upstream direction). Second, comprehensive protection (sensu [
9]) is calculated as a function of the extent of the upstream area within protected areas (e.g., percentage of land area). However, this overlooks the specific network vulnerabilities of an FFR. A reach could have 90% of its upstream area under protection, but the unprotected 10% may allow the construction of a dam that would lower the reach’s connectivity status value such that it loses its FFR status. Similarly, even with 100% of the upstream area in some form of protection, that protection may have been established for other resources, such as protecting forests, and may not prevent dam construction. Although maintaining natural vegetation is important for water quality in a downstream reach, the highest priority for protecting a downstream FFR may not be in protecting land cover but in ensuring the channel network remains connected. Thus, the concept of comprehensive protection should be expanded to include more than just the upstream extent of protected areas, but also the protection of key network characteristics, perhaps requiring a broad suite of protection mechanisms [
22]. Policies that prohibit dam construction on certain tributaries, or on the downstream main river, may be more important for maintaining a given FFR than broad spatial coverage of protected areas over the upstream drainage (though that may be important for sediment and water quality). A comprehensive effort to track the extent of protection of FFRs should account for the distribution of various types of protection, ranging from protected land in the upstream drainage to policies that protect connectivity of the channel network at various scales (local, and up- and downstream).
5. Conclusions
At the global level, the proportion of rivers in protected areas is just below the Aichi Target of 17% protection for inland waters, and the proportion of FFRs within protected areas equals that target. However, the extent of protection varies widely across river basins, countries, and continents, and many of these geographic units have a level of protection far lower than the target. Further, large mainstem rivers tend to have a lower extent of protection.
In addition, there are limitations to considering as “protected” those FFRs, or rivers more generally, that are within the boundaries of protected areas. While protected areas in some countries prohibit dam construction and other harmful activities, many countries allow dam construction within protected areas—14% of geolocated planned hydropower dams globally are within protected areas—or, if not officially, enforcement is weak or boundaries can be changed to accommodate development [
19]. Securing strong protection for a free-flowing river adds additional challenges, as FFR status is dependent on conditions of a channel network both up and downstream of a given reach and thus, designating a protected status for a specific reach of an FFR may not protect its free-flowing status from impacts outside the reach.
Protected areas are often established based primarily, or exclusively, on terrestrial resources and, consequently, often fall short of protecting rivers and their ecosystems and species, because they were not designed and/or are not managed to address the patterns and processes that structure and sustain natural aspects of rivers [
35]. Given these limitations of protected areas, fully protecting free-flowing rivers will likely require a range of additional mechanisms not limited by protected area boundaries, whether that is a terrestrially defined PA, such as a national park, or a river-specific designation, such as Wild and Scenic. These mechanisms include legislation, administrative designations, regulations, acquisition of enforceable rights in land or water, judicial actions, and collective management of pooled resources that are directed at maintaining free-flowing rivers and are long-lasting. These mechanisms can focus on protecting connectivity as well as other key processes and resources, such as water quality and biota (reviewed in [
22]).
This review of the limitations of using traditional protected areas to protect free-flowing rivers also suggests that methods to map, quantify, and track the extent of protected FFRs will also need to be more comprehensive. A more comprehensive method will encompass the following:
Rivers within protected areas, with methods to track those rivers that serve as boundaries of protected areas, and thus, may lack the full protection of the relevant designation. Further refinement may include methods to account for how the strength of protections for rivers within protected areas varies across countries (see below).
Rivers protected by river-specific mechanisms not included within the World Database on Protected Areas, such as rivers protected by the mechanisms reviewed by Perry and others [
21].
Rivers protected by water allocation or other water-management policies that serve as de facto river protection policies. Examples include Environmental Water Reserves in Mexico and instream flow standards, such as those of Connecticut (USA) [
22,
23].
Across these types, quantify and track across geography and river sizes and types. The extent of river protection should be assessed across environmental and biogeographical patterns, such as river sizes [
2] and types [
36], and potentially stratified by Freshwater ecoregional Major Habitat Types [
37] and biogeographic realms [
38].
Further categorize the extent of protected rivers by the strength of protection of different measures across geographies, such as whether dams are formally or informally allowed. Higgins and others [
22] review additional ways to measure the strength of protection policies, including the extent of protection for various river processes, whether protections are legally protected and enforceable, the duration of protection, and whether protections are sustained through local community norms if not under legal governance.


 ,
, 


