1. Introduction
This paper on the assessment of multi-risks in the Metropolitan Region of Lima, Peru, is based on the results of the RIESGOS project [
1]. A successful management of risk needs a multi-risk perspective. For this purpose, we studied the interactions between different events and potential cascading effects due to the disruption of services of critical infrastructures. The impacts of a magnitude 8.5 earthquake and a subsequent tsunami event, as the baseline scenario, were analyzed by another component of the RIESGOS project (the so called “multi-risk demonstrator”) [
2].
Technically speaking, disaster risk is defined as a “combination of the probability of an event and its negative consequences” [
3]. However, risk perception of the (potentially) affected people often differs from statistically derived numerical risk assessments. Addressing this gap is one of the most challenging tasks for inclusive risk governance and effective regulation. This can be partly addressed by effective risk communication [
4,
5,
6].
Latin American cities are especially exposed to hazards, mainly earthquakes and floods [
7]. A total of 80% of disasters occur in cities and especially affect the poor [
8]. In this sense, in recent decades Latin America has experienced an increase in the incidence of disasters related to extreme weather events [
9]. This is because the Andes mountain range generates one of the highest precipitation gradients in the world and its cascading consequences have been extensively studied [
10]. In this context, the exposure of Latin American cities increases due to their high levels of urbanization. Since 1950, the macro-region of Latin America has experienced rapid urban growth and, currently, 83% of its population lives in urban areas [
11]. However, this trend is showing a drastic decrease, from 4.5% annually in 1950 to 1.3% in 2020 [
12]. The trend shows a continuous growth at a slow pace, which is switching from large centralized cities to cities with populations between 1 and 5 million [
11]. This rapid population growth and its disorganized urbanization process have created highly uneven cities with degraded natural landscapes, rendering the region as highly prone and vulnerable to extreme weather events. Unequal access to services, huge disparity in wages, weak social security systems, informal jobs, unregulated urban sprawl and informal settlements, overcrowded and located in disaster-prone areas, along with weak urban planning, indicate high vulnerabilities in the region in the face of disasters [
9].
Peru is one of the Latin American countries that is regularly affected by disasters; the most frequent are floods and extreme rains but the country is also prone to earthquakes and tsunamis [
13]. The capital of Peru, Lima, is located on the central coast of the country. Together with the port of Callao, it is the biggest city and metropolitan area of Peru, with a current population of almost 12 million [
14]. It is formed by the province of Lima (43 districts) and the constitutional province of Callao (seven districts), the main activities of which are in the industry and commerce sectors. According to the political administrative division of the government, the Metropolitan City of Lima has competences from both the regional and local government.
Lima is located near the meeting of the South American and the Nazca tectonic plates and is crossed by three large rivers. Lima is exposed to natural hazards such as tsunamis, earthquakes, heavy rainfall, flooding, landslides and flash floods, triggered by El Niño–Southern Oscillation (ENSO); the latter three have been the most recurrent over the last 15 years. Nevertheless, the most damaging hazards across the whole city have been earthquakes, followed by landslides [
15].
As the country’s capital and the largest urban agglomeration, the city of Lima is characterized by its unplanned, disorganized and unequal urban growth, which affects especially its poor population. The poor quality of housing and the poverty spread to the hydrographic basins and areas with unstable soils, leading to a highly vulnerable city [
15]. Thus, Metropolitan Lima shows a high need for the management of disaster risk by not only developing protection against multiple hazards but also by reducing the vulnerability of people.
The disaster risk management (DRM) system in Peru is regulated under the law N°29664. Here, the superior governing body is the National Council for Disaster Risk Management (CONAGERD), which is in charge of the decision-making process and coordination for all DRM processes. The National Center for Estimation, Prevention and Reduction of Disaster Risk (CENEPRED) and the National Institute of Civil Defense (INDECI) give technical assistance to the government in relation to their specialization: CENEPRED for prevention and INDECI with regard to preparedness, response and rehabilitation processes. These two institutions guide most DRM processes at the national level, leaving the reconstruction works under the charge of the Ministry of Housing, Building and Sanitation (MVCS).
In alignment with the Organic Law of Regional Governments N°27867, the Metropolitan government of Lima has a Disaster Risk Management and Civil Defense Office that formulates, executes, evaluates and manages the norms and plans of DRM for the city in accordance with the national policy. They take action in the prevention and rehabilitation processes, while directing the local DRM working groups and the Regional Emergency Operation Centers (COER). The COER takes responsibility for monitoring threats, emergencies and disasters, managing risk information for timely decision-making. It is made up of the regional presidents or mayors, respectively, and representatives of directors and officials of the Armed Forces, the Peruvian Red Cross, the Volunteer Firefighters of Peru and the National Police of Peru.
The city has a Mitigation and Disaster Risk Reduction Plan for Metropolitan Lima (PPRRD LM 2019–2022), the objectives of which are to develop risk knowledge, avoid the generation of new risks, reduce current risk, strengthen institutional capacities and promote citizen participation for a better DRM culture in the city [
15].
Beside this, the regional and local governments for this Metropolitan area have developed some of their own strategic and land-use plans, which deserve a mention with regard to DRM in the city. According to supreme decree N° 022-2016-VIVIENDA, a Metropolitan Development Plan should guide land use planning in Lima, but this instrument has not been developed since 2010. In its absence, comprehensive development plans and district zoning maps take its place. Due to the lack of this plan, the current zoning maps are updated without a proper analysis and are based on the last plan from 1990–2010. Most of these plans maintain a general view of risks for the city, putting emphasis on the recurrent and most damaging risks and recognizing their critical zones (river basins, coastline, historical center and informal settlements) [
16,
17,
18,
19]. Nonetheless, a great inconsistency with regard to the implementation and execution of budgets can also be noticed in these plans. Budgets are mainly used to address preparedness and emergency response actions. Additionally, the analysis made in the plans for the regional government of Callao makes a short mention of safeguarding the provision of basic services infrastructure in risk zones and recognizes the lack of implementation and analysis of safe zones and evacuation routes.
Being aware of the given risk profile of Metro Lima means addressing specific multi-risk challenges regarding the assessment and management of risks. Spatial planning at state, regional or local levels is responsible for the development of a particular spatial area (where the interactions of different hazards and vulnerabilities define the overall spatial risk) and not for a particular object or threat (e.g., sectoral engineering sciences) [
20]. Therefore, spatial planning must adopt a multi-hazard approach in order to appropriately deal with risks and hazards in a spatial context, which is inherent whenever natural hazards are addressed [
21]. With a multi-hazard perspective, cross-sectoral as well as cascading effects come into focus.
Concepts for assessing risk from a spatial perspective were first developed by geographers in the 1970s [
22]. This was first dominated by a focus on mapping hazards (“hazards of place”) and risks. However, as Cutter [
23] noted, further methodological elaborations on this subject were only rarely attempted until the mid-1990s. In contrast to geography, a spatial approach to hazards, vulnerability and risk has not been addressed by the discipline of spatial planning for many years, especially in Europe. Although there is a tradition of spatial planning research for single hazards (coastal flooding, river flooding, earthquakes, nuclear power plants), an approach to hazards and vulnerability from a spatial perspective was only undertaken from the late 1990s onwards. It is thanks to authors like Burby [
20] and Godschalk [
24] that the important role spatial planning can play in the whole disaster management cycle was highlighted. Jabareen [
25] emphasized the multi-functional and multi-dimensional character of resilience and the spatial dimension of risk, uncertainty and vulnerability. Spatial planning is especially important in the phase of prevention, which aims at a reduction of the damages to people, property and resources before a disaster strikes. Further, spatial planning can also play an important role in the area of reconstruction in the aftermath of a disaster by attending to a better and more sustainable reconstruction of cities and human settlements (e.g., the principle of “build back better”) [
26].
Decisions about future land-use have long-term effects (e.g., on physical structures like buildings or infrastructure) and are often irreversible. Furthermore, whenever such decisions are taken, risks are unavoidable. Therefore, spatial planning has to always anticipate the consequences of planned actions. In this way, uncertainty about future consequences can be reduced and confidence in the legitimacy of the respective democratic decision-making bodies can be increased. This is particularly relevant in cases of decisions about dangerous industrial structures and managing natural hazards [
27].
One main reason for the recent change of perception on the role of spatial planning is the realization that risk potentials are increasing and that it is not sufficient to restrict risk policies only to the preparedness and response phase of the risk management cycle. Rather, in order to promote sustainable development, preventing hazards is an indispensable prerequisite—a task for which spatial planning has to develop appropriate tools [
28]. Not only an early, but also a more complex, approach is needed to address multi-risks: risk governance goes beyond risk management. The International Risk Governance Council’s framework for risk governance was developed as an integrative approach to include all available information from experts and local stakeholders into the risk management cycle [
29]. In 2018 the framework was expanded for systemic and for unexpected risks (multi-risks) [
30].
An integrated multi-risk assessment is the inevitable basis for multi-risk governance [
31,
32,
33,
34,
35]. Multi-risk assessments “determine the total risk from several hazards either occurring at the same time or shortly following each other, because they are dependent from one another or because they are caused by the same triggering event or hazard; or merely threatening the same elements at risk (vulnerable/exposed elements) without chronological coincidence” ([
36], p. 11). This kind of assessment looks at the interdependencies of the occurring hazards and requires a consideration of cascading effects, even outside the exposed area. Coinciding hazards can result in cumulative and cascading effects, meaning that one hazard can follow up with subsequent hazards with bigger impacts and, in total, accumulate negative effects. However, multi-risk assessments are not yet the state of the art. A multi-risk assessment calls for decisions in land-use planning on tolerating or altering these interactions and appropriate mitigation measures. Assessing multi-risks is rather complex and still remains a challenge. A detailed multi-risk assessment is connected to the difficulty of quantifying all kinds of scenarios and working with a large amount of data, meaning that technical standards are required and the needed data must be made available. Challenges of assessing multi-risks occur because of the interdependencies of sectors and related communication channels and require a multi-risk governance approach [
37] that is based on the foundations of deliberative democracy [
38].
Deliberative methods are used as a major approach to identify and address the people and organizations that might be affected by multi-risk events and ensure their active participation in multi-risk governance. These methods also provide platforms for resolving potential conflicts and problems in an efficient, effective, resilient and fair manner [
39,
40]. This is best accomplished by combining analytic and deliberative ways of processing information and forming evidence, as well as judgments based on common good orientations. The US Academy of Sciences has provided guidance of how to design and structure analytic–deliberative processes [
4]. The main objective is to link the scientific expertise (analytical component) with innovative procedures of public and stakeholder involvement (deliberative component). Such an analytic–deliberative process produces more valid, reliable and fair decisions as it enriches the decision-making process with relevant viewpoints, interests, values and information [
41].
However, the impacts of extreme events are not solely determined by a given place-based vulnerability and risk profile, but considerably influenced by cascading effects caused by the service disruptions of critical infrastructures (CIs) which may even take place outside the exposed areas [
42]. Little knowledge is available about these cascading effects and there are no related management concepts in place in Peru.
Data from recent mega-disasters prove the assumption that cascading effects, which cause disruptions in infrastructure networks and supply chains, result in more economic losses than direct damages within the exposed areas. For example, the floods in Bangkok in 2011 resulted in direct damages of USD 45.7 billion; however, the indirect economic losses due to supply chain disruptions associated with the event were approximately USD 259 billion [
43]. The Great Eastern Japan Earthquake near the Pacific coast of Tōhoku province and the following tsunami in 2011, which also resulted in the Fukushima Daiichi nuclear disaster, were associated with direct damages of USD 335 billion. Also considering the economic losses from disrupted supply chains and the electricity blackout, damages were estimated at USD 600 billion in Japan alone [
44]. Hurricane Sandy caused direct damages of about USD 50 billion in New York in 2012. Again, supply chain disruptions due to this event caused indirect economic losses of circa USD 250 billion [
45]. Also, the current Covid-19 pandemic is costing between USD 8.1 and 15.8 trillion globally, primarily because of disrupted global supply chains [
46].
Recent publications and policies have developed a systemic risk perspective that goes beyond a place-based multi-risk perspective [
42,
47,
48]. From this systemic point of view, it is argued that cascading effects may take place outside the defined planning area (e.g., a region or municipality). From this systemic perspective, critical infrastructure plays a key role. A proper assessment of criticality requires a network-wide, trans-sectoral perspective and observations are required at metropolitan, regional, or even national, levels. How can the criticality of infrastructure be assessed?
The European Union defines critical infrastructure as “assets or systems, essential for the maintenance of vital social functions, health, safety, security and economic or social wellbeing of people” (see Article 2, Council Directive 2008/114/EC) [
49]. This directive determined the following criteria for criticality (see Article 3, §2) but didn’t provide a methodology for assessing criticality holistically:
- -
causalities criterion: assessed in terms of the potential number of fatalities or injuries;
- -
economic effects criterion: assessed in terms of the significance of economic loss and/or degradation of products or services; includes potential environmental effects;
- -
public effects criterion: assessed in terms of the impact on public confidence, physical suffering and disruption of daily life; includes the loss of essential services.
However, negative consequences caused by hazards of any kind are typically assessed through an examination of vulnerability. Established disaster risk concepts cannot address the systemic criticality of CI systems and subsystems [
50,
51,
52,
53]. Probabilistic risk assessment approaches rely on linear cause–effect relationships that do not exist in complex systems [
30]. Therefore, system failures are out of their scope [
54]. Moreover, risk and vulnerability are place-based concepts but CIs are of a functional character [
27]. Finally, (inter-)dependencies require “an assessment of […] the entire network of an infrastructure (e.g., electricity) and its potential cascading effects on other infrastructure systems” ([
55], p. 9). Even if risk analyses are carried out for single facilities, their embeddedness in the greater system of infrastructure systems (so called “systems-of-systems”) cannot entirely be considered [
56,
57].
Criticality is an emerging topic in a globalized interconnected world. It is a relative measure of the importance of an infrastructure in relation to the consequences of a disruption or failure for the security of a supply of important goods and services to society. Systemic criticality defines an infrastructure of very high importance for society within an overall system based on its structural, functional and technical position. Critical infrastructure can amplify risks within a system (e.g., the whole country or even the entire globe) although the physical damage may be restricted to only a very limited area (e.g., a highly frequented bridge); or, vice versa, physical damages in remote areas can have considerable negative (economic) effects on the central region or town. This increases the challenges of risk assessment and management because planning authorities do not have appropriate information on systemic criticality at hand. Consequently, the systemic focus of criticality runs counter to the areal-oriented view of spatial planning which is primarily asked to place key infrastructure elements outside exposed areas [
27]. However, this depends on information about which infrastructure system elements are worth protecting due to their systemic criticality.
In conclusion, cascading effects can neither be addressed by place-based management concepts of spatial planning nor solely by technical solutions but require comprehensive risk governance. In this context, fast and effective risk communication is of utmost importance to secure adequate behavioral responses. Participatory uncertainty assessments are necessary in close collaboration with stakeholders. Apart from mapping hazards and vulnerability, recent approaches also discuss the participatory mapping of resilience as an opportunity to open-up conversations for more inclusive resilience policy [
58].
In addition to a multi-risk assessment and its output, a parallel approach, the assessment of systemic criticality, is needed (see the section on methods for a more detailed explanation). Criticality is not an absolute value but must be considered relative to its context. Thus, propositions on the criticality of a system component, be it a facility, network segment or subsector, can only be concluded in a context-specific manner [
57] and were therefore addressed in this paper with regard to the setting of Lima, Peru. The appropriate methods and tools to address the spatial and temporal dimensions of vulnerability and resilience are mapping and scenarios of both physical and actor-based interconnections [
59,
60].
Multi-risks are a well-established issue in international strategies, which acknowledge that risk mitigation measures could create synergies for other hazards as well. Therefore, the Sendai Framework for Disaster Risk Reduction, which was adopted at the Third UN World Conference on Disaster Risk Reduction in Sendai in 2015, asked for disaster risk reduction practices “to be multi-hazard and multi-sectoral, inclusive and accessible in order to be efficient and effective” ([
26], p. 10). Moreover, a better understanding and operationalization of systemic criticality appears to be necessary. The first priority of the Sendai Framework emphasized this need further. However, there is still dissent as to how systemic criticality is to be understood and, thus, operationalized [
27]. Moreover, the Sendai Framework came up with a specific global target (target D): “Substantially reduce disaster damage to critical infrastructure and disruption of basic services, among them health and educational facilities, including through developing their resilience by 2030” ([
26], p. 12). The measuring value for criticality is just the number of disruptions of services [
61]. The most recent UN-ISDR (United Nations International Strategy for Disaster Risk Reduction) Global Assessment Report addressed so-called “systemic risks” and referred specifically to the importance of cascading effects and the spatio-temporal characteristics of these risks [
62].
The 2030 Agenda for Sustainable Development pointed to the need to reduce disaster risk as a part of sustainable development, this being especially addressed in the targets of SDGs 1 and 11. With SDG 1 (“End poverty in all its forms everywhere”) the Agenda aims to “build the resilience of the poor and those in vulnerable situations and reduce their exposure and vulnerability to climate-related extreme events and other economic, social and environmental shocks and disasters” (target 1.5) and for SDG 11 (”Make cities and human settlements inclusive, safe, resilient and sustainable”) it says that “the number of cities and human settlements adopting and implementing integrated policies and plans towards inclusion, resource efficiency, mitigation and adaptation to climate change [and] resilience to disasters” should be substantially increased and that a holistic disaster risk management should be developed and implemented at all levels (target 11.5) [
63]. This clearly acknowledges that risk management cannot be seen as a sectoral approach to single hazards and risks because aspects of exposure and vulnerability have to be taken into account, which are also relevant for multiple hazard settings.
The New Urban Agenda ([
64], p. 7), which was adopted at the United Nations Conference on Housing and Sustainable Urban Development (Habitat III) in Quito in 2016, explicitly mentioned that cities should (in their area of responsibility) “adopt and implement disaster risk reduction and management, reduce vulnerability, build resilience and responsiveness to natural and human-made hazards and foster mitigation of and adaptation to climate change”.
With regard to climate change, the Intergovernmental Panel on Climate Change (IPCC) argued with its AR5 that “Effective implementation of adaptation policies depends on cooperation at all scales and can be enhanced through integrated responses that link adaptation with other societal objectives” ([
65], p. 94).
These policy documents clearly underline that adaptation processes require a transdisciplinary approach and broad stakeholder involvement [
66,
67]. A multi-hazard and multi-risk governance approach is required due to the interdependencies between the hazards and given cascading effects, as well as the vertical and horizontal interplay between the authorities responsible for assessing and managing these threads [
68].
2. Methods
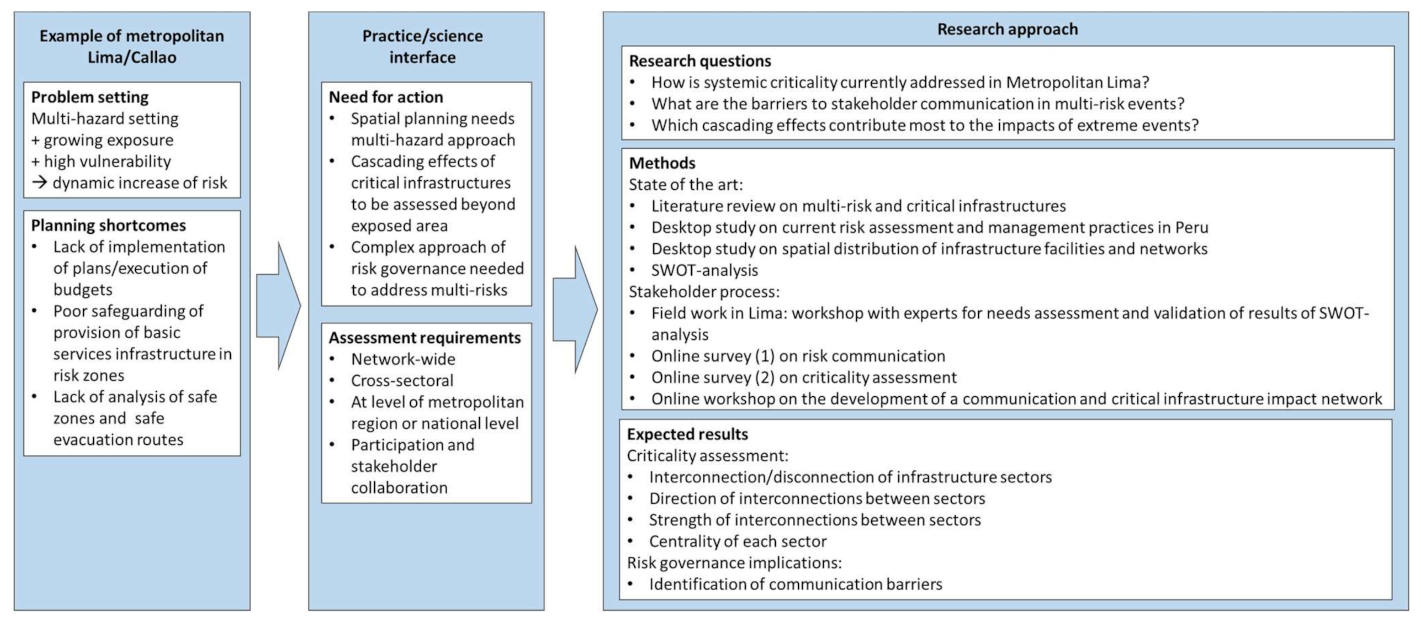
Our study was guided by the following research questions:
How is systemic criticality currently addressed in Metropolitan Lima?
What are the barriers to administrative stakeholder communication in multi-risk events?
Which cascading effects contribute most to the impacts of extreme events?
Our study primarily addressed the assessment sphere of the risk governance framework and concluded with barriers in communication between administrative stakeholders. Further (risk management) steps are up to those actors who are legitimized to take action in Peru.
Departing from the problem setting and the challenges for practice and science, the following figure (
Figure 1) shows the concept of the research and how research questions, methods and expected results were connected. The findings are based on a participatory multi-method stakeholder approach that aimed at providing a comprehensive picture of risk governance and conceptualizing an approach to deal with systemic criticality: Proceso Virtual con los Sectores Involucrados sobre Comunicación de Riesgos y Evaluación de Riesgos Múltiples (Virtual Process with Relevant Sectors on Risk Communication and Multi-Risk Assessment).
The international literature review was guided by the same keywords that are mentioned at the beginning of our paper (critical infrastructures, risk governance, urban regions, criticality, multi-risk assessment, multi-risk management). The key findings are presented in the introduction section. The desktop study on risk assessment and management practices considered existing land-use plans and emergency management plans. It was guided by the same keywords as mentioned above. Both elements addressed the first research question. In addition, we did a GIS-based analysis of the spatial distribution of infrastructure facilities and networks in metropolitan Lima that served as important input for the third research question.
The findings from the literature review and research on current practices in Peru served as the basis of a SWOT (strengths, weaknesses, opportunities, threats) analysis to identify primary strengths and weaknesses, as well as opportunities and threats.
Primary data were gathered from fieldwork in Lima, i.e., discussions, and a workshop with experts from spatial planning and emergency management and operators of critical infrastructures on 19 November 2019. These data served as a needs assessment and validation for the results of the desktop and SWOT analyses of the existing risk governance system.
The initial plan was to conduct further face-to-face stakeholder meetings in 2020. However, due to the COVID-19-pandemic, these meetings could not be conducted as planned. Therefore, the research concept was adapted to a combination of different online methods in order to solve the questions according to the IRGC framework of systemic risks [
30]; this adaptation mainly concerned risk communication needs (online survey 1), the criticality of infrastructure (online survey 2) and, finally, an online workshop on the co-development of a communication and critical infrastructure impact network. These interactive elements were appropriate for addressing the second research question on risk communication barriers.
The local knowledge of the stakeholders about how to identify uncertainties and unexpected barriers is essential for understanding the actor-based interconnections between critical infrastructure sectors and for developing a comprehensive risk management strategy. Thus, we further developed previous approaches towards a process for enacting an inclusive governance mode that incorporates input from social stakeholders and affected citizens [
30]. The first online survey on risk communication represented the initial step for the elaboration of the recommendations for the communication of multi-risks. The aim was to survey the actors and their communication relationships and to have their influence and interest assessed.
The survey was created in Lime Survey and the results illustrated in the form of an actor network graph (see results section). In order to create the communication network between the main stakeholder groups, the answers to the following questions of the survey were used:
- -
With which actors do you or your organization mainly collaborate?
- -
What is your overall assessment of risk communication between stakeholders in Peru?
- -
From your viewpoint, which actors play an important role in risk communication?
The second online survey on criticality assessment, also created in Lime Survey, addressed operators of critical infrastructures and representatives of the administration (overall spatial planning, sectoral planning, risk management). The survey was introduced and explained in an online information seminar for the addressees of the approach. The aim of the survey was to answer the third research question by identifying which dependencies exist between selected critical infrastructure sectors and—in case one of the critical infrastructures fails—to identify those infrastructures that have the greatest effects on other critical infrastructures.
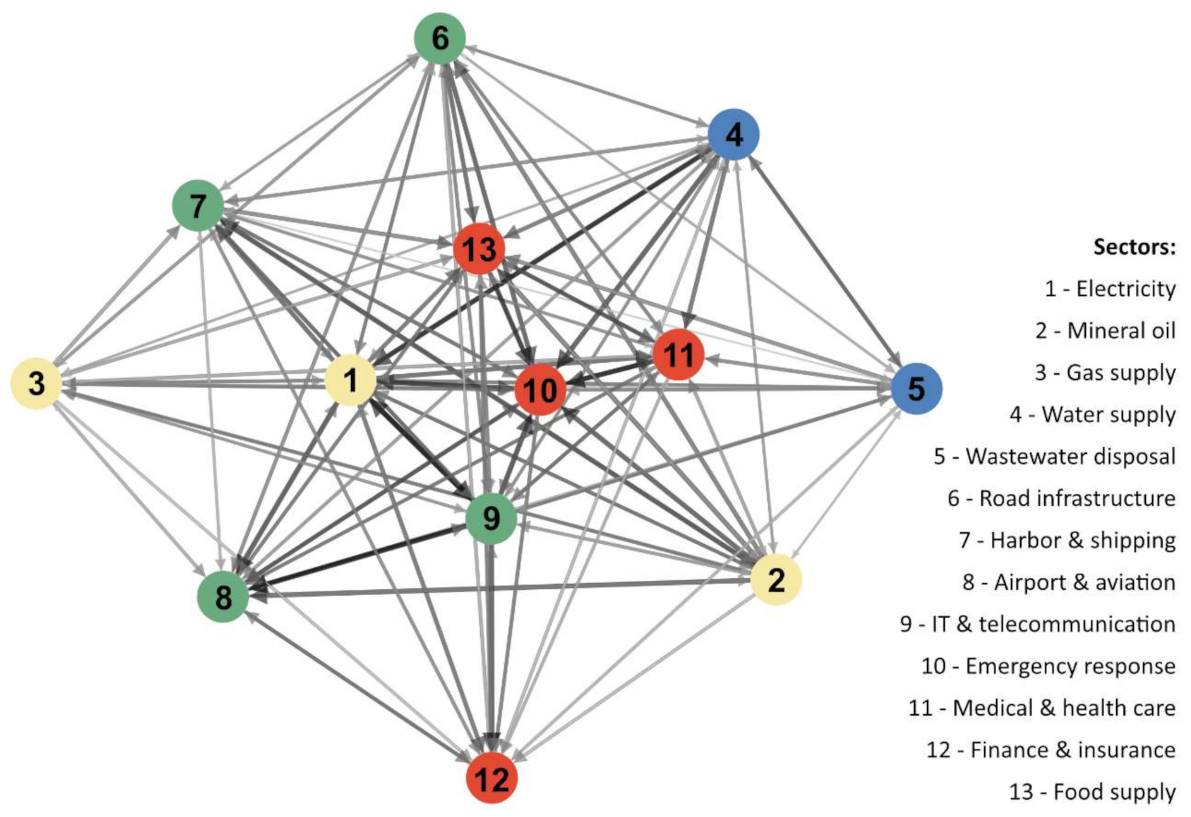
As a basis for the criticality assessment, the following 13 sectors were identified and considered in the assessment: electricity, mineral oil, gas supply, water supply, wastewater disposal, road infrastructure, harbor and shipping, airports and aviation, IT and telecommunications, emergency response, medical and health care, finance and insurance and food supply. The selection of relevant sectors was made as an output of literature research [
48] and was validated by the participants of the November 2019 workshop in Lima.
The systemic criticality of these sectors was estimated by a semi-quantitative approach and afterwards calculated and visualized by a network analysis with the open source network analysis software Gephi [
69]. With this software it is possible to visualize sectors as nodes and their interconnections as edges in a network. It works with an algorithm that imitates physical push-and-pull forces, depending on the number and strength of the edges. In this way, a highly interconnected sector will be drawn more to the center of a network while less interconnected sectors are pushed to the edge of a network.
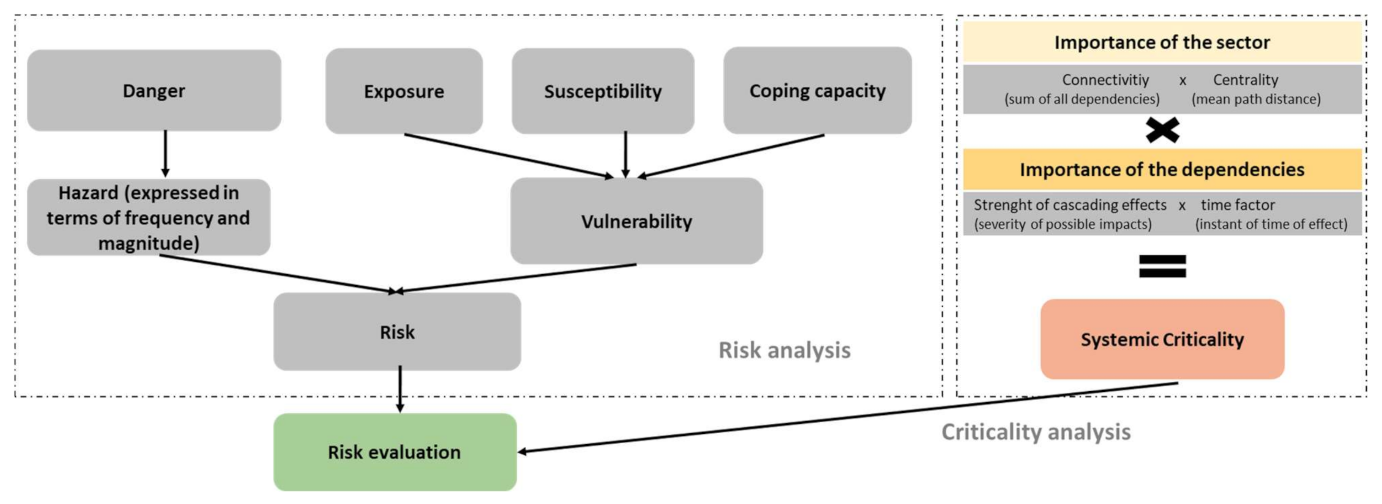
The calculation followed the conceptual framework shown in
Figure 2, which is not part of a place-based risk analysis framework:
The first factor calculated the importance of the sectors. The basic assumption for this calculation was that a sector was more important the more interconnected it was with other sectors. The factor consisted of two components that were multiplied: the level of connectivity described how many connections a sector had with other sectors in the network and was calculated by the sum of in- and outgoing connections. To estimate the number of interconnections we asked the participants of the survey if one sector (A) was dependent on another sector (B) for its functioning. The degree of centrality stood for the average, normalized proximity of one sector to the others and could be automatically calculated by Gephi.
The second basic assumption, which was the basis for factor two, was that a sector was more dependent on another sector the stronger and the faster it got hit by a potential cascading effect. It was obtained by multiplying the strength factor and the time factor.
The calculation of the average strength of a potential cascading effect of one sector on the other sectors was based on their dependency on a sector. The related question in the survey was: how strongly is sector A dependent on the following sectors for its functioning (0 = not at all, 1 = low, 2 = medium, 3 = high, 4 = fully)?
For the calculation of the time factor of a potential cascading effect, the participants were asked about the period of time it would take for the operation of a sector A to be heavily affected or failing because of a disruption of another sector. The factor was weighted as a power of two, such that a lower failure time was assigned a greater weight (0 = never, 2 = after 2 weeks, 4 = after 4 days, 8 = after 24 h, 16 = after 4 h).
The two factors (importance of the sector and importance of dependencies) were multiplicatively linked. The multiplication was justified by the fact that the overall systemic criticality was automatically zero as long as a sector was totally unimportant or cascading effects were non-existent. A multiplication implied an equal weight of each component. This was justified by the equal importance of both factors for determining systemic criticality [
70,
71].
The survey results, in terms of bi-directional interconnections between the various infrastructure sectors, as well as the centrality of each sector, were visualized by a network analysis. The actor network graph and the network analysis as the main results of both online surveys were presented at an online meeting (virtual stakeholder workshop) on 24 November 2020.
3. Results
The first research question dealt with the current state of affairs in systemic criticality in Metropolitan Lima. Our own evaluation of existing risk management strategies, carried out as a part of the RIESGOS project [
1], proved the fact that no attention has been given to the system of infrastructure systems and its systemic criticality, but only to the physical characteristics of infrastructure facilities [
72,
73,
74]. During the fieldwork for the RIESGOS project in 2019 in Lima, another challenge was noted. The national DRM informational system (SIGRID) recognizes critical points, but not comprehensively. Individual institutions are responsible for recognizing their critical points.
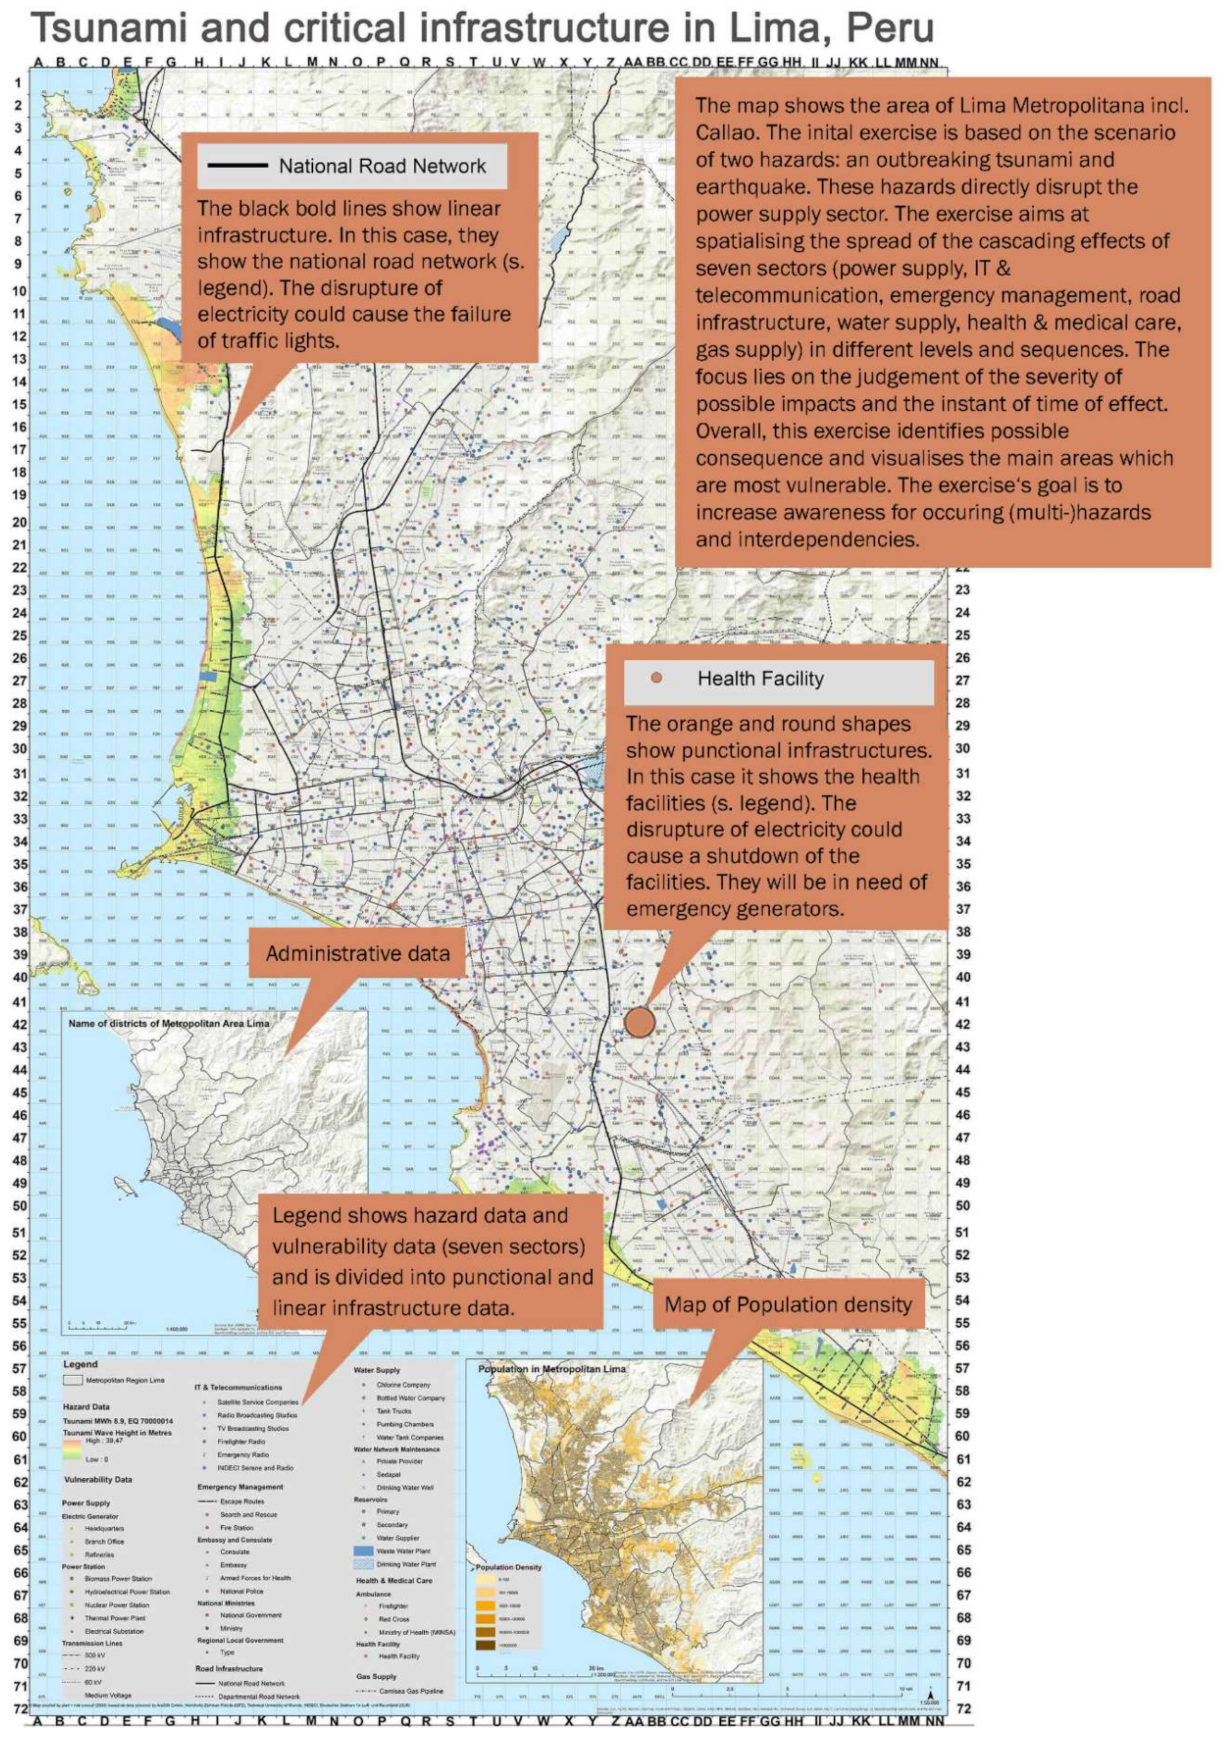
The following map (see
Figure 3) shows the results of our desktop study on the spatial distribution of infrastructure facilities and networks in Metro Lima. It indicates the tsunami prone areas along the Pacific coastline (in green to red colors depending on the projected inundation depth). Clearly visible is the interconnectedness of the various infrastructure networks (electricity, water, telecommunication, transport) which exceed the borders of Metro Lima. Major parts of the motorway system (motorways 100 in the north and 1S in the south) are located along the tsunami prone coastline. The same is true of the main harbor in Callao and the nearby international airport.
Even though DRM processes are gaining growing importance in city governance, the challenges are still considerable, as noticed by local governments [
15,
16,
17,
18,
19]. Overall, our SWOT analysis of the performance of existing land-use plans and emergency management plans summed up the key features of the current local system as shown by the following
Table 1:
The second research question concerned barriers to stakeholder communication in multi-risk events. A total of 51 respondents took part in the first online survey on risk communication and 16 respondents took part in the second survey on criticality assessment, mainly representatives from public and private organizations dealing with disaster risk management in a professional context (see the
Supplementary Materials for more detailed information). The participants of the surveys were from the following stakeholder groups: public sector (national level), public sector (regional level), public sector (local level), research, non-governmental organizations (NGOs), civil society organizations (CSOs), private companies and international development organizations (see
Supplementary Materials).
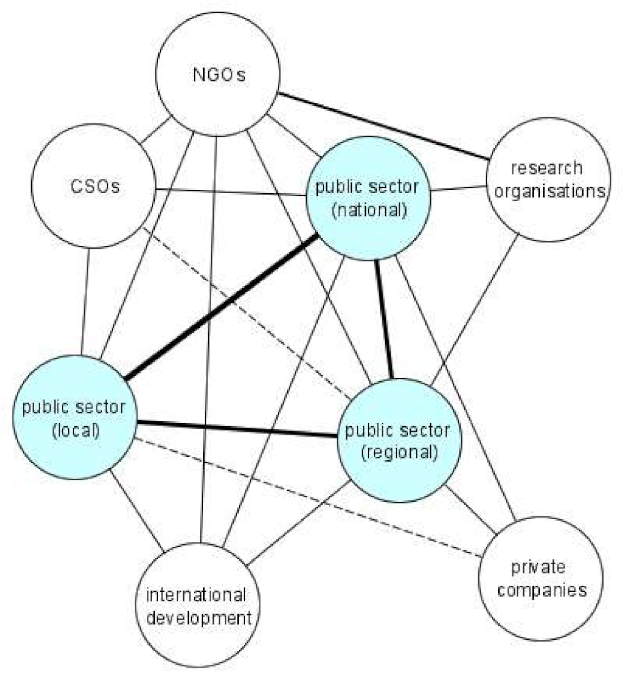
Figure 4 shows the results of the first online survey on risk communication. It illustrates the interactions between the Peruvian stakeholder groups, as well as the quality of the interactions: the thickness of the lines shows the strength of the communication between stakeholder groups. There was close communication between the public sectors on different government levels (local, regional and national). Problems occurred in the communication between public authorities and other sectors: a major part of the participants of the survey (58%) indicated insufficient or rather insufficient communication between the public sector and research organizations, and about half of the respondents indicated the same between the public sector and the private sector.
The third research question (“which cascading effects contribute most to the impacts of extreme events?”) was addressed by the second online survey on criticality assessment with 16 participants mostly from the public administration and infrastructure sectors. On this data basis, we calculated how important one sector was for all other selected sectors. The more interconnections there were, the more important the sector was. Since there were 13 sectors, the highest possible sum of in- and outgoing connections was 24. The level of interconnection of the emergency response sector was 23.5, which meant that almost all participants of the survey thought that the emergency response sector was dependent on all other 12 sectors and also that, the other way round, all 12 sectors were dependent on the emergency response sector. Even the lowest sector, the elimination of wastewater, still had more than 20 interconnections.
To illustrate these results, a network of the sectors was created. The different colors shown in
Figure 5 represent categories of grouped sectors:
- -
yellow: energy generation, distribution and supply;
- -
blue: water;
- -
green: connection of people and goods;
- -
red: human health and safety.
The thickness and color of edges shows the strength of the interconnections, while the arrowhead shows the direction(s), since several of them were of a bi-directional character. Finally, the position in the network indicates how strongly the other sectors were dependent on a sector: Electricity, IT and emergency response constituted the core of the system of infrastructure systems.
As shown in
Table 2, the sum of all interconnections was rather similar among the various sectors and the degree of centrality of all sectors was 1, meaning that all sectors were directly interconnected with each other. In fact, there was a very high overall degree of interconnections. Consequently, all sectors were similarly important.
Factor two (concerning the parameters for the strength and speed of a potential cascading effect) showed some more significant differences. Most sectors had an average strength factor between 2 and 3. This means that a potential cascading effect departing from, for example, the electricity sector, would hit another sector on average at a medium to high strength. The highest strengths were found for the electricity, IT and telecommunications and mineral oil sectors (all above 2.5), while the entire system was less dependent on the finance sector. Moreover, the electricity sector showed the highest temporal sensitivity, meaning that a failure of electricity supply had the quickest negative impact on the other sectors. Overall, the time factor was the most important determinant for the differences in the systemic criticality of the sectors.
The results of both surveys were used to inform the subsequent step of the approach, a stakeholder meeting on 24 November 2020 (virtual stakeholder workshop) with 35 Peruvian stakeholders (see the
Supplementary Materials for more detailed information). This workshop was jointly organized by the research team and the Peruvian National Center for Strategic Planning (Centro Nacional de Planeamiento Estratégico, CEPLAN). The participants explicitly mentioned the following examples of barriers in risk communication:
Even if the institutional relationship between organizations is strong, communication happens between people. The availability of people is crucial and it becomes a problem when the staff changes (due to political processes, for example).
The role of the regional authorities is crucial but there is a weakness in vertical communication: they have to wait for information from the local authorities (which are usually overwhelmed in risk events) and give the information to the national authorities, which have the duty of responding to multi-risk events.
The communication between companies and public bodies could be improved, particularly to share information on critical infrastructure for disaster preparedness and response. Some public and private companies (like the water service company SEDAPAL) take action during crises (for example, bringing water to communities) but the support by national authorities is missing.
During the second part of the workshop, the infrastructure network graphic and the systemic criticality results were presented, followed by a feedback and question and answer session. Finally, the participants were invited to vote in an ad-hoc online poll concerning the degree to which the results met their expectations: about 55% of the 35 Peruvian participants indicated that these results were in line with what they had expected while 45% were partly surprised, but not a single participant questioned the plausibility of our findings.
4. Discussion
The results from the presented semi-quantitative, participatory approach seem to be promising and are specifically worth considering for similar settings in the Global South where local knowledge is crucial and for which no comprehensive data basis for model-based approaches exist. Moreover, this approach makes it possible to illustrate and to assess the complexity of the different interconnections and the related first, second and further order effects using a mixed dialogue and model-based approach. Existing approaches are mostly limited to a single sector [
75] or a local scale [
60] and do not include experimental knowledge and expertise of local stakeholders. Most important is the fact that our participatory and heuristic-driven approach made it possible to cope with the multi-dimensional complexity of interdependencies and interrelations between the sectors, as well as between actor networks.
In principle, the protection of infrastructure is seen as a high priority for disaster risk governance that has only been partly implemented in earlier studies: “Peruvian cities are at high risk for earthquakes and there is a dearth of resilience-building programs for essential buildings and infrastructure.” ([
76], p. 209). Due to frequent natural hazards in Peru, there is some awareness that not only the physical elements of infrastructure matter, but also the indirect effects caused by service disruptions: “The impact of these factors on Peru is not only physical losses and the need to replace or repair the damaged components of said infrastructure but also indirectly derived economic and social losses, meaning not being able to provide the services.” ([
77], p. 23). This observation was also proved by our own stakeholder dialogues. Almost all participants underlined the fundamental relevance of this topic. However, there is no real understanding of the concept of systemic criticality nor has any attempt been made to operationalize or even measure it.
In regard to the presented scenario of an 8.4 earthquake followed by a tsunami, the need to consolidate relevant information regarding multi-risks and the systemic criticality of essential systems is evident. However, this is also relevant for other settings which could lead to similar cascading effects, such as tropical cyclones or large-scaled floods, as well as being obviously pertinent when looking at the current COVID-19 pandemic.
The overall results—based on a multiplication of the four subcomponents—show that the electricity sector was the sector with the highest systemic criticality in the Metropolitan Area of Lima, followed by the IT and telecommunication and emergency response sectors. Here, the time factor was the decisive parameter that explained, for the most part, the different systemic criticalities. A power blackout can lead almost instantly to massive cascading effects which affect all other infrastructures and therefore, ultimately, the entire society, while disruptions of, for instance, food or gas supply, are less time-sensitive due to given storage capacities. This is particularly troublesome for Metropolitan Lima as the economic powerhouse of the entire country.
Although both the hazard profile, on the one hand, and the risk governance settings, on the other, differ fundamentally between both countries, another study for Germany showed similar results [
48]. This proves the crucial role of the energy sector for the functioning of modern societies whose interactions fundamentally depend on electricity supply. In this regard, the results are transferable to other settings and countries.
The results of this paper also help to identify gaps in actors’ awareness of interdependencies and showed the general criticalities of infrastructures with regard to both physical and actor-related factors. In addition, examples of barriers in communication between actors were given. Due to the participatory and semi-quantitative character of the survey-based assessment and the dialogue process involving local stakeholders, it was possible to reach a high level of acceptance with regard to the approach, as well as good qualitative feedback information.
One example shows the additional level of information which was gained through the direct interaction in the stakeholder meetings: whereas the risk communication survey showed a strong connection between the local, regional and national levels within the public sector, the personal communication during the stakeholder meeting revealed the weaknesses in the role of the regional level (see the results section). Such a barrier to communication could be crucial in a crisis event but seems to be only mentioned in colloquial settings. We therefore recommend the personal participation of relevant stakeholders in research projects on the communication of multi-risks. For complex decisions a fair discussion and an atmosphere of trust have to be established to enable stakeholders to talk about problems in internal structures [
78]. This was achieved in the Lima case study by a series of workshops (in person and virtually) facilitated by native-speaker researchers over a period of two years.
Even when the stakeholders perceived an interdependency between sectors very well, the barriers of risk communication between these sectors could remain; it is a long way from personal perception to personal action, as the risk perception paradox shows [
79]. Moreover, even if stakeholders are willing to act immediately in a risk event, further barriers might arise: one stakeholder in the virtual meeting mentioned that “We communicate with other people, not with institutions […]. When there is an emergency, I know whom to call [in other sectors]. This becomes a problem, when people change so often” (see the results section). The foregoing could be the basis for a still incipient disaster risk management system, the governance of which would be based on individuals and not on functions assumed institutionally. Advancing in the institutionalization process would facilitate the deepening of information management and the definition of roles, in addition to strengthening interdependence and communication between stakeholders.
A better understanding of the given interconnections between sectors and the prevailing communication relations between actors, but also between specific system elements, is therefore an indispensable prerequisite for building resilience. Further, countries, regions and cities are not static but in permanent change, if not transformation, and thus scenario-based approaches that take into account uncertainties are needed for risk and criticality assessment.
With regard to social communication needs in the case of multi-risk events, the challenge is to set up and consolidate the necessary communication structures and channels in a timely and comprehensive way. This applies not only to communication among operators, but also to communication between operators, public authorities and other actors relevant for disaster risk response, such as non-governmental organizations.
Further research on systemic criticality should focus on the spatial dimension of the system of infrastructure systems and therefore on factor two of the importance of interdependencies: the strength and the temporal dimension of cascading effects cannot be fully determined without an identification of those system components (such as specific sections of the road network or power grids) that are specifically critical due to their importance for the functioning of the entire network. This requires fine-grained data on the flows of goods and services (such as data on traffic flows, power distribution and more) which are not available for Lima. That is why the online surveys and workshop were a first useful step in raising awareness of the problem in the area of systemic criticality, but also in generating knowledge of cascading effects based on expert input. A promising next step would be joint exercises and training that focus on cascading effects involving infrastructure operators and state emergency management agencies, such as CENEPRET (El Centro Nacional de Estimación, Prevención y Reducción del Riesgo de Desastres) and INDESI (Instituto Nacional de Defensa Civil). This recommendation is underlined by our own analysis, which provided proof of specific cooperation and communication needs among operators and for communication between operators and public entities, but also indicates the requirement for a prioritization of sectors in contingency plans, based on the results of the proposed exercises.
Those infrastructure sectors and their system elements with the highest cascade potential, like electricity or IT, are specifically worth protecting even against a worst-case scenario, like the magnitude 8.5 earthquake chosen here, in order to mitigate the indirect effects of these kinds of events. This implies a normative judgment to determine the worthiness of protection of specific network elements. This judgment should ideally consider the result of the exercise-based criticality assessment, which could in principle be performed on various spatial levels depending on the extent of the respective infrastructure systems.
On this basis, spatial planning authorities should take the physical component of these network elements and, thus, the consequence-based element of criticality into account when deciding about future land-uses. In principle, spatial planning is asked to locate critical infrastructure facilities and lifelines at safe places or to grant building permissions in endangered areas only under the precondition of robust building protection measures. Newly promoted developments must not negatively affect these infrastructure components (e.g., by changing the terrain and thereby the surface water run-off and finally causing service disruptions).
For this purpose, the Manual para la Evaluacion de Riesgos originados por Fenómenos Naturales (Manual for the Evaluation of Risks Originated by Natural Phenomena) should be adjusted accordingly. It was launched by CENEPRED in 2014 [
72]. The manual introduced a risk matrix-based approach that defined the permissibility of various land-use classes in accordance with a given hazard–vulnerability relationship. This approach currently lacks any reference to critical infrastructures and systemic criticality.
Moreover, infrastructure providers are asked to consider redundant accesses to services and to take care of emergency management capacities by means of, e.g., early warning systems, back-up power generators and buffer batteries, but there are fundamental knowledge gaps with regard to the interconnectedness of the various sub-systems. Apart from physical preventive actions, enabling and strengthening of communication processes among infrastructure operators and administrative stakeholders seems to be important for improving resilience, but it is the general public which suffers most in cases of wide-spread and long-lasting service disruptions. In further research using participatory processes, recommendations should be jointly developed with civil society.


 ,
, 


