Introduction
In recent years, progress has been made in examining the relationship between the urban form and the urban heat island (UHI) effect based on remote sensing data, which involves measurements of the land surface temperature (LST) obtained from satellites since the traditional method is only effective where there is a large enough number of weather stations within reasonable distances over urban and rural areas [
1,
2]. In addition, since there may be significant differences in the relationship between urban form indicators (UFIs) and UHI effects at the pixel and urban scales [
3], recent calls for additional cross-sectional empirical research at the larger spatial–temporal scale to help clarify the ambiguous effects of the fundamental characteristics of urban-scale have been highlighted [
4,
5]. In this field, studies based on remote sensing data could offer an efficient and speedy approach for monitoring spatiotemporal variation in UHI over a long period of time [
6].
At the urban scale, urban forms not only directly affect UHIs by affecting the physical properties of the underlying surface but also indirectly affect them through affecting traffic patterns, pollution emissions, UHI circulation and other socioeconomic processes [
7,
8,
9,
10,
11]. The effect of the urban form on the UHI may be both seasonal and diurnal because the main energy sources of day and night are different, and seasons also affect the surface energy flow, such as the ratio of net solar radiation to human heat source energy flow density, the ratio of conduction/convection energy to vertical convection, etc. [
12,
13,
14].
However, most previous efforts have focused on the overall day–night or summer–winter urban heat island intensities [
6,
15,
16,
17,
18,
19], and there are limited studies exploring the diurnal and seasonal differences in the effect of urban form on the heat island effect. The results of Tran et al. [
15], taking 18 Asian cities as research units showed that the influence of the population size on the daytime heat island intensity is greater than that on the nighttime, while the conclusion, based on 65 cities in humid climate regions of North America, was the opposite [
20]. Imhoff et al. [
17] found that the association between urban size and UHI was stronger in summer and in the daytime than it was at other times. The uncertainties in the above conclusions are caused by many reasons. On the one hand, the number of urban samples in these studies was generally small (less than 100), but on the other hand, the relationship between the urban form and the heat island effect may depend on the natural geographical environment, urban development level and other factors [
21,
22,
23]. For instance, according to the two earliest studies by Duckworth and Oke, the change of the urban area of larger cities had a smaller impact on the intensity of the heat island [
24,
25]. Based on 1124 cities and towns in the Beijing–Tianjin–Hebei urban agglomeration, Tan and Li [
26] found that the urban area had a strong impact on the heat island intensity only when the urban patch area exceeded 2 km
2. Based on the 50 most populous cities in the United States, Debbage and Shepherd [
27] showed that the continuity of cities with a higher urbanization intensity has a greater impact on the heat island effect. However, there is still a lack of sufficient research on the seasonal and diurnal variations of the effect of urban form on the SUHII under different development levels/natural conditions, which hinders our understanding of the heterogeneity of the role of the urban form.
Our study aims to explore the diurnal and seasonal variances of the relationship between the urban form and urban heat island intensity, as well as the changes in its relationship with the urban natural environment and socioeconomic development level. To gain insights into the changing patterns of the relationship between the urban form and the heat island effect intensity at the urban scale, we used more than 3000 refined cities across China as research units to carry out this empirical study. We extracted the surface urban heat island intensity (SUHII) based on remote sensing data every five years from 2000 to 2015. The research contents include three aspects. The first is to analyze the seasonal and diurnal differences of the SUHII distribution spatial pattern of all urban units in China. The second is to study the gradient evolution of the relationship between the urban morphology and the SUHII during the day or at night and across seasons, with the gradients of the urban development level, altitude, humidity and temperature. The third is to study the seasonal and diurnal differences of the relative importance (RI) of natural and urban form factors. Our results provide deeper insights into the localized mitigation efforts of the UHI effect through macro urban form planning.
2. Data and Methods
2.1. Data Sources, Metrics and Processing
2.1.1. Study Area and Spatial Range of Cities
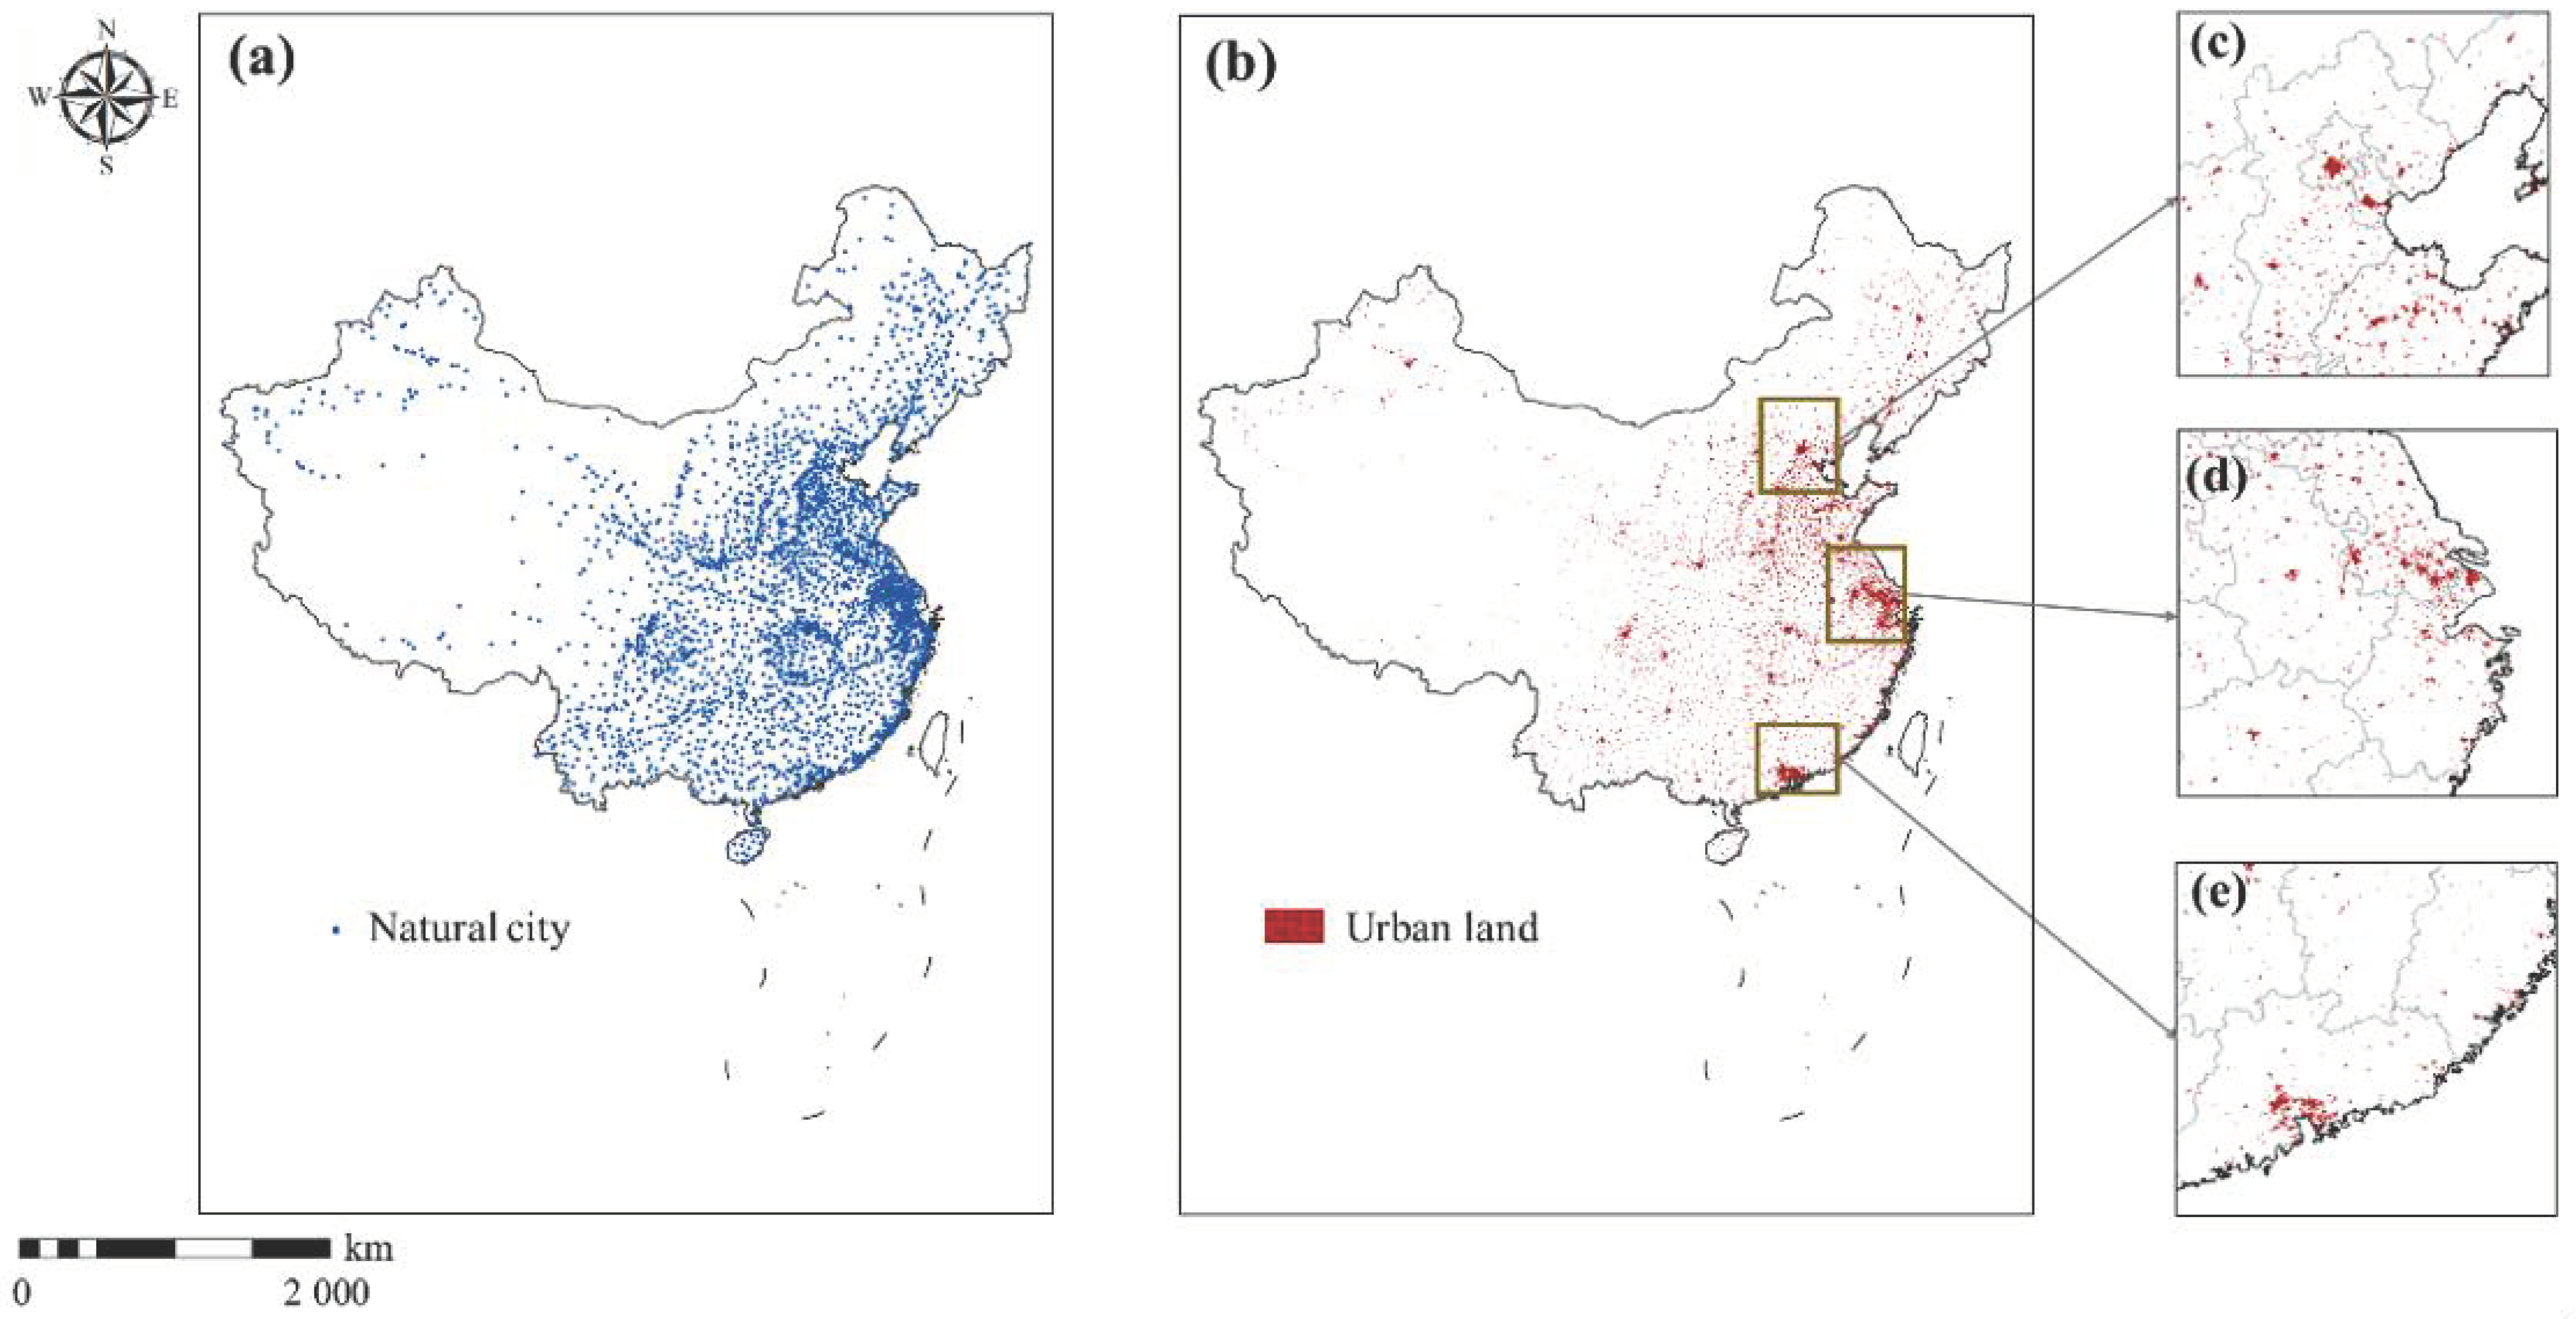
We define a city of mainland China as an independent urban patch closely connected or adjacent in space and closely related in socioeconomic function. Based on the 30 m land use data and the recognized spatial ranges of natural cities according to a previous study [
28], we extracted the spatial range of 3189 cities in China according to the process proposed in our previous study [
29] (
Figure 1). We define a city as an independent urban patch closely connected or adjacent in space and closely related in socioeconomic function. The process of city identification includes the following steps. The first step is to calculate the point of interest (POI) density and generate a POI density map with Kernel density functions with the spatial resolution of 500 m. The second step is to determine the threshold to classify the urban regions according to Kernel and POI density maps. Then, we combined the spatial range of identified natural cities with the high-resolution urban land use map to get the detailed spatial boundary of our study units. We defined the independent land use patches of multiple cities with overlapping parts with one natural city as the parts of one city, which could effectively avoid the problem that some cities are separated by rivers or that cities with a certain distance in space but closely related in function or population distribution are identified as multiple city units.
2.1.2. Calculation Method of SUHII
We used monthly composite land surface temperature (LST) remote sensing products at a 1-km resolution derived from the moderate resolution imaging spectroradiometer (MODIS) (Terra) dataset to calculate SUHII. Our monthly composite dataset was provided by the Geospatial Data Cloud site, the Computer Network Information Center, and the Chinese Academy of Sciences (
http://www.gscloud.cn (accessed on 20 January 2020)). The data is processed by daily’s MOD11A1 product through the process of mosaic. We use the two kinds of daily products of the daytime and nighttime surface temperature of the data set, respectively, and calculate the average daytime or nighttime surface temperature of all days in each month to obtain the monthly daytime and nighttime surface temperature of each month.
The SUHII of each city was calculated based on the differences between the LSTs in urban and rural areas [
6,
16,
21,
27,
30,
31] using Equation (1):
where SUHII represents the surface urban heat island intensity and LST
urban and LST
rural represent the average LST in urban and rural areas, respectively. The extents of the rural areas were identified based on buffer zones with varying radii from 5 to 10 km around these urban extents following the method of our previous research [
21], an improved method to make the area of urban buffer varies with the area of a city [
19].
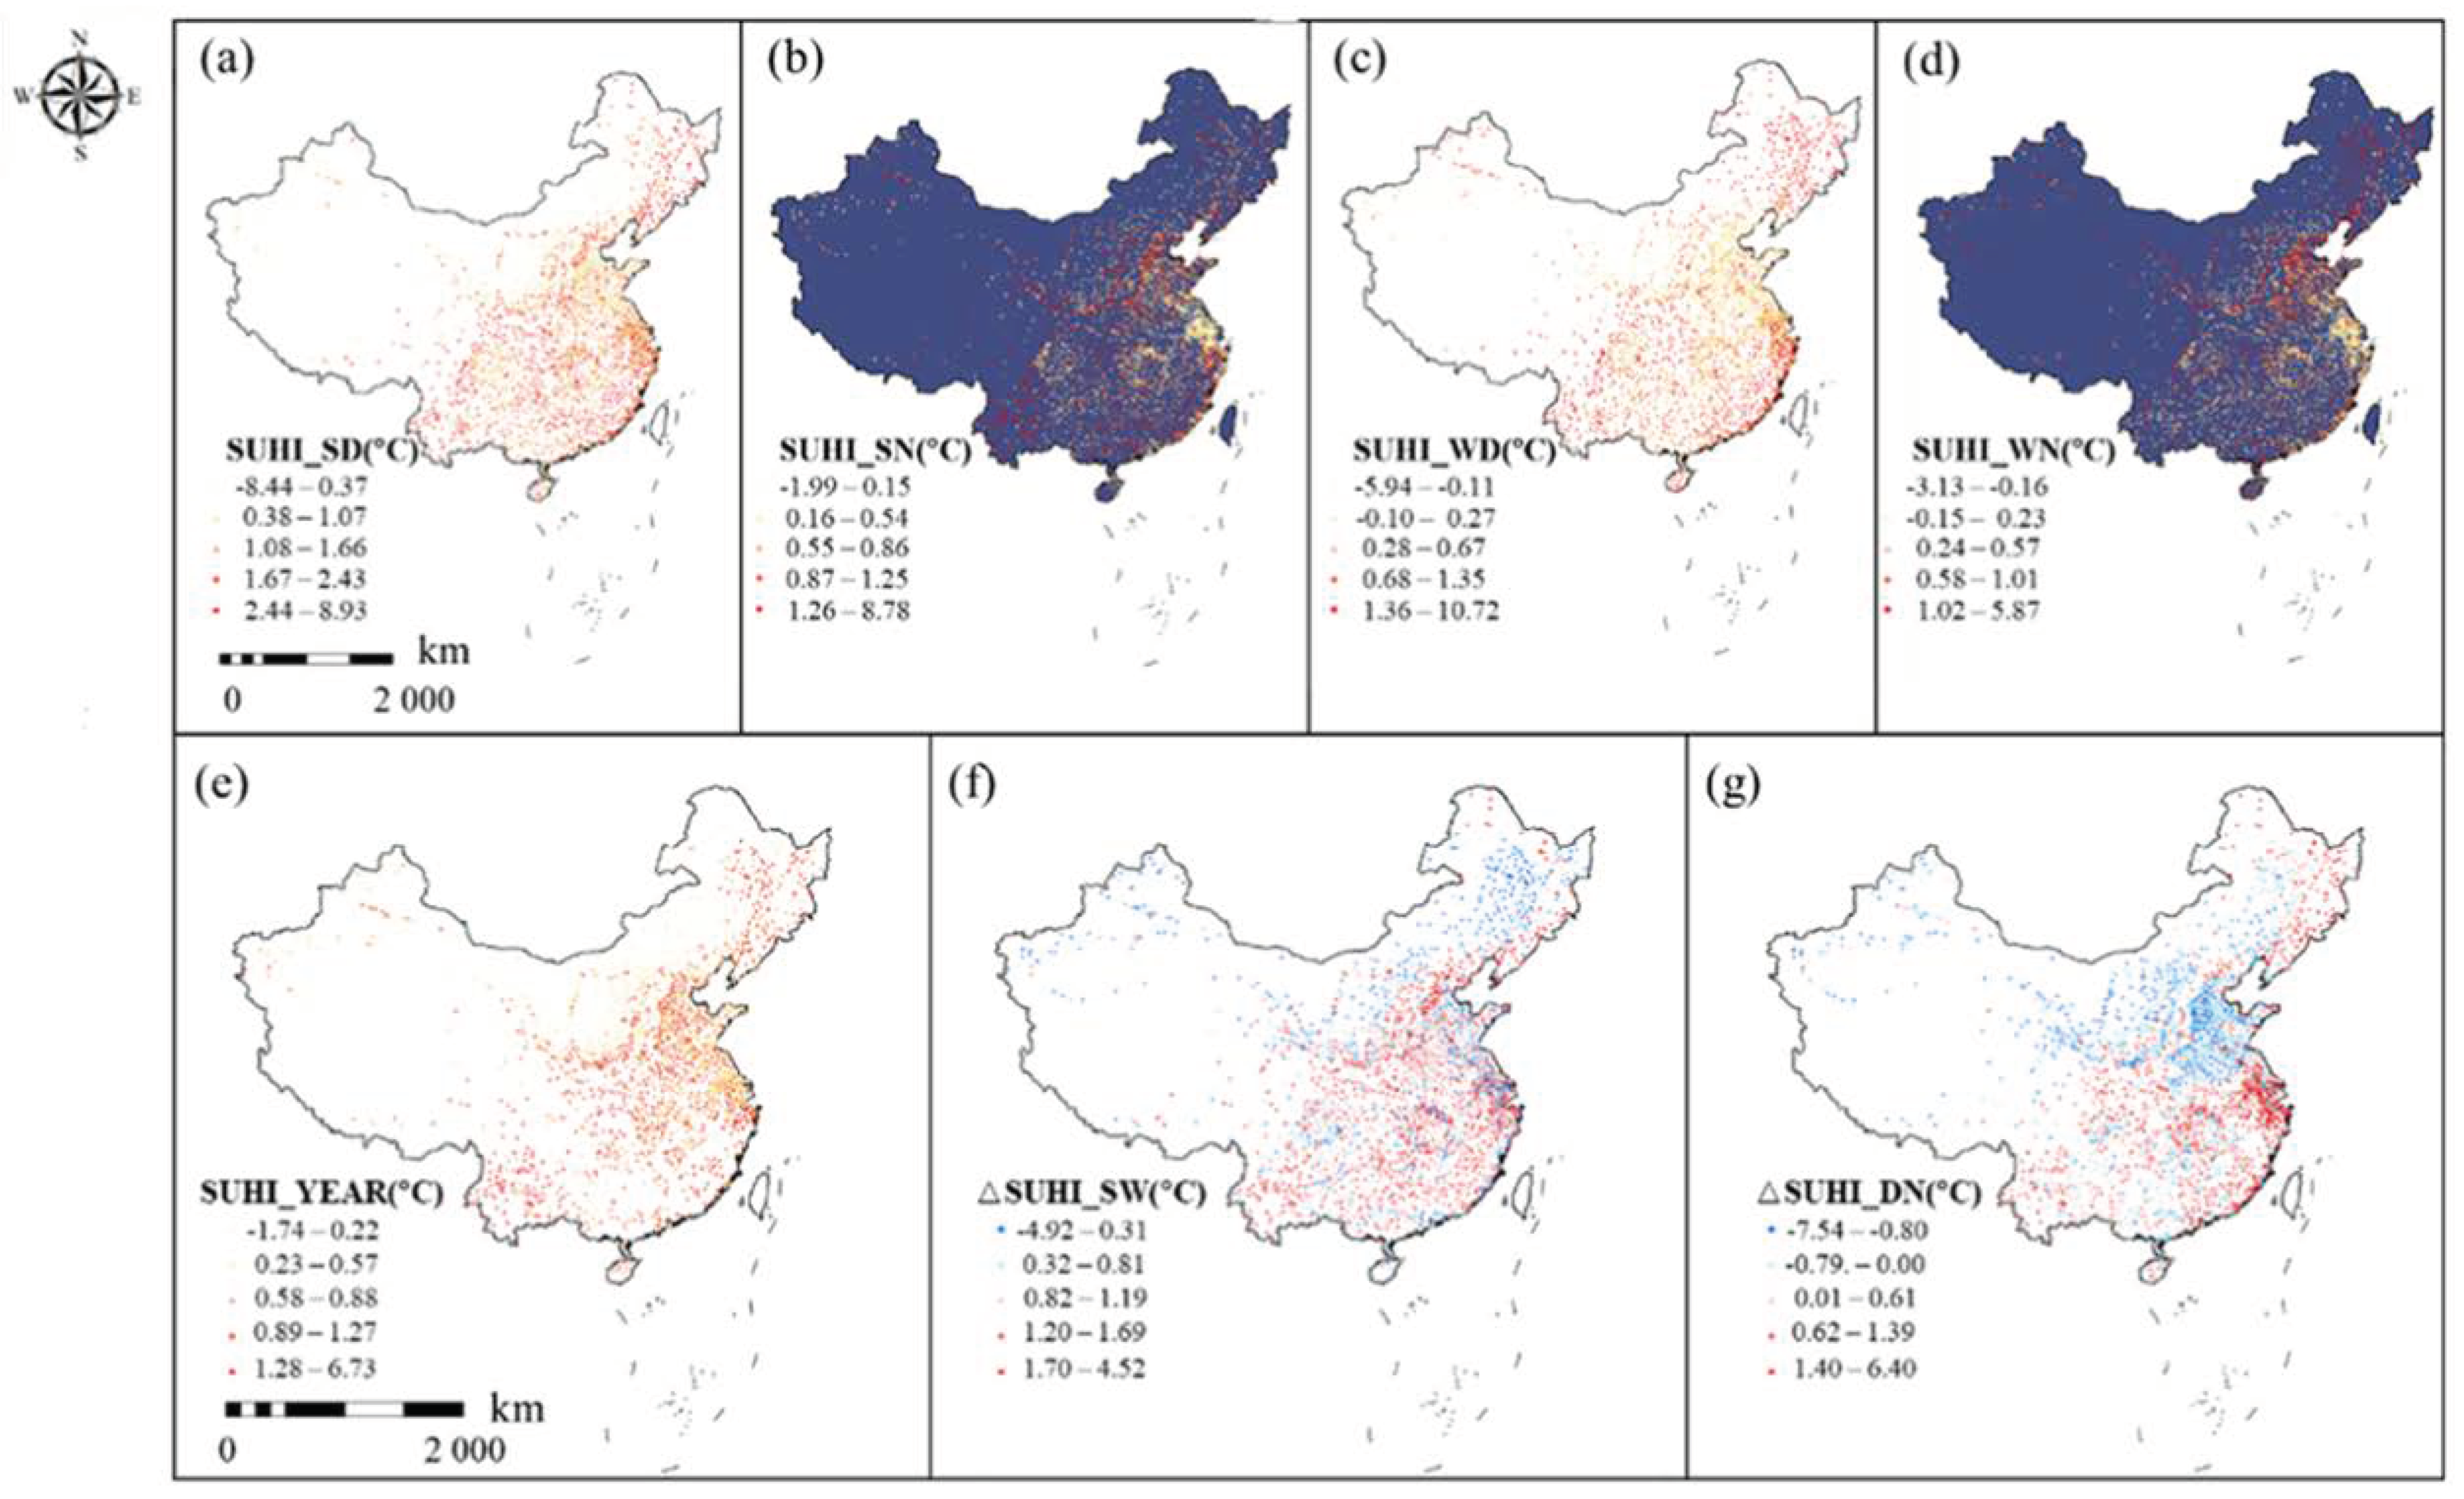
Based on the day/night LST data in the years 2000, 2005, 2010 and 2015, we obtained SUHII datasets of summer days (SUHII_SD), summer nights (SUHII_SN), winter days (SUHII_WD) and winter nights (SUHII_WN) as well as the annual UHI (SUHII_YEAR). We averaged the surface temperatures in June, July and August to calculate the daytime and nighttime surface temperatures in summer. Similarly, we averaged the surface temperatures in December, January and February to obtain the daytime and nighttime surface temperatures in winter. Among them, SUHII_SD and SUHII_SN were calculated from the average SUHIIs of daytime and nighttime in June, July and August, respectively, while SUHII_WD and SUHII_WN were calculated by the average SUHIIs of days and nights in December, January and February, respectively. SUHII_YEAR was calculated from the average SUHIIs of the daytime and nighttime for 12 months of the year. In addition, we also calculated the difference between the summer SUHII and winter SUHII averaged by day and night (SUHII_SW) and the difference between the daytime SUHII and nighttime SUHII averaged over 12 months of the year (SUHII_DN). Winter and summer are the two seasons with the biggest difference in climate and ecological environment in a year. In winter or summer, day or night, the characteristics of urban energy flow are different, the heat island effect is affected by human activities, climate and other factors, and the positive or negative effects of the heat island effect on the urban environment and residents’ health are also changed [
16] (ref). For example, the heat wave and heat island effect in summer aggravate the energy burden and health threat, while in winter, the heat island effect may play the contrary role. Therefore, it is necessary to explore the driving factors of the heat island effect in winter and summer, respectively.
2.1.3. Urban Form Factors
All of the urban form indicators are annual indicators, including four periods of 2000, 2005, 2010 and 2015. We used the anthropogenic heat flux (AHF), night light intensity (NLI), population density (POPDEN), area size (AREA), morphological continuity (CONTIG) and morphological fractal dimension (FRAC) as independent variables to measure the impact of the urbanization level or urban expansion pattern on the SUHII. The AHF was mapped with a high spatial resolution of 500 m × 500 m from 2000 to 2016 every four years from 2000 to 2016 by collecting energy consumption data and socioeconomic statistics, combined with the multi-source remotely sensed data [
32]. Since the AHF data were only available every four years, we used data from 2004 for 2005, 2016 for 2015, and 2008 and 2012 for 2010. The POPDEN of four periods of 2000, 2005, 2010 and 2015 was measured based on the population density dataset from the Center for International Earth Science Information Network at Columbia University (available at
http://sedac.ciesin.columbia.edu/data/set/gpw-v4-population-density-rev10 (accessed on 15 June 2020)). We used the NLI obtained by satellite remote sensing to measure the impact of the urbanization level or urban development [
33,
34,
35,
36,
37]. The NLI was obtained from the Defense Meteorological Satellite Program (DMSP)-Operational Linescan System (OLS) nighttime light (NTL) version 4 stable average visible data of the NOAA-National Geophysical Data Center (
http://ngdc.noaa.gov/eog/dmsp/downloadV4composites.html (accessed on 9 March 2018). The NTL data were calibrated via the ridgeline sampling regression method to obtain a consistent NLI time series [
38]. NLI data covers 2000, 2005 and 2010 and we used the NLI of 2013 as an alternative to that of 2015 due to the lack of data. Then, we calculated the CONTIG and FRAC of each city based on the city boundary layer obtained from land use data of 2000, 2005, 2010 and 2015. Compared with the basic measures of urban forms, such as length, area and density, the CONTIG and FRAC are used to differentiate the shapes of cities, which tend to be circular or striped, and they are more efficient in describing the space filling or sprawl of urban evolution [
39,
40].
2.1.4. Natural Condition Factors
All the natural condition variables were composited monthly. We further calculated the average values of three months in winter or summer to get the seasonal mean values. Among them, we used the precipitation rate (PREC), solar radiation (SRAD), air temperature (TEMP), specific humidity (SHUM), wind speed (WIND) and elevation (ELEV) as variables to measure the impact of natural environmental changes. The meteorological data are based on the existing Princeton reanalysis data, Global Land Data Assimilation System (GLDAS) data, Global Energy and Water Cycle Experiment—Surface Radiation Budget (GEWEX-SRB) radiation data, and Tropical Rainfall Measuring Mission (TRMM) precipitation data, which are integrated with the records of China’s meteorological stations [
41]. The meteorological data with the spatial resolution of 0.1 degree was resampled to 1 km for the subsequent zonal statistics.
2.2. Statistical Analysis Method
Firstly, Spearman rank correlation analysis was used to measure the correlation between influencing factors and the SUHII. In gradient analysis, we used the natural breakpoint method to segment urban samples with multi-level elevation, urban development, humidity and temperature. Then, we used the Random Forest (RF) model to estimate the relative importance of each urban form indicator to the UHI intensity. The RF model has the advantage of being able to effectively capture the complex nonlinear relationship between urban morphological impacts and UHI intensity to avoid the problem of overfitting [
42] and to be highly interpretable compared to more complex black-box models. Furthermore, when multiple variables are considered simultaneously, the relative importance of each variable can be reasonably estimated using the RF model [
43]. To show this, the decreases of the weighted impurity
p(t)∆i (st, t) can be added for all nodes
t where
Xj is used and averaged over all trees (for
m = 1, …,
M) in the RF model for predicting Y [
44]. By calculating the contribution rate of each variable to the reduction in impurity, the common contribution of several variables can be obtained. The equation of the relative importance assessment is given as Equation (2):
where
p(t) is the proportion of samples reaching
t, and j
t denotes the identifier of the variable used for splitting node
t. Here, we used the Gini index as the impurity function, also known as the Gini relative importance [
45].
3. Results and Discussions
3.1. The Spatial Pattern of the Seasonal and Diurnal Variations of the SUHIIs
Our results indicated that the SUHIIs varied substantially in a diurnal and seasonal cycle, with contrasting patterns in different regions of China (
Figure 2). In order to easily observe the spatial distribution pattern of the SUHII in the cross section, we divided the SUHII into five grades according to the quantile. We defined the region with the lowest two levels of SUHII as the relatively low-value (RL) region and the region with the highest SUHII level as the relatively high-value (RH) region.
Figure 2 showed that the RH and RL regions changed dramatically during the day or at night and across seasons in some parts of China, and it even showed the opposite spatial patterns. For example, the SUHII of most cities in North China is the RL area during the day and the RH area at night. On the contrary, the Yangtze River Delta is mainly RH area during the day and RL area at night.
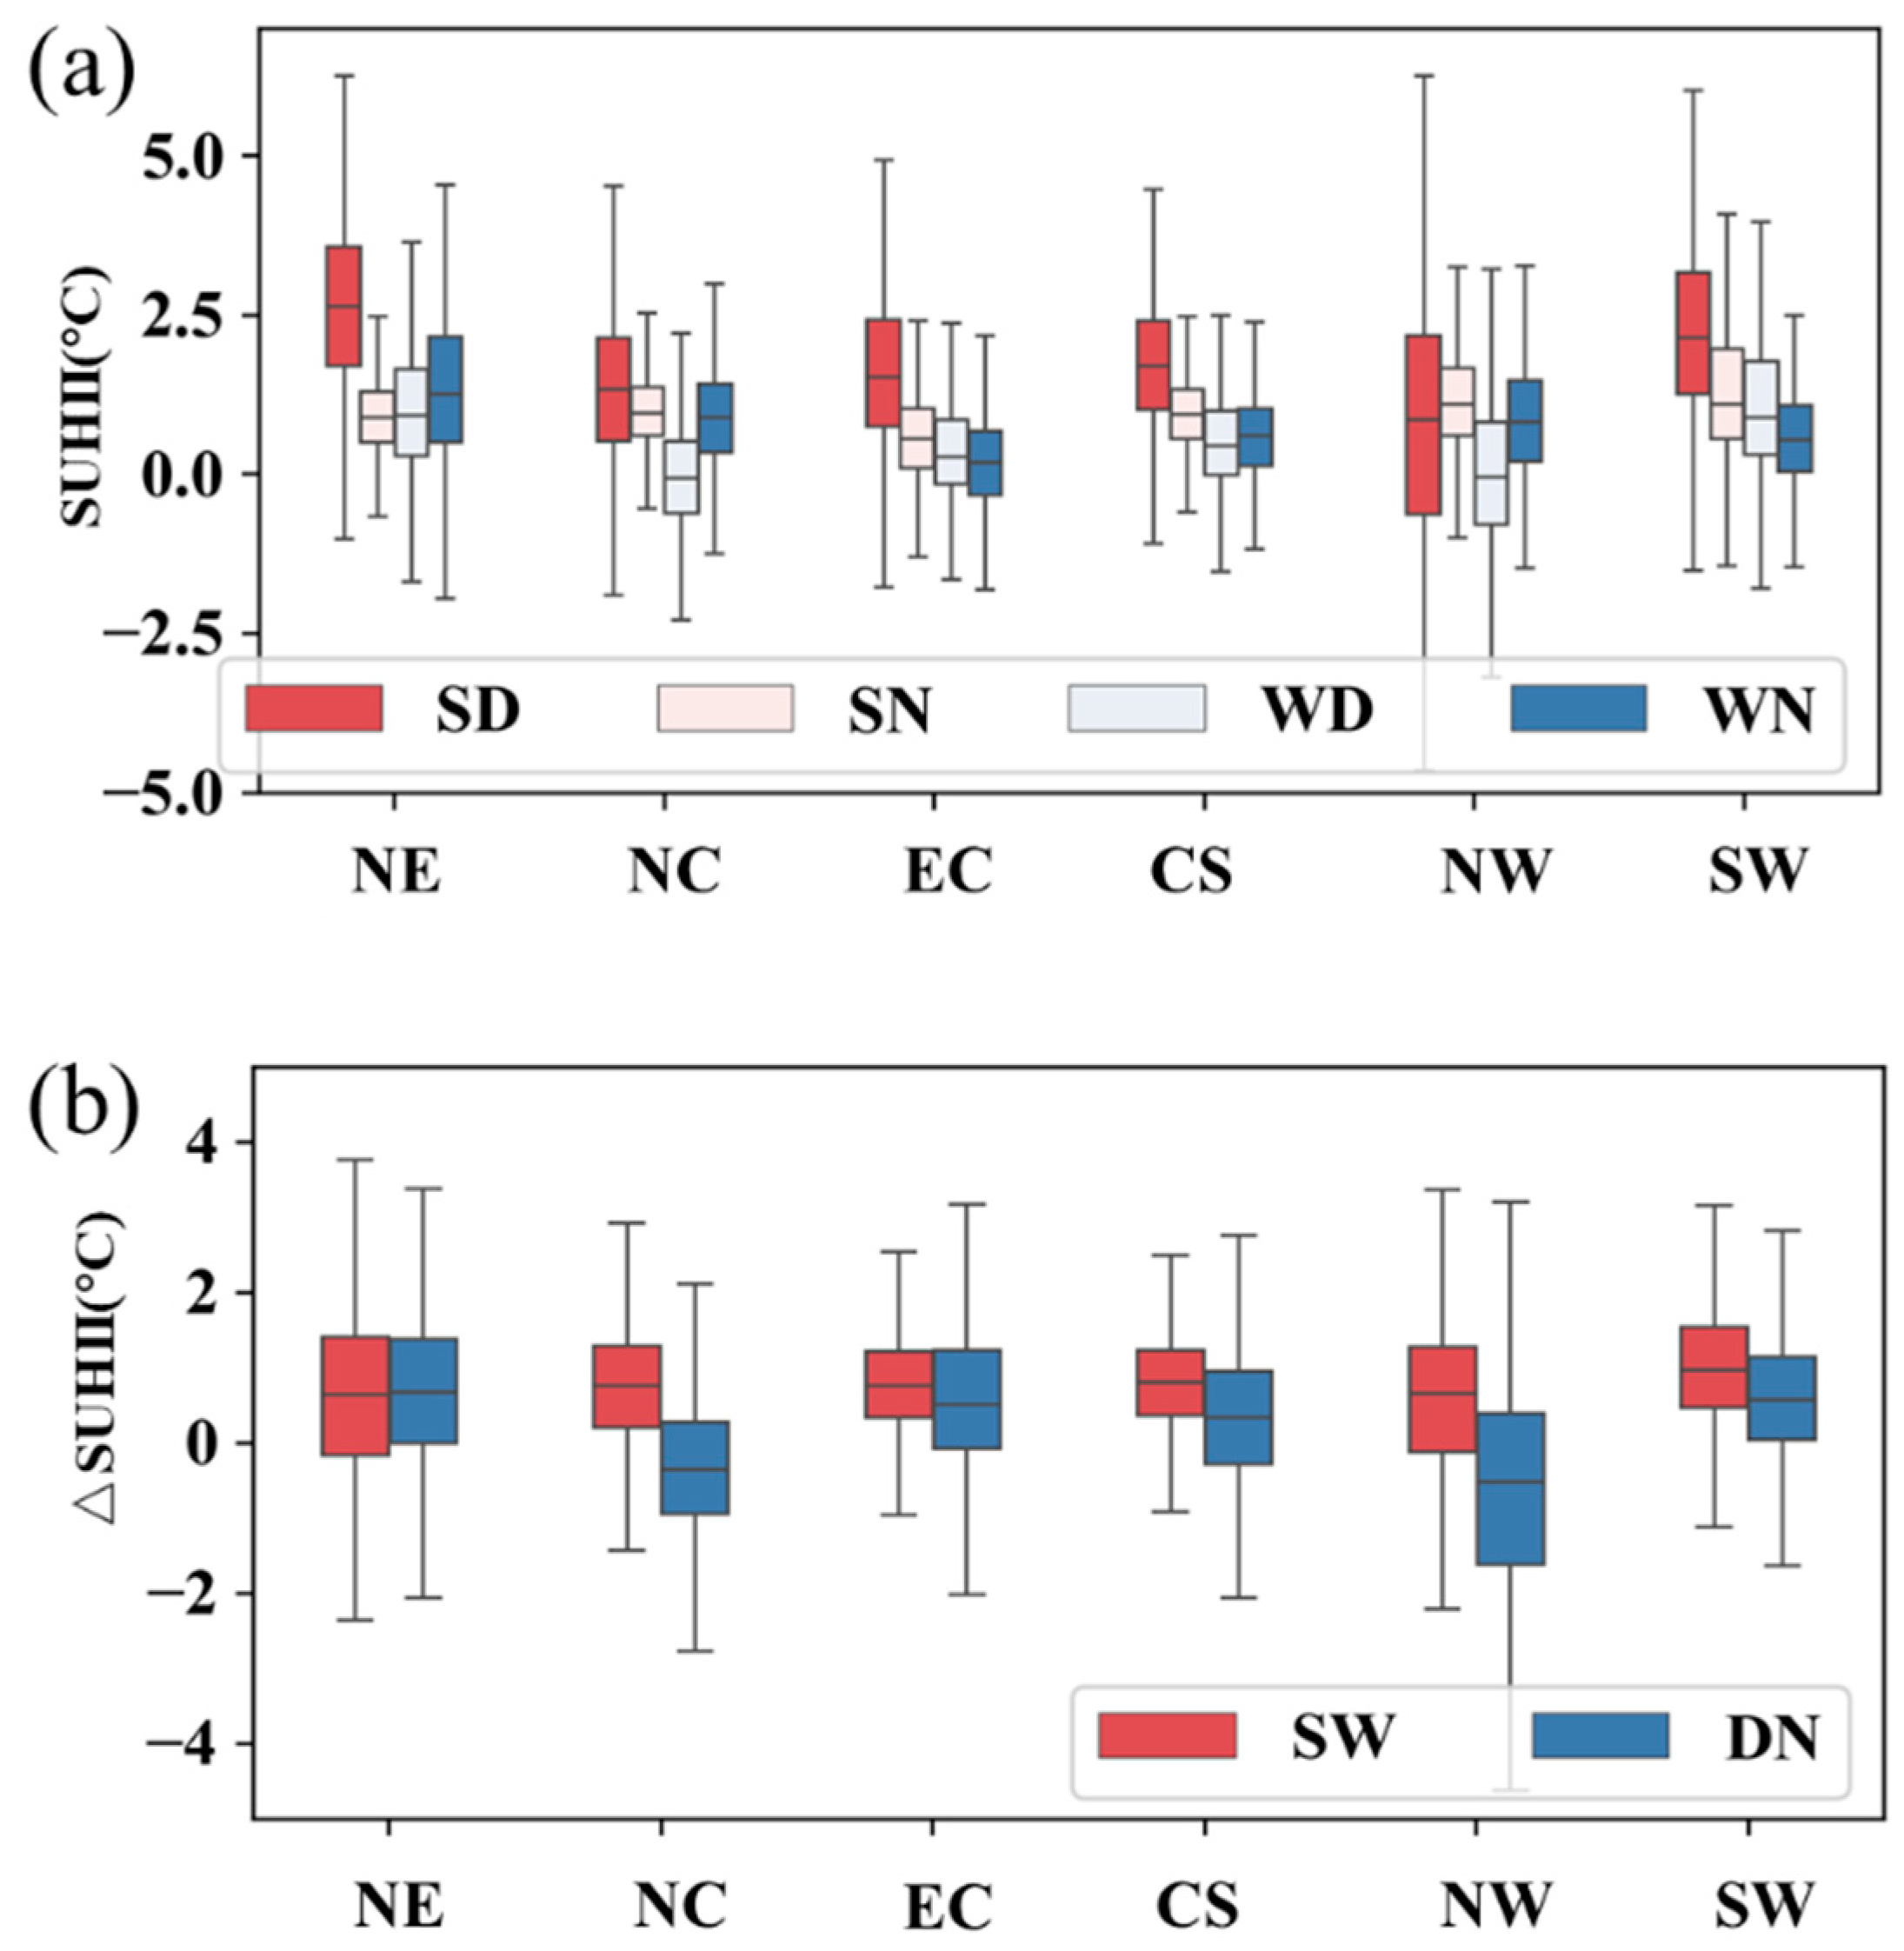
According to the statistical results of box plots (
Figure 3), the SUHIIs had obvious geographical differences in the day and at night and across seasons. For example, during summer days, the SUHII in Northeast China and Southwest China was the highest, with the median of 2.64 °C and 2.14 °C, respectively, while that in Northwest China was the lowest with a median of 0.86 °C. However, during summer nights, the differences among the geographical regions were relatively small, and their median SUHII floats from 0.56 °C to 1.11 °C. The results also show that negative values of SUHII exist in winter, summer, day and night, which may be caused by many factors. For example, the SUHII is calculated based on the difference between city and its buffer, the land cover of buffer may play a role. If there are water bodies, the nighttime LST should be higher in the buffer during night.
3.2. Seasonal/Diurnal Variation of the SUHII and Its Variation with the Gradient of Urban Development, Altitude, etc.
Cities are classified into seven levels according to the quantiles of the NLI, ELEV, TEMP and SHUM (
Table 1 and
Table 2). As shown in
Figure 4, the SUHIIs showed a clear change pattern in NLI and ELEV gradients but there was no obvious change trend in the temperature and humidity gradients. From the first level to the seventh level of NLI, SUHII_YEAR, SUHII_SD, SUHII_SN and SUHII_WNS all rose by about 1.0 °C. The DIF_SW went up about 0.4 °C, while the DIF_DN decreased by 0.4 °C. The average annual SUHII showed an upward trend with the increase of elevation, but this change was mainly caused by the large change of the SUHII at night (increased by 0.89 °C and 0.67 °C) and little change in the daytime (less than 0.11 °C). On the gradient of the TEMP and SHUM, the value of the SUHII did not show clear changing trends.
3.3. Gradient Change Patterns in the Relationship between the SUHII and Urban Forms
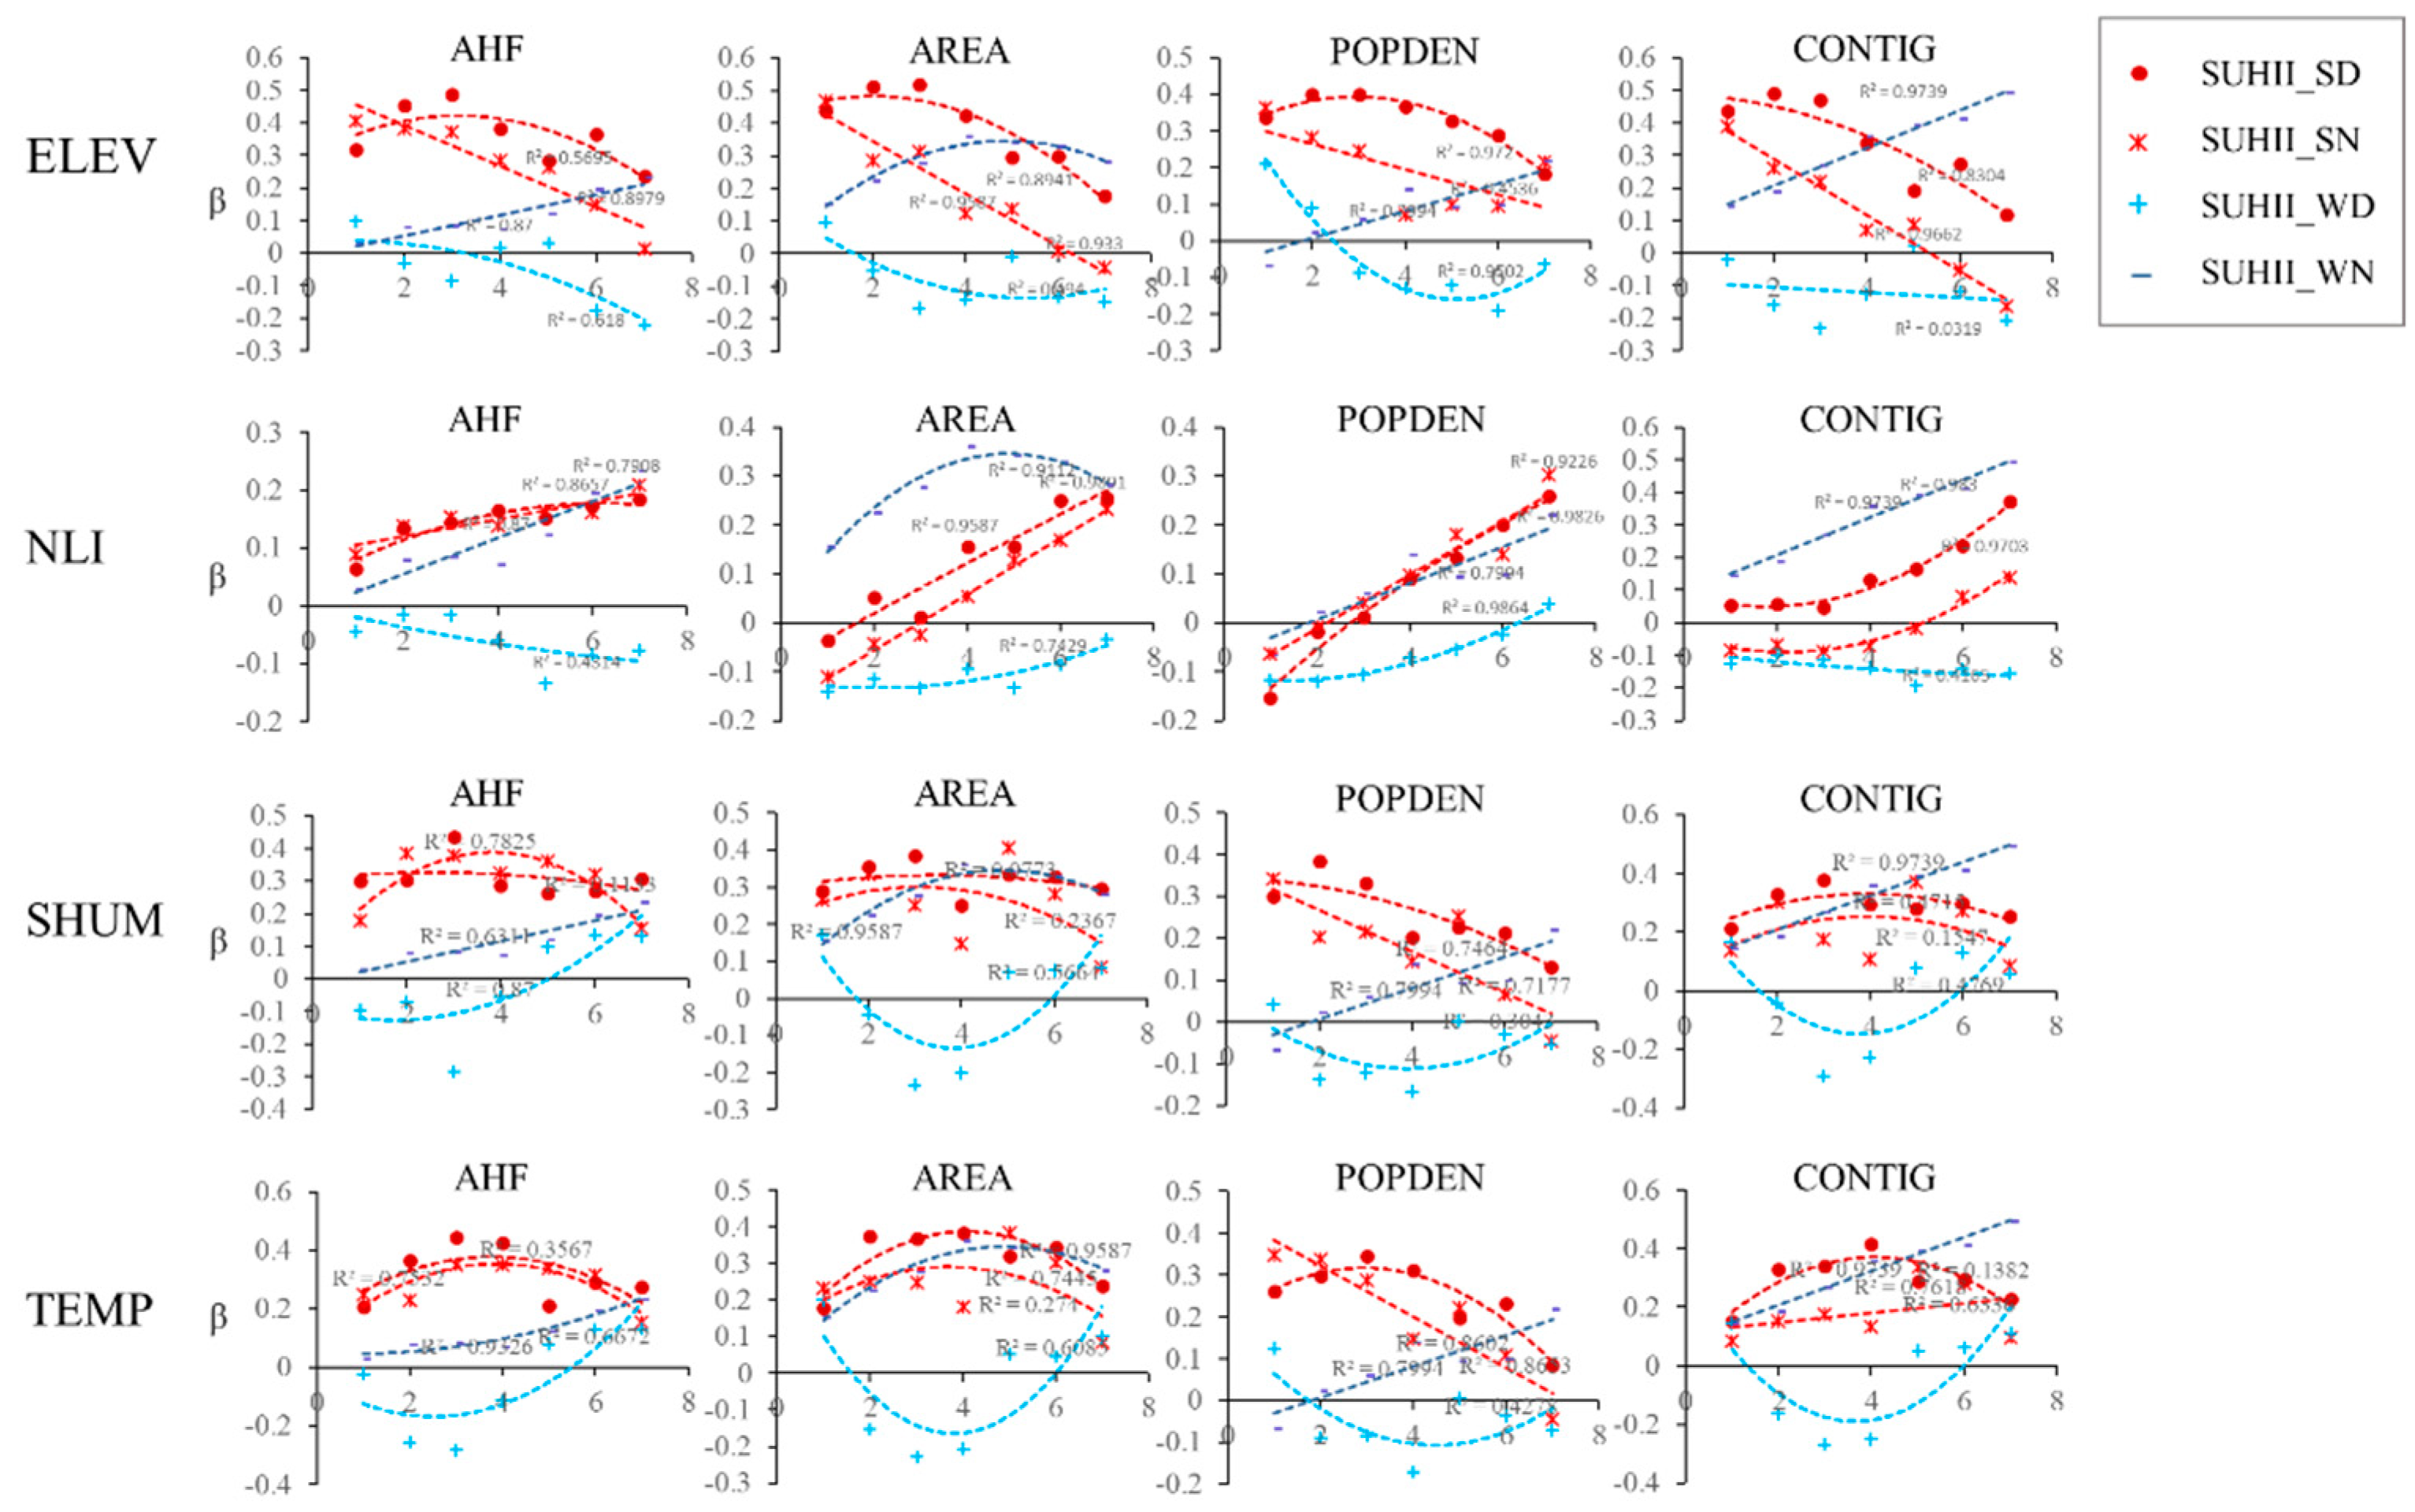
With the increase of NLI, ELEV, SHUM and TEMP, the correlation coefficient between urban form factors and the SUHII presented different diurnal and seasonal variation patterns (
Figure 5 and
Appendix A Table A1,
Table A2,
Table A3 and
Table A4). There was no clear change pattern of the SUHII in the NLI, ELEV, TEMP and SHUM gradients in winter, but there were clear change patterns for those of the SUHIIs during summer and winter nights.
On the NLI gradient, the absolute values of the correlation coefficients between the AHF, POPDEN and CONTIG with three SUHII indexes (including SD, SN and WN) continued to increase. For the cities with the highest NLI level, the correlation coefficient between these indicators and the SUHIIs increased from about 0.15 to 0.30. The effect of the AREA on the SUHII on summer days and nights increased with the increase of the NLI, while the effect on SUHII_WN increased first and then decreased. On the ELEV gradient, the correlations of the AHF, POPDEN, AREA, CONTIG and summer SUHII were gradually reduced, but the impact of the three urban form indicators on SUHII_WN was gradually enhanced. Along the temperature and humidity gradients, the effects of the AHF, AREA and CONTIG on the summer SUHII showed an inverted U-shaped curve, while the positive effect of POPDEN on the summer SUHII decreased monotonously. On the other hand, the enhancement effects of the AHF, AREA, CONTIG and POPDEN on the SUHII during winter nights increased generally with the increase of temperature and humidity.
Some previous studies have focused on analyzing the heterogeneity of the relationship between urban form and heat island effect. However, most of them classify cities according to their size with few samples and compare the differences of urban form effects through statistical analysis. For example, Tan and Li [
26], based on the study of cities and towns in the Beijing–Tianjin–Hebei Urban Agglomeration in China, showed that only when the urban area exceeds a certain threshold can the urban morphology and SUHII have a strong correlation. Debbage and Shepherd [
27] found that the influence of continuity on the SUHII was greater in cities with higher urbanization intensity, corresponding to larger regression coefficients. Liang et al. [
21] found that urban development makes urban population density, the continuity of urban morphology and fractal dimension have a stronger impact on the SUHII, which is consistent with the change pattern of urban morphology on the intensities of heat island in summer in our results.
Our four-period urban samples with more than 10,000 samples further delineate the changing relationship between urban form and heat island effect. Take the NLI gradients as an example: the formation of this gradient change pattern is probably due to the fact that a higher level of urban development corresponds to greater urban content, more intensive building, greater traffic flow and significantly increased intensity of social and economic activities. Thus, the more developed cities will lead to more UHI-enhanced effects than the less developed cities, when urban forms affect the ventilation or larger amounts of traffic increase emissions. In addition, our previous study found that along the urban development gradient [
21], the relative importance of urban size and density first increased and then decreased, which is consistent with the change pattern of the area and winter night SUHII along the NLI gradient, which may be related to the upgrading of industrial structures brought by urban development. In addition, as Oke [
25] suggested, the large-sized cities can contribute to the formation of heat island circulation, leading to the continuous convergence of cold air in the suburbs to the city center, which has a restraining effect on the further enhancement of the urban heat island effect.
In addition, with the increase of ELEV, the relative size of the correlation coefficient of different factors also changes. In low altitude areas, the correlation coefficients of the AHF, AREA and POPDEN with the summer SUHII are as high as 0.5, while in high altitude areas, their correlation coefficients generally drop to about 0.2. On the contrary, the correlation coefficient between the CONTIG and summer SUHII increased from 0.2 to 0.5, which was higher than that of the AHF and AREA. As the NLI increases, the increase in the strength of the correlation between CONTIG and SUHII_WN (the increase in the correlation coefficient reaches about 0.4) is significantly higher than that of other factors, including NLI and POPDEN.
The changing effect of urban form along the gradient of three natural factors also shows the fundamental influence of a natural, geographical environment on the formation of the urban heat island effect. In terms of the temperature and humidity gradients, the change pattern of urban morphology effect is not obvious, except for the influence of the POPDEN on the summer heat island effect and the influence of the AHF, POPDEN and CONTIG on winter nights. This may be due to the fact that in a warm and humid climate, the vegetation in the suburbs is mostly forest, the surface is rough, and the convective heat dissipation efficiency is high [
20]. Studies have shown that convective efficiency in these warm and humid urban areas has decreased by 58% [
20], which will probably amplify the effects of heat emission, socio-economic activities and geometry on heat emission and accumulation. During winter nights, the effects of the AHF, POPDEN and CONTIG on SUHII_WN increased gradually because the transpiration cooling effect of vegetation was the lowest, and the effect on roughness was relatively large. However, in summer, there is more vegetation in humid areas, and the cooling caused by transpiration has a greater impact on the urban heat island effect, which may lead to the weakening of population density with the increase of humidity and temperature.
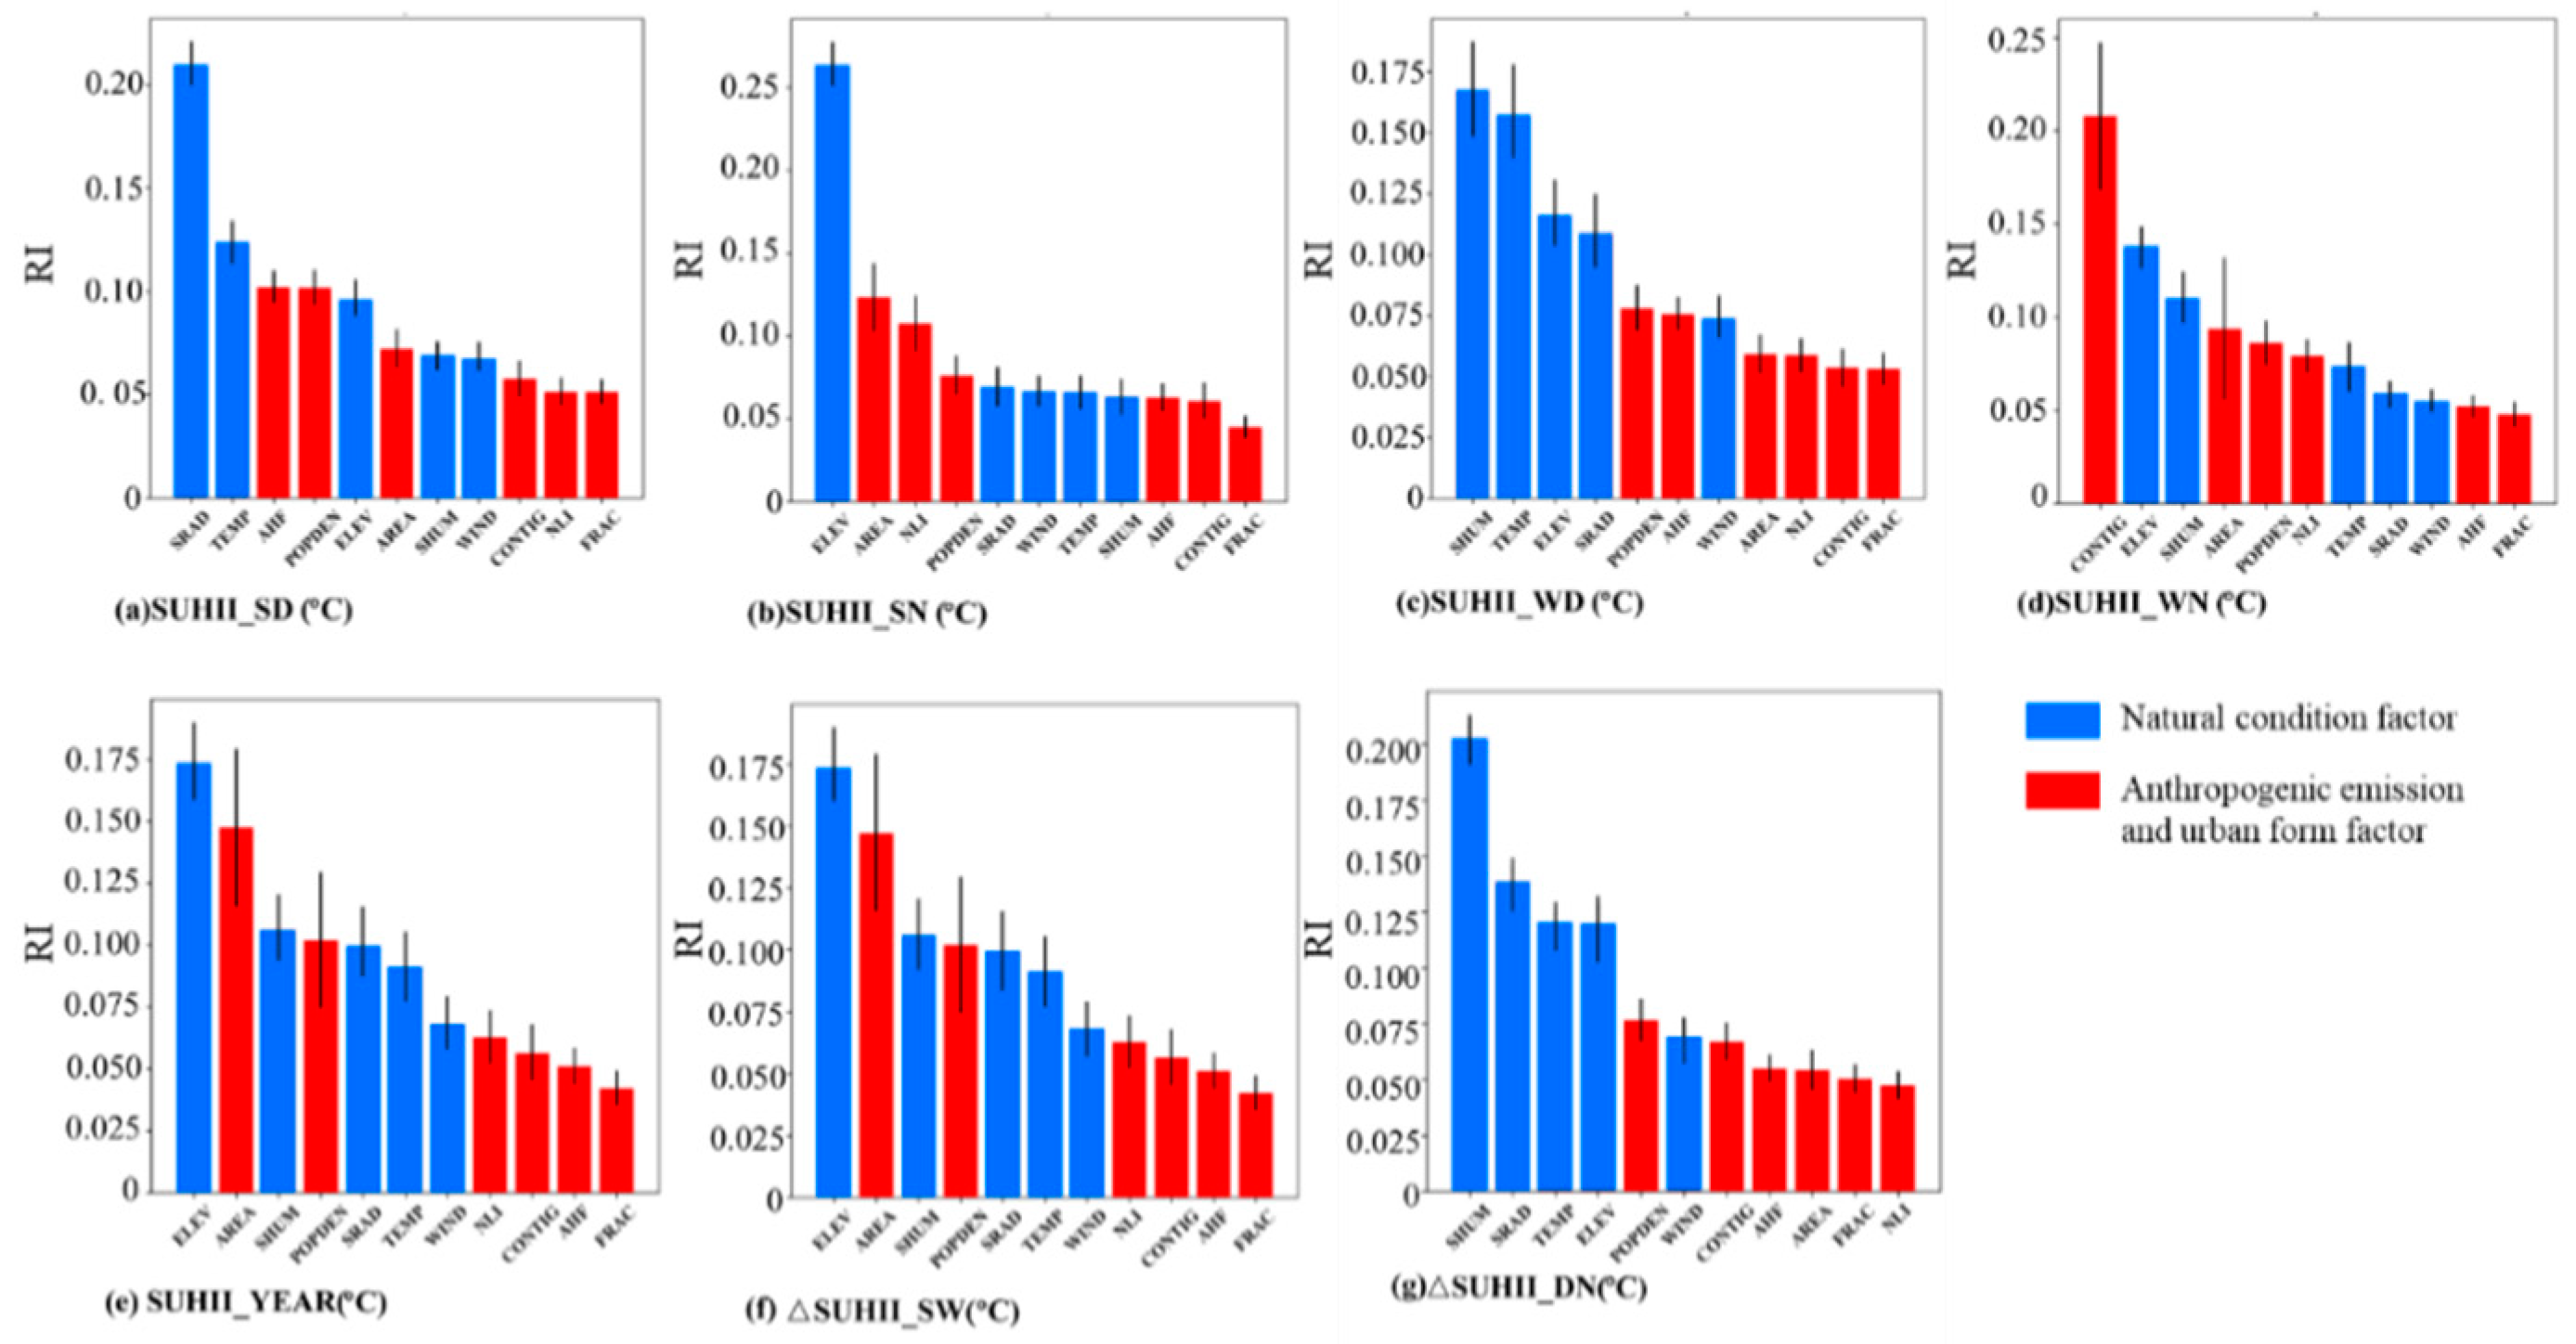
3.4. Seasonal and Diurnal Differences in the Relative Importance of Urban Form Factors
The results of the three-fold cross validation of the Random Forest model showed that the explanatory power of five natural features (SHUM, SRAD, TEMP, ELEV, WIND) and six anthropogenic and urban morphology features (AHF, NLI, POPDEN, AREA, CONTIG, FRAC) on the summer day, summer night and winter night heat island intensity (average R-square of three-fold cross validation was 0.46 to 0.54) was significantly higher than that of winter day (average R-square was 0.39). The selected features explained the SUHII_DN (0.65) better than that of SUHII_SW (average R-square = 0.21).
Although some studies on urban scale rank the relative importance of urban form indicators to the intensities of the heat island effect, there is no clear conclusion so far. For example, a study based on 38 cities in the United States found that impervious surface area was the most important factor affecting LST, which could explain 70% of LST change [
17]. However, a study based on 193,090 cities around the world showed that the ranking of the relative importance of the influencing factors of daytime heat island intensity is vegetation index, area, night light intensity and population density, while for night heat island intensity, the ranking of relative importance is urban area size, night light intensity, vegetation index and population density [
6].
The results of our random forest model show that the ranking of relative importance of urban form factors has significant seasonal and diurnal differences. As shown in
Figure 6, for the summer daytime heat island, the top four urban form factors of relative importance were the SRAD, TEMP, AHF and POPDEN. For summer nights, the top four were the ELEV, AREA, NLI and POPDEN. In winter, the top influencing factors of heat island in the daytime were the SHUM, TEMP, ELEV and SRAD, while at night, they were the CONTIG, ELEV and SHUM. For the annual heat island effect, the most important feature was the altitude, followed by the AREA, SHUM and POPDEN. The ELEV and AREA were the most important factors of SUHII_SW variation, while SHUM and SRAD were the most important factors of SUHII_DN variation. To conclude, for the SUHIIs at night, the relative importance of the urban morphology was greater, while for the intensity of the heat island effect in the daytime, the relative importance of natural factors was greater. The contribution of the urban morphology to the seasonal variation of the heat island intensity was similar to that of natural factors, but the contribution to diurnal variation was relatively low. We further analyzed the influence of various factors on SUHII_SW variation and SUHII_DN variation through a multiple linear regression model (
Table 3). The results showed that NLI and PREC significantly increased the diurnal and seasonal variation of the heat island effect. The POPDEN, TEMP and SHUM only affected the diurnal difference of SUHII, but had no significant effect on the seasonal difference of the SUHII. However, the AREA and ELEV mainly affected the seasonal difference of the SUHII, but had no significant effect on the diurnal SUHII difference.
3.5. Implications, Limitations and Future Studies
Our analysis has the following implications for urban planners and policy makers. First of all, in order to effectively alleviate the heat threat in summer, urban planners and managers need to pay more attention to the control of anthropogenic emission intensity, area scale and geometric continuity in higher urbanized and more developed cities, as the effect of the AREA, AHF and CONTIG on the SUHII on summer days and nights all increase with the increase of NLI. Moreover, urban planning should carefully assess the impact of the rising urban continuity to avoid too concentrated urban development. Although the United Nations advocates compact cities, it is necessary to pay more attention to the additional impact of spatial compactness on the thermal environment, which will have a greater impact with the social and economic development of cities and climate warming. The results show that the relationship between CONTIG and the intensity of the heat island effect in summer is significantly enhanced along NLI, SHUM and TEMP gradients. Finally, the population density should be properly controlled because the population density not only has a greater impact on the heat island effect in highly urbanized areas, but also plays an important role in the diurnal and seasonal variation of the heat island effect, increasing the coping burden of the urban energy system and the burden of human health.
There are a few limitations of this paper. On the one hand, there are some limitations in the data sources. As for the anthropogenic heat emission and night light intensity data, we still cannot obtain more precise seasonal and day–night scale data. These two indicators can only approximately reflect the impact of the regional average level of social and economic activities. The wind speed and direction have not been considered due to limited data availability.
The second limitation is that the mechanism of seasonal and diurnal changes in the relationship between the urban morphology and the heat island effect with the urban development level, altitude and climatic gradient was not fully explained. At the macro scale, the complex effects of urban forms on the heat island effect include a physical process and a socioeconomic process that challenge the accurate simulation of the physical equation model. For example, many contradictory conclusions have emerged in the study of urban sprawl and air pollution/heat island effect/carbon emission in recent decades. We used remote sensing datasets focusing on the factors affecting the heat island effect in China. In the dataset, there were more than 3000 groups of urban samples. The influencing factors included anthropogenic heat emission, night light intensity, urban morphology, altitude and meteorological variables. The comprehensive statistical analysis of a large number of research samples obtained from remote sensing provided a basis for outlining the macro performance of the complex impact of urban morphology. Nevertheless, our analysis of these possible impacts can effectively help relevant researchers integrate a multiple perspective into their work and help the academic community further enhance the understanding of the variations of urban macro morphology across seasons and days and nights. The last limitation is that it is difficult for our model to separate the roles of closely related factors. We found in the correlation matrix analysis of influencing factors that the SHUM and TEMP show a very strong positive correlation (correlation coefficient of 0.92), while the NLI and POP are not significantly correlated (correlation coefficient of 0.33) (
Appendix A Table A1,
Table A2,
Table A3 and
Table A4). This means that future research needs to fully separate the effects of the SHUM and TEMP to accurately assess the impact of natural environmental factors on the SHUII. On the other hand, the difference in the relationship between the NLI and the POPDEN and UHII can be more credibly considered to be caused by the different influence mechanisms of the NLI and POPDEN.
Future research can continue to focus on the following aspects. First, more large cities around the world need to be paid attention to, because the factors affecting the heat island effect of large cities may be more complex, including not only climate and urban morphology, but also related mitigation measures. Second, future studies can continue to use Random Forest or gradient boosting models to explore the impact of the interaction between factors, and further evaluate the heterogeneous role of urban morphology and its possible amplification effect on factors such as anthropogenic heat emissions. Finally, in addition to the identification of factors affecting the heat island effect and attribution analysis, the establishment of a prediction model based on a large number of city samples is also of important practical significance. A robust prediction model can help managers to scientifically evaluate the impact of urban morphological changes and formulate effective policies. In addition, the mechanism of the changing effect of urbanization and urban morphology along NLI and DEM gradients should be further explained, which can be further verified by atmospheric simulation models. In addition, with the support of high-resolution data, the analysis of the impact of land use types in the buffer zone and the impact of urban–rural climate differences will contribute to the cause decomposition of the UHI.
4. Conclusions
Based on the indicators of more than 3000 cities in China, this study evaluated the seasonal and diurnal differences in the impact of the urban form on the intensity of the heat island effect. Based on remote sensing data, the anthropogenic heat emission, night light intensity, urban morphology continuity/fractal dimension, altitude, solar radiation, temperature and humidity of the cities were quantitatively evaluated. We used correlation analysis and the Random Forest model to analyze the seasonal and diurnal differences of the correlation between the urban form and heat island effect and the relative importance of various factors. Three conclusions were drawn from this study:
Firstly, the SUHIIs change regularly with the gradient of altitude and urban development. With the increase of the urban development level, the annual SUHII, summer day SUHII, summer night SUHII and winter night SUHII have all risen. The seasonal difference of the SUHIIs went up about 0.4 °C, while the diurnal difference of SUHIIs decreased by 0.4 °C.
Secondly, the relationship between the urban form and heat island effect shows obvious seasonal and diurnal differences along urban development and the elevation gradient.
With urban development, the correlations between anthropogenic heat flux, population density and morphological continuity with the SUHII of summer days, summer nights and winter nights continued to be enhanced, with the correlation coefficients (β) increasing by about 0.3. The effect of the area size became more influential on the SUHII of summer, but its effect on the SUHII of winter nights increased first and then decreased along the urban development gradient. With the increase of elevation, the correlations of anthropogenic heat flux, population density, area size, morphological continuity and summer SUHII were gradually reduced (β decreased by about 0.4), but their impact on the SUHII of winter nights was gradually enhanced (β increased by about 0.2 to 0.3). Along the temperature and humidity gradients, the positive effect of the population density on the summer SUHII decreased monotonously (β decreased by about 0.3). However, the enhancement effects of anthropogenic heat flux, area size, morphological continuity and population density on the SUHII of winter nights increased generally (β increased by about 0.2).
Thirdly, the factor importance ranking of the urban form to the heat island effect intensity shows significant seasonal and diurnal variations. For the intensity of the heat island effect at night, the relative importance of urban morphology was greater, while for the intensity of the heat island effect in the daytime, the relative importance of natural factors was greater. The contribution of urban morphology to the seasonal variation of heat island intensity was similar to that of natural factors, but the contribution to diurnal variation was relatively low.
Our results provide an empirical reference for further exploring the driving factors of urban morphology influencing the intensity of the heat island effect in different seasons and during days and nights. The limited interpretation of our results can also effectively provide multiple perspectives of the effect of urban development, altitude impact and other natural conditions and enhance the academic community’s understanding of the heterogeneity of environmental effects of macro urban form. Since the summer heat island effect plays an important role in promoting the high-temperature heat wave disaster, we highlight the necessity to control the urban size, avoid excessive urban agglomeration and reasonably control the anthropogenic heat emission in more developed and low altitude cities.


 ,
, 


