
Spatiotemporal Evolution and Influencing Factors of Urban Land Ecological Security in Yunnan Province

Institute of Land & Resources and Sustainable Development, Yunnan University of Finance and Economics, Kunming 650221, China
*
Author to whom correspondence should be addressed.
Sustainability 2021, 13(5), 2936; https://0-doi-org.brum.beds.ac.uk/10.3390/su13052936
Submission received: 5 February 2021
/
Revised: 1 March 2021
/
Accepted: 1 March 2021
/
Published: 8 March 2021
(This article belongs to the Section Sustainable Urban and Rural Development)
Abstract
:(1) Background: Urban land ecological security is the basis and premise to ensure the sustainable utilization of urban land resources and regional sustainable development. However, urban land ecological security and its influencing factors have not been studied thoroughly. (2) Methods: An index system of urban land ecological security in Yunnan Province from 2010 to 2019 was constructed, and a comprehensive index of urban land ecological security was calculated by using analytic hierarchy process, entropy weight method, and comprehensive index method, and the LSDVC (Biased-corrected Least Square Dummy Variables) dynamic panel model was constructed from the economic, social and geographical dimensions to systematically analyze the influencing factors of urban land ecological security in Yunnan Province. (3) Results: The comprehensive index of urban land ecological security was significantly affected by the previous period, showing obvious inertia; with the improvement of urbanization level, the comprehensive index of urban land ecological security showed an inverted “U” shape, which first increased and then decreased; the decrease in comprehensive energy consumption per unit of industry and the improvement of fixed-asset investment level, science and technology level, and GDP will significantly promote the ecological security of urban land.
1. Introduction
The exploration and research of ecological security-related concepts in other countries started long ago. Aldo Leopold, a famous American environmentalist, put forward the concept of “land health” in 1949 [1]. Since then, the research on ecosystem security and environmental issues has gradually developed. In 1972, the United Nations held a conference on human environment in Stockholm, the capital of Sweden, and adopted the United Nations Declaration on human environment, which was the first international discussion on the theory of sustainable development [2]. The concept of the “eco city” was first put forward by Yanitsky, a famous ecologist in the former Soviet Union [3]. In 1989, the International Institute of Applied Systems Analysis (IASA) first gave the definition of ecological security. IASA defined ecological security as when people’s basic security, resources, health, well-being, and social order are not threatened [4]. After the 1990s, Western countries, research institutions and organizations began to discuss and study the relationship between ecological environment change and ecological security protection, and began to produce representative research results [5,6,7].
The research and practice of land ecological evaluations have been carried out in other countries for a long time. In 1976, the Food and Agriculture Organization of the United Nations (FAO) published A Framework for Land Evaluation, which was specifically used to evaluate the suitability and suitability degree of land and is widely used in soil science, botany, agricultural engineering and other disciplines [8]. Since then, the FAO has launched a series of evaluation outlines for different land types, including Land Evaluation for Forestry (1984), Guidelines: Land Evaluation for Irrigated Agriculture (1985), and Guidelines: Land Evaluation for Rainfed Agriculture (1983), which are of great significance; they promote the development of land ecological evaluation. In 1993, the FAO published the An International Framework for Evaluating Sustainable Land Management, which has important reference value. The outline establishes ecological evaluation indexes for evaluating land production capacity, land system security and stability, and land resource protection functions. More and more scholars began to study and explore the methods of land scientific evaluation. For example, English John et al. (1994) build index system to quantitatively evaluate regional land ecological problems [9]. These scholars have promoted the development of land evaluation research and enriched the land evaluation index system.
Since 1999, the scientific research achievements in ecological security research in China have constantly emerged. Many scholars have made a lot of meaningful explorations and attempts on the related concepts of ecological security [4,10,11,12]. In 2000, the State Council issued National Ecological Environment Protection Program (GF [2000] No. 38), which requires all regions to formulate their own ecological environment protection plans according to the outline, take positive measures, strengthen the work of environmental protection, and strive to achieve the “grand goal of beautiful mountains and rivers of the motherland” [13]. Yang Zisheng (2002) put forward the idea and framework of land ecological planning and design based on land ecological evaluation [14]. Urban land ecological security is a new research field. Urban land ecological security is based on the concepts and theories of ecological security and land ecological security. At present, there is no agreement on the definition of urban land ecological security. Liang Like (2005) believes that there will be a series of problems and contradictions in the process of urban land use, and the fundamental way to solve the problems and contradictions is to promote the security of urban land resources, improve the utilization efficiency of land resources, and promote the intensive and economical utilization of urban land resources, so as to achieve the goal of urban sustainable development [15]. Zhang Hongbo (2007) believes that to promote ecological security, urban land needs to optimize the urban structures, to promote the process of new urbanization a scientific and reasonable urbanization layout needs to be built, and to optimize the urban internal spatial structure by promoting the intensive and economical use of land resources [16]. At present, there are various research perspectives on urban land security, including the evaluation of urban land ecological security [17,18,19,20], the influencing factors of urban land ecological security [21], the early warning of urban land ecological security [22,23], establishing ecological security patterns [24,25], etc. Among them, the commonly used methods of influencing factor analysis are factor analysis, grey correlation models, dominant factor identification based on geographical detectors, etc.
As a residential area with the main characteristics of non-agricultural industry and non-agricultural population aggregation, the urban environment plays an extremely important role in the field of economic development, and is an important region in which to promote economic growth. However, no matter which country, in the process of urbanization, the example of sacrificing the environment and ecology in exchange for excessive GDP growth has been common, such is the tension between man and land, including environmental pollution, ecological damage, unsustainable development and other problems; the study of urban land ecological security is of great significance for the sustainable utilization of urban land resources and the improvement of urban ecosystem services [26,27]. Overall, a few types of empirical research have studied urban land ecological security in foreign countries. A large amount of research mainly focuses on the national and even global ecological security research based on large scales, and the research direction focuses on the risk of environmental problems and natural disasters, and the global and ecosystem health of ecological security [28,29,30,31,32,33]. Many scholars have studied the driving factors and ecological benefits of land use change, but the research results combined with land ecological security and its influencing factors are rare. There are still many deficiencies in the existing research on the influencing factors of urban land ecological security, such as not considering the dual impact of urbanization on urban land ecological security, not considering the inertia of urban land ecological security, reduced consideration of the terrain and climate conditions, etc. Therefore, it is necessary to study the spatial-temporal evolution and influencing factors of urban land ecological security at home and abroad, so as to find out the root cause and development of urban land ecological security, better optimize urban land use modes, and provide a foundation and basis for sustainable land use and urban sustainable development.
Yunnan Province is a region integrating mountains, frontiers, nationality, and underdevelopment. Its inherent ecological environment is fragile. At the same time, it shoulders the important task of an ecological security barrier in Southwest China. Implementing the development concept of ecological priority and the development concept of “lucid waters and lush mountains are invaluable assets”, as well as strengthening the ecological environmental security of urban land use is the key for Yunnan to build the vanguard of an ecological civilization and strengthen the ecological security barrier in Southwest China. Based on this, this paper will build the index system of urban land ecological security status on the basis of previous studies, using the analytic hierarchy process (AHP) [34] and entropy weight method to determine the weight of each index, and use the comprehensive index method to calculate the comprehensive index of urban land ecological security. This paper will construct the index system of influencing factors from the economic, social, geographical, and other dimensions, and use the LSDVC (Biased-corrected Least Square Dummy Variables) method to build a dynamic panel model to systematically analyze the influencing factors of urban land ecological security in Yunnan Province, aiming at optimizing urban land use modes and providing the foundation and basis for sustainable land use and sustainable urban development.
2. Materials and Methods
2.1. Technical Route and Research Ideas
The research on the spatiotemporal evolution and influencing factors of urban land ecological security in Yunnan Province needs to involve the calculation of the comprehensive index of urban land ecological security and the construction of an index system of influencing factors. The process is shown in Figure 1.
As shown in Figure 1, the main research line of this paper mainly includes two parts: spatiotemporal evolution analysis and influencing factor research. In terms of spatiotemporal evolution analysis, this paper constructs the index system of urban land ecological security, determines the weight of each index by using the analytic hierarchy process and entropy weight method, and calculates a comprehensive index of urban land ecological security (detailed in Figure 2). In terms of the influencing factors, this paper establishes the index system of influencing factors from the economic, social, geographical, and other dimensions, constructs the econometric model and chooses the model (detailed in Figure 3), and systematically analyzes the influencing factors of urban land ecological security in Yunnan Province.
In the research process, not only the evaluation index system of urban land ecological security and the calculation of its comprehensive index were performed, but an index system of influencing factors was also constructed. On the surface, there is a correlation between the two, but the difference is very obvious. For the evaluation index system, the selected evaluation indexes need to fully reflect the status of urban land ecological security, rather than affect the urban land ecological security. For example, the green coverage rate of built-up areas is a full reflection of the ecological security of urban land. If the green coverage rate of built-up areas is higher, the ecological security of urban land will be better. At the same time, it should be noted that the evaluation indicators do not necessarily reflect this situation positively. For example, the average industrial waste gas emission is a negative reflection, i.e., the greater the emissions, the more unsafe the urban land ecology is. In terms of the influencing factors of urban land ecological security, each index does not reflect the status of urban land ecological security, but affects its status. For example, the level of urbanization may affect the ecological security of urban land, but we cannot say that the higher the level of urbanization, the safer the urban land ecology will be. To determine its impact, we need to build an econometric model and use statistical methods to draw exact conclusions. Therefore, it is necessary to find out all kinds of factors that may affect the ecological security of urban land and conduct a scientific and systematic analysis.
2.2. Selection of Index System of Urban Land Ecological Security and Weight Determination Method
2.2.1. Selection of Index System of Urban Land Ecological Security
This study intends to evaluate the ecological security of urban land in Yunnan Province from the perspective of ecological civilization construction, and the index selection should comprehensively and accurately reflect the situation of urban land ecology.
In order to build a comprehensive, scientific, and objective index system of urban land ecological security in Yunnan Province, the indicators selected in this paper mainly refer to The Colorful Yunnan Ecological Civilization Construction Planning Outline (2009–2020) and relevant literature, and select a total of 7 indicators, as shown in Table 1.
2.2.2. Weight Determination Method
- (1)
- Analytic Hierarchy Process
Analytic hierarchy process (AHP) is a combination of qualitative and quantitative analysis methods; its principle function is to decompose the complex multi-objective decision-making problems into the objective level, criterion level, and scheme level.
① Index system layering: according to the layering principle of the analytic hierarchy process, the index system of urban land ecological security in Yunnan Province is divided into the target layer and index layer, based on which the hierarchical structure model of urban land ecological index is constructed;
② Establishment of judgment matrix. By searching for relevant literature, each index is compared in pairs, the relative importance of each factor in each level is obtained, and the comparison matrix is constructed according to the scale of numbers 1–9;
③ The feature vector, feature root and weight are calculated. The purpose of this step is to calculate the weight value. Before calculating the weight, the eigenvector value should be calculated, and a consistency test should be carried out. When CI = 0, the judgment matrix is consistent. The larger the CI, the more serious the inconsistency is. Then, find the random consistency index RI. When CR = CI/RI < 0.1, the degree of inconsistency of judgment matrix is within the allowable range. Finally, the total order of hierarchy is carried out.
- (2)
- Entropy Weight Method
The calculation process of entropy weight method is as follows [35]:
① The indexes with positive properties and negative properties are dimensionless:
② Calculate the information entropy of each index:
If pij = 0, then we will define .
③ According to the information entropy E1, E2, …, En, the weight of each index is calculated as follows:
- (3)
- Calculation method of combination weight.
The entropy weight method is an objective weighting method to determine the importance of indicators according to the data information of indicators, which lacks the consideration of the relative importance of indicators and the subjective preference of researchers; analytic hierarchy process (AHP) is a method to determine the importance of indicators based on expert experience and knowledge reserves, which has strong subjectivity. In order to make the index weight more scientific, this paper combines the advantages and disadvantages of subjective and objective weight determination, and uses the subjective and objective combination weighting method to determine the index weight, which can realize the organic combination of subjective and objective weighting and make the evaluation results more scientific.
According to the analytic hierarchy process, the weight vector of each index of urban land ecological security is as follows:
According to the entropy weight method, the weight vector of each index of urban land ecological security is as follows:
According to the analytic hierarchy process (AHP) and entropy weight method, the combination weight of indicators is determined as follows:
In this study, through the analysis and access to a variety of comprehensive evaluation methods, the most widely used and mature evaluation method—the comprehensive index method—was adopted. It evaluates urban land ecological security according to the value of each evaluation index and its corresponding weight:
In Equation (7), Aij is the value of urban land ecological security of city i; Wj is the combination weight of index j; and Pij is the standardized value of index j of city i, namely urban land ecological security index.
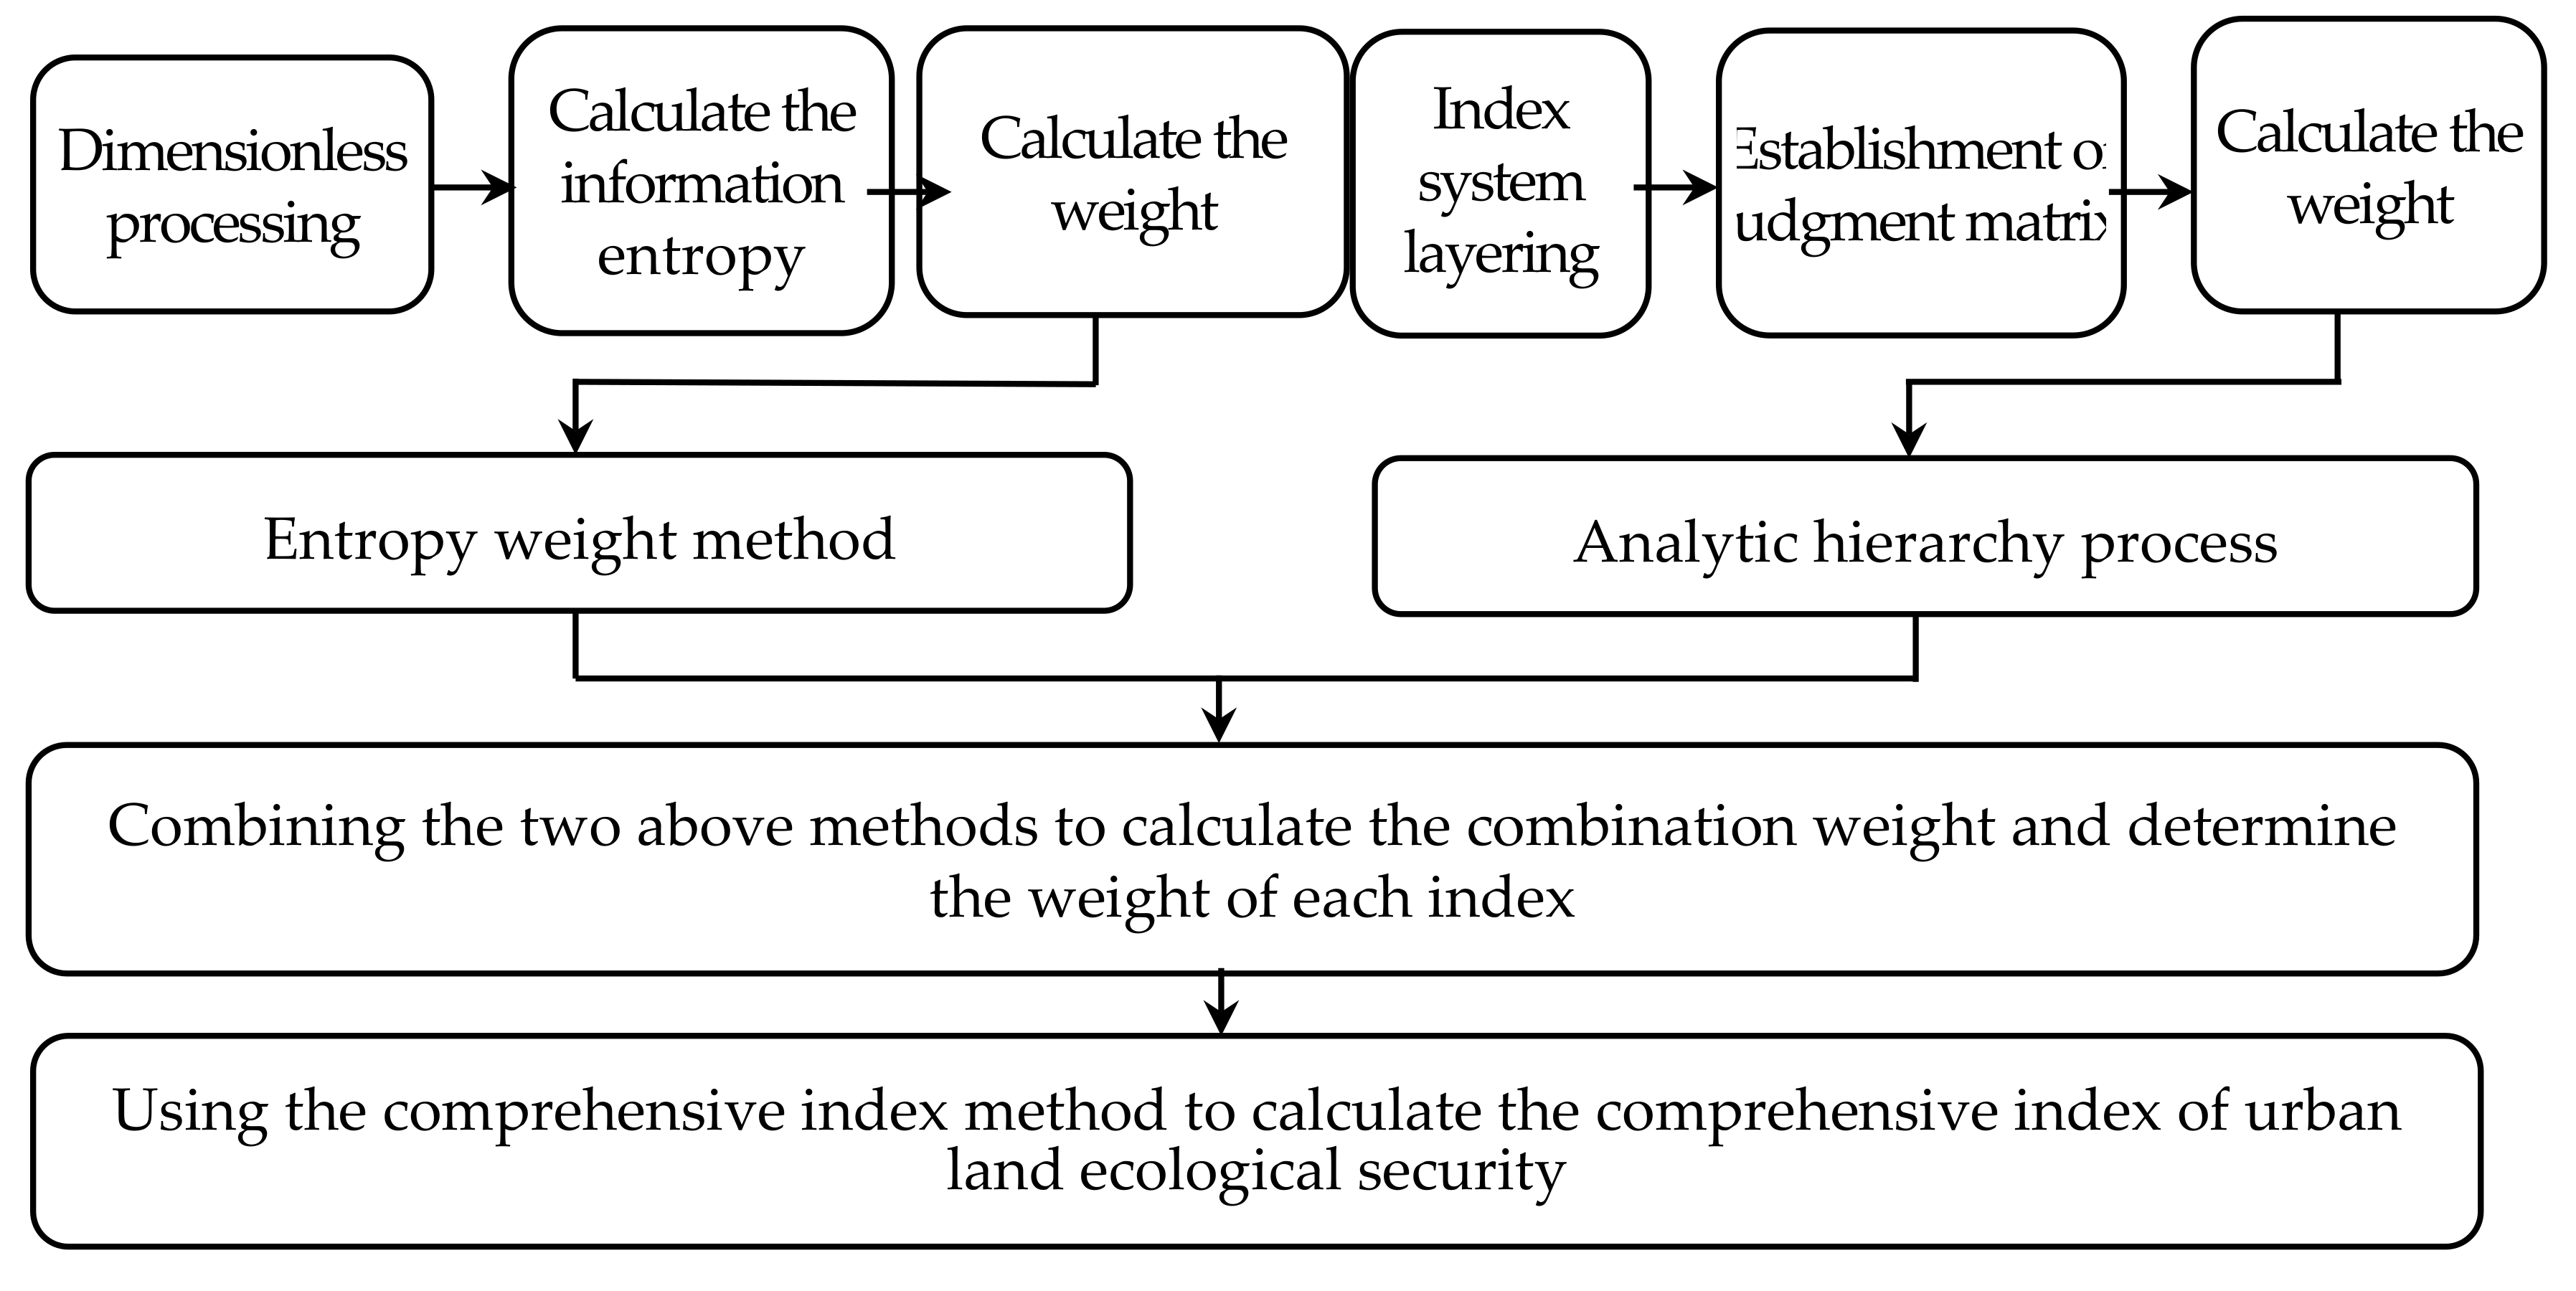
The process of weight calculation is shown in detail in Figure 2.
2.3. Index Selection of Influencing Factors and Research Methods of Dynamic Panel Model
2.3.1. Index Selection of Influencing Factors
Combined with the actual situation of 16 states (cities) in Yunnan Province, according to the principles of science, operability, comparability, universality, and regionality of index selection, the index system of influencing factors of urban land ecological security in Yunnan Province was constructed.
Urban land is a typical complex ecosystem composed of society, economy, and nature, which has physical, ecological, social, and economic attributes [36,37,38]. Urban land ecological security is affected by many factors, and the external factors affecting urban land ecological security involve economy, society, geography, and many other aspects. The joint action of all factors means that urban land ecological security produces space–time differences. Therefore, this study constructed the index system of influencing factors from three dimensions of economy, society, and geography, as shown in Table 2.
2.3.2. Research Methods of Dynamic Panel Model in Econometrics
Generally speaking, the common panel model can be used. The panel model can be divided into fixed effect and random effect. The general setting of the model is as follows:
where Yit is the comprehensive index of urban land ecological security, Zi is the individual characteristics that do not change with time, Xit changes with the individual and time, ui is the individual effect, and εit is the residual disturbance term. If ui is related to one explanatory variable, it is called a fixed effect model. If ui is not related to all explanatory variables, it is called a random effect model.
However, the inertia of the dependent variable is often ignored in many studies. If the lag term of the dependent variable is added as one of the explanatory variables, the model setting will be as follows:
However, using this kind of dynamic panel model estimation will bring bias, called “dynamic panel bias”, which is usually estimated by differential GMM (Generalized method of moments) and system GMM (Generalized method of moments). The individual effect can be eliminated by making the first-order difference:
Arellano and Bond (1991) considered that all possible lag variables can be used as instrumental variables for GMM estimation, which is called the Arellano–Bond estimator. In addition, Blundell and Bond (1998) proposed the idea of system GMM estimation; system GMM estimation is more efficient.
However, the differential GMM and system GMM methods are mainly suitable for short-term dynamic panels. Considering that the 10-year data selected in this study and the panel is long term, it is not suitable to use the differential GMM and system GMM estimation; thus, the LSDVC (Biased-corrected Least Square Dummy Variables) method is considered to correct the bias. The idea is by using LSDV (Least Square Dummy Variables) method to estimate the dynamic panel model, and estimating the bias of LSDV, finally subtracting the bias from the estimated value of LSDV coefficient, achieves a consistent estimation. The differential GMM estimator or the system GMM estimator can be used as its initial value.
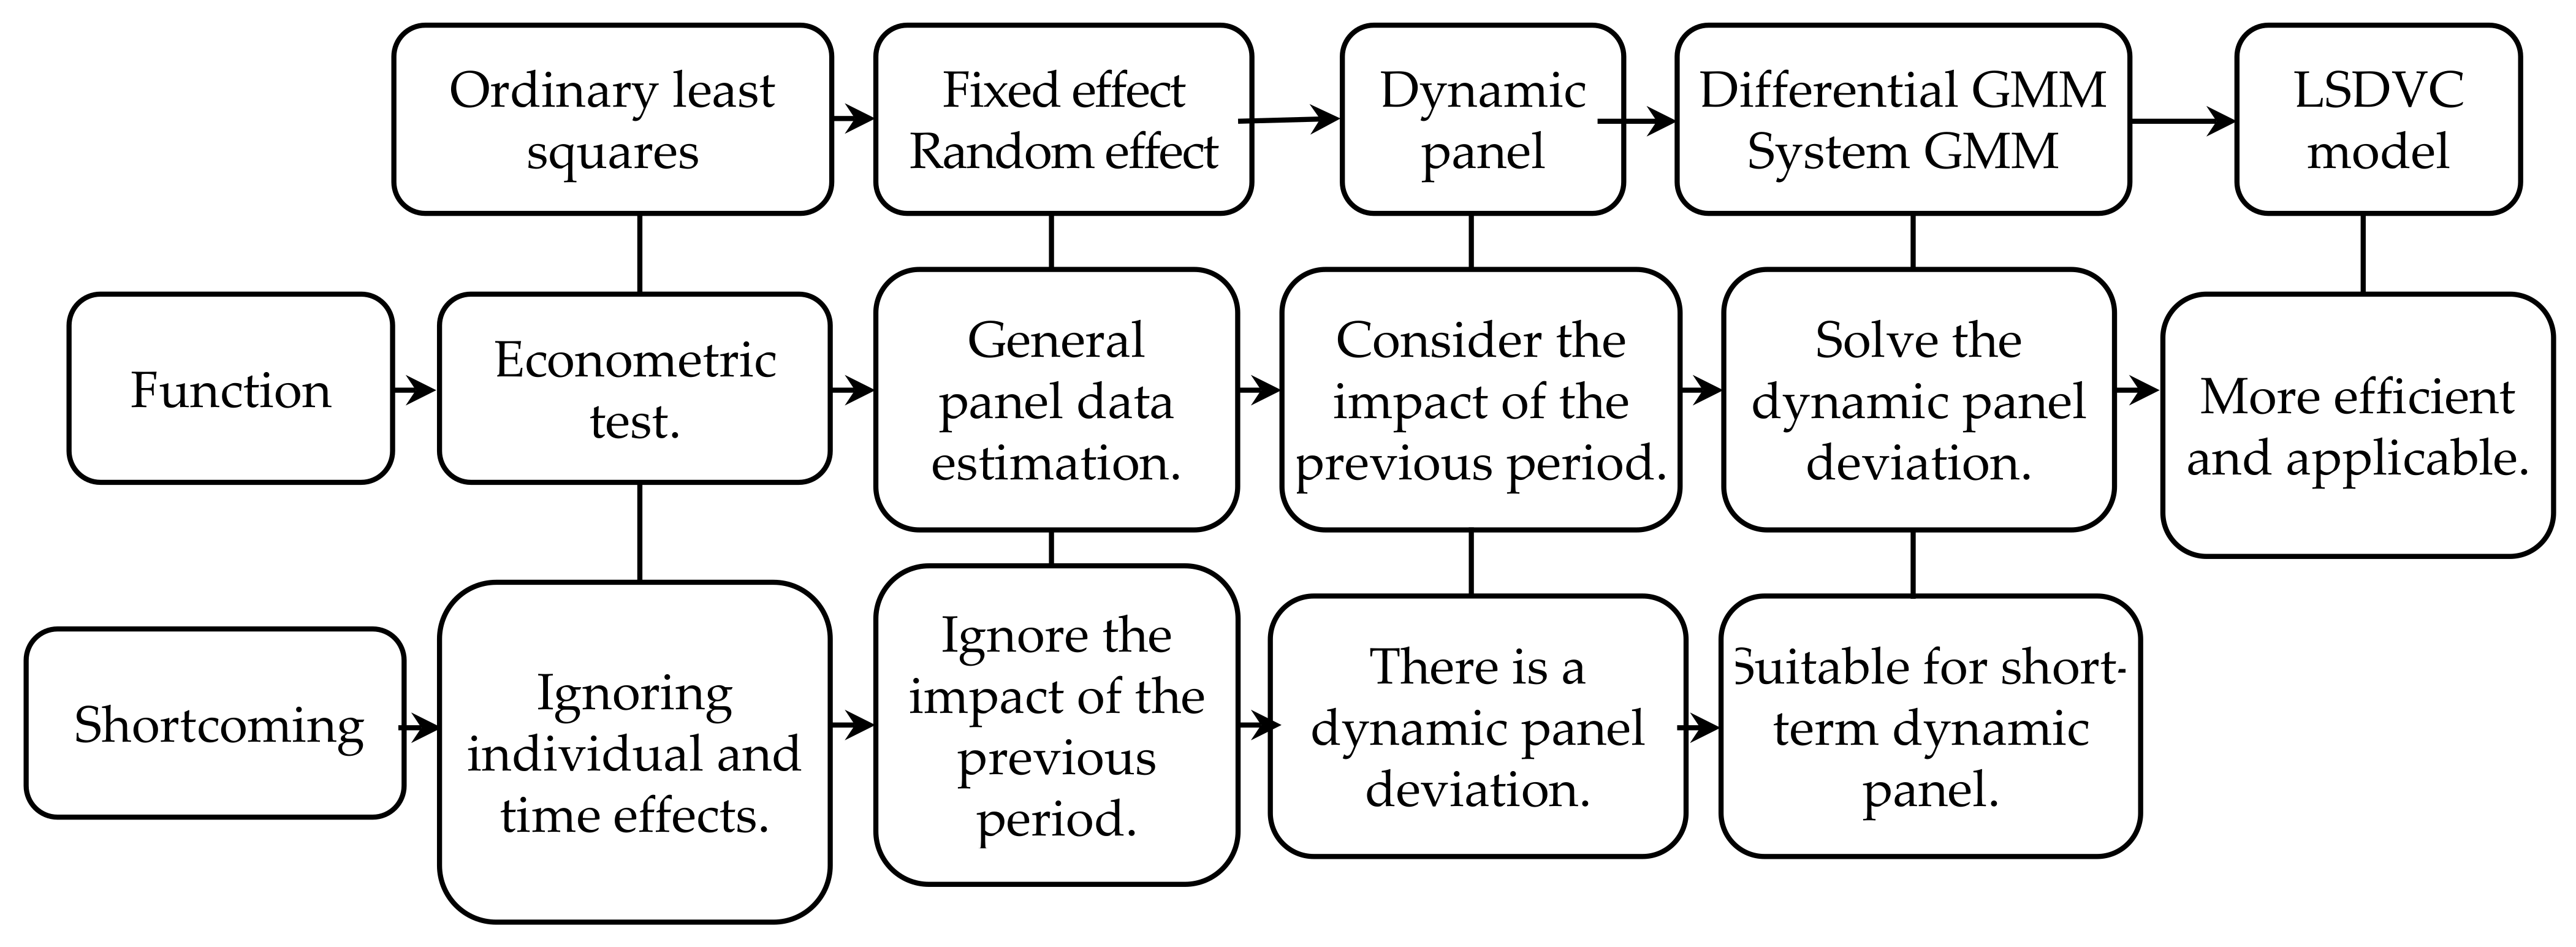
The process of analysis of the influencing factors is shown in Figure 3.
3. Results
3.1. Spatiotemporal Evolution of Urban Land Ecological Security
Generally speaking, the comprehensive utilization efficiency of urban land in Yunnan Province is low, and the urban area continues to expand to the periphery, resulting in the increasing pressure on cultivated land protection. Therefore, it is necessary to study the temporal and spatial evolution of urban land ecological security in Yunnan Province. This study draws the changing trend of the comprehensive index of urban land ecological security in Yunnan Province from 2010 to 2018 (Figure 4).
As shown in Figure 4, on the whole, the comprehensive index of urban land ecological security of each state (city) increased slowly from 2010 to 2014, but most of the states (cities) decreased significantly in 2015 compared with 2014, and increased after 2016. The typical examples are Kunming, Yuxi, Baoshan, Zhaotong, Chuxiong, and Honghe. From the comprehensive index of urban land ecological security, the values of Lijiang, Xishuangbanna, and other states (cities) are higher relatively. The possible reasons are that the forest coverage rate of Lijiang and Xishuangbanna is higher, and the environment is generally better. However, Zhaotong, Nujiang and Diqing, which are relatively remote from Kunming, have low values, which may lead to potential ecological security risks of urban land. The reasons may be that these areas are far away from the main urban area of Kunming, with poor geographical conditions, underdeveloped infrastructure, fragile ecological sensitivity, and underdeveloped sewage and wastewater treatment technology, which pose a serious threat to ecological security. Luckily, the comprehensive index of urban land ecological security in Zhaotong and Diqing has increased significantly in recent years, which may be related to the improvement of wastewater and waste gas treatment technology and the emphasis on ecological protection. In order to better analyze its spatial distribution, this study draws lessons from the research results and conclusions of relevant literature [39,40], uses the non-equidistant method to divide the comprehensive value of land ecological security in Yunnan Province into five levels (Table 3), and draws the spatial differentiation maps of urban land ecological security of each state and city in Yunnan Province in 2010, 2014 and 2019 (Figure 5).
As can be seen from Figure 5, there were increasing numbers of safe areas, and fewer sensitive and risk areas from 2010 to 2019. Besides, the ecological security of urban land in southwest Yunnan is generally better, while the ecological security of urban land in southeast, northeast, and northwest Yunnan is generally weak. In addition, by comparison, Figure 5 shows that in 2010, only Zhaotong was at the sensitive level, in 2014, Yuxi was at the sensitive level, and by 2019, most of the states (cities) had reached the relatively safe level, and only Wenshan, Kunming, Zhaotong and Nujiang were in the critical safety level. In general, the comprehensive index of urban land ecological security in each state (city) has gradually risen. Although Zhaotong, Nujiang, Diqing and other states (cities) have developed rapidly in recent years, they are obviously restricted by inertia. In addition to the problems of a fragile ecological environment, weak infrastructure, more mountains, and less flat land, it is still a difficult task to improve the urban land ecological security in these underdeveloped areas.
3.2. Analysis on Influencing Factors of Urban Land Ecological Security
According to the index system in Table 2, this study intends to build the ordinary least squares regression (OLS), fixed effect (FE), and random effect (RE) models. Among them, the terrain condition X10 and climate condition X11 have little change each year, so it is appropriate to interact these two variables with other variables into the model. According to the general knowledge of the subject and after the test, this study intends to construct the cross-multiplication term. However, too many variables will increase the collinearity of the model. The terrain condition X10, as the important factor of urban land ecological security, is more suitable to be introduced into the model. Therefore, this study only introduces the cross-multiplication term X5 × X10 into the model. Based on the above data, an OLS model, FE model and RE model were constructed (in order to save space, the estimation results of OLS model were omitted, while the estimation results of the FE model and RE model are shown in FE-1 and RE-1 models in Table 4). In the process of construction of OLS model, it was found that the white test statistic is significant at the significance level of 1%, which indicates that there is heteroscedasticity in the model, and the R2 value of OLS-1 is low. After careful consideration, it was found that the model may omit an important explanatory variable—the comprehensive index Yt−1 of urban land ecological security in the last year, because the degree of urban land ecological security in Yunnan Province may have a certain inertia, which is affected by the previous year. At this time, the white test statistic of the OLS model failed to pass the significance level test of 10%, which indicates that the urban land ecological security composite index Yt−1 of the last year may be an important reason for the heteroscedasticity of the model (in order to save space, the estimation results of OLS model are omitted) The estimation results of FE model and RE model are shown in the FE-2 and RE-2 models in Table 4.
However, there is a problem of estimation bias when the lag term of the dependent variable is used as the independent variable to construct the dynamic panel. Although this paper constructs the data of 16 states (cities) for 10 years, the bias is still inevitable. Strictly speaking, it needs to be rectified. The commonly used methods are differential GMM and system GMM estimation (the estimation results are shown in Table 4), but these two methods may be more suitable for the short-term dynamic panel. For the data with smaller n (numbers) and larger T (times), it may bring more serious estimation bias. The more scientific method is to use the bias correction LSDVC method, and usually take the Arellano–Bond differential GMM estimator and the Blundell–Bond system GMM estimator as the initial values, then the accuracy is determined as o(n−1T−1), and 50 repeated samples of the bootstrap method are set; finally, LSDVC-1 model and LSDVC-2 model are obtained (see Table 4 for the estimation results).
In general, there is little difference in the estimation results of FE-1, FE-2 and LSDVC models. However, there are some differences between the GMM Estimation and other models, which may be due to the bias of GMM estimation in the data with a smaller n and larger T; the more scientific method is to analyze the estimation results of the LSDVC method. It can be seen from Table 4 that there is little overall difference in the estimation structure between the LSDVC-1 model and LSDVC-2 model, so it is advisable to choose one of them for specific analysis. Relatively speaking, the system GMM estimation has many advantages, and its estimation efficiency is high, so this study mainly used the LSDVC-2 model with the Blundell–Bond system GMM estimator as the initial value.
- (1)
- Urbanization rate X1 and square term X12. According to the estimation results of the LSDVC-2 model, both the estimated coefficients of urbanization rate X1 and its square term X12 pass the 5% significance level test, and the estimated coefficients are 0.01768 and −0.00025, respectively, which indicates that the improvement of urbanization level promotes the ecological security of urban land at first, but when the urbanization level reaches a certain limit, it reduces the ecological security of urban land, showing a trend of inverted “U” shape, which is first raised and then lowered. The results show that when the urbanization rate is between 0% and 35.4%, the improvement of urbanization rate promotes the ecological security of urban land. However, when the urbanization rate is more than 35.4%, the improvement of urbanization rate inhibits the ecological security of urban land.
- (2)
- The investment level of fixed-assets is X2. According to the estimation results of the LSDVC-2 model, the fixed-asset investment level X2 has a significant positive correlation with urban land ecological security, with an estimation coefficient of 0.00698, which has passed the significance level test of 1%, indicating that the higher the fixed-asset investment, the safer the urban land ecological security is.
- (3)
- The level of science and technology is X3. According to the estimation results of the LSDVC-2 model, the level of science and technology X3 has a significant positive correlation with urban land ecological security, and the estimated coefficient is 0.00249, which has passed the significance level test of 5%. It shows that the stronger the level of science and technology, the safer the urban land ecological security is. In this paper, the sum of the general budget expenditure of science and technology and education accounts for the local financial expenditure of that year to characterize the science and technology level.
- (4)
- GDP in each state is X4. According to the estimation results of the LSDVC-2 model, GDP in each state X4 has a significant positive correlation with urban land ecological security, and the estimated coefficient is 0.00036, which has passed the significance level test of 10%. It shows that the more abundant GDP is, the safer the urban land ecological security is.
- (5)
- The comprehensive energy consumption level of industry is X7. According to the estimation results of the LSDVC-2 model, comprehensive energy consumption level of industry X7 has a significant negative correlation with urban land ecological security, and the estimated coefficient is 0.02093, which has passed the significance level test of 5%. It shows that the lower the comprehensive energy consumption level of industry, the safer the urban land ecological security is.
- (6)
- The comprehensive index of urban land ecological security in the last year is Yt-1. According to the estimation results of the LSDVC-2 model, the comprehensive index Yt-1 of urban land ecological security has a significant positive correlation with urban land ecological security in the current year, and the estimated coefficient is 0.40091, which has passed the significance level test of 1%. It shows that the comprehensive index of urban land ecological security has obvious inertia and is more dependent on the previous year.
4. Discussion
Urban land ecological security is not only the premise of sustainable utilization of urban land resources and regional sustainable development; it is also an important part of ecological construction. This study takes the data of 16 states (cities) in Yunnan Province from 2010 to 2019 as an example to analyze their spatiotemporal evolution and influencing factors.
The analysis of temporal and spatial evolution shows that, in recent years, with the government’s attention to the ecological environment, the comprehensive index of urban land ecological security in various places shows an upward trend. However, this does not mean that the urban land ecological security is already safe. Experience and lessons tell us that it is unsustainable to take the old road of pollution first and treatment later. We should still be vigilant against the counterattack of sacrificing the environment for growth. Zhaotong, Wenshan and Nujiang of Yunnan Province have improved their urban land ecological security in recent years. However, due to their underdeveloped infrastructure, poor terrain and location conditions, and fragile ecological environment, their urban land ecological security may face greater challenges. It is still an arduous task to improve the ecological security of urban land in these underdeveloped areas, so more attention should be paid to them.
The conclusions of the influencing factor analysis show that:
The improvement of urbanization level has an inverted “U” shape effect on urban land ecological security. One possible reason is that in the early stage of low urbanization levels, with the increase in urban population and the improvement of urbanization level, the agglomeration effect is obviously stronger than the diffusion effect. Agglomeration will bring various benefits such as economies of scale and knowledge sharing, so as to promote the improvement of management and technology. The process of urbanization can not only achieve economic growth and social development but can also promote the overall development. It plays a favorable role in promoting the ecological security of urban land. However, with the further increase in urbanization level, it will bring a series of problems, such as traffic congestion, environmental pollution, rising land prices, shortage of resources, and so on. The promotion of urbanization will further reduce vegetation cover and increase environmental pollution and noise pollution. At the same time, the process of urbanization further accelerates the development of secondary industry, making the secondary industry become the backbone of economic development. Some disadvantages gradually appear. The development of industry brings about ecological environment pollution, and the increase in population will also increase the pressure on urban land ecology. The bottleneck of resources and environment will become the shackles of the continuous improvement of urbanization rate in the future, which will lead to land ecological security being seriously threatened. Therefore, in the context of urbanization, we should pursue the concept of sustainable development and attach importance to urban land ecological security, for the benefit of future generations.
The improvement of fixed-asset investment, science and technology level, and GDP will promote urban land ecological security, in which the role of fixed-asset investment is the most obvious. Fixed asset investment has a huge role in promoting the economy. It has a significant pulling effect on the development and construction of high-end manufacturing industry, the modern service industry, and infrastructure investment, and has a promoting effect on the transformation of industrial structure and the rapid development of tertiary industry. The optimization and upgrading of industrial structure can reduce the pressure of industry on urban land ecology and increase the investment in infrastructure which can improve the living environment and ecological security of urban residents and promote the ecological security of urban land. With the improvement in science and technology, the treatment of pollutants such as sewage and wastewater will be more thorough, the harm to the environment will be lower, and the utilization rate of polluted waste will be increased. In addition, the improvement of the level of science and technology can promote social progress, improve the quality of labor, enhance the cultural heritage of the region, and further change the mode of economic development, which undoubtedly plays a crucial role in promoting the ecological security of urban land. The growth of GDP will further promote the ecological security of urban land. With the growth of GDP, it will bring about the transformation of industrial structure, green and environmental protection of the tertiary industry will grow, and the state’s attention to environmental protection and investment will also be further enhanced.
The decrease in comprehensive energy consumption per unit of industry will also obviously promote the ecological security of urban land. Energy consumption will not only emit greenhouse gases, but also produce waste gas, wastewater, and waste residue that pollute the environment. With the enhancement of environmental awareness, the comprehensive energy consumption per unit of industry will further decline, promoting the ecological security of urban land.
In addition, the degree of urban land ecological security has a certain inertia, which is affected and restricted by the urban ecological security of the previous year. The main reason is that the urban land ecosystem is a complex system composed of multiple factors, and the factors affecting the urban land ecological security system, such as industrial structure, greening level, economic level and urban governance capacity, have a certain inertia, which is not an obvious change in a short time; therefore, the comprehensive index of urban land ecological security in the previous year has a considerable impact on the urban land ecological security in the current year.
The results of influencing factor analysis tell us that urbanization is a double-edged sword. With the advancement of urbanization, the motivation of regional economic growth by sacrificing the environment may be enhanced, especially for the states (cities) with higher urbanization level; there may be greater problems of urban land ecological security, which requires the provincial government and the state (city) government to adhere to the concept of “lucid waters and lush mountains are invaluable assets” [41]. Instead of sacrificing the ecological environment for economic growth, they should realize more sustainable development on the basis of protecting ecological security.
5. Conclusions
The results show that:
- (1)
- In general, the comprehensive index of urban land ecological security of each state (city) shows an upward trend, but some states and cities fluctuate greatly; most of the states (cities) decreased significantly in 2015 compared with 2014 and increased after 2016. The values of Lijiang, Xishuangbanna and other states (cities) are relatively high, but Zhaotong, Nujiang and Diqing, which are relatively remote from Kunming, have low values;
- (2)
- Land ecological security classification results show that, in 2010, Zhaotong was in the sensitive level, and in 2014, Yuxi was in the sensitive level; by 2019, most of the states (cities) had reached the relatively safe level, and only Wenshan, Kunming, Zhaotong and Nujiang were in the critical safety level. In general, the ecological security of urban land in central Yunnan and southwest Yunnan are generally better, while the ecological security of urban land in southeast, northeast, and northwest Yunnan is generally weak;
- (3)
- The results of influencing factor analysis show that the comprehensive index of urban land ecological security is significantly affected by the previous period, showing obvious inertia; with the improvement of urbanization level, the comprehensive index of urban land ecological security presents an inverted “U” shape, which first rises and then declines; and the improvement of fixed-asset investment level, science and technology level and GDP will significantly promote the urban land ecological security, in which the role of fixed-asset investment is the most obvious. In addition, the decrease in comprehensive energy consumption per unit of industry will also obviously promote the ecological security of urban land.
Author Contributions
Conceptualization, R.Y. and Z.Y.; methodology, Z.Y.; software, R.Y.; validation, R.Y., W.D. and Z.Y.; formal analysis, R.Y., W.D. and Z.Y.; investigation, R.Y. and W.D.; resources, W.D.; data curation, R.Y.; writing—original draft preparation, W.D.; writing—review and editing, Z.Y.; visualization, R.Y.; supervision, R.Y.; project administration, R.Y.; funding acquisition, Z.Y. All authors have read and agreed to the published version of the manuscript.
Funding
Supported by National Natural Science Foundation of China (41261018).
Institutional Review Board Statement
Not applicable.
Informed Consent Statement
Not applicable.
Data Availability Statement
Data available in a publicly accessible repository that does not issue DOIs Publicly available datasets were analyzed in this study. This data can be found here: [http://stats.yn.gov.cn/tjsj/tjnj/, accessed on 16 December 2020].
Conflicts of Interest
The authors declare no conflict of interest.
References
- Westing, A.H. The environmental component of comprehensive security. Secur. Dialogue 1989, 20, 129–134. [Google Scholar] [CrossRef]
- Li, X. What id sustainable development and different theories. Environ. Dev. 2018, 30, 221–222. [Google Scholar]
- Yanitsky, O. The City and Ecology; Nauka: Moskow, Russia, 1987. [Google Scholar]
- Wang, H.; Guo, W.; Cheng, S.; Wang, Q.; Xu, D. National ecological security: Concept, evaluation and countermeasures. Manag. World 2001, 17, 149–156. [Google Scholar]
- Ma, B. Analysis of the reasons for the government expanding environmental responsibility under the ecological security. Carcinogenesis 2005, 26, 1256–1262. [Google Scholar]
- Jogo, W.; Hassan, R. Balancing the use of wetlands for economic well-being and ecological security: The case of the Limpopo wetland in southern Africa. Ecol. Econ. 2010, 69, 1569–1579. [Google Scholar] [CrossRef] [Green Version]
- Dobson, A.P.; Bradshaw, A.D.; Baker, A.Á. Hopes for the future: Restoration. Ecology and conservation biology. Science 1997, 277, 515–522. [Google Scholar] [CrossRef]
- Hurni, H. Assessing sustainable land management (SLM). Agric. Ecosyst. Environ. 2000, 81, 83–92. [Google Scholar] [CrossRef]
- English, J.; Tiffen, M.; Mortimore, M. Land Resource Management in the Machakos District, Kenya, 1930–1990; World Bank Book: Oklahoma City, OK, USA, 1994. [Google Scholar]
- Zuo, W.; Wang, Q.; Wang, W.; Liu, J.; Yang, Y. Study on regional econogical security assessment index and standard. Geogr. Geoinf. Sci. 2002, 18, 67–71. [Google Scholar]
- Xie, H.; Li, B. A study on indices system and assessment criterion of ecological security for city. J. Beijing Norm. Univ. Nat. Sci. 2004, 40, 705–710. [Google Scholar]
- Chen, X.; Zhou, C. Review of the studies on ecological security. Prog. Geogr. 2005, 24, 8–20. [Google Scholar]
- State Council of the People’s Republic of China. National ecological environment protection program. Geoinf. Jiangsu 2001, 26, 152–156. [Google Scholar]
- Yang, Z. On land ecological planning and design. J. Yunnan Univ. Nat. Sci. 2002, 24, 114–124, 129. [Google Scholar]
- Liang, L.; Zhang, Y.; Fang, M. Study on the construction of land-ecological safety system. J. Yunnan Agric. Univ. Nat. Sci. 2005, 20, 81–86. [Google Scholar]
- Zhang, H.; Liu, L.; Zhang, J.; Zhu, Z. A dynamic assessment of ecological security of land resources in Loess Hills Region. Resour. Sci. 2007, 29, 193–200. [Google Scholar]
- Fan, R.; Chen, S.; Dai, F.; Yu, Z. Evaluation of land use eco-security in Fujian Province. J. Fujian Norm. Univ. Nat. Sci. 2010, 26, 97–101, 108. [Google Scholar]
- Zhang, F.; Wang, L.; Su, W. Evaluation of land ecological security in Chongqing based on the matter-element analysis-DPSIR model. China Environ. Sci. 2016, 36, 3126–3134. [Google Scholar]
- Huang, L.; Yang, P. Spatio-temporal evolution characteristics and influencing factors of land ecological security in the Yangtze River economic belt. Resour. Environ. Yangtze Basin 2019, 28, 1780–1790. [Google Scholar]
- Li, M.; Lai, X. Evaluation on ecological security of urban land based on BP Neural Network—A case study of Guangzhou. Econ. Geogr. 2011, 31, 289–293. [Google Scholar]
- Wang, J.; Yuan, W.; Liu, X. Time series evaluation and prediction analysis of urban land ecological security in Harbin City. Arid Land Geogr. 2018, 41, 885–892. [Google Scholar]
- Zhang, C.; Huang, F.; Shang, G. Design and implemantation of the land ecological security warning system. Chin. J. EcoAgric. 2020, 28, 931–944. [Google Scholar]
- Daily, G.C.; Polasky, S.; Goldstein, J.; Kareiva, P.M.; Mooney, H.A.; Pejchar, L.; Ricketts, T.H.; Salzman, J.; Shallenberge, R. Ecosystem services in decision making: Time to deliver. Front. Ecol. Environ. 2007, 7, 21–28. [Google Scholar] [CrossRef] [Green Version]
- Liu, Y.; Cui, N.; Han, R.; Guo, L. Establishing ecological security patterns based on reconstructed ecosystem services value in rapidly urbanizing areas: A case study in Zhuhai City, China. Sustainability 2020, 12, 6629. [Google Scholar] [CrossRef]
- Ouyang, X.; Wang, Z.; Zhu, X. Construction of the ecological security pattern of urban agglomeration under the framework of supply and demand of ecosystem services using bayesian network machine learning: Case study of the Changsha–Zhuzhou–Xiangtan urban agglomeration, China. Sustainability 2019, 11, 6416. [Google Scholar] [CrossRef] [Green Version]
- Takebayashi, H.; Moriyama, M. Surface heat budget on green roof and high reflection roof for mitigation of urban heat island. Build. Environ. 2007, 42, 2971–2979. [Google Scholar] [CrossRef] [Green Version]
- Wyk, A.V.; Berg, J.V.D.; Hamburg, H.V. Selection of non-target Lepidoptera species for ecological risk assessment of Bt maize in South Africa. Afr. Entomol. 2007, 15, 356–366. [Google Scholar]
- Nagorniuk, O. Socio-ecological human security in the environment. Educ. Technol. Comput. Sci. 2011, 2, 337–342. [Google Scholar]
- Mcdonald, M. Security, the Environment and Emancipation: Contestation over Environmental Change; Routledge: London, UK, 2011; pp. 1–240. [Google Scholar]
- Pastier, K.; Gollmann, G. Ecological risk assessment of transgenic plant releases: An Austrian perspective. Biodivers. Conserv. 1999, 8, 1139–1158. [Google Scholar]
- Gardi, C.; Tomaselli, M.; Parisi, V.; Petraglia, A.; Santini, C. Soil quality indicators and biodiversity in northern Italian permanent grasslands. Eur. J. Soil Biol. 2002, 38, 103–110. [Google Scholar] [CrossRef]
- Wen, M.; Zhang, T.; Li, L.; Chen, L.; Hu, S.; Wang, J.; Liu, W.; Zhang, Y.; Yuan, L. Assessment of land ecological security and analysis of influencing factors in Chaohu Lake Basin, China from 1998–2018. Sustainability 2021, 13, 358. [Google Scholar] [CrossRef]
- Tian, Y.; Wang, L. The effect of urban-suburban interaction on urbanization and suburban ecological security: A case study of suburban Wuhan, Central China. Sustainability 2020, 12, 1600. [Google Scholar] [CrossRef] [Green Version]
- Saaty, T.L. A scaling method for priorities in hierarchical structures. J. Math. Psychol. 1977, 15, 234–281. [Google Scholar] [CrossRef]
- Tian, R.; Yang, Z.; Shao, Q. China’s Arable land investment in the "belt and road" region: An empirical study of overseas arable land resources. Sustainability 2020, 12, 97. [Google Scholar] [CrossRef] [Green Version]
- Zhao, D.; Li, F.; Wang, R. Optimization of urban land structure based on ecological green equivalent:A case study in Ningguo City, China. Acta Ecol. Sin. 2011, 31, 6242–6250. [Google Scholar]
- Ma, S.; Wang, R. The social-economic-natural complex ecosystem. Acta Ecol. Sin. 1984, 4, 1–9. [Google Scholar]
- Wang, R.; Ouyang, Z. Social-Economic-Natural complex ecosystem and sustainability. Bull. Chin. Acad. Sci. 2012, 27, 337–345. [Google Scholar]
- Rees, W.E. Ecological footprints and appropriated carrying capa-city: What urban economics leaves out. Environ. Urban 1992, 4, 121–130. [Google Scholar] [CrossRef]
- Nathan, F. Measuring sustainability: Why the ecological foot-print is bad economics and bad environmental science. Ecol. Econ. 2008, 67, 519–525. [Google Scholar]
- Xi, J. Lucid waters and lush mountains are invaluable assets: On vigorously advancing the construction of ecological civilization. People’s Daily, 11 July 2014; p. 12. [Google Scholar]
Figure 1.
Technological roadmap for research.

Figure 2.
Process of weight calculation.

Figure 3.
Process of analysis of influencing factors.

Figure 4.
Change trend of urban land ecological security in Yunnan Province from 2010 to 2018.

Figure 5.
Spatial classification of urban land ecological security in Yunnan Province in 2010, 2014 and 2019. (a) Spatial classification of urban land ecological security in Yunnan Province in 2010; (b) spatial classification of urban land ecological security in Yunnan Province in 2014; (c) spatial classification of urban land ecological security in Yunnan Province in 2019.


Table 1.
Evaluation index system and calculation method of urban land ecological security.
| Target Layer | Index Layer | Computing Method | Attribute | Unit |
|---|---|---|---|---|
| A: Evaluation of urban land ecological security | B1: per capita park green area | total area of park green space/total population | + | m2 |
| B2: green coverage rate of built up area | green coverage area of urban built up area/built up area | + | % | |
| B3: forest coverage rate | total forest area in the region/total land area | + | % | |
| B4: comprehensive utilization rate of industrial solid waste | comprehensive utilization of industrial solid waste/production of industrial solid waste | + | % | |
| B5: urban sewage treatment rate | total amount of urban sewage treatment/total amount of sewage discharge | + | % | |
| B6: average discharge of industrial wastewater | total industrial wastewater discharge/built up area | − | t/hm2 | |
| B7: average discharge of industrial waste gas | total industrial waste gas/built up area | − | m3/hm2 | |
| B8: comprehensive index of air quality | reflects the air quality of major cities in each state, obtained from the Yunnan Statistical Yearbook | − | None |
Table 2.
Index system and calculation method of influencing factors.
| Dimension | Index | Calculation Method or Data Source | Unit |
|---|---|---|---|
| Economics | X1: urbanization rate | obtained from the Yunnan Statistical Yearbook | % |
| X2: investment level of fixed-assets | per capita investment in fixed-assets (excluding farmers) | 10,000 yuan/person | |
| X3: level of science and technology | sum of general budget expenditure on science, technology and education/local financial expenditure | % | |
| X4: GDP in each state (city) | obtained from the Yunnan Statistical Yearbook | billion yuan | |
| Society | X5: urban population density | total urban population/built up area | 10,000 persons/km2 |
| X6: industrial power consumption level | industrial power consumption/built up area | 100 million kW·h/km2 | |
| X7: comprehensive energy consumption level of industry | industrial comprehensive energy consumption/built up area | 10,000 ton/km2 | |
| X8: decline rate of energy consumption per unit GDP | obtained from the Handbook of Yunnan leading cadres | % | |
| X9: proportion of employees in urban secondary industry | number of employees in urban secondary industry units at the end of the year/urban population | % | |
| Geography | X10: topographical conditions | maximum regional altitude/local altitude/2 + maximum regional topographic relief/local topographic relief/2 | — |
| X11: climatic conditions | regional annual average temperature/maximum regional annual average temperature/2 + regional annual precipitation/maximum regional annual precipitation/2 | — | |
| X12: economic density of urban land | output values of secondary industry/built up area | 10,000 yuan/km2 | |
| X13: proportion of industrial land area | industrial land area/built up area | % |
Table 3.
Classification and characteristics of land ecological security.
| Y | Grade | Status | Features |
|---|---|---|---|
| 0 < Y ≤ 0.3 | I | risk level | The land ecological environment is very fragile, the system structure is incomplete, the service function has almost collapsed, the land system has been seriously damaged, the ecological function is difficult to recover after being disturbed, ecological disasters often occur, and the ecological problems are very serious. |
| 0.3 < Y ≤ 0.45 | II | sensitive level | The ecological environment of the land is very poor, the system structure has deteriorated greatly, the service functions are incomplete and the degradation is serious, the land system is greatly damaged, ecological function recovery is difficult after being disturbed, ecological disasters often occur, and the ecological problems are serious. |
| 0.45 < Y ≤ 0.6 | III | critical safety level | The land ecological environment is poor, the system structure has deteriorated, the service function has been degraded, but the basic function can still be maintained, the land system has been damaged to a certain extent, the ecological function could easily deteriorate after being disturbed, and ecological disasters could easily occur. |
| 0.6 < Y ≤ 0.75 | IV | relative safety level | The land ecological environment is better, the system structure is complete, the service function is basically perfect, the land system function is still good (it can be recovered after being disturbed), the possibility of ecological disasters is relatively small, and the sustainable development ability is relatively strong. |
| 0.75 < Y ≤ 1 | V | safety level | The land ecological environment is great, the system structure is complete, the service function is perfect, the land system function is strong (it can be restored after being disturbed), the possibility of ecological disasters is small, and it is able to achieve completely sustainable development. |
Table 4.
Model estimation and test results (the rest are estimated by robust standard error method except the LSDVC model).
Table 4.
Model estimation and test results (the rest are estimated by robust standard error method except the LSDVC model).
| Model Estimation Results | FE-1 | RE-1 | FE-2 | RE-2 | Differential GMM | System GMM | LSDVC-1 | LSDVC-2 |
|---|---|---|---|---|---|---|---|---|
| X1: urbanization rate | 0.01588 *** (3.49) | 0.01253 *** (2.75) | 0.02021 ** (2.64) | 0.01076 ** (2.39) | 0.01573 * (1.85) | 0.01535 ** (2.00) | 0.02013 *** (2.84) | 0.01768 ** (2.32) |
| X12: square term of urbanization rate | −0.00022 *** (−3.73) | −0.00015 *** (−2.84) | −0.00027 *** (−2.93) | −0.00010 ** (−2.39) | −0.00018 (−1.62) | −0.00014 (−1.48) | −0.00027 *** (−2.75) | −0.00025 ** (−2.34) |
| X2: investment level of fixed-assets | 0.00817 *** (3.83) | 0.00749 *** (4.75) | 0.00715 *** (3.14) | 0.00112 (1.20) | 0.00623 ** (2.24) | 0.00264 (0.73) | 0.00672 *** (3.24) | 0.00698 *** (3.09) |
| X3: level of science and technology | 0.00274 ** (2.57) | 0.00268 ** (2.39) | 0.00242 ** (2.88) | 0.00338 *** (3.73) | 0.00052 (0.66) | 0.00107 (0.92) | 0.00258 ** (2.51) | 0.00249 ** (2.34) |
| X4: GDP in each state (city) | 0.00028 * (1.98) | 0.00014 (1.14) | 0.00034 ** (2.13) | −0.00003 (−0.39) | 0.00014 (0.83) | 0.00017 (1.35) | 0.00036 * (1.78) | 0.00036 * (1.68) |
| X5: urban population density | −0.26246 (−1.41) | −0.07113 (−0.61) | −0.25401 (−1.25) | 0.00723 (0.27) | −0.40535 * (−1.84) | 0.12269 (1.07) | −0.20889 (−0.97) | −0.25422 (−1.09) |
| X6: industrial power consumption level | 0.05646 (0.88) | 0.03350 (0.65) | 0.06338 (0.82) | 0.01387 (0.40) | 0.05517 (0.67) | 0.02216 (0.29) | 0.05881 (1.10) | 0.05466 (0.99) |
| X7: comprehensive energy consumption level of industry | −0.00143 (−0.29) | −0.00231 (−0.45) | −0.02166 *** (−2.95) | −0.01168 (−1.44) | −0.03218 *** (−3.25) | −0.03556 *** (-4.14) | −0.02152 ** (−2.33) | −0.02093 ** (−2.17) |
| X8: decline rate of energy consumption per unit GDP | 0.00157 (1.64) | 0.00193 ** (2.17) | 0.00209* (2.04) | 0.00133 (1.32) | 0.00196 * (1.78) | 0.00249 *** (2.77) | 0.00206 * (1.95) | 0.00207 * (1.86) |
| X9: proportion of employees in urban secondary industry | −0.00102 (−0.39) | −0.00123 (−0.49) | 0.00357 (1.14) | 0.00119 (0.81) | 0.01040 *** (3.26) | 0.01230 *** (4.40) | 0.00387 (1.17) | 0.00378 (1.11) |
| X5 × X10: topographic conditions and urban population density | 0.35075 (1.30) | 0.03470 (0.23) | 0.44612 (1.60) | −0.05178 ** (−2.00) | 0.64035 ** (2.16) | −0.18848 (−0.93) | 0.37963 (1.12) | 0.44214 (1.20) |
| X12: economic density of urban land | 0.01319 (0.99) | 0.00318 (0.33) | 0.01302 (1.09) | 0.00704 ** (2.21) | 0.02087 (1.56) | 0.01539 (1.30) | 0.01113 (0.83) | 0.01378 (0.95) |
| X13: proportion of industrial land area | 0.00165 (1.31) | 0.00208 (1.51) | 0.00043 (0.27) | 0.00045 (0.39) | 0.00004 (0.04) | −0.00034 (−0.41) | 0.00025 (0.11) | 0.00017 (0.07) |
| Yt−1: comprehensive index of urban land ecological security in last year | 0.21013 *** (3.92) | 0.71618 *** (6.96) | 0.03763 (0.26) | 0.16159 (1.31) | 0.33830 *** (3.93) | 0.40091 *** (4.63) | ||
| Model Test Results | FE-1 | RE-1 | FE-2 | RE-2 | Differential GMM | System GMM | LSDVC-1 | LSDVC-2 |
| Within R2 | 0.4474 | 0.4285 | 0.4470 | 0.3346 | ||||
| F statistics | 169.64 *** (0.0000) | 186.10 *** (0.0000) | ||||||
| Wald statistics | 1030.76 *** (0.0000) | 4086.32 *** (0.0000) | 798.94 *** (0.0000) | 831.15 *** (0.0000) | ||||
| Hausman test | 40.61 *** (0.0001) | 58.61 *** (0.0000) |
Note: ***, **, * indicate that the original hypothesis was rejected at the significance levels of 1%, 5% and 10%, respectively. In order to save space, the constant term, AIC (Akaike Information Criterion), BIC (Bayesian Information Criterion), log likelihood, and so on are not reported. The estimated results of the model are statistical values in brackets, the estimated results of the random effects model (RE-1 and RE-2 models), differential GMM model, system GMM model, LSDVC-1 model and LSDVC-2 model are Z statistics in brackets, and the estimated results of the fixed effects model (FE-1 and FE-2 models) are t statistics in brackets.
Publisher’s Note: MDPI stays neutral with regard to jurisdictional claims in published maps and institutional affiliations. |
© 2021 by the authors. Licensee MDPI, Basel, Switzerland. This article is an open access article distributed under the terms and conditions of the Creative Commons Attribution (CC BY) license (http://creativecommons.org/licenses/by/4.0/).
Share and Cite
MDPI and ACS Style
Yang, R.; Du, W.; Yang, Z. Spatiotemporal Evolution and Influencing Factors of Urban Land Ecological Security in Yunnan Province. Sustainability 2021, 13, 2936. https://0-doi-org.brum.beds.ac.uk/10.3390/su13052936
AMA Style
Yang R, Du W, Yang Z. Spatiotemporal Evolution and Influencing Factors of Urban Land Ecological Security in Yunnan Province. Sustainability. 2021; 13(5):2936. https://0-doi-org.brum.beds.ac.uk/10.3390/su13052936
Chicago/Turabian StyleYang, Renyi, Wanying Du, and Zisheng Yang. 2021. "Spatiotemporal Evolution and Influencing Factors of Urban Land Ecological Security in Yunnan Province" Sustainability 13, no. 5: 2936. https://0-doi-org.brum.beds.ac.uk/10.3390/su13052936
Note that from the first issue of 2016, this journal uses article numbers instead of page numbers. See further details here.