Article

Using Combined Bus Rapid Transit and Buses in a Dedicated Bus Lane to Enhance Urban Transportation Sustainability

by
Chinnawat Hoonsiri
1,
Siriluk Chiarakorn
1 and
Vasin Kiattikomol
2,*
1
School of Energy, Environment and Materials, King Mongkut’s University of Technology Thonburi, Bangkok 10140, Thailand
2
Department of Civil Engineering, King Mongkut’s University of Technology Thonburi, Bangkok 10140, Thailand
*
Author to whom correspondence should be addressed.
Sustainability 2021, 13(6), 3052; https://0-doi-org.brum.beds.ac.uk/10.3390/su13063052
Submission received: 11 February 2021 / Revised: 8 March 2021 / Accepted: 8 March 2021 / Published: 10 March 2021
(This article belongs to the Special Issue Sustainable Transport Planning and Decision-making)

Abstract

:
Combined bus rapid transit and buses in a dedicated bus lane (CBBD) is a measure that bus rapid transit (BRT) operators implement to reduce overlapping routes between BRT and fixed-route buses. The CBBD measure can combine the passengers of both systems on the same route, which helps increase passenger demand for the BRT, and reduce fuel consumption and emissions from utilizing the exclusive lanes for the combined route. However, the CBBD could affect some bus and BRT passengers in terms of either losing or gaining travel time-saving benefits depending on their travel pattern. This research proposed a methodology to determine the travel distance initiating disadvantage for BRT passengers (DDB) to justify the potential success of the CBBD operations. The number of passengers gaining a benefit from the CBBD was sensitive to the distance between the CBBD stops and the operational period of the CBBD. The CBBD reform would be beneficial to transit agencies to improve the travel time of passengers and be able to promote environmental sustainability for the public transportation system in urban cities.

1. Introduction

Buses are economically competitive for low passenger levels when compared to the rail system. Therefore, the use of a bus-based public transit system has been in favor of both large and small cities [1,2]. However, under pre-coronavirus disease 2019 (COVID-19) conditions, the bus operations in most capital cities experienced considerable travel delays for passengers due to traffic controls, road congestion, bus activities near and at bus stops, etc. [3,4,5]. While breaking-acceleration delay and passenger’s getting on-off delay are common delay types for buses, a significant delay from traffic usually occurs in the a.m. and the p.m. peak hours. Therefore, bus services typically experience uncertainty for travel time and headway, particularly during the rush hours [6,7]. Many metropolitan administrations tried to resolve the delays for buses by introducing bus rapid transit (BRT) systems. A BRT can increase the level of service for passengers by avoiding traffic congestion in mixed-flow lanes and reducing the crowd level at the BRT stops. Therefore, a BRT could be an attractive option that encourages travelers to shift their travel mode choice from private vehicles. Some other indirect benefits of BRTs include a reduction of air pollution in the road network due to a shift from other motorized modes [8,9,10] and the increased value of land and property within 50 m of the BRT terminals [11].
The BRT has been of interest to many cities because it has lower construction costs than elevated trains or subways [12]. Different agencies operate BRT under various environments that could affect the BRT speed, such as, turbo roundabouts, with/without traffic light control, lane change frequency, type and quantity of private vehicles in the BRT lanes, etc., [13,14]. Furthermore, the distance between stops for BRTs and buses varies from country to country, which could result in different operational speeds. In general, the spacing between the BRT stops ranges between 300 and 1800 m, and the average BRT speed is 16–60 km/h [15,16,17] while the spacing between the bus stops ranges between 200 and 500 m [18].
Another challenge for successful BRT operations mainly involves the day-to-day administration of the BRT operators. The system alignments and population density in each area contribute to most of the travel demand [19]. The improved BRT route structure is one of the key success factors for BRT system management. Some BRT operators choose to combine the BRT system with regular buses and operate them in exclusive bus lanes when the two systems have partial or full overlapping routes. The combined bus rapid transit and buses in a dedicated bus lane (CBBD) could reduce the headway of the buses and BRTs, the number of fleets, and energy consumption. The BRT systems in China, Turkey, South Korea, and Colombia, which served approximately 7595–57,654 passengers/km per day, showed significant improvements for their operations after reducing the overlapping routes between BRT and buses [20,21,22,23]. Meanwhile, the BRT system in Bangkok, Thailand, has been operating without the CBBD measure. As a result, the number of Bangkok BRT passengers was as low as 1000 passengers/km per day because it also competed with the regular bus system for passengers in their overlapping routes [24].
The CBBD measure has been widely used as a hybrid system between buses and BRT. It can combine bus and BRT passenger demand in the same route with a shorter distance between stops while still providing travel time-saving benefit from using the BRT lanes. The similar methodology for combining routes or facilities was also conducted for other transportation networks such as bus, container, and airline networks [25,26,27,28]. In [29], the Rama 2 Road in Bangkok is reported to have a reduction of the overlapping of the route between regular buses. Meanwhile in this study, the effect of overlapping route reduction between bus and BRT is discussed. The CBBD implementation would have both positive and negative impacts on passenger’s travel time based on their travel distance. This study aims to identify decision criteria for the CBBD reform by analyzing the travel distance initiating disadvantage for BRT passengers (DDB). The analysis results from this study include 5 parts. The first part is the field data collection survey to analyze the BRT travel time components such as passengers’ getting on-off delay, breaking and acceleration delay, and free-flow travel time as shown in Section 4.1. The second part analyzes the average speed for different BRT stop distances as shown in Section 4.2. The third part illustrates the BRT passenger’s effects with the CBBD reform on Rama 3 Road as shown in Section 4.3. The fourth part illustrates the sensitivity of the distance between BRT stops on the BRT passenger’s effects with the CBBD reform as shown in Section 4.4. This part also exhibits the criteria for choosing the CBBD reform based on passenger’s travel time benefits. The last part illustrates the environmental benefits from the CBBD reform including energy saving and greenhouse gas (GHG) reduction potential as shown in Section 4.5. The analysis procedure of this research is shown in Figure 1.

2. Bus Rapid Transit (BRT) Operations in Bangkok

Bangkok has one BRT route operating on major roads including Ratchadaphisek Road, Rama 3 Road, and Naradhiwas Rajanagarindra Road. The partial BRT route on Rama 3 Road was selected for this research because it operates without intersection delay. Public transportation that serves passengers on Rama 3 Road consists of bus line No. 205 and BRT. The two transit lines have an approximately 7.8 km overlapping section from Chong Nonsi temple to Rama 3 Bridge as shown in Figure 2 [30,31].
The overlapping section between BRT and bus No. 205 on Rama 3 is located in the urban area of Bangkok (Yan Nawa and Bang Kho Laem districts). The population density in Yan Nawa and Bang Kho Laem districts was 4776 and 8276 persons/km2, respectively [32]. Within the overlapping section, the BRT operates in the dedicated lane (lane no. 4) next to the median while bus No. 205 serves as a regular fixed-route transit in mixed-flow lanes (lane no. 1–3). The major differences between bus No. 205 and the BRT are the accessibility and speed of each service type. The spacing between stops for bus No. 205 is 325 m while BRT stops are 1300 m apart from each other. Therefore, passengers have access to bus No. 205 more frequently than the BRT. The average speed of the BRT is higher than the buses because the number of stops for the BRT is less than bus No. 205 and the BRT also operates in the dedicated lane. The problem of the overlapping routes between the BRT and bus No. 205 on Rama 3 Road causes the two systems to compete with each other for passengers. The solution to resolve this problem is to share the BRT lane with the bus to increase lane utilization [33].
This research study illustrates the DDB analysis methodology to develop the decision criteria for choosing the CBBD measure. With the CBBD implementation, all BRT and bus No. 205 passengers must travel with the combined system in the existing BRT lane between Chong Nonsi temple and Rama 3 Bridge. The distance between the BRT stops with the CBBD reform was reduced from 1300 to 325 m and all passengers of bus No. 205 and the BRT could access the modified BRT stops as shown in Figure 3.
The CBBD implementation could affect different passenger groups including bus passengers and BRT passengers who travel for a short or long distance and with or without transferring to connected routes. In this study, all passengers were classified into 2 types, which are the passengers gaining and those losing travel time benefit with the CBBD reform. The analysis for passenger benefit is useful for BRT operators in that they can choose the CBBD when the majority of the passengers would obtain travel time benefit.

3. Methodology

The research procedure was divided into 5 steps.

3.1. Step 1 Analysis of BRT Travel Time Components

Travel time components of the BRT vary with time throughout the day. Private vehicles can travel in the BRT lane during the p.m. peak. During off-peak hours, only the BRT traveled in their dedicated lane without private vehicles, which is similar to normal BRT operation in other countries. To avoid the uncertainty due to traffic congestion during the p.m. peak, the travel time component during the off-peak periods was used to calculate free-flow travel time, get on-off delay, and breaking-acceleration delay.

3.1.1. Total Travel Time

Total travel time is the overall travel time that comprises free-flow travel time, get on-off delay, and breaking-acceleration delay. In this research, 30 samples of the BRT’s travel time on Rama 3 Road (between Chong Nonsi temple and Rama 3 Bridge) were collected from 18 September to 6 December 2018.

3.1.2. Free-Flow Travel Time

Free-flow travel time for the BRT is the travel time excluding get on-off delay and breaking-acceleration delay. Free-flow travel time can be calculated as shown in the equation Tfree-flow = s/vfree-flow, where Tfree-flow is the free-flow travel time (hour), s is the distance between Chong Nonsi temple and Rama 3 Bridge (km), and vfree-flow is the free-flow operational speed (km/h). From the field survey, the maximum speed of the BRT was systematically fixed at 60 km/h for passenger safety as shown in Figure 4.

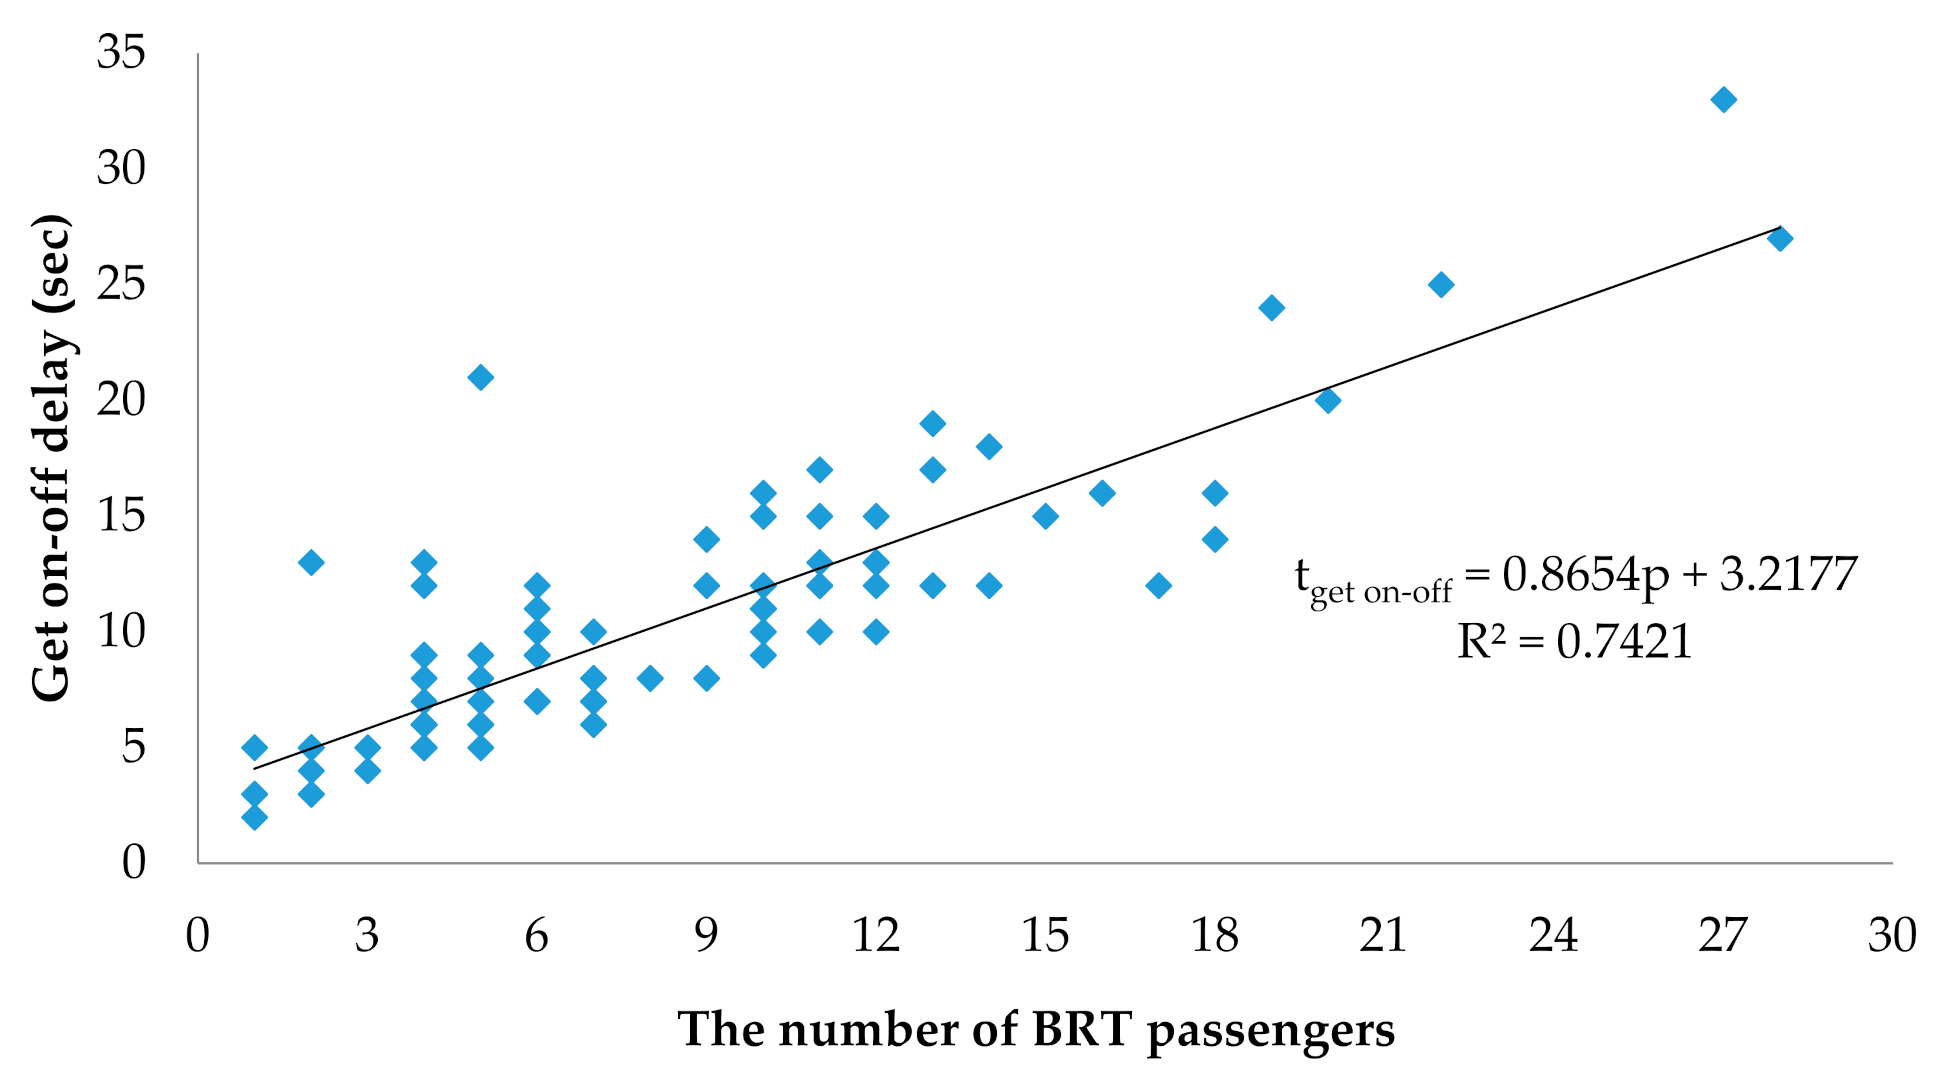
3.1.3. Get On-Off Delay

The Relationship between Get On-Off Delay and the Number of Passengers at BRT Stop

In this study, 97 samples of passenger count at each BRT stop (x-variable) and time spent for getting on-off at the BRT platform (y-variable) were recorded from random BRT stops to analyze their relationship using a simple linear regression as shown in Equation (1).
tget on-off = ap + b; p ≥ 1
  • tget on-off = Get on-off delay (sec)
  • a = Slope of the simple linear regression
  • b = Y-intercept of simple linear regression
  • p = Number of BRT passengers getting on-off at BRT stop (passengers).

Get On-Off Delay Prediction

The time spent for getting on-off at the BRT-platform (Get on-off delay) depends on the number of passengers during each time period. In general, passenger demand during the rush hours (6.00–9.00 a.m. and 5.00–8.00 p.m.) is higher than the off-peak hours (9.00 a.m.–5.00 p.m.) for up to 2–3 times [34,35,36]. In this research, 30 samples of BRT travel demand count at the BRT stops were collected from 18 September to 6 December 2018. The total travel time spent for getting on-off at the BRT platform can be calculated using Equation (2).
Tget on-off = n [a(p/n) + b]; p ≥ 1
where n is the number of BRT stop (parking for passengers), Tget on-off = Overall get on-off delay (sec).

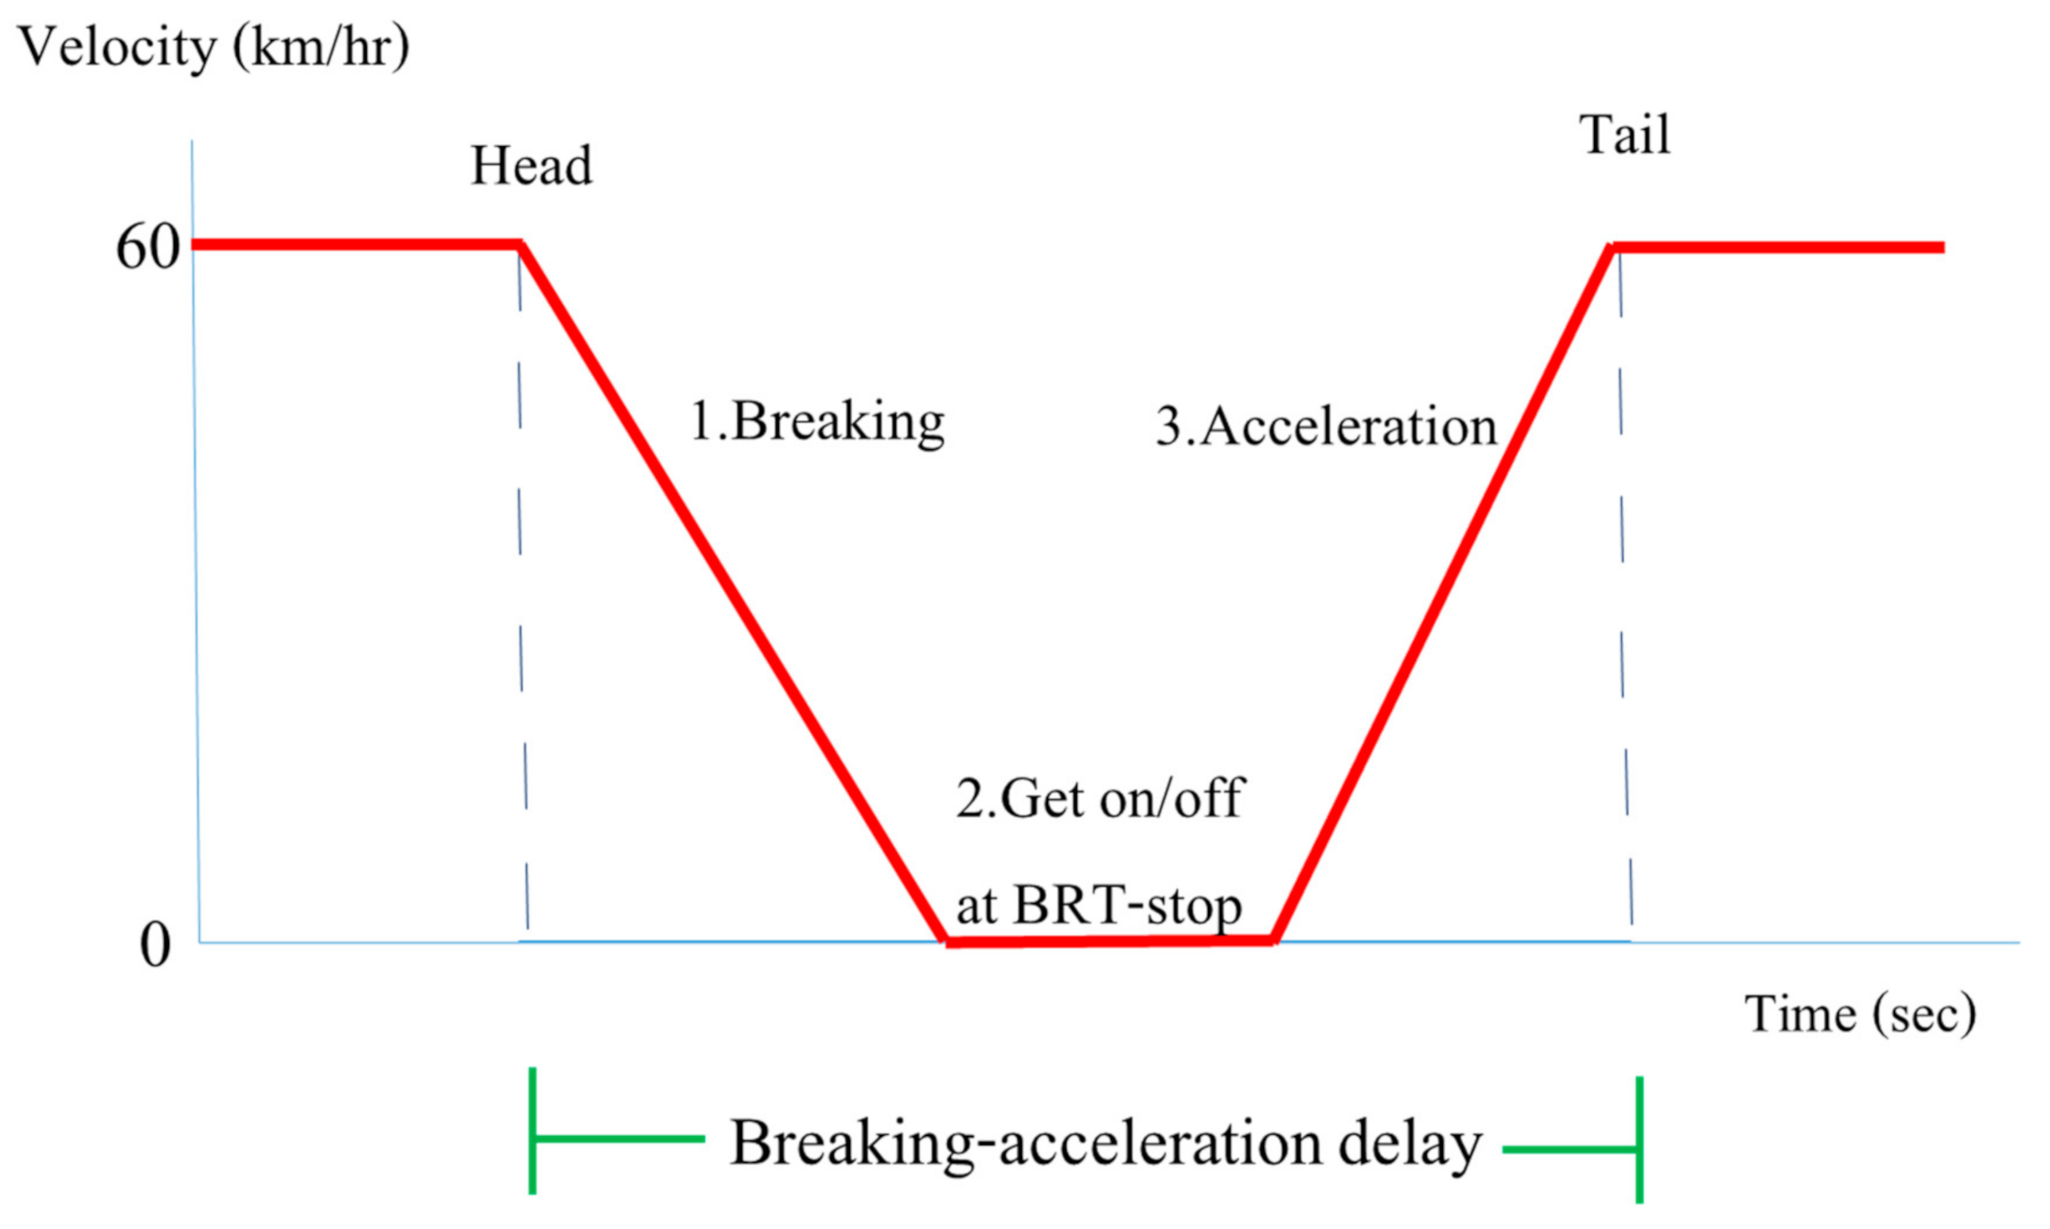
3.1.4. Breaking-Acceleration Delay

The breaking-acceleration delay at the BRT stop is composed of 3 stages. In the first stage, the BRT decelerates from 60 to 0 km/h before parking. In the second stage, the BRT stops, and passengers get on-off at the BRT stop. In the third stage, the BRT accelerates from 0 to 60 km/h to approach the next BRT stop. The detail of the breaking-acceleration delay is shown in Figure 5.
The breaking-acceleration delay is considered as the lost time for the BRT immediately before and after parking at BRT stops. The breaking-acceleration delay is related to other time components as shown in Equation (3).
tbreaking-acceleration = (Ttotal travel time − Tfree-flow − Tget on-off)/n
  • tbreaking-acceleration = Total lost time due to breaking-acceleration activities before and after stops/BRT stop (min)
  • Ttotal travel time = Total travel time of BRT between Chong Nonsi temple and Rama 3 Bridge (min)
  • Tfree-flow = Total free-flow travel time between Chong Nonsi temple and Rama 3 Bridge (min)
  • Tget on-off = Total get on-off delay of passengers between Chong Nonsi temple and Rama 3 Bridge (min)
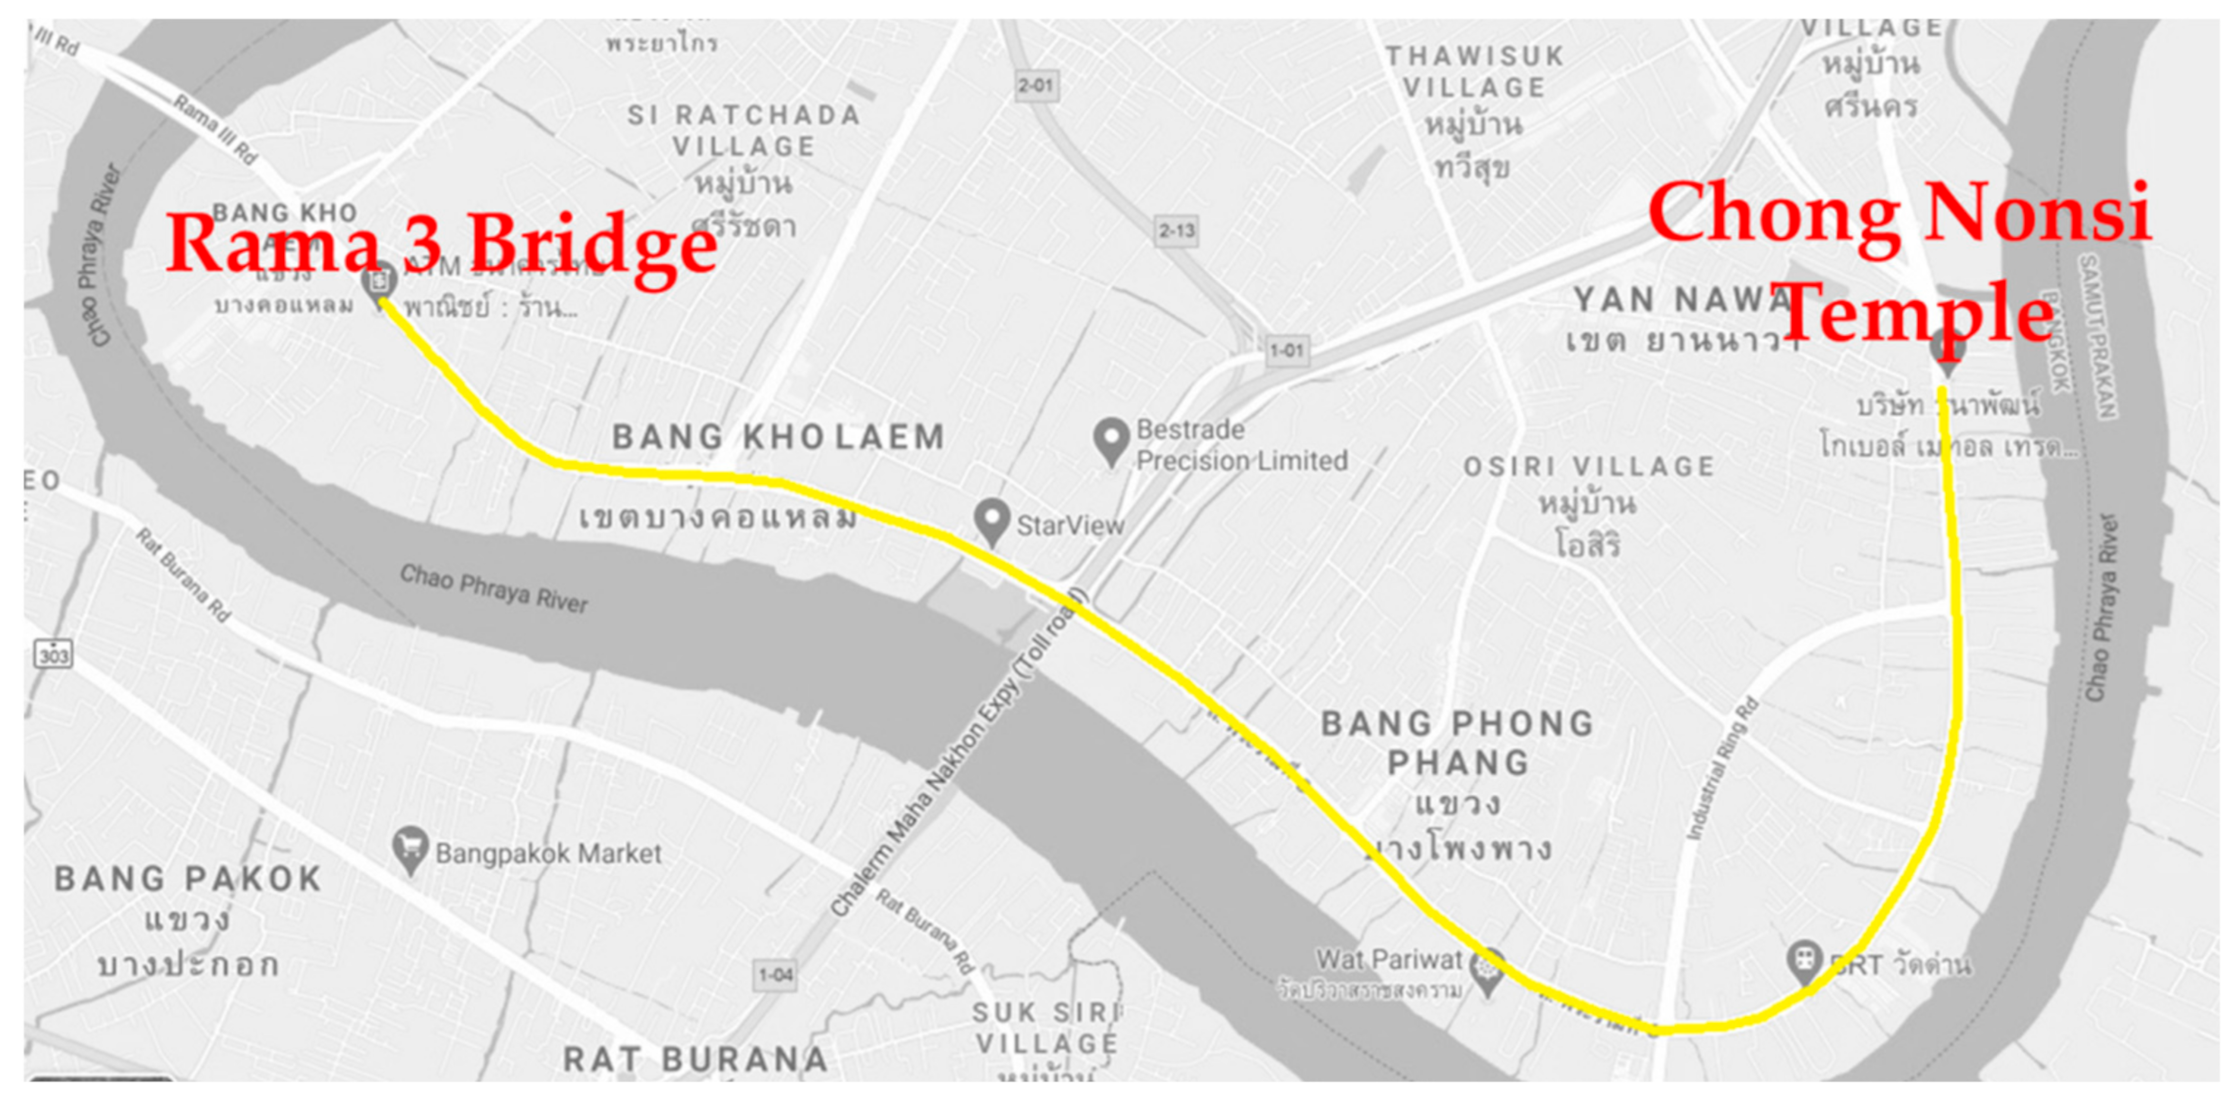
  • n = Number of BRT stops between Chong Nonsi temple and Rama 3 Bridge. There are 6 BRT stops (n = 6) at Rama 3 Bridge, Chareon Rat, Rama 9 Bridge, Wat Dokmai, Wat Parivas, Wat Dan.

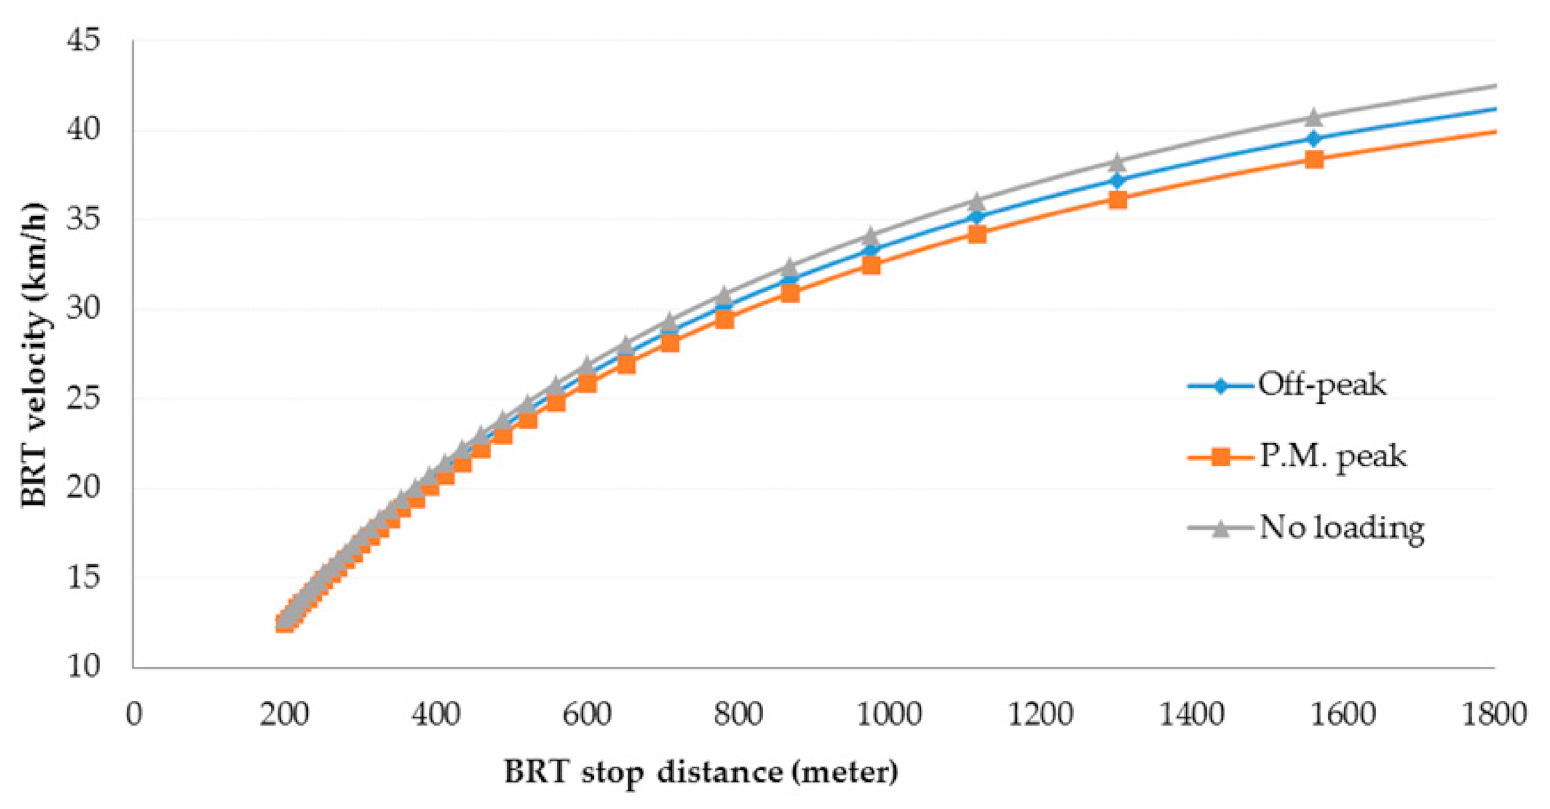
3.2. Step 2 Analysis of Average BRT Speed

In this section, a relationship between BRT speed and its stop distance was exhibited. The effect of BRT stop distance on the speed can be calculated by substituting the variables from step 1 (Tfree-flow, Tbreaking-acceleration, Tget on-off) into Equation (4) as shown below.
V = s/Toverall travel time = s/{Tfree-flow + Tbreaking-acceleration + Tget on-off} or
V = s/{Tfree-flow + ntbreaking-acceleration + n [a(p/n)+b]}; p ≥ 1
  • V = BRT speed (km/h)
  • s = Distance between Chong Nonsi temple and Rama 3 Bridge (7.8 km)
  • Toverall travel time = Overall travel time of BRT passengers (hour)
  • Tbreaking-acceleration = Overall breaking-acceleration delay (hour)

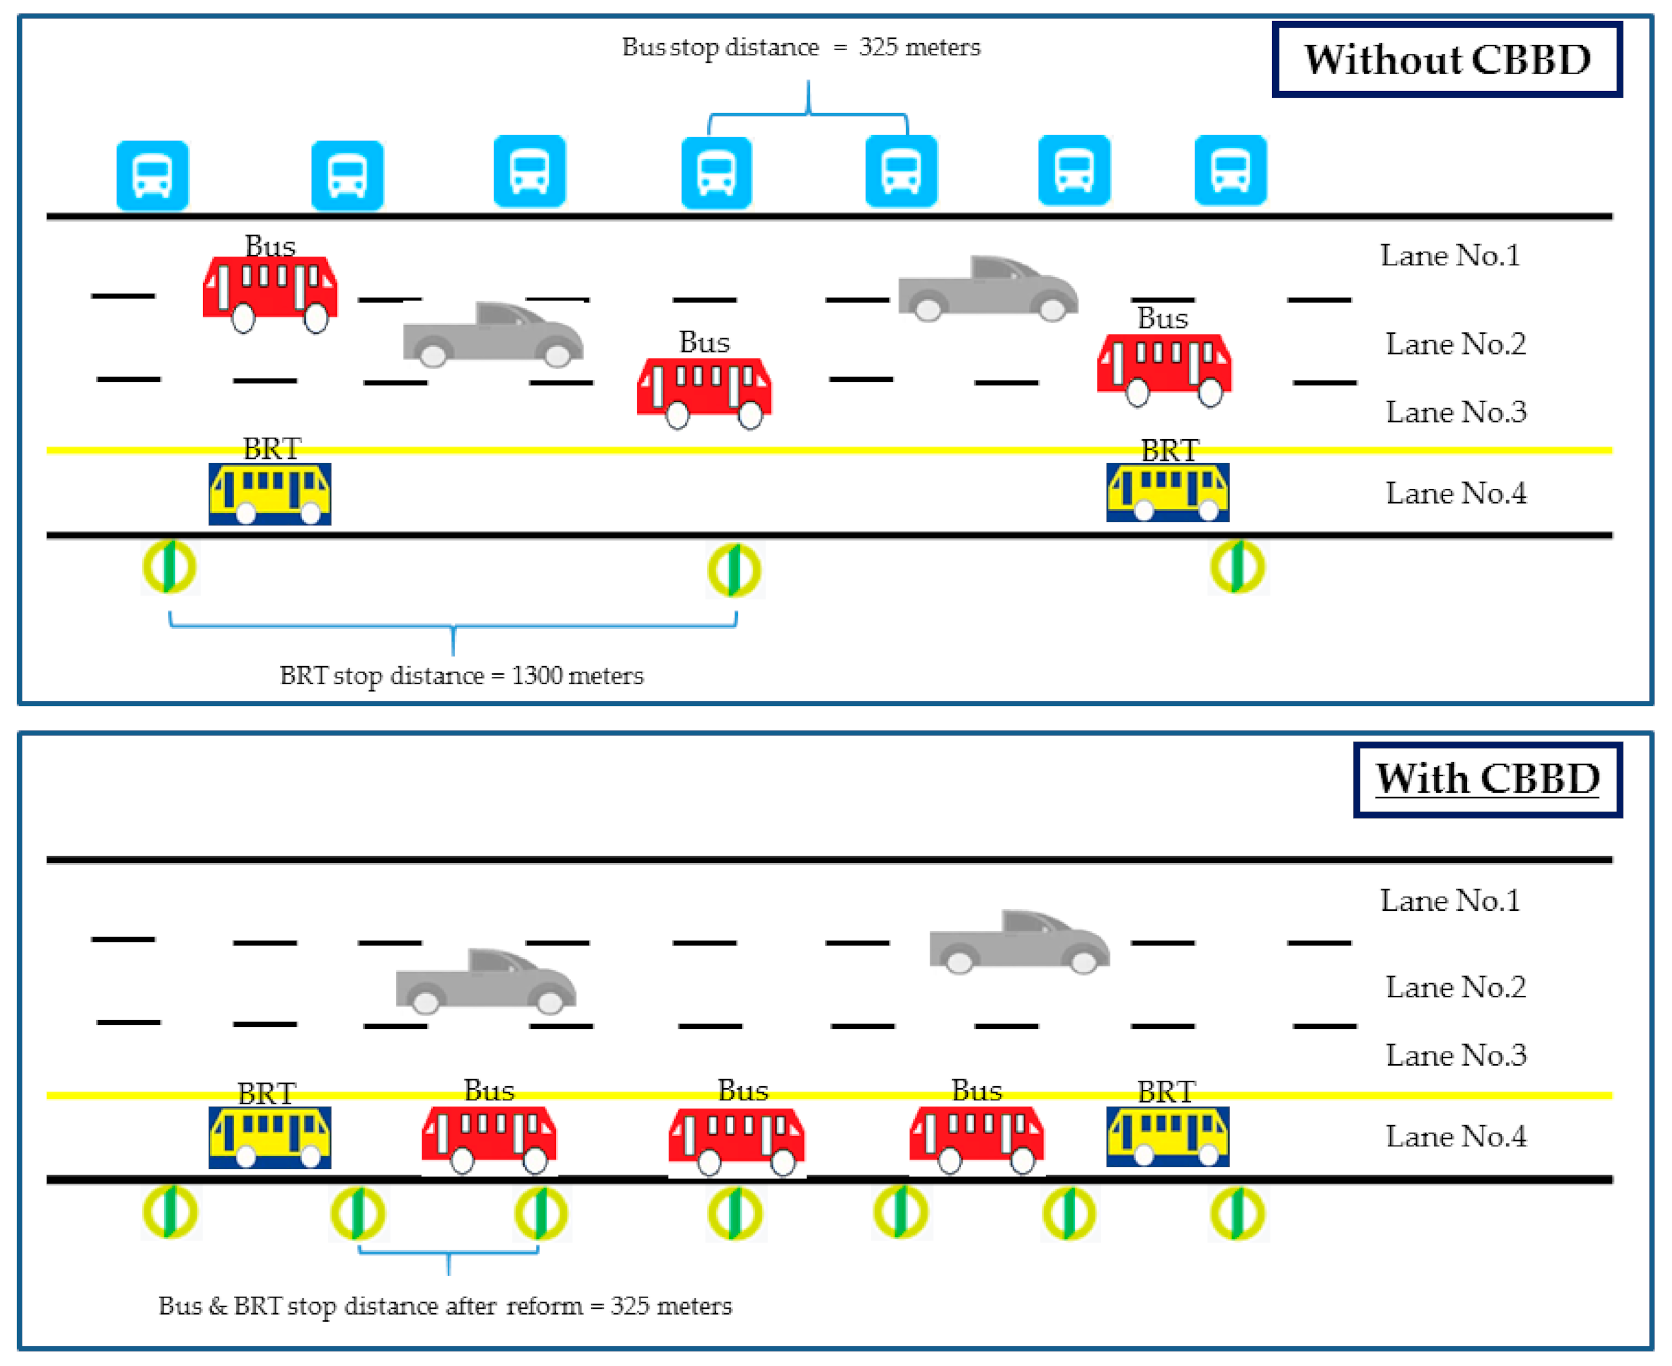
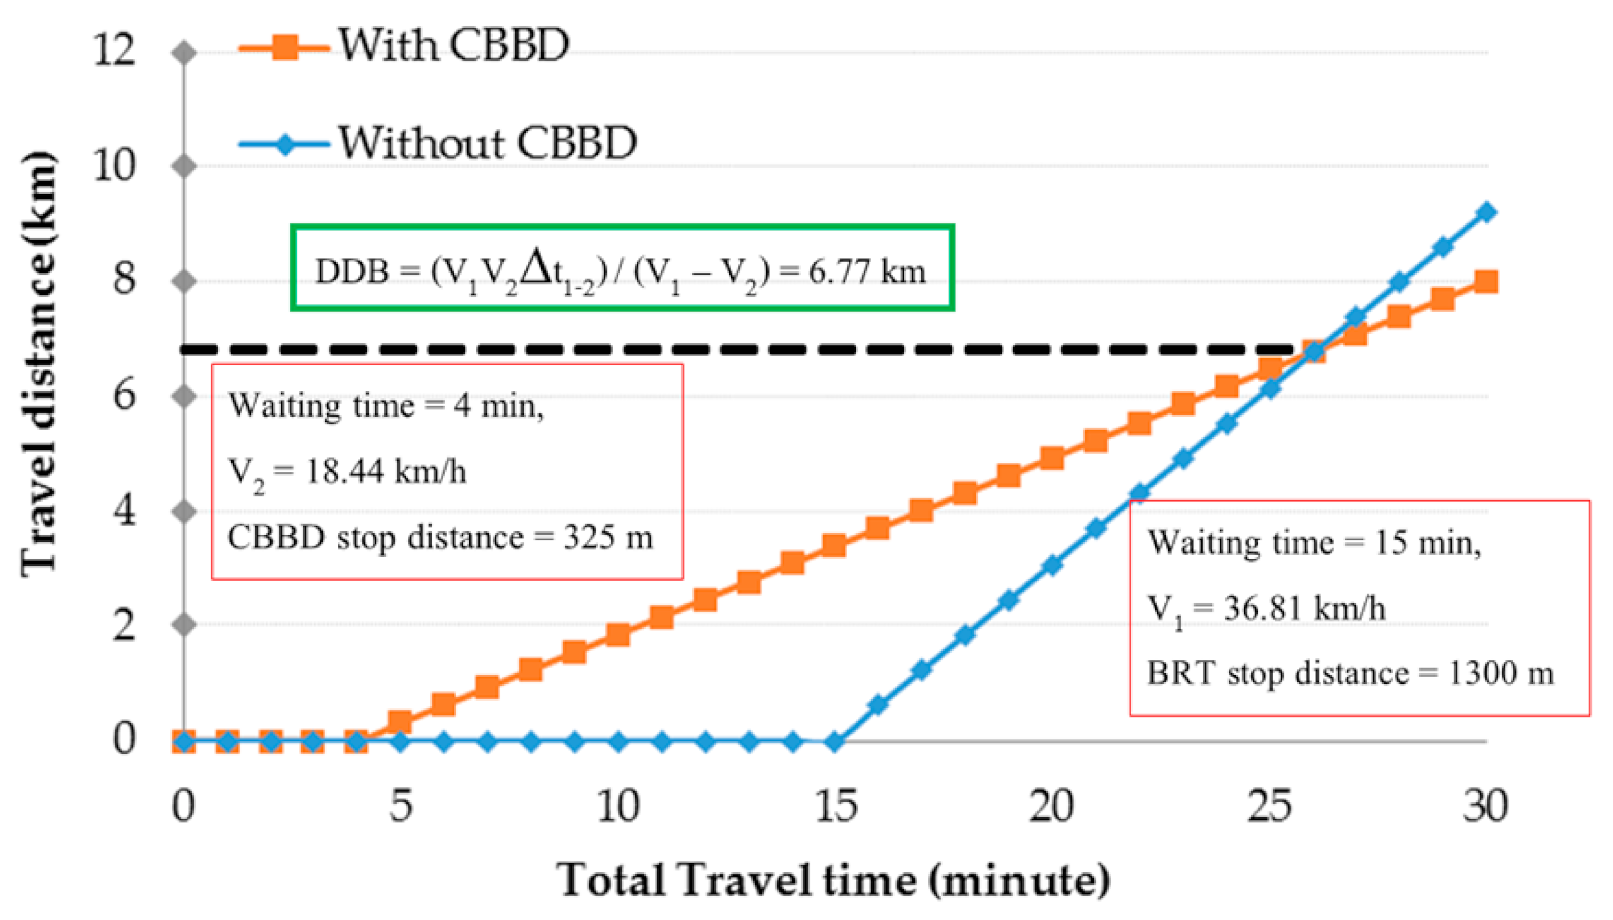
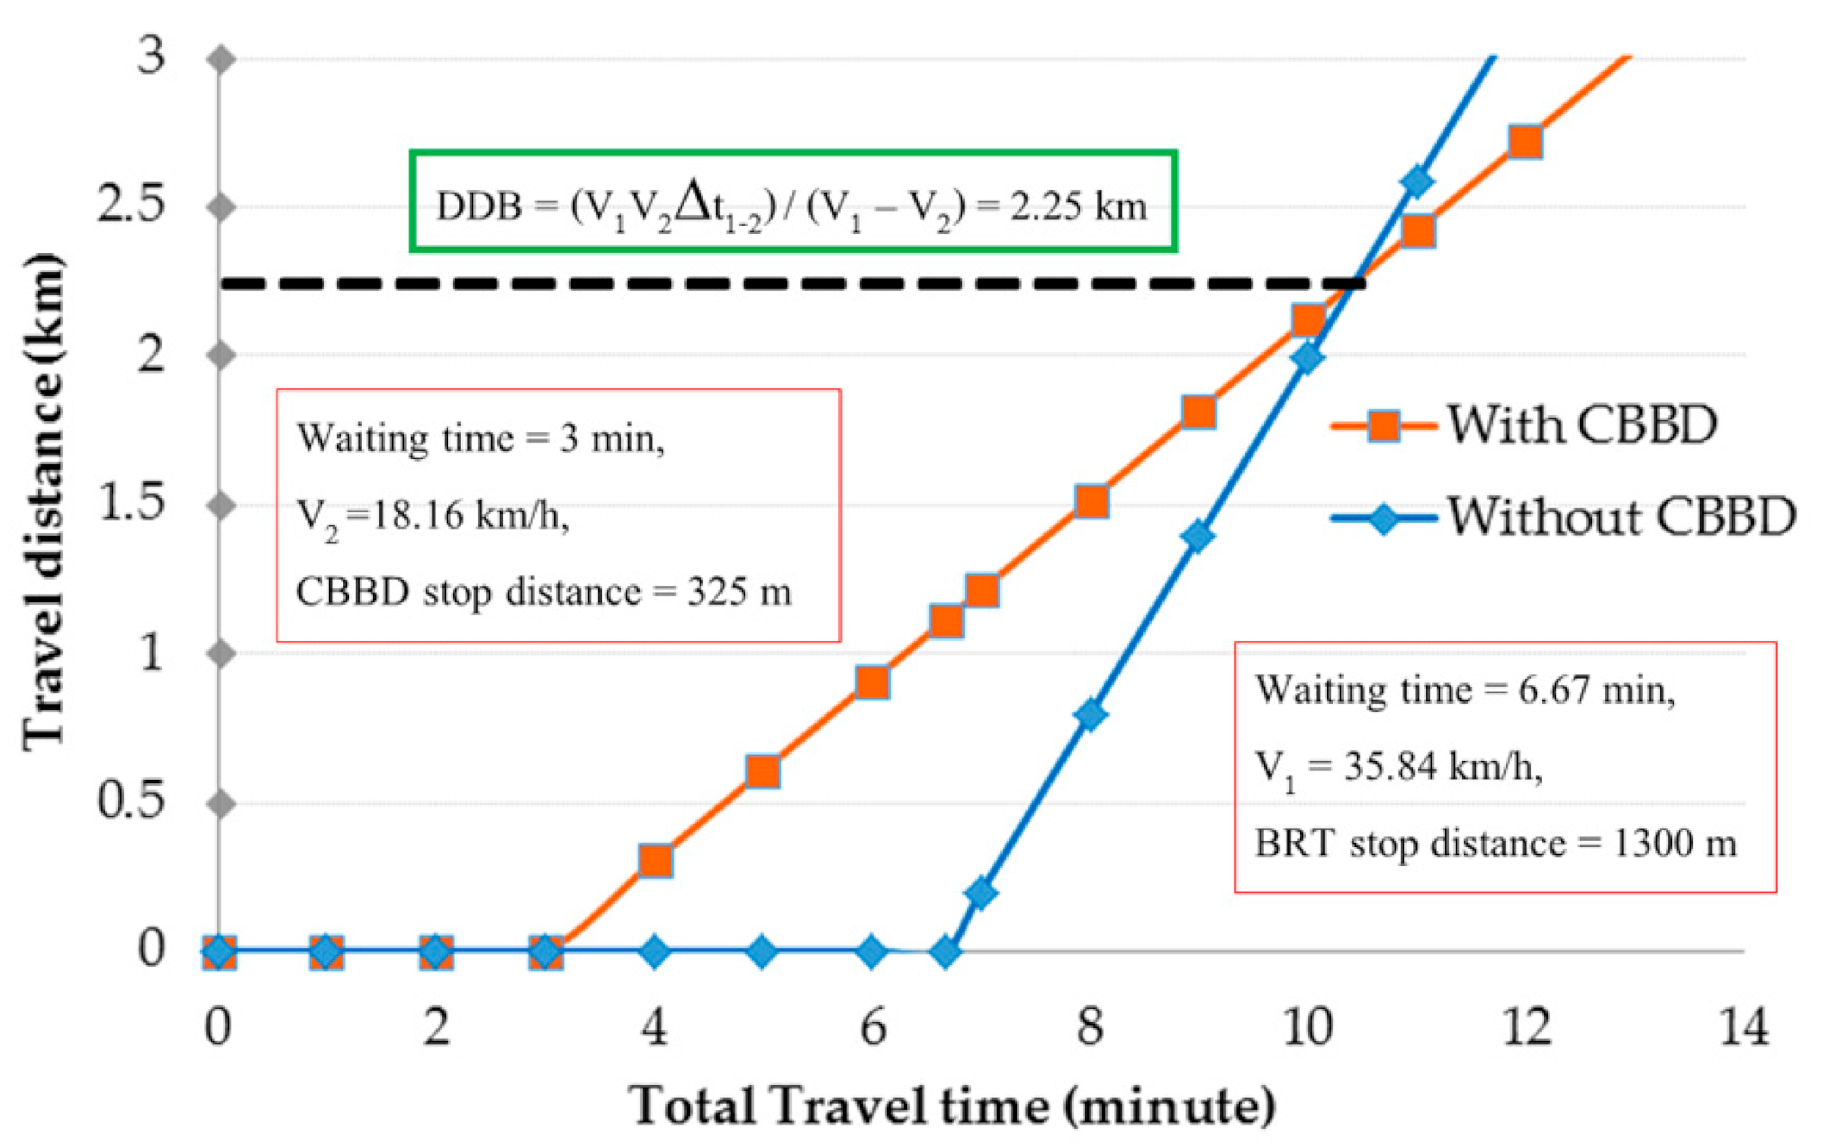
3.3. Step 3 Analysis of BRT Passengers’ Effects for the Combined Bus Rapid Transit and Buses in a Dedicated Bus Lane (CBBD) on Rama 3 Road

The BRT system in Bangkok has a distance between stops of 1300 m. If the BRT operator reduces the distance of the BRT stop to 325 m to be accessible by all BRT and bus passengers, the BRT operator can combine the BRT and bus routes (CBBD), which would lower the waiting time for the BRT passengers. However, the average speed of the BRT would be decreased due to the increasing number of stops. Therefore, the BRT passengers who travel for a long distance will not receive the benefit. The distance initiating disadvantage for BRT passengers (DDB) is the distance that the BRT passengers do not gain and lose the benefit with CBBD reform. The DDB can be evaluated using Equation (5).
DDB = (V1V2∆t1-2)/(V1 − V2)
  • DDB = Distance initiating disadvantage for BRT passengers (km)
  • V1 = BRT speed without the CBBD reform based on the average BRT stop distance of 1300 m (km/h)
  • V2 = BRT speed with the CBBD reform based on the average BRT stop distance of 325 m (km/h)
  • ∆t1-2 = Different waiting times between with and without the CBBD reform (hour)
Another indicator that is able to categorize the passenger group with the CBBD reform is the travel delay of the bus in mixed-flow lanes. The total travel time difference between the off-peak and the p.m. peak was used to estimate the delay on Rama 3 Road. The total travel time data, including 28 trips during the off-peak and 47 trips during the p.m. peak, was collected from 18 September to 6 December 2018.

3.4. Step 4 Sensitivity Analysis for Distance Initiating Disadvantage for BRT Passengers (DDB) Distance

This step illustrates the relationship between the DDB distance and the BRT stop distance without the CBBD reform, which varies between 200 and 1800 m. The BRT speed with the CBBD reform (V2) was calculated based on the modified stop distance with the reform at 200, 300, 400, and 500 m, which is close to the regular bus stop spacing. The BRT speed with (V2) and without (V1) the CBBD reform can be estimated using the analysis results from step 2 in Section 3.2 and the DDB distance can be estimated using Equation (5).

3.5. Step 5 Environmental Benefits

The buses on Rama 3 Road are equipped with diesel engines [37]. If all of them shift to the dedicated lanes with the CBBD reform, the operations under uncongested traffic conditions would improve fuel economy efficiency, which results in less fuel consumption of the bus system [38]. The quantity of fuel consumption reduction with the CBBD operations can be calculated using Equation (6).
A = ND/(FCwithout CBBD − FCwith CBBD)
  • A = Quantity of fuel consumption reduction (liter/time period).
  • N = Number of buses on Rama 3 Road (buses/time period),
  • D = Travel distance from Chong Nonsi temple to Rama 3 Bridge (7.8 km).
  • FCwithout CBBD = Fuel consumption rate of bus without the CBBD reform (km/liter).
  • FCwith CBBD = Fuel consumption rate of bus with the CBBD reform (km/liter).
The total GHG emission reduction depends on the quantity of fuel consumption reduction and emission factors. The relationship between each factor can be calculated using the Tier 1 emission estimation according to the Intergovernmental Panel on Climate Change (IPCC)’s 2006 guidelines E = A × EF [39,40], where E is the total GHG emission reduction (kgCO2/time period), A is the quantity of fuel consumption reduction (liter/time period), and EF is the emission factor (kgCO2/liter) that can be calculated using emission factor per heating value of fuel proportion (kgCO2/TJ) and energy content value (MJ/liter). The emission factor per heating value and energy content of diesel is 74,100 kgCO2/TJ and 36.42 MJ/liter, respectively. As a result, the emission factor of diesel engines is (74,100 kgCO2/TJ) (36.42 MJ/liter) = 2.70 kgCO2/liter of diesel [40,41].

4. Results

4.1. Step 1 Analysis of BRT Travel Time Components

4.1.1. Total Travel Time

From the field survey data, 30 samples of the total travel time between Chong Nonsi temple and Rama 3 Bridge were recorded during the off-peak time. The total travel time along the 7.8 km section was 12.57 min with a range between 11.52–14.04 min and a standard variation of 0.61 min.

4.1.2. Free-Flow Travel Time

For the study section, the distance between Chong Nonsi temple and Rama 3 Bridge was 7.8 km and the observed free-flow speed for the BRT was 60 km/h. Therefore, the free-flow travel time for the study section calculated using the formula Tfree-flow = s/vfree-flow was (7.8 km)/(60 km/h) = 0.13 h or 7.8 min.

4.1.3. Get On-Off Delay

The Relationship between Get On-Off Delay and the Number of Passengers at the BRT Stop

Get on-off delay is directly related to the number of passengers on the BRT platform. As shown in Figure 6, 97 samples of the BRT parking at each BRT stop were recorded for the getting on-off time and the number of passengers. The relationship through least square method between the getting on-off delay at the BRT stops and the number of passengers was tget on-off = 0.8654 p + 3.2177; p ≥ 1, where tget on-off is the getting on-off delay at the BRT stops (sec) and p is the number of passengers getting on-off at the BRT stops (passengers). The coefficient of determination (r2) was equal to 0.7421 (r = 0.86) indicating a strong correlation between the two variables. The variation of getting on-off time depends on personal characteristics such as age, gender, rush, etc. For example, teenagers are likely to walk faster than elderly passengers, women wearing high heels are likely to walk slower than others, etc.

Get On-Off Delay Prediction

According to 30 samples of travel demand count during the off-peak hour, the total number of passengers getting on-off at all 6 BRT stops was 24 passengers or 4 passengers/BRT stop. Therefore, the get on-off delay/BRT stop (tget on-off) was 0.8654 (4) + 3.2177 = 6.68 sec/BRT stop or Tget on-off = 40.08 sec for all 6 stops combined along the study section on Rama 3 Road.

4.1.4. Breaking-Acceleration Delay

The breaking-acceleration delay could be calculated by substituting free-flow travel time, get on-off delay, and total travel time into Equation (3). As a result, the total breaking-acceleration delay for all 6 stops along Rama 3 Road (Tbreaking-acceleration) was 12.57 − 7.80 − 0.67 = 4.10 min. Therefore, breaking-acceleration delay/BRT stop (tbreaking-acceleration) was 4.10/6 = 0.67 min or 41 sec/BRT stop.

4.2. Step 2 Analysis of Average BRT Speed

From the 30 samples of travel demand count, the total number of BRT passengers getting on-off along Rama 3 Road was 24 passengers during the off-peak hours and 49 passengers during the p.m. peak hours. The BRT speed could be calculated by substituting the variable Tfree-flow, Tget on-off, and Tbreaking-acceleration into Equation (4). The procedure to calculate the BRT speed was illustrated in Section 3.2. The relationship between BRT speed (variable VBRT-speed, km/h) and the BRT stop distance (variable DBRT stop, meter) is shown in a logarithm form with R2 > 0.99 as shown in Figure 7. The effective boundary of the BRT stop distance was 200–1800 m. The relationships between the BRT speed and the BRT stop distance during each period are shown in Equations (7)–(9).
P.M. peak hour (overall get on-off passenger = 49 passengers)
VBRT-speed (P.M. peak) = 12.749 ln(DBRT stop) − 55.576; 200 m ≤ DBRT stop ≤ 1800 m
Off-peak hour (overall get on-off passenger = 24 passengers)
VBRT-speed(Off-peak) = 13.253 ln(DBRT stop) − 58.212; 200 m≤ DBRT stop ≤ 1800 m
No passenger loading (overall get on-off passenger = 0 passengers)
VBRT-speed (No loading) = 13.768 ln(DBRT stop) − 60.913; 200 m ≤ DBRT stop ≤ 1800 m

4.3. Step 3 Analysis of BRT Passengers’ Effects for the Combined Bus Rapid Transit and Buses in a Dedicated Bus Lane (CBBD) on Rama 3 Road

From the field survey data, bus and BRT frequency during the off-peak and the p.m. peak periods was in a different setting. As a result, the effects of the CBBD reform on the BRT passengers would be independent depending on the analysis period as shown in Section 4.3.1 and Section 4.3.2.

4.3.1. Off-Peak Hour

The BRT passengers’ travel distance and the total travel time with and without the CBBD reform are illustrated in Figure 8. From the field survey data, the existing BRT frequency without the CBBD reform was 4 buses/hour and the average waiting time for the BRT passengers was 60/4 = 15 min. During normal operations, the BRT could travel at an average speed of 36.81 km/h with the BRT stop distance of 1300 m as estimated in Equation (8). With the reform, if the combined BRT and bus routes operated at the same frequency of 15 buses/hour (BRT frequency = 4 buses/hour and bus frequency = 11 buses/hour), the waiting time for the BRT and the bus passengers would reduce to 60/15 = 4 min. The combined BRT and buses would travel at an average speed of 18.44 km/h with a CBBD stop distance of 325 m as estimated in Equation (8). From the result in Figure 8, the distance initiating disadvantage for BRT passengers (DDB) was 6.77 km.

4.3.2. P.M. Peak Hour

Figure 9 illustrates the travel distance and the total travel time for the BRT passengers with and without the CBBD reform during the p.m. peak hour. From the field survey data, the frequency of the BRT without and with the CBBD reform was 9 and 20 buses/hour, respectively. Therefore, the waiting time for the BRT passengers without and with the CBBD reform was 6.67 and 3 min, respectively. From Equation (7), the BRT speed without and with the CBBD reform was 35.84 and 18.16 km/h, respectively. With the specified conditions, the DDB distance was 2.25 km.
The CBBD reform would affect 4 groups of passengers. Group 1 passengers are all bus passengers. Group 2 is the BRT passengers who travel shorter than the DDB distance and without transferring to connected routes. Group 3 is the BRT passengers who travel longer than the DDB distance. Group 4 is the BRT passengers who transfer to connected routes.
The affected bus passengers (Group 1) from the regular bus system could be divided into 2 groups depending on a transfer requirement. If the bus passengers do not require a transfer to connected routes, the waiting time for bus passengers can be reduced due to more frequent services from the combined routes. Furthermore, they can avoid traffic congestion that mainly contributes to a travel time delay. For the bus passengers who require a transfer to connected routes, they would still get the benefit from traffic delay avoidance but would experience longer waiting time at both routine BRT stop and the stop of the connected route combined. From the field survey data, the total travel time of regular buses in mixed-flow lanes during the rush hours and the off-peak hours was 25.31 and 17.20 min, respectively, for the study section of 7.8 km. This could be calculated for a traffic delay of (25.31 − 17.20 min)/(7.8 km) = 1.04 min/km, which would be considered a direct travel time saving from the CBBD system. From the results in Figure 8 and Figure 9, the waiting time for passengers at the CBBD stop was estimated at 3 min (p.m. peak) and 4 min (off-peak), respectively. This is equivalent to a delay of 0.38–0.51 min/km for passengers transferring to the connected routes. By comparing both types of delay, the traffic delay would be a greater influence on passenger’s travel time than the transferring delay from the connecting routes. Consequently, the bus passengers on the connected routes would still get the travel time saving benefit from the CBBD reform.
The BRT passengers (Group 2) would gain the travel time saving benefit from the CBBD reform because the total waiting time reduction would still be higher than time spent from more frequent passenger loading due to the closer distance between the CBBD stops. On the other hand, Group 3 passengers would lose travel time saving benefit since the waiting time reduction was lower than the increased overall parking time. Group 4 passengers would lose travel time saving benefit due to longer waiting time at both routine and connected route stops, including longer travel time from more frequent stops in the CBBD system.

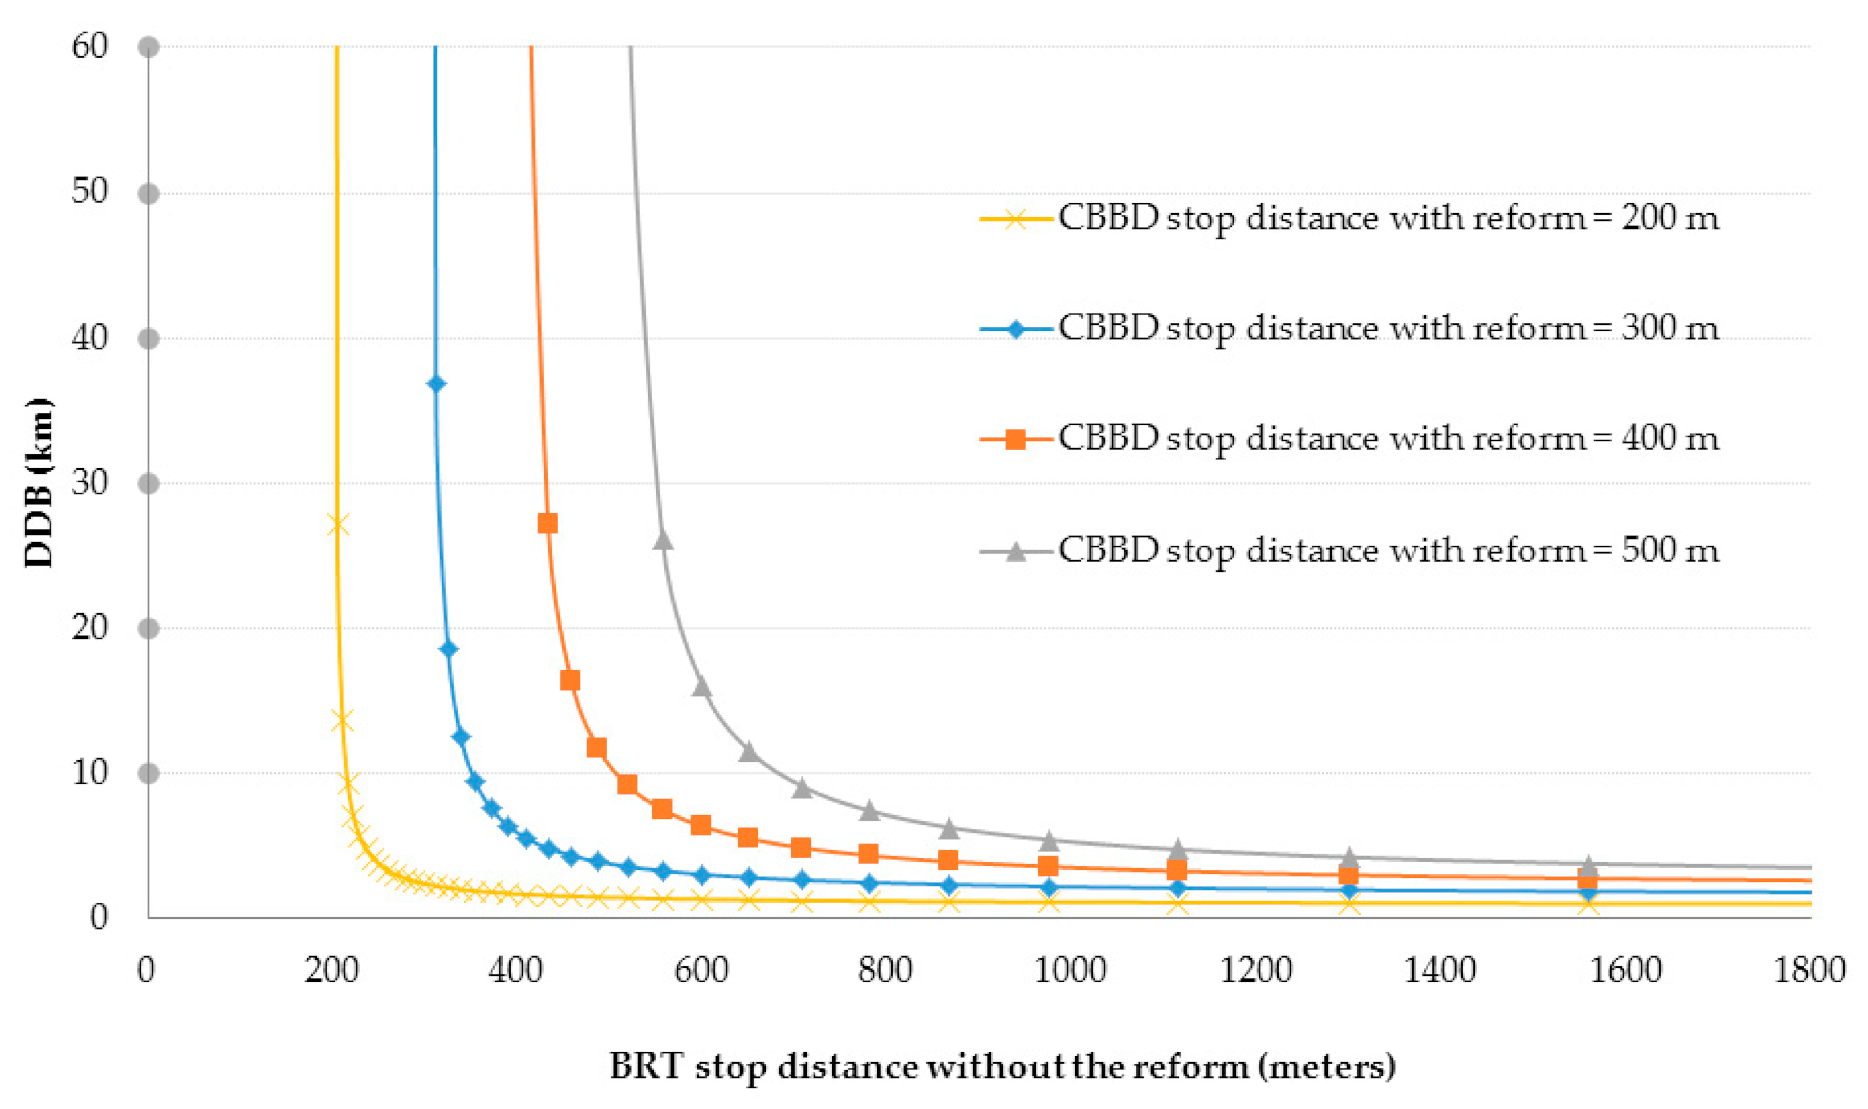
4.4. Step 4 Sensitivity Analysis for DDB

Figure 10 and Figure 11 illustrate the relationship between the DDB values and the BRT stop distance with and without the CBBD reform. The DDB value could be calculated by substituting the waiting time and speed differences between with and without the CBBD reform into Equation (5). The waiting time without the CBBD reform during the p.m. peak hour and off-peak hour was obtained from the survey data for the BRT frequency on Rama 3 Road. The waiting time with the CBBD reform was drawn from the survey data of the BRT and bus frequencies on Rama 3 Road. The BRT speed with and without the reform could be calculated as shown in Equations (7) and (8). BRT speed varies across different BRT operators depending on the BRT stop distance. In this study, The BRT speed with the CBBD reform was calculated for CBBD stop distance of 200, 300, 400, and 500 m by using Equations (7) and (8). The result of the CBBD reform can be divided into 2 conditions depending on the difference of the BRT stop distance with and without the CBBD reform as shown in Section 4.4.1 and Section 4.4.2.

4.4.1. CBBD Stop Distance with the Reform Less Than BRT Stop Distance without the Reform

In the case that the distance between the CBBD stops with the reform is less than the distance between the BRT stops without the reform, the DDB would be low. As a result, all bus passengers and the BRT passengers who travel for a short distance (less than the DDB distance) without transferring to the connected routes (Group 1 and Group 2 passengers) would gain the travel time-saving benefit with the reform. Meanwhile, the BRT passengers who travel longer than the DDB distance and who transfer to the connected routes (Group 3 and Group 4 passengers) would lose the travel time benefit. If BRT operators plan to combine BRT and bus routes using the CBBD reform, they need to know the travel distance of their passengers prior to the implementation. The BRT operators should apply the CBBD reform based on conditions that the number of Group 1 and Group 2 passengers is higher than Group 3 and Group 4 passengers. To apply the CBBD in Bangkok, which has the distance between BRT stops of 1300 m, the distance between the CBBD stops could be adjusted to 200, 300, 400, or 500 m. This would result in getting the DDB distance of 3.27, 6.04, 9.16, and 12.87 km for the off-peak and 1.10, 2.01, 3.03, and 4.25 km for the p.m. peak.

4.4.2. CBBD Stop Distance with the Reform Equal or Proximate to BRT Stop Distance without the Reform
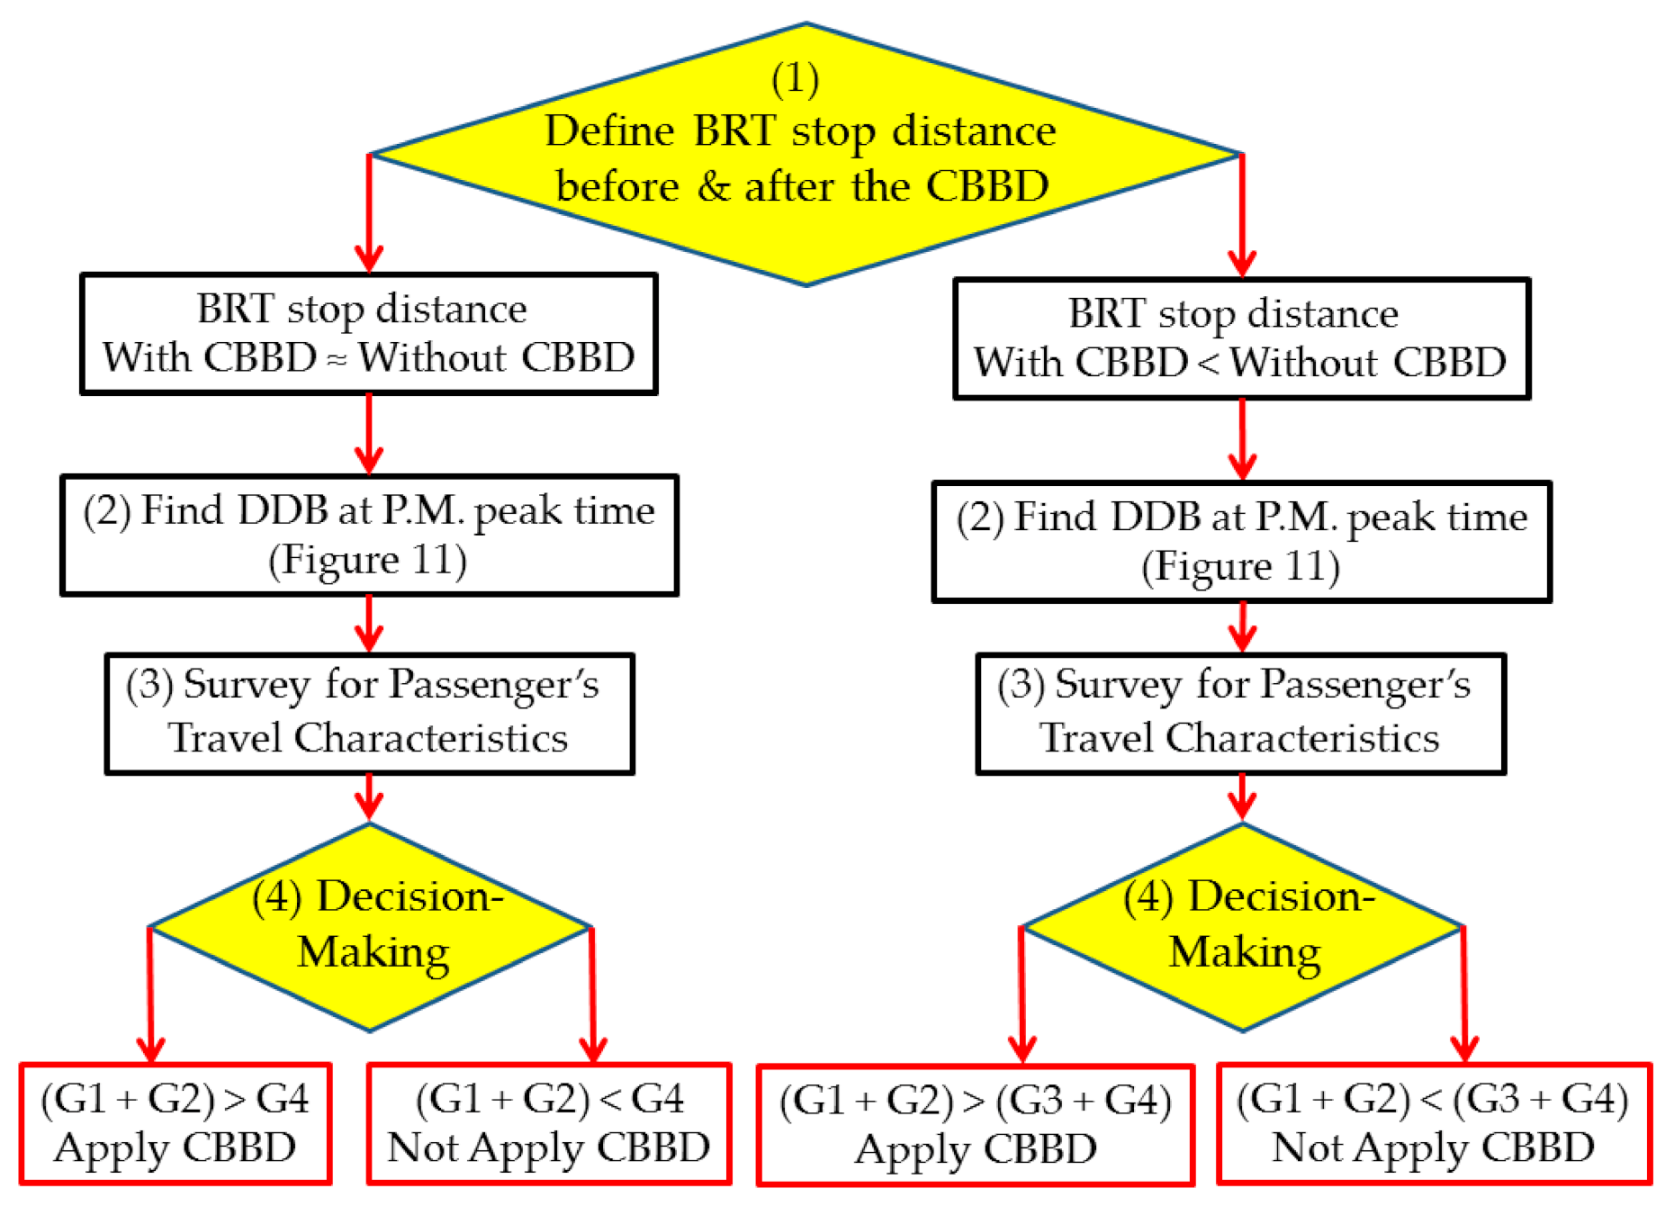
In case that the distance between the CBBD stops distance with the reform and the distance between the BRT stops without the reform is equal or proximate, the DDB would be very high (DDB distance > 20 km). In general, the travel distance of the BRT and bus passengers did not exceed 18 km based on the observations [42], thus, Group 3 passengers were expected to be very small. The CBBD should be applied if the number of Group 1 and 2 passengers is higher than Group 4 passengers.
The comparative results between the BRT stop distance and the DDB distance indicate that the magnitude of the travel time saving benefit would depend on the time of day. The DDB distance for the p.m. peak was lower than that for the off-peak time. As a result, the passengers gaining benefit from the CBBD reform (Group 1 and Group 2 passengers) during the off-peak were higher than those during the p.m. peak. In general, similar operations to the CBBD in other countries would be effective throughout the day across peak and off-peak hours. It would be more conservative for the BRT operators to use the sensitivity analysis results for DDB distance during the p.m. peak (Figure 11) to identify the number of passengers who would gain the travel time benefit from the CBBD operations.
The criteria for applying the CBBD measure depend on the BRT stop distance, the DDB distance, and the number of passengers with connected routes. Figure 12 shows the steps of the determination including:
(1)
Define the BRT stop distance with and without the CBBD reform.
(2)
Find the DDB by using the DDB analysis in Figure 11.
(3)
Survey for passengers’ travel patterns, such as travel distance, travel routes with/without connections, and travel mode.
(4)
Choose the CBBD reform based on the majority of the travel pattern identified in the previous step. BRT operators should apply the CBBD measure when the number of advantaged passengers (Group 1 and Group 2) is greater than the number of disadvantaged passengers (Group 3 and Group 4).

4.5. Environmental Benefits

The advantage of the CBBD reform is not only reducing the travel time of buses but also reducing energy consumption due to higher fuel economy efficiency. For example, the energy consumption rate of the bus was 0.51 L/km under conditions that the average bus speed in the mixed-flow lanes was 18.49 km/h. The energy consumption rate of the bus in the BRT lanes (CBBD operations) was 0.41 L/km with an average bus speed of 27.21 km/h [38]. The assumptions for the evaluation of fuel and GHG reduction were based on 6 conditions including:
(1)
Bus frequency on Rama 3 Road was 11 buses/hour.
(2)
The time period during the p.m. peak (5.00–8.00 p.m.) was 3 h/day.
(3)
Distance from Chong Nonsi temple to Rama 3 Bridge was 7.8 km/trip.
(4)
Annual weekdays were 243 days/year.
(5)
The market price of diesel on 2 February 2021 was 29.56 Thai baht (THB)/liter [43].
(6)
The exchange rate on 2 February 2021 was 30.00 THB/USD [44].
From the analysis results for comparing between with and without the CBBD measure on Rama 3 Road, the fuel cost and GHG reduction with the CBBD reform was 779 USD/km-year and 2135 kgCO2/km-year, respectively. The sustainability analysis with and without the CBBD reform is shown in Table 1.

5. Conclusions

The combined bus rapid transit and buses in a dedicated bus lane (CBBD) is the method that a number of BRT operators use to minimize the travel time of passengers in both systems. The CBBD measure could be beneficial to BRT and bus systems in both direct and indirect ways. The direct benefits of the CBBD are the increase in BRT lane utilization and time saving for bus passengers while the indirect benefits are the energy saving and GHG reduction due to the improved operational speed of the regular buses from using the BRT lanes. However, the analysis results suggest that some passengers who would gain or lose travel time benefit from the CBBD implementation based on their travel distance within the combined route section. The BRT operators should have knowledge of the passenger’s travel pattern and the travel distance initiating disadvantage for BRT passengers (DDB) prior to making a decision on the CBBD reform.
The DDB values used in this research are limited to similar settings for the free-flow speed (maximum allowable BRT speed of 60 km/h), and the frequency (BRT and buses) on the Rama 3 Road section. The DDB could vary when either or all parameters change under different conditions. For example, the CBBD application in higher-density areas such as the central business district would result in more frequent service for the combined BRT and buses than that on Rama 3 Road and thus affect the DDB values. The BRT operators should recalculate the DDB values to decide on the CBBD reform potential.
This research could be useful for the BRT operators to achieve successful operations of the CBBD measure, which could also promote sustainable development of urban public transportation systems in the long term. Further studies could explore opportunities to increase the load factor of the BRT fleets with the CBBD reform using similar methodology to the study on Rama 2 Road [29] to extend the reduction of energy consumption and emissions.

Author Contributions

Conceptualization, V.K. and C.H.; methodology, C.H.; validation, S.C.; formal analysis, C.H.; writing—original draft preparation, C.H.; writing—review and editing, S.C.; supervision, V.K. All authors have read and agreed to the published version of the manuscript.

Funding

This research received no external funding.

Institutional Review Board Statement

Not applicable.

Informed Consent Statement

Not applicable.

Data Availability Statement

Not applicable.

Acknowledgments

The authors would like to acknowledge the Bangkok Metropolitan Administration and Bangkok Mass Transit Authority for sharing research data and permitting the authors to collect research data on their buses.

Conflicts of Interest

The authors declare no conflict of interest.

References

  1. Guo, Q.W.; Chen, S.; Schonfeld, P.; Li, Z. How time-inconsistent preferences affect investment timing for rail transit. Transp. Res. Part B Methodol. 2018, 118, 172–192. [Google Scholar] [CrossRef]
  2. Rizelioğlu, M.; Arslan, T. A comparison of LRT with an imaginary BRT system in performance: Bursa example. Case Stud. Transp. Policy 2020, 8, 135–142. [Google Scholar] [CrossRef]
  3. Nagatani, T. Effect of speedup delay on shuttle bus schedule. Phys. A Stat. Mech. Appl. 2016, 460, 121–130. [Google Scholar] [CrossRef]
  4. Gu, W.; Gayah, V.V.; Cassidy, M.J.; Saade, N. On the impacts of bus stops near signalized intersections: Models of car and bus delays. Transp. Res. Part B Methodol. 2014, 68, 123–140. [Google Scholar] [CrossRef]
  5. Kan, Z.; Tang, L.; Kwan, M.-P.; Ren, C.; Liu, D.; Li, Q. Traffic congestion analysis at the turn level using Taxis’ GPS trajectory data. Comput. Environ. Urban Syst. 2019, 74, 229–243. [Google Scholar] [CrossRef]
  6. Yetiskul, E.; Senbil, M. Public bus transit travel-time variability in Ankara (Turkey). Transp. Policy 2012, 23, 50–59. [Google Scholar] [CrossRef]
  7. Bangkok Mass Transit Authority. Annual Report 2015. Available online: http://www.bmta.co.th/sites/default/files/files/download/annual-report-bmta-2558.pdf (accessed on 25 March 2020).
  8. Bel, G.; Holst, M. Evaluation of the impact of Bus Rapid Transit on air pollution in Mexico City. Transp. Policy 2018, 63, 209–220. [Google Scholar] [CrossRef]
  9. Hensher, D.A.; Li, Z.; Mulley, C. Drivers of bus rapid transit systems—Influences on patronage and service frequency. Res. Transp. Econ. 2014, 48, 159–165. [Google Scholar] [CrossRef]
  10. Manville, M.; Levine, A.S. What motivates public support for public transit? Transp. Res. Part A Policy Pract. 2018, 118, 567–580. [Google Scholar] [CrossRef]
  11. Zhang, M.; Yen, B.T.H. The impact of Bus Rapid Transit (BRT) on land and property values: A meta-analysis. Land Use Policy 2020, 96, 104684. [Google Scholar] [CrossRef]
  12. Hidalgo, D.; Gutiérrez, L. BRT and BHLS around the world: Explosive growth, large positive impacts and many issues outstanding. Res. Transp. Econ. 2013, 39, 8–13. [Google Scholar] [CrossRef]
  13. Campisi, T.; Canale, A.; Tesoriere, G.; Rencelj, M. The newest public transport system applied to turbo roundabouts. Proc. Inst. Civ. Eng. Eng. Sustain. 2020, 173, 315–322. [Google Scholar] [CrossRef]
  14. Campisi, T.; Tesoriere, G.; Canale, A. The variability of Level of Service and Surrogate Safety Assessment of urban turbo-roundabout with BRT system. J. Multidiscip. Eng. Sci. Technol. 2018, 5, 8861–8869. [Google Scholar]
  15. Tirachini, A. The economics and engineering of bus stops: Spacing, design and congestion. Transp. Res. Part A Policy Pract. 2014, 59, 37–57. [Google Scholar] [CrossRef]
  16. Lindau, L.A.; Hidalgo, D.; de Almeida Lobo, A. Barriers to planning and implementing Bus Rapid Transit systems. Res. Transp. Econ. 2014, 48, 9–15. [Google Scholar] [CrossRef]
  17. Hensher, D.; Golob, T. Bus rapid transit systems: A comparative assessment. Transportation 2008, 35, 501–518. [Google Scholar] [CrossRef] [Green Version]
  18. Li, H.; Bertini, R. Optimal Bus Stop Spacing for Minimizing Transit Operation Cost. In Proceedings of the Conference on Traffic and Transportation Studies, ICTTS, Nanning, China, 5–7 August 2008. [Google Scholar]
  19. Arias, J.F.; Bachmann, C. Evaluating the Role and Evolution of Factors Influencing Rapid Transit Planning in Ecuador. Transp. Res. Rec. 2021. [Google Scholar] [CrossRef]
  20. Alpkokin, P.; Ergun, M. Istanbul Metrobüs: First intercontinental bus rapid transit. J. Transp. Geogr. 2012, 24, 58–66. [Google Scholar] [CrossRef]
  21. Jun, M.-J. Redistributive effects of bus rapid transit (BRT) on development patterns and property values in Seoul, Korea. Transp. Policy 2012, 19, 85–92. [Google Scholar] [CrossRef]
  22. Deng, T.; Nelson, J.D. Bus Rapid Transit implementation in Beijing: An evaluation of performance and impacts. Res. Transp. Econ. 2013, 39, 108–113. [Google Scholar] [CrossRef]
  23. Hidalgo, D.; Pereira, L.; Estupiñán, N.; Jiménez, P.L. TransMilenio BRT system in Bogota, high performance and positive impact—Main results of an ex-post evaluation. Res. Transp. Econ. 2013, 39, 133–138. [Google Scholar] [CrossRef]
  24. Wu, I.; Pojani, D. Obstacles to the creation of successful bus rapid transit systems: The case of Bangkok. Res. Transp. Econ. 2016, 60, 44–53. [Google Scholar] [CrossRef]
  25. Verma, A.; Kumari, A.; Tahlyan, D.; Hosapujari, A.B. Development of hub and spoke model for improving operational efficiency of bus transit network of Bangalore city. Case Stud. Transp. Policy 2017, 5, 71–79. [Google Scholar] [CrossRef]
  26. Iris, Ç.; Pacino, D.; Ropke, S.; Larsen, A. Integrated Berth Allocation and Quay Crane Assignment Problem: Set partitioning models and computational results. Transp. Res. Part E Logist. Transp. Rev. 2015, 81, 75–97. [Google Scholar] [CrossRef] [Green Version]
  27. Iris, Ç.; Lalla-Ruiz, E.; Lam, J.S.L.; Voß, S. Mathematical programming formulations for the strategic berth template problem. Comput. Ind. Eng. 2018, 124, 167–179. [Google Scholar] [CrossRef]
  28. Imai, A.; Nishimura, E.; Papadimitriou, S. Berth allocation with service priority. Transp. Res. Part B Methodol. 2003, 37, 437–457. [Google Scholar] [CrossRef] [Green Version]
  29. Hoonsiri, C.; Kiattikomol, V.; Chiarakorn, S. Energy Saving and CO2 Reduction Potential from Partial Bus Routes Reduction Model in Bangkok Urban Fringe. Energies 2020, 13, 5963. [Google Scholar] [CrossRef]
  30. Ministry of Transport. Travel Guide by Ministry of Transport. Available online: https://maps.mot.go.th/doc/motbooklet2559.pdf (accessed on 30 December 2019).
  31. Bangkok Mass Transit Authority. Bus Lines. Available online: http://www.bmta.co.th/th/lines (accessed on 22 June 2019).
  32. The Bangkok Metropolitan Administration. Statistical Profile of Bangkok Metropolitan Administration 2016. Available online: http://203.155.220.230/m.info/bkkstat/stat_2559_eng.pdf (accessed on 15 September 2020).
  33. Yue, Y.; Chen, J.; Yang, Q.; Ye, J. Threshold Determination for Sharing Bus Rapid Transit–Exclusive Lanes with Conventional Buses. Sustainability 2019, 11, 4592. [Google Scholar] [CrossRef] [Green Version]
  34. Liyanage, S.; Dia, H. An Agent-Based Simulation Approach for Evaluating the Performance of On-Demand Bus Services. Sustainability 2020, 12, 4117. [Google Scholar] [CrossRef]
  35. Majumder, S.; De, K.; Kumar, P.; Rayudu, R. A green public transportation system using E-buses: A technical and commercial feasibility study. Sustain. Cities Soc. 2019, 51, 101789. [Google Scholar] [CrossRef]
  36. Ma, J.; Chan, J.; Ristanoski, G.; Rajasegarar, S.; Leckie, C. Bus travel time prediction with real-time traffic information. Transp. Res. Part C Emerg. Technol. 2019, 105, 536–549. [Google Scholar] [CrossRef]
  37. Bangkok Mass Transit Authority. Annual Report 2016. Available online: http://www.bmta.co.th/sites/default/files/files/download/annaual-report-2559.pdf (accessed on 2 March 2021).
  38. The National Academies of Sciences, Engineering, and Medicine. Technologies and Approaches to Reducing the Fuel Consumption of Medium- and Heavy-Duty Vehicles. Available online: https://www.nap.edu/read/12845/chapter/4 (accessed on 2 February 2021).
  39. Friedrich, R.; Reis, S. Emissions of Air Pollutants; Springer: Berlin/Heidelberg, Germany, 2004; pp. 279–281. [Google Scholar]
  40. Intergovernmental Panel on Climate Change. 2006 IPCC Guidelines for National Greenhouse Gas. Inventories. Available online: https://www.ipcc-nggip.iges.or.jp/public/2006gl/pdf/2_Volume2/V2_3_Ch3_Mobile_Combustion.pdf (accessed on 2 February 2021).
  41. Energy Policy and Planning Office. Energy Statistics of Thailand. 2018. Available online: https://drive.google.com/file/d/1WcNsEWr93CmhqQpMJMVbdHRNaQVwr_d4/view (accessed on 2 February 2021).
  42. Cheng, S.; Gao, Q.; Zhang, Y. Evaluating the Impacts of Bus Fare on Social Equity Based on IC Card Data in China. Sustainability 2016, 8, 1032. [Google Scholar] [CrossRef] [Green Version]
  43. Bangchak Corporation Public Company Limited. Historical Retail Oil Prices. Available online: https://www.bangchak.co.th/th/oilprice/historical (accessed on 2 February 2021).
  44. Exchange Rates Organization. US Dollars (USD) to Thai Baht (THB) Exchange Rate for 2 February 2021. Available online: https://www.exchange-rates.org/Rate/USD/THB/2-2-2021 (accessed on 2 February 2021).
Figure 1. Research procedure.
Sustainability 13 03052 g001
Figure 2. Overlapping section of bus No.205 and bus rapid transit (BRT) routes between Chong Nonsi Temple and Rama 3 Bridge (Adapted from Google Map, 2020).
Sustainability 13 03052 g002
Figure 3. Bus rapid transit (BRT) and bus operational structure with and without the Combined bus rapid transit and buses in a dedicated bus lane (CBBD) between Chong Nonsi temple and Rama 3 Bridge.
Sustainability 13 03052 g003
Figure 4. Speed limit for Bangkok BRT.
Sustainability 13 03052 g004
Figure 5. Characteristics of getting on-off delay and breaking-acceleration delay.
Sustainability 13 03052 g005
Figure 6. The relationship between getting on-off delay and the number of passengers at BRT stops.
Sustainability 13 03052 g006
Figure 7. The relationship between BRT speed and BRT stop distance.
Sustainability 13 03052 g007
Figure 8. BRT Passenger effects from the combined bus rapid transit and buses in a dedicated bus lane (CBBD) model during the off-peak time.
Sustainability 13 03052 g008
Figure 9. BRT Passenger effects from the CBBD model during the p.m. peak hour.
Sustainability 13 03052 g009
Figure 10. Relationship between BRT stop distance adjustment and the travel distance initiating disadvantage for BRT passengers (DDB) during the off-peak hour.
Sustainability 13 03052 g010
Figure 11. Relationship between BRT stop distance adjustment and the distance initiating disadvantage for BRT passengers (DDB) during the p.m. peak hour.
Sustainability 13 03052 g011
Figure 12. The analysis steps for determining a number of advantage/disadvantage passengers from the CBBD implementation.
Sustainability 13 03052 g012
Table 1. Energy saving and greenhouse gas (GHG) reduction potential for the CBBD measure on Rama 3 Road.
Analysis DataBuses in Mixed-Flow Lanes
(without CBBD)
Buses in BRT Lanes
(with CBBD)
% Saving Potential
Total travel time from Chong Nonsi temple to Rama 3 Bridge (min)25.3117.2032.04
Speed (km/h)18.4927.2147.16
Energy consumption rate (liter/km)0.510.4119.61
Annual energy consumption (liters/year)31,96725,79819.30
Annual GHG emission (kgCO2/km-year)11,065893019.30
Fuel cost (USD/year)31,49825,41919.30
Fuel cost (USD/km-year)4038325919.30
Publisher’s Note: MDPI stays neutral with regard to jurisdictional claims in published maps and institutional affiliations.

