Article

Pollen and Fungal Spores Evaluation in Relation to Occupants and Microclimate in Indoor Workplaces

by
Maria Concetta D’Ovidio
*,
Simona Di Renzi
,
Pasquale Capone
and
Armando Pelliccioni
Department of Occupational and Environmental Medicine, Epidemiology and Hygiene, Italian Workers’ Compensation Authority (INAIL), Monte Porzio Catone, 00078 Rome, Italy
*
Author to whom correspondence should be addressed.
Sustainability 2021, 13(6), 3154; https://0-doi-org.brum.beds.ac.uk/10.3390/su13063154
Submission received: 8 February 2021 / Revised: 5 March 2021 / Accepted: 9 March 2021 / Published: 13 March 2021

Abstract

:
Indoor air quality depends on many internal or external factors mutually interacting in a dynamic and complex system, which also includes indoor workplaces, where subjects are exposed to many pollutants, including biocontaminants such as pollen and fungal spores. In this context, the occupants interact actively with their environment through actions, modifying indoor environmental conditions to achieve their own thermal comfort. Actions such as opening/closing doors and windows and turning on/off air conditioning could have effects on workers’ health. The present study explored the contribution of human occupants to pollen and fungal spore levels in indoor workplaces, combining aerobiological, microclimate, and worker monitoring during summer and winter campaigns. We evaluated the overall time spent by the workers in the office, the workers’ actions regarding non-working days and working days, and non-working hours and working hours, during two campaigns of pollen and fungal spore monitoring. Our results showed that the biocontaminant values depend on many mutually interacting factors; hence, the role of all of the factors involved should be investigated. In this regard, aerobiological monitoring should be a valid tool for the management of occupational allergies, providing additional information to improve occupational health protection strategies.

1. Introduction

Indoor and outdoor settings may facilitate the development of several allergies in sensitized individuals. In particular, air pollution and urbanization, in association with genetic factors and changes in lifestyles, tend to increase the occurrence and/or severity of the clinical features of allergy-related conditions such as asthma, rhinitis, conjunctivitis, and dermatitis [1,2,3,4]. Several health effects could be due to exposure to numerous biocontaminants such as bacteria, viruses, fungi, molds, and pollen. These exposures, acting in combination with the microbiome, may affect allergic disease outcomes, underlining the relationships between the environment, microrganisms, and workers in indoor environments. These interactions ar complex, as they include airborne transmission and the occupants as vehicles both for the spread of internal biocontaminants through aerosols, and external biocontaminants through walking, clothes, and hair [5,6,7,8]. In addition, the exchanges between indoor and outdoor air contribute to the modification of the levels of biocontamination in indoor environments, and consequently the outcome of allergic diseases [8,9,10]. The presence of biogenic particles in the atmosphere may cause several communicable and noncomunicable diseases [11,12], and the risk depends on both the exposure levels and the sensitization of the subjects involved.
The level of exposure to biological agents is peculiar, and has been of interest since 1861, when Louis Pasteur reported the first measurements of airborne microrganisms in the Journal Annales des Sciences Naturelles [13]. Since the interest is constantly increased and, in recent years, many biocontaminants have also been included in occupational settings with the development of new methodologies [14,15]. Allergic diseases arising from exposure to pollen and molds may impair the quality of life as well as working performance [16], confirming the need to set appropriate control measures and stressing the importance of the application of more standardized methodologies in the topic of aerosol-borne allergies [11].
Indoor microrganisms, their fragments, and products deriving from vegetable and animal sources are the main biological contaminants. Mechanisms such as aerosolization and dispersion, modulated by microclimate conditions, may increase the spread of the bioparticles and their derivatives, with a resulting increase of the potential health risk, especially for indoor workers [14,17,18]. Meteorological factors, seasonality, room characteristics, scheme ventilation, the presence of occupants and their actions, such as turning on/off air conditioning and opening/closing doors and windows in order to improve their thermal comfort and air quality, produce different and even opposite effects, such as decreasing the psychological stress and increasing the occurrence of adverse health outcomes on workers; all of these are variables that have an influence on indoor biocontaminant levels [19,20,21,22,23,24,25].
The exposure to biocontaminants in indoor workplaces has been investigated in office settings regarding the so-called ‘sick building syndrome’, and building-related illnesses [26,27,28] are associated with potential exposure to bacteria, viruses, fungi, molds, pollen, insects, microbial metabolites, and animal and plant debris [29,30]. Exposure to biocontaminants in general, and to allergens in particular, produces different health effects based on individual immunological conditions and the physical properties of the biocontaminants involved, such as diameter or size distribution. In fact, particles of 10–100 µm in diameter are mainly found in the nasopharyngeal region, particles of 5–10 µm can settle in the upper respiratory tract, and particles ≤5 µm are able to reach the lower respiratory tract, including the bronchiolar and alveolar region, with more serious consequences for allergy diseases [31,32,33].
A peculiar role should be attributed to occupants that interact with the environment through actions modifying indoor environmental conditions. They play an active role in achieving their own thermal and physiological comfort, as described in an adaptive model of comfort [19]. Human thermal comfort is a psychological condition expressing satisfaction with the thermal environment [34]. Thermal comfort depends on multiple factors, involving physical parameters such as air temperature (Tair), relative humidity (RH), and wind speed (WS), and individual features such as health status, clothing, physical activity, and the type of job [20]. Occupants respond in different ways to external or internal stimulations in order to restore or improve their thermal comfort and indoor air quality [35].
For instance, behavioral adjustments modifying the body’s thermal balance are classified into personal (change in clothing), technological (turning on/off air conditioning, opening/closing doors and windows) and cultural responses (recovery during the working day) [19]. All of these actions could produce adverse effects. In fact, in addition to occupant satisfaction, higher levels of outdoor pollutants infiltrating indoors may occur [20]. Humans carry biocontaminants (bacteria, pollen, and fungal spores) by means of their skin, footwear, and clothes, which are then resuspended in the indoor air particulate matter from floors and other surfaces [21,36]. Biocontaminants are strongly affected by indoor sources, including the presence, movements, and activities of the occupants. In particular, factors such as the outdoor temperature, air-exchange rate, ventilation system, frequency and methods of cleaning operations, and number and activity of the occupants are key determinants of the indoor concentration of biocontaminants such as pollen and fungal spores [25].
In this paper, airborne pollen and fungal spores were monitored in two field campaigns, during winter and summer, in relation to the microclimate and occupant monitoring in indoor workplaces in the context of the ‘Integrated Evaluation of Indoor Particulate Matter (VIEPI) Project: Study Design, Results and Open Questions’ [37]. Meteorological variables, the occupants’ presence, and their actions were evaluated with regard to pollen and fungal spores based on standardized and experimental procedures that should be useful to the management of occupational allergic diseases [38]. We evaluated the time spent by the workers in the office, and the opening/closing of doors/windows with respect to the non-working days (NWDs) and working days (WDs), non-working hours (NWHs), and working hours (WHs), and ran winter and summer campaigns regarding biocontaminant values in order to improve the control and preventive measures regarding the risk of occupational allergy.

2. Materials and Methods

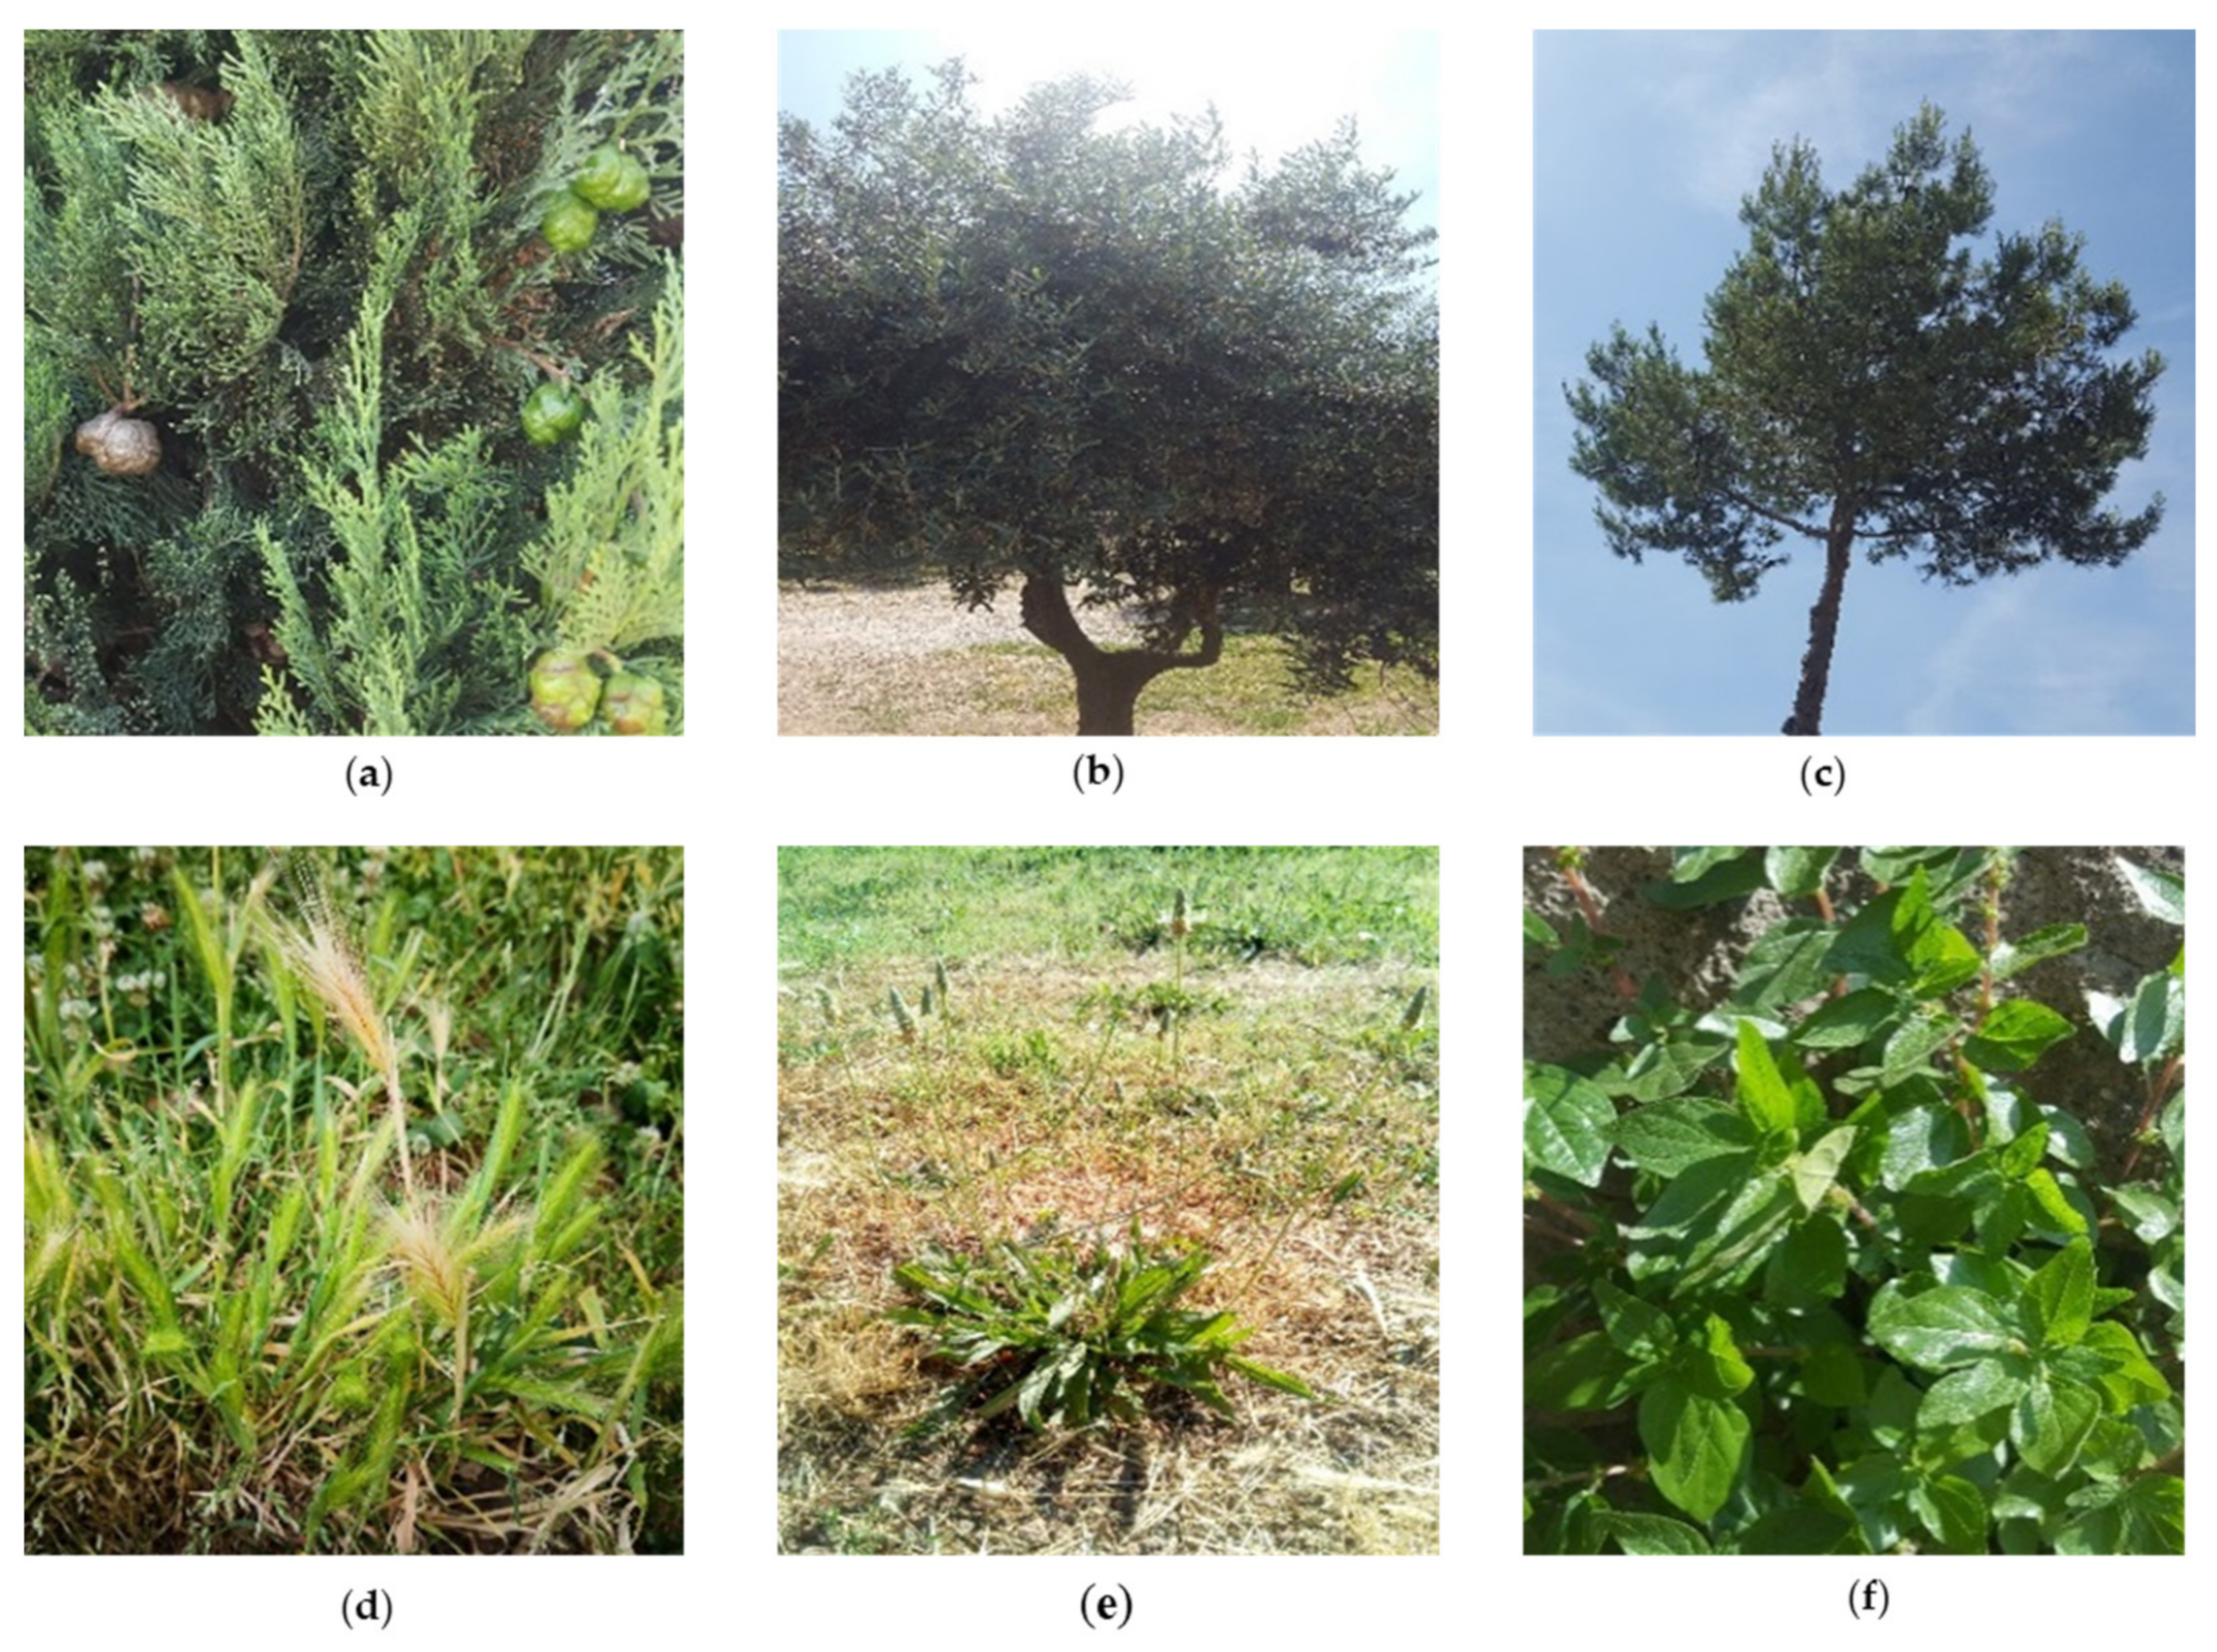
2.1. Site and Vegetation Description

The area of study was a Research Center building of the Italian Workers’ Compensation Authority (INAIL) located at Monte Porzio Catone, a city about 10 km south of Rome.
This area belongs to a Mediterranean biogeographical region; its vegetation is characterized by a mix of deciduous and evergreen trees, with a prevalence of Holm oak woods (e.g., Quercus ilex) and cultivated species such as Olea europaea, Vitis vinifera, Corylus avellana and chestnut woods (Castanea sativa Miller). The area is surrounded by Cupressaceae, Pinaceae, and Oleaceae. Herbaceous plants such as Urticaceae, Plantaginaceae, and Poaceae—as reported in Figure 1—are also found.

2.2. Aerobiological Monitoring

Airborne pollen and fungal spores were collected inside and outside the Research Center building of INAIL during summer 2016 (20 June–14 August) and winter 2017 (26 January–21 February). The monitoring was performed using a volumetric sampler VPPS 2000 (Lanzoni, Bologna, Italy), type Hirst [39], located at 1.10 m from ground level, calibrated to handle a flow of 10 L/min, thus matching the human breathing rate. The sampler was based on capture following the impact of particles on a surface consisting in a transparent plastic Melinex® tape, properly equipped [40,41], coated with a 2% silicon solution as the trapping surface. The Melinex® tape moved with a speed of 2 mm per hour on a cylindrical drum that makes a complete round in a week. Following the week-long air monitoring, the sampling tape was cut into daily segments of 48 mm, treated with glycerine jelly, stained with basic fuchsin solution to be mounted on microscope slides, and then observed with an optical microscope (magnification of 400×) using tangential fields lecture’s type on horizontal lines for the count and characterization of pollen and fungal spores [42]. The aerobiological contaminants were expressed as the number of pollen grains and the number of fungal spores per cubic meter of air (particles/m3).

2.3. Microclimate Monitoring

The indoor meteorological measurements were carried out inside the Research Center building of INAIL during the summer 2016 and winter 2017 periods simultaneously with the aerobiological measurements, using a Delta Ohm model 32.1 (Padua, Italy) data logger. The data logger was connected to a relative humidity/temperature combined probe (sensor type thin film Pt 100 for the temperature, and capacity sensor type for relative humidity) and to an omnidirectional hot-wire probe for the wind speed measurement, providing simultaneous measurements of Tair, RH and WS. The temporal changes of the environmental parameters Tair, RH, WS, were monitored with a time resolution of 30 min.

2.4. Occupant Behavior Monitoring

The occupant behavior monitoring was performed inside the Research Center building of INAIL using specific spreadsheets to record the workers’ data, including the WDs (from Monday to Friday) and the NWDs (from Saturday to Sunday) during the summer and winter campaigns. Moreover, we classified the WDs in non-working hours (NWHs, 07:30 p.m.–07:30 a.m.) and working hours (WHs, 07:30 a.m.–07:30 p.m.). This information represented the aggregated input data in our database, which was then processed in order to evaluate their combined effects. The occupants’ data included the presence and the number of workers, the overall time spent in indoor workplaces, and their actions, such as opening/closing doors/windows, and turning on/off the ventilation in indoor occupational setting. Table 1 shows an example of a spreadsheet during a representative NWD and WD (based on [37]).

2.5. Statistical Analysis

The statistical analyses were performed using MATLAB™ (version R2015b). Descriptive statistics for all of the variables—pollen and fungal spores, microclimate parameters (Tair, RH, WS), occupants’ presence, and door and window opening times—were calculated. The cross-correlation was used as the preliminary procedure, which included a data preprocessing stage in order to improve the calculation of the correlations and the subsequent multivariate regression analysis (MR).
For the MR analysis, the data were aggregated on 6-hourly averages, starting with a 4-hourly time resolution (0–6; 6–12; 12–18; 18–24), and each variable was crossed with all of the other ones. This analysis was composed of three models using the occupants’ behavior and microclimate as the input variables in order to reproduce the observed pollen and fungal spore values. In particular, the following three MR have been adopted in order to forecast the pollen and fungal spores trend: the first model uses all of the input variables (MRall), the second model does not include the open door (MRno) and Tair among the input variables (MRno_od-Tair), and the third model considers only the occupants’ behavior as the input variable (MRob).

3. Results

3.1. Pollen and Fungal Spores Characterization

The aerobiological data were processed, considering the pollen and fungal spores’ taxa as the total number of particles and speciation in order to carry out their characterization. The indoor aerobiological monitoring during the winter and summer campaigns allowed us to identify the representative species usually detected in outdoor environments, including their taxa and particles sizes. During the summer campaign, we found that the higher pollen concentrations belonged to Castanea sativa (40.7%), Urticaceae (35.8%), and Plantaginaceae (5.6%) (Figure 2a). On the other hand, pollen belonging to Cupressaceae (61.3%), Urticaceae (18.6%), and Corylus avellana (8.3%) were detected with higher concentrations during the indoor winter season (Figure 2c).
Regarding the fungal spores, we found that during the summer monitoring the most frequently detected genera were Cladosporium (85.7%), Alternaria (9.8%) and Epicoccum, Helminthosporium, Polythrincium, Stemphylium and Torula, with a total concentration of 4.5% (Figure 2b). During the winter campaign, the most relevant genus was Cladosporium, with a percentage of 98.3%. Alternaria, Epicoccum, Stemphylium, and Torula reached the overall percentage of 1.7% (Figure 2d).
The representative particle sizes in the summer campaign were 10–19 µm, with a total of 92.4%, including Castanea, Urticae, and Plantaginace (Figure 3a), whereas in the winter, they were 20–40 µm, comprising Cupressacee, Alnus, and Ulmacee, representing a total of 92.4% (Figure 3b).

3.2. Non-Working Days (NWDs) and Working Days (WDs)

The data were processed showing the daily values in order to perform a descriptive analysis and determine the relationship between NWDs and WDs (during the summer and winter campaigns). The daily data collected during the summer (17 days) and winter campaigns (27 days) were divided into NWDs and WDs in order to evaluate the effect of the occupants’ presence/absence on indoor pollen and fungal spore values. The relationships between the occupants, biocontaminants, and seasonal variations are shown in Figure 4.
The results suggest that the occupants’ presence is a key factor contributing to the indoor pollen and fungal spores values in the summer and winter campaigns, and a high increase of the pollen and fungal spore concentrations was observed on WDs (Figure 4).
As reported in [37], the microclimate parameters (mean Tair and mean RH) were also reported for the NWDs and WDs. The mean Tair is higher on WDs (25.9 °C), while on NWDs it is lower (24.5 °C); the mean RH is higher (50.1%) on NWDs with regard to WDs (49.7%) in the summer campaign, whereas in winter the meteorological conditions were more stable (Figure 5).
In Table 2 are shown the daily averages (mean value and standard deviations) and percentages (calculated on daily average) of the pollen and fungal spores during the NWDs and WDs of the summer and winter campaigns. With regard to summer, the NWDs’ and the WDs’ mean daily concentrations were 0.6 particles/m3 (2%) and 28.7 particles/m3 (98%) for pollen, and 5.5 particles/m3 (3.3%) and 161.5 particles/m3 (96.7%) for fungal spores, respectively. With regards to the winter season, the NWDs’ and the WDs’ mean average daily concentrations were 0.9 particles/m3 (14%) and 5.5 particles/m3 for pollen (86%), and 26.2 particles/m3 (38.4%) and 42.0 particles/m3 (61.6%) for fungal spores, respectively. Finally, in the summer, during NWDs and WDs, the total pollen values were 97 particles/m3 and 1148.4 particles/m3, respectively, while the total fungal spores values were 88.0 particles/m3 and 6460.1 particles/m3. In the winter campaign, the total pollen values were 7.0 and 104.3, respectively, while the total fungal spore values were 209.4 particles/m3 and 797.3 particles/m3 during NWDs and WDs, respectively.

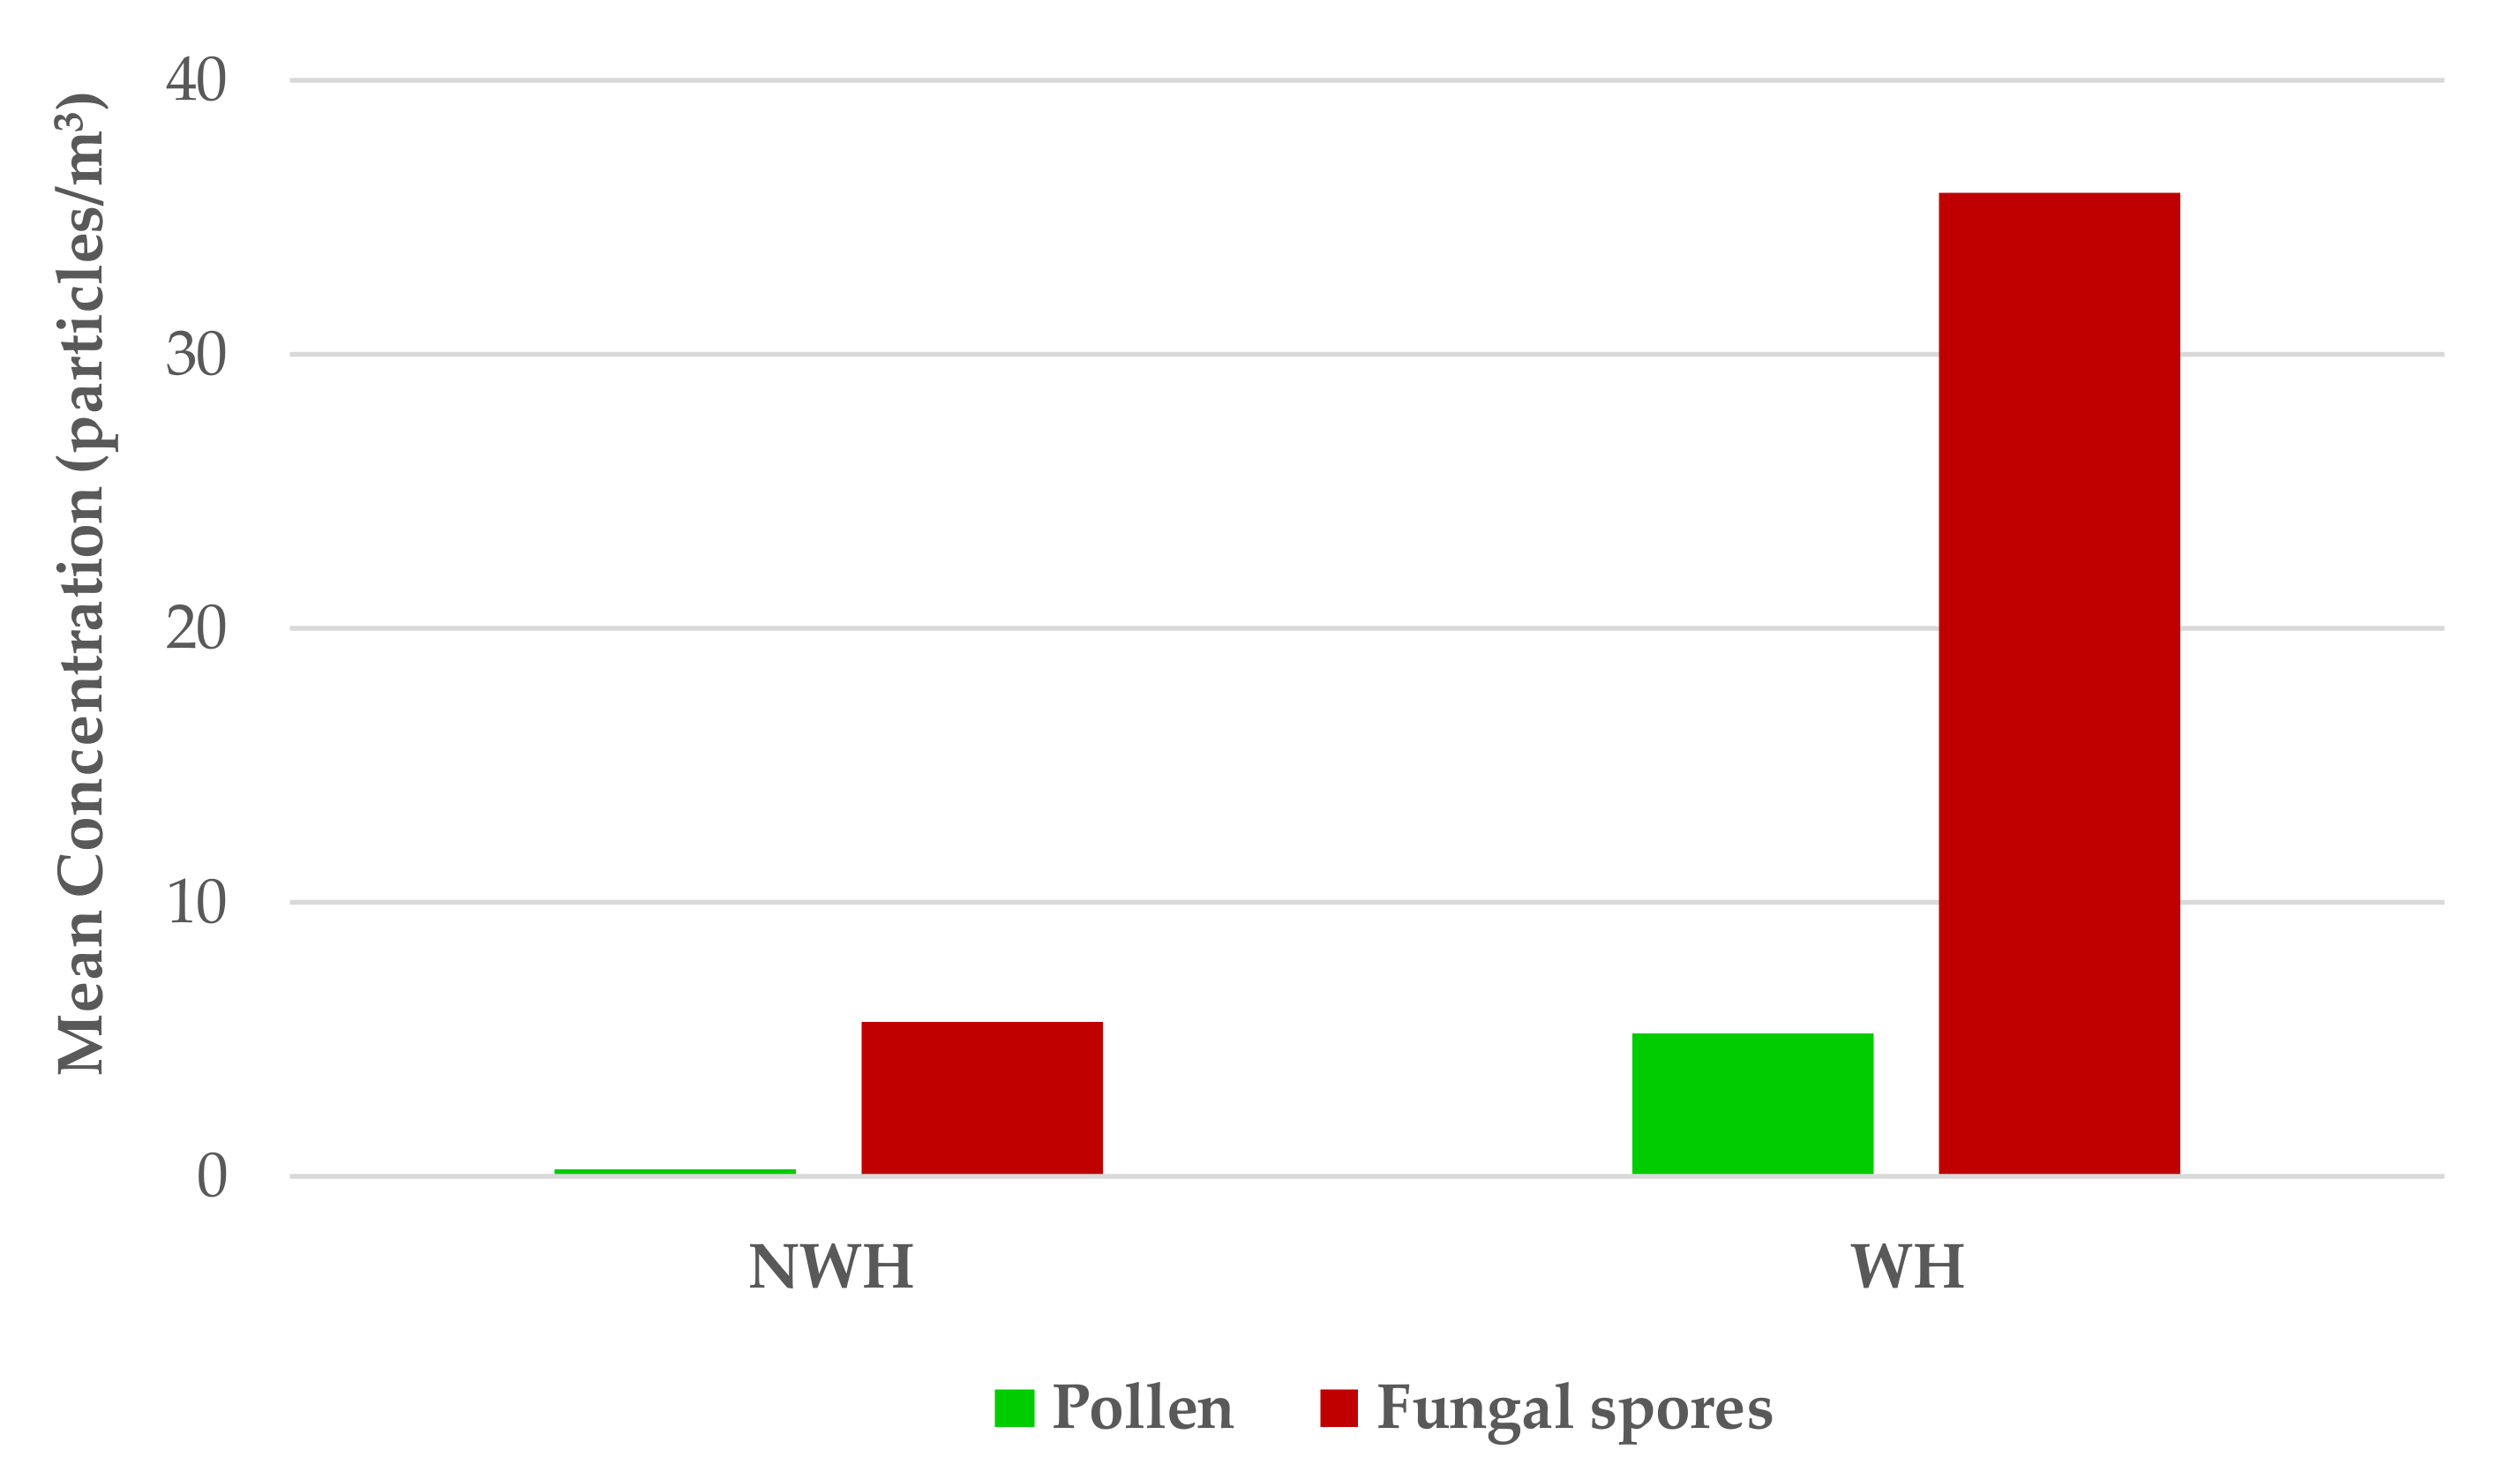
3.3. Non-Working Hours (NWHs) and Working Hours (WHs)

In order to evaluate the contribution of the occupants, the data derived from the winter campaign were processed with an hourly resolution, considering two classes of hours: NWHs (07:30 p.m.–07:30 a.m.) and WHs (07:30 a.m.–07:30 p.m.). A comparison between the two classes in a representative day displays an increase of the mean concentration for pollen (1633%) and fungal spores (529%) in WHs with respect to NWHs (Figure 6).
Regarding the occupants’ behavior’s effects, such as the opening time of doors and windows, the biocontaminant data showed an increase of the pollen and fungal spore concentrations in relation to closed and open doors/windows (Figure 7).

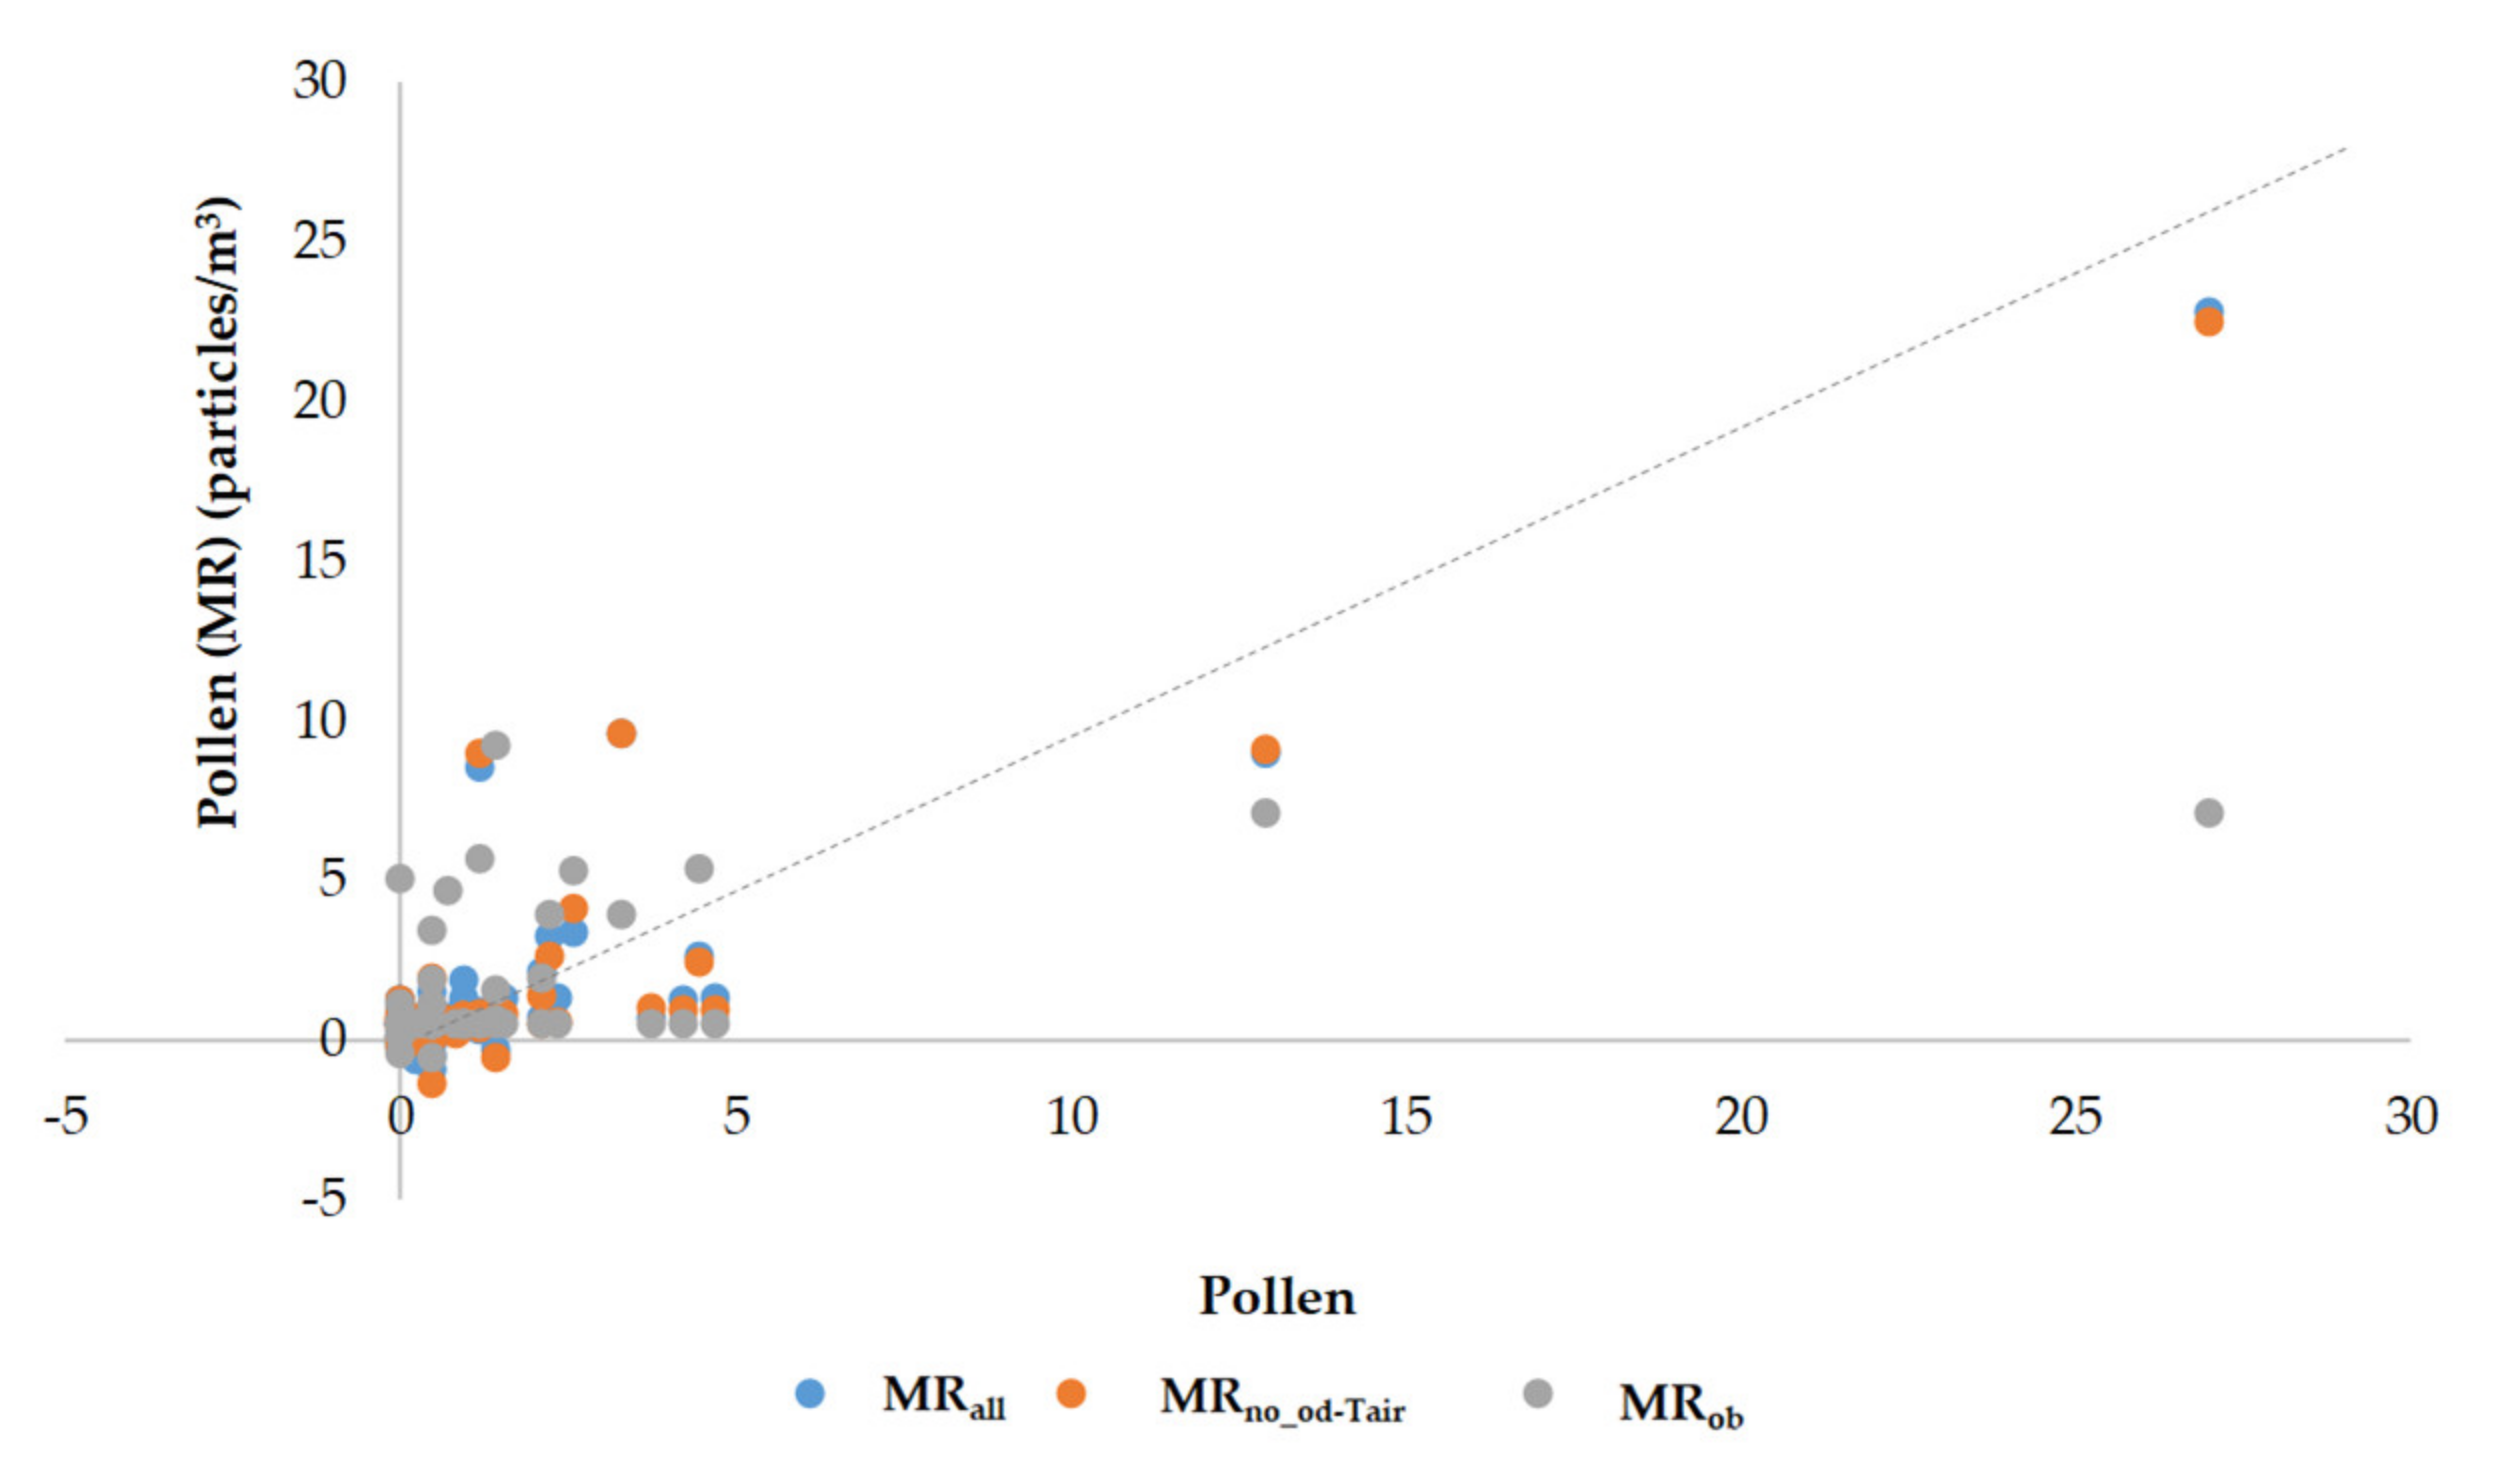
3.4. Correlation among Biocontaminants, Meteorological Variables, and Occupants’ Behavior

We evaluated the relationship between biocontaminants and meteorological variables, analyzing their linear correlation, considering the data of winter campaigns (January–February 2017), which were representative of the worst meteorological conditions, in which turbulences conditions are mainly stable or neutral (with a minimum contribution of the convective conditions). To this purpose, the data obtained in the winter campaign were aggregated on a 6-hourly average, based on four hourly time range (0–6; 6–12; 12–18; 18–24), corresponding to the day and night time slots, for a total amount of 80 data points.
Corresponding to daytime and nighttime periods, for a total amount of 80 data points. This aggregation on a 6-hourly average was used in order to reduce the presence of the ‘zeros’ in the measurements, which would make the cross-correlation analysis unreliable in the evaluation of the calculated correlations, and therefore also in the multivariate analysis.
The mean values and standard deviation (SD) for the occupants’ behavior, microclimate factors, pollen, and fungal spore variables were calculated on all of the 6-hourly averages, as shown in Table 3.
The values of the indoor wind speed are generally about 0.1–0.3 m/s, and the effect of the averaging on all of the data consists in a further decrease of such values. Nevertheless, we considered the correlation the same with all of the other variables.
The cross-correlation analysis in Table 4 shows how each variable is linked with the others. In particular, a significant correlation was found between the occupants with respect to Open Door (R = 0.93) and Tair (R = 0.73). Moreover, a significant correlation was found between pollen and WS (R = 0.86), while fewer correlations (Rmax ≤ 0.65) were found between fungal spores and other variables.
Based on the cross-correlation analysis, the multivariate models were subsequently performed using all of the biocontaminants. In order to check the influence of collinearity on the multivariate analysis, three different simulations (MRall, MRno_od-Tair, and MRob) were considered, as described in Section 2.5. In particular, the following three models were developed.
MRall: in this model, all of the possible input variables were considered relating to the occupants’ behavior and microclimate factors, in order to reproduce the pollen and fungal spores. This MR model is the most complete, but it could be affected by the collinearity between some variables. In that regard, the collinearity was a typical statistical data quality assurance to consider before the application of multiregression models. In our experience, in real experimental situations the exclusion in the analysis of these data could give the wrong results. To this end, the contributions of collinear input variables were considered in order to better control the model performances.
MRno_od-Tair: the cross-correlation showed that the Open Door and Tair variables were linearly dependent. Because these variables respectively correlated positively with the occupants and negatively with the relative humidity (RH), in this model, they were not included as an input in the forecast of the biocontaminants (Table 4).
MRob: in this model, the effect on biocontaminants was assessed exclusively using the set of the occupants’ behavior as the input for the MR model.
For the pollen forecast, Table 5 shows that both the MRall (R = 0.89) and MRno_od-Tair (R = 0.88) models have excellent performances. In the table, the Paverage values were added to evaluate the significance of the inputs to each model. The best input combination should coincide with the minimum values. The best model to forecast pollen is determined by the MRno-od-Tair.
Furhermore, the MRob does not perform well for pollen (R = 0.55). Since the two models—MRall and MRno_od-Tair—are quite similar with regard to performances, the results indicate that the open door and air temperature variables are not fundamental to improve the models. The pollen forecast by the three models is shown in Figure 8.
Figure 8 shows the comparison by measured pollen and by the three MR models. In particular, the MRall and MRno_ob-Tair models have similar performances up to values about 5 particles/m3 (consistent with the R values in Table 5). The contribution derived by the different choice of input variables into MR becomes discriminant from 10 particles/m3, up to the higher values over 25 particles/m3. In this range of high pollen values, the simulations show the fundamental role of the micrometeorological input variables to reproduce the observed pollen values.
In Figure 8, the same performance using the MRob was observed (about 7 particles/m3) when the micro-meteorological input variables were not included. At the same time, with reference to this domain, the two models MRall and MRno_ob-Tair reproduce well the observed values. In particular, the MRno_ob-Tair model seems more suitable to higher pollutant values (pollen > 10 particles/m3), whereas for lower pollen values (pollen < 5 particles/m3) the MRall seems to be the more appropriate model (confirming the choice in accordance with Paverage = 0.22).
Table 6 shows that the best model is MRall (R = 0.70) for the fungal spores forecast. In such simulations, the two variables related to air temperature and open doors are important (R = 0.62), as evidenced by the correlation decrease of the MRno_od-Tair model. MRob does not perform well to forecast the fungal spores (R = 0.50).
Using criteria based on the Paverage, the best model to reproduce fungal spores should be MRall.
The fungal spores forecast by the three models is shown in Figure 9.
Concerning the choice of the best forecast for fungal spores, the three models—MRall, MRno_ob_Tair and MRob—seem to have very different performances in relation to the selected input values (as shown by the R values in Table 6).
In Figure 9, it can be observed that the MRall model reproduces well the values up to a hypothetical threshold of 30 particles/m3. In general, beyond the threshold of 30 particles/m3, a performance improvement was not evident. In particular, a slight improvement of two models—MRall e MRno_ob_Tair—with respect to MRob was observed. The fungal spores simulations suggest the existence of non-linear effects reproducing the measurements. Substantially, the comparison between the pollen and fungal spores forecasts shows that multiregression models appear more critical for the last biological pollutants, and that the relationship between fungal spores’ micro-meteorological variables and occupants’ behavior are more complex to investigate.

4. Discussion

Meteorological and aerobiological monitoring were carried out during summer and winter campaigns, in association with monitoring occupants’ presence and behavior, in order to evaluate their combined effect on the pollen and fungal spores levels in indoor workplaces.
Some results presented in this study referred to the Integrated Evaluation of Indoor Particulate Matter VIEPI Project, of which the main goal was the evaluation of indoor and outdoor particulate matter, and their mutual interactions [37].
For this purpose, in the context of aerobiological particle monitoring, pollen seasonality is an important aspect in order to compare data collected over the years in different monitoring sites, and could be very useful for the development of pollen forecast models and pollen transport study [3].
Usually, pollination can be distinguish into three main periods, represented by winter-pre-spring (January to March) for Betulaceae, Corylaceae, Cupressaceae, Salicaceae and Ulmaceae; spring–summer (April to June) for Gramineae, Urticaceae, Oleaceae, Plantago, Fagaceae, Pinaceae and Polygonaceae; and summer–autumn (August to September) for Urticaceae, Composilae and Chenopodiaceae [43,44]. Our aerobiological monitoring performed during the winter and summer seasons showed species that were representative of the seasonality, belonging to Castanea sativa (40.7%), Urticaceae (35.8%) and Plantaginaceae (5.6%) during the summer campaigns, whereas in winter Cupressaceae (61.3%), Urticaceae (18.6%) and Corylus avellana (8.3%) were prevalent (Figure 2). The higher percentages of Urticaceae and Cupressaceae may be explained by considering the vegetation around the Research Center building, as described in the Section 2.1, and the presence of pollen from Castanea sativa and Corylus avellana resulting from sources located within an area of ~10 Km radius [45].
The indoor trends of the pollen and fungal spores evidenced higher values for both biocontaminants in the summer in respect to the winter period in our study (Table 2). Higher total fungal levels were reported in autumn than in summer and winter [46]. The fungal characterization evidenced a prevalence in outdoor environments of Cladosporium spp. [47] and Aspergillus spp. in the summer, autumn, and winter seasons, while Alternaria species were more represented in the spring season [48]. Another study indicated Alternaria as the most abundant fungal spore type found during the summer season [49].
Focusing on the dimensions of the particles, more particles in summer campaign were 10–19 µm, with a total of 92.4%, including Castanea, Urticae, and Plantaginace (Figure 3a), whereas in winter, the particles were 20–40 µm, comprising Cupressacee, Alnus, and Ulmacae, representing a total of 92.4% (Figure 3b). The bioaerosols with particles < 5 µm are more hazardous in terms of adverse health effects, and the bioparticles with a diameter between 10 and 30 µm (represented by Castanea sativa, Urticaceae, Plantaginaceae, Cupressaceae, Corylus avellana in higher percentages) can be deposited in the respiratory tract, resulting in allergy diseases.
The seasonality and the presence of different species are important also in occupational settings, in which a 10% decrease in productivity was reported in workers with allergies using no medication with respect to those without allergies [50]. This aspect is relevant considering that vegetable-derived allergies were reported for different categories of workers, such as Champagne vineyard workers, during the gramineae pollination (June–July) and vine pollination (first 15 days of June) [51], in flower cultivators with cyclamen (Cyclamen persicum) [52], in employees exposed to Brassica oleracea pollen [53], in pepper greenhouse employees [54], in horticulture workers for sweet bell pepper pollen [55], in greenhouse flower and/or ornamental plant growers [56], and in workers exposed to fungal spores in grain storage godowns [57].
The results of the present article seem to indicate an increase of aerobiological particle concentrations during working hours (WHs, 7:30 a.m.–7:30 p.m.) in relation to workers’ presence and behavior. On the contrary, during non-working days (NWDs from Saturday to Sunday) or in absence of occupants, the biocontaminant values decreased. These data suggest that the presence of the occupants is an important factor contributing to the indoor concentration of biocontaminants such as pollen.
Particular attention should be paid to pollen transport as a possible consequence of human passage and movement, or derived from textile products [58,59]. Concerning occupants’ behaviors’ effects, such as opening time of doors and windows, the biocontaminant data showed an increase of pollen and fungal spore levels in relation to open/closed doors and windows (Figure 7). The mean increase of pollen concentrations in relation to open/closed doors was 56.97%, and in relation to open/closed windows was 106.84%. The mean increase of fungal spore concentrations in relation to open/closed doors was 127.35%, and to open/closed windows was 89.90%.
In the context of models to forecast the trend of pollutants such as pollen, it is relevant to understand how the input variables are correlated to each other [60]. The cross-correlation analysis suggested that the temporal variability of pollen and fungal spores cannot be predicted by using the univariate models. Three different simulations of multivariate models (MRall, MRno_od-Tair and MRob) were performed in order to investigate the influence of different inputs on the models. The best MR model to forecast the pollen was MRno-od-Tair (with R = 0.88 and Paverage = 0.22). Meanwhile, the best MR model to forecast fungal spores was MRall (with R = 0.70 and Paverage = 0.07). The MRob did not perform well to forecast the pollen (R = 0.55) and the fungal spores (R = 0.50).
The multivariate models seem to suggest that the effect of opening/closing doors was more evident for fungal spores than pollen.
A critical topic is the evaluation of bioaerosol exposure due to the complexity and diversity of biocontaminants in indoor environments. Recent developments in this field have shown the necessity of innovative measurement methods of the allergens such as pollen and fungal spores, and the importance of specific criteria to estimate workers’ health effects. Numerous airborne microrganisms—such as bacteria, viruses, fungi, and particles and fragments of biological origin (e.g., animal and vegetable-derived allergens)—present in the air could determine several adverse health effects, including respiratory symptoms and lung function [6,61]. In order to estimate these effects, we have to take into account the pathogenicity of specific microrganisms, the physical characteristics of bioaerosol, and their environmental interactions. Several factors influence biocontaminants’ survival and diffusion in the environments, such as metereological conditions— especially wind speed and direction—that impact on their concentration and dispersion, as well as the relative humidity, which affects their growth. Furthermore, atmospheric pollutants and climate change may have relevant effects on the properties of aerobiological particles such as pollen grains [11,30,62]. In the literature, different studies have reported high molecular weight agents of biological origin and other allergens that cause sensitization and allergic diseases such as asthma and rhinitis in different occupational settings [32]. Asthma is a clinical manifestation of allergic diseases, and it was estimated that more than 339 million people had asthma in 2016 (https://www.who.int/news-room/fact-sheets/detail/asthma) (accessed on 3 March 2021). Moreover, about 17% of all adult-onset cases of asthma are associated with occupational exposures (https://www.cdc.gov/niosh/topics/asthma/epidemiology.html) (accessed on 3 March 2021). Changes in pulmonary function and nervous systems have been evidenced in many papers about workers exposed to fungal spores [57]. To this end, it is important to develop protocols to assess sensitization and allergic symptoms in terms of their dose–response relationship [13,15,32,33]. The predictive models and maps of seasonality [63] could represent valid tools for the management, control, and prevention of allergies for both indoor and outdoor workers. In any case, our study confirms the central role of occupants affecting levels of airborne biocontaminants regardless of seasonality, and they should be also taken into account as input variables in predictive models.
Moreover, an integrated approach should be promoted in order to better understand the role of the worker as an actor in a typical occupational setting, where several co-factors are mutually interacting in the dynamics of the environment.

5. Conclusions

Pollen and fungal spores are components of bioaerosols, and their role in workplaces is still little studied [21,25,32,64,65,66]. Some features of occupational allergies need to be investigated through cohort studies [67], evaluating the effects of preventive programs and supporting aerobiological monitoring as an important tool to take into account to enhance occupational health [68,69,70].
The results obtained in this study show that microclimate factors, and occupants’ presence and actions are included in the complexity of indoor environments, and could affect the variability of biocontaminants. In this respect, it is important to perform a statistical analysis including all variables that could help to explain pollen and fungal spore trends. The best model to forecast the effect of variables on biocontaminants is MRall, as our findings seem to suggest, especially for pollen in respect to fungal spores.
The data categories grouped in the NWDs and in the WDs, in the NWHs and in the WHs evidenced the role of the occupants as a vehicle in the spread of pollen and fungal spores. In terms of taxa distribution, we found indoor aerobiological profiles according to outdoor seasonality. In addition, the classification in non-working days/hours and working days/hours may be a valid support in the assessment of the biological and allergological risks.
The results of present work seem to show an increase of biocontaminants during the WDs and WHs in relation to the workers’ presence and behavior. On the contrary, during the NWDs and NWHs, the aerobiological particles were reduced, suggesting a key role of the occupants.
This study, applying the multiregression models to investigate aerobiological pollutants in an occupational setting, and not only in public health, might be of significant interest in the evaluation and prediction of temporal variability for aerobiological biocontaminants, and further investigation should be performed in order to realise a large number of field campaigns in occupational settings. The MRall model confirmed the relationship with air pollution, meteorological factors, and occupants’ presence and behavior according to our previous findings [37].
The primary goal and the strength of this study was to suggest how to investigate aerobiological pollution, studying its relationship with humans’ actions and microclimate variables using data derived from representative campaigns. The multiregression analysis to forecast the trend of pollen and fungal spores in indoor occupational settings confirmed the necessity of more robust studies based on intensive and long-term campaigns. A deeper understanding on these topics might provide practical implications for several aspects regarding biocontaminants exposure both in public and occupational health in the context of environmental exposure to contaminants derived by different indoor and outdoor sources [37,71,72]. The characterization and dimensional distribution of the bioparticles have to be take into account in the management of biological and allergological risks.

Author Contributions

Conceptualization, M.C.D. and A.P.; methodology, M.C.D., S.D.R., P.C. and A.P.; investigation: M.C.D., S.D.R. and P.C.; data curation, M.C.D., S.D.R., P.C. and A.P.; writing—original draft, M.C.D., P.C. and A.P.; writing—review and editing, M.C.D., S.D.R., P.C., and A.P.; supervision, M.C.D. and A.P.; project administration, M.C.D. and A.P. All authors have read and agreed to the published version of the manuscript.

Funding

This research received no external funding.

Institutional Review Board Statement

Not applicable.

Informed Consent Statement

Not applicable.

Data Availability Statement

Not applicable.

Conflicts of Interest

The authors declare no conflict of interest.

References

  1. Singh, M.; Hays, A. Indoor and outdoor allergies. Prim. Care Clin. Off. Pract. 2016, 43, 451–463. [Google Scholar] [CrossRef]
  2. Sender, R.; Fuchs, S.; Milo, R. Are we really vastly outnumbered? Revisiting the ratio of bacterial to host cells in humans. Cell 2016, 164, 337–340. [Google Scholar] [CrossRef] [Green Version]
  3. Sbihi, H.; Boutin, R.C.T.; Cutler, C.; Suen, M.; Finlay, B.B.; Turvey, S.E. Thinking bigger: How early-life environmental exposures shape the gut microbiome and influence the development of asthma and allergic disease. Allergy 2019, 64, 2103–2115. [Google Scholar] [CrossRef] [Green Version]
  4. Shan, Y.; Wu, W.; Fan, W.; Haahtela, T.; Zhang, G. House dust microbiome and human health risks. Int. Microbiol. 2019, 22, 297–304. [Google Scholar] [CrossRef] [PubMed]
  5. Ai, Z.T.; Melikov, A.K. Airborne spread of expiratory droplet nuclei between the occupants of indoor environments: A review. Indoor Air 2018, 28, 500–524. [Google Scholar] [CrossRef]
  6. Ai, Z.T.; Hashimoto, K.; Melikov, A.K. Airborne transmission between room occupants during short-term events: Measurement and evaluation. Indoor Air 2019, 29, 563–576. [Google Scholar] [CrossRef] [PubMed] [Green Version]
  7. Hospodsky, D.; Qian, J.; Nazaroff, W.W.; Yamamoto, N.; Bibby, K.; Rismani-Yazdi, H.; Peccia, J. Human occupancy as a source of indoor airborne bacteria. PLoS ONE 2012, 7, e34867. [Google Scholar] [CrossRef] [PubMed] [Green Version]
  8. Damialis, A.; Häring, F.; Gökkaya, M.; Rauer, D.; Reiger, M.; Bezold, S.; Bounas-Pyrros, N.; Eyerich, K.; Todorova, A.; Hammel, G.; et al. Human exposure to airborne pollen and relationships with symptoms and immune responses: Indoors versus outdoors, circadian patterns and meteorological effects in alpine and urban environments. Sci. Total Environ. 2019, 653, 190–199. [Google Scholar] [CrossRef] [PubMed]
  9. Avery, A.M.; Waring, M.S.; DeCarlo, P.F. Seasonal variation in aerosol composition and concentration upon transport from the outdoor to indoor environment. Environ. Sci. Process. Impacts 2019, 21, 528–547. [Google Scholar] [CrossRef] [PubMed]
  10. Patel, T.Y.; Buttner, M.; Rivas, D.; Cross, C.; Bazylinski, D.A.; Seggev, J. Variation in airborne fungal spore concentrations among five monitoring locations in a desert urban environment. Environ. Monit. Assess. 2018, 190, 424. [Google Scholar] [CrossRef] [Green Version]
  11. Sénéchal, H.; Visez, N.; Charpin, D.; Shahali, Y.; Peltre, G.; Biolley, J.P.; Lhuissier, F.; Couderc, R.; Yamada, O.; Malrat-Domenge, A.; et al. A review of the effects of major atmospheric pollutants on pollen grains, pollen content, and allergenicity. Sci. World. J. 2015, 2015, 940243. [Google Scholar] [CrossRef] [Green Version]
  12. Borchers, A.T.; Chang, C.; Gershwin, E.M. Mold and human health: A reality check. Clin. Rev. Allergy Immunol. 2017, 52, 305–322. [Google Scholar] [CrossRef]
  13. Pasteur, L. Mémoire sur les corpuscules organisés qui existent dans l’atmosphère. Examen de la doctrine des générations spontanées. Ann. des Sci. Nat. Partie Zool. 1861, 4, 5–98. [Google Scholar]
  14. Eduard, W.; Heederik, D.; Duchaine, C.; Green, B.J. Bioaerosol exposure assessment in the workplace: The past, present and recent advances. J. Environ. Monit. 2012, 14, 334–339. [Google Scholar] [CrossRef] [PubMed] [Green Version]
  15. European Agency for Safety and Health at Work—EU-OSHA. Priorities for Occupational Safety and Health Research in Europe: 2013–2020; Publications Office of the European Union: Luxembourg, 2010. [Google Scholar] [CrossRef]
  16. Kessler, R.C.; Almeida, D.M.; Berglund, P.; Stang, P. Pollen and mold exposure impairs the work performance of employees with allergic rhinitis. Ann. Allergy Asthma Immunol. 2001, 87, 289–295. [Google Scholar] [CrossRef]
  17. Mirskaya, E.; Agranovski, I.E. Sources and mechanisms of bioaerosol generation in occupational environments. Crit. Rev. Microbiol. 2018, 44, 739–758. [Google Scholar] [CrossRef] [PubMed]
  18. Cho, E.M.; Hong, H.J.; Park, S.H.; Yoon, D.K.; Nam Goung, S.J.; Lee, C.M. Distribution and influencing factors of airborne bacteria in public facilities used by pollution-sensitive population: A meta-analysis. Int. J. Environ. Res. Public Health 2019, 16, 1483. [Google Scholar] [CrossRef] [PubMed] [Green Version]
  19. De Dear, R.J.; Brager, G.S. Developing an adapting model of thermal comfort and preferences. Atlanta. ASHRAE. Trans. 1998, 104, 145–167. [Google Scholar]
  20. Wierzbicka, A.; Pedersen, E.; Persson, R.; Nordquist, B.; Stålne, K.; Gao, C.; Harderup, L.-E.; Borell, J.; Caltenco, H.; Ness, B.; et al. Healthy indoor environments: The need for a holistic approach. Int. J. Environ. Res. Public Health 2018, 15, 1874. [Google Scholar] [CrossRef] [PubMed] [Green Version]
  21. Menzel, A.; Matiu, M.; Michaelis, R.; Jochner, S. Indoor birch pollen concentrations differ with ventilation scheme, room location, and meteorological factors. Indoor Air. 2017, 27, 539–550. [Google Scholar] [CrossRef] [PubMed]
  22. Jantunen, J.; Saarinen, K. Intrusion of airborne pollen through open windows and doors. Aerobiologia 2009, 25, 193–201. [Google Scholar] [CrossRef]
  23. Hugg, T.; Rantio-Lehtimäki, A. Indoor and outdoor pollen concentrations in private and public spaces during the Betula pollen season. Aerobiologia 2007, 23, 119–129. [Google Scholar] [CrossRef]
  24. Yamamoto, N.; Matsuki, Y.; Yokoyama, H.; Matsuki, H. Relationships among indoor, outdoor, and personal airborne japanese cedar pollen counts. PLoS ONE 2015, 10, e0131710. [Google Scholar] [CrossRef]
  25. Sterling, D.A.; Lewis, R.D. Pollen and fungal spores indoor and outdoor of mobile homes. Ann. Allergy Asthma Immunol. 1998, 80, 279–285. [Google Scholar] [CrossRef]
  26. Lyles, W.B.; Greve, K.W.; Bauer, R.M.; Ware, M.R.; Schramke, C.J.; Crouch, J.; Hicks, A. Sick building syndrome. South. Med. J. 1991, 84, 65–71. [Google Scholar] [CrossRef]
  27. Seltzer, J.M. Building-related illnesses. J. Allergy Clin. Immunol. 1994, 94, 351–361. [Google Scholar] [CrossRef] [PubMed]
  28. Skov, P.; Valbjørn, O.; Pedersen, B.V. Influence of personal characteristics, job-related factors and psychosocial factors on the sick building syndrome. Danish Indoor Climate Study Group. Scand. J. Work Environ. Health 1989, 15, 286–295. [Google Scholar] [CrossRef]
  29. Toivola, M.; Alm, S.; Reponen, T.; Kolari, S.; Nevalainen, A. Personal exposures and microenvironmental concentrations of particles and bioaerosols. J. Environ. Monit. 2002, 4, 166–174. [Google Scholar] [CrossRef]
  30. Ghosh, B.; Lal, H.; Srivastava, A. Review of bioaerosols in indoor environment with special reference to sampling, analysis and control mechanisms. Environ. Int. 2015, 85, 254–272. [Google Scholar] [CrossRef]
  31. Hong, T.; Gurian, P.L. Characterizing bioaerosol risk from environmental sampling. Environ. Sci. Technol. 2012, 46, 6714–6722. [Google Scholar] [CrossRef] [PubMed]
  32. Raulf, M.; Buters, J.; Chapman, M.; Cecchi, L.; de Blay, F.; Doekes, G.; Eduard, W.; Heederik, D.; Jeebhay, M.F.; Kespohl, S.; et al. Monitoring of occupational and environmental aeroallergens—EAACI Position Paper. Allergy 2014, 69, 1280–1299. [Google Scholar] [CrossRef]
  33. Walser, S.M.; Gerstner, D.G.; Brenner, B.; Bünger, J.; Eikmann, T.; Janssen, B.; Kolb, S.; Kolk, A.; Nowak, D.; Raulf, M.; et al. Evaluation of exposure-response relationships for health effects of microbial bioaerosols—A systematic review. Int. J. Hyg. Environ. Health 2015, 218, 577–589. [Google Scholar] [CrossRef]
  34. Fanger, P.O. Thermal Comfort; Danish Technical Press: Copenhagen, Denmark, 1970. [Google Scholar]
  35. Fabi, V.; Andersen, R.V.; Corgnati, S.; Olesen, B.W. Occupants’ window opening behaviour: A literature review of factors influencing occupant behaviour and models. Build. Environ. 2012, 58, 188–198. [Google Scholar] [CrossRef]
  36. Nazaroff, W. Indoor bioaerosol dynamics. Indoor Air 2016, 26, 61–78. [Google Scholar] [CrossRef]
  37. Pelliccioni, A.; Monti, P.; Cattani, G.; Boccuni, F.; Cacciani, M.; Canepari, S.; Capone, P.; Catrambone, M.; Cusano, M.; De Santis, A.; et al. Integrated evaluation of indoor particulate exposure: The VIEPI project. Sustainability 2020, 12, 9758. [Google Scholar] [CrossRef]
  38. Dobashi, K.; Usami, A.; Yokozeki, H.; Tsurikisawa, N.; Nakamura, Y.; Sato, K.; Okumura, J.; Yamaguchi, M. On behalf of Committee for Japanese guideline for diagnosis and management of occupational allergic disease, The Japanese Society of Allergology. Japanese guidelines for occupational allergic diseases 2020. Allergol. Int. 2020, 69, 387–404. [Google Scholar] [CrossRef]
  39. Hirst, J. An automatic volumetric spore trap. Ann. Appl. Biol. 1952, 39, 257–265. [Google Scholar] [CrossRef]
  40. UNI 11108:2004. Air Quality. Method for Sampling and Counting of Airborne Pollen Grains and Fungal Spores; UNI, Italian National Unification: Milano, Italy, 2004; p. 8. [Google Scholar]
  41. UNI CEN/TS 16868:2015. Ambient Air—Sampling and Analysis of Airborne Pollen Grains and Fungal Spores for Allergy Networks—Volumetric Hirst Method; UNI, Italian National Unification: Milano, Italy, 2015. [Google Scholar]
  42. Mandrioli, P.; Comtois, P.; Domınguez-Vilches, E.; Galan-Soldevilla, C.; Syzdek, L.D.; Isard, S.A. Sampling: Principles and techniques. In Methods in Aerobiology; Mandrioli, P., Comtois, P., Levizzani, V., Eds.; Pitagora Editrice: Bologna, Italic, 1998; p. 261. [Google Scholar]
  43. Negrini, A.C.; Arobba, D. Allergenic pollens and pollinosis in Italy: Recent advances. Allergy 1992, 47, 371–379. [Google Scholar] [CrossRef] [PubMed]
  44. D’Amato, G.; Cecchi, L.; Bonini, S.; Nunes, C.; Annesi-Maesano, I.; Behrendt, H.; Liccardi, G.; Popov, T.; Van Cauwenberge, P. Allergenic pollen and pollen allergy in Europe. Allergy 2007, 62, 976–990. [Google Scholar] [CrossRef]
  45. Saar, M.; Meltsov, V. Passports of sampling sites in routine aerobiological monitoring of outdoor air. In Aerobiological Monographs, Towards a Comprehensive Vision; MeteoSwiss (CH) and University of Montreal (CA): Montreal, QC, Canada, 2011; Volume 1, pp. 215–231. [Google Scholar]
  46. Park, D.U.; Yeom, J.K.; Lee, W.J.; Lee, K.M. Assessment of the levels of airborne bacteria, Gram-negative bacteria, and fungi in hospital lobbies. Int. J. Environ. Res. Public Health 2013, 10, 541–555. [Google Scholar] [CrossRef] [PubMed]
  47. Sautour, M.; Sixt, N.; Dalle, F.; L’Ollivier, C.; Fourquenet, V.; Calinon, C.; Paul, K.; Valvin, S.; Maurel, A.; Aho, S.; et al. Profiles and seasonal distribution of airborne fungi in indoor and outdoor environments at a French hospital. Sci. Total Environ. 2009, 407, 3766–3771. [Google Scholar] [CrossRef]
  48. Cho, S.Y.; Myong, J.P.; Kim, W.B.; Park, C.; Lee, S.J.; Lee, S.H.; Lee, D.G. Profiles of environmental mold: Indoor and outdoor air sampling in a hematology Hospital in Seoul, South Korea. Int. J. Environ. Res. Public Health 2018, 15, 2560. [Google Scholar] [CrossRef] [Green Version]
  49. Oliveira, M.; Delgado, L.; Ribeiro, H.; Abreu, I. Fungal spores from Pleosporales in the atmosphere of urban and rural locations in Portugal. J. Environ. Monit. 2010, 12, 1187–1194. [Google Scholar] [CrossRef]
  50. Burton, W.N.; Conti, D.J.; Chen, C.Y.; Schultz, A.B.; Edington, D.W. The impact of allergies and allergy treatment on worker productivity. J. Occup. Environ. Med. 2001, 43, 64–71. [Google Scholar] [CrossRef] [PubMed]
  51. Perotin, J.M.; Barbe, C.; Nguyen, K.L.; Fontaine, J.F.; Gabignon, Y.; Nardi, J.; Launois, C.; Lebargy, F.; Lavaud, F.; Deslee, G. Work-related respiratory symptoms in Champagne vineyard workers. Eur. Ann. Allergy Clin. Immunol. 2015, 47, 140–144. [Google Scholar] [PubMed]
  52. Ariano, R.; Mistrello, G.; Panzani, R.C. Occupational respiratory allergy to cyclamen pollen: A case report. Eur. Ann. Allergy Clin. Immunol. 2006, 38, 90–93. [Google Scholar] [PubMed]
  53. Hermanides, H.K.; Laheÿ-de Boer, A.M.; Zuidmeer, L.; Guikers, C.; van Ree, R.; Knulst, A.C. Brassica oleracea pollen, a new source of occupational allergens. Allergy 2006, 61, 498–502. [Google Scholar] [CrossRef]
  54. Wittmaack, K.; Wehnes, H.; Heinzmann, U.; Agerer, R. An overview on bioaerosols viewed by scanning electron microscopy. Sci. Total Environ. 2005, 346, 244–255. [Google Scholar] [CrossRef]
  55. Vermeulen, A.M.; Groenewoud, G.C.; de Jong, N.W.; de Groot, H.; van Wijk, R.G.; van Toorenenbergen, A.W. Primary sensitization to sweet bell pepper pollen in greenhouse workers with occupational allergy. Clin. Exp. Allergy 2003, 33, 1439–1442. [Google Scholar] [CrossRef]
  56. Miesen, W.M.; van der Heide, S.; Kerstjens, H.A.; Dubois, A.E.; de Monchy, J.G. Occupational asthma due to IgE mediated allergy to the flower Molucella laevis (Bells of Ireland). Occup. Environ. Med. 2003, 60, 701–703. [Google Scholar] [CrossRef] [Green Version]
  57. Chattopadhyay, B.P.; Das, S.; Adhikari, A.; Alam, J. Exposure to varying concentration of fungal spores in grain storage godowns and its effect on the respiratory function status among the workers. Ind. Health 2007, 45, 449–461. [Google Scholar] [CrossRef] [Green Version]
  58. Gravensen, S. Microbiological studies on carpets versus hard floors in non-industrial occupations. Indoor Air 1987, 87, 668–672. [Google Scholar]
  59. Takahashi, Y.; Takano, K.; Suzuki, M.; Nagai, S.; Yokosuka, M.; Takeshita, T.; Saito, A.; Yasueda, H.; Enomoto, T. Two routes for pollen entering indoors: Ventilation ad clothes. J. Investig. Allergol. Clin. Immunol. 2008, 18, 382–388. [Google Scholar] [PubMed]
  60. Billionnet, C.; Sherrill, D.; Annesi-Maesano, I. Estimating the health effects of exposure to multi-pollutant mixture. Ann. Epidemiol. 2012, 22, 126–141. [Google Scholar] [CrossRef]
  61. Douwes, J.; Thorne, P.; Pearce, N.; Heederik, D. Bioaerosol health effects and exposure assessment: Progress and prospects. Ann. Occup. Hyg. 2003, 47, 187–200. [Google Scholar] [CrossRef] [PubMed] [Green Version]
  62. D’Amato, G.; Chong-Neto, H.J.; Monge Ortega, O.P.; Vitale, C.; Ansotegui, I.; Rosario, N.; Haahtela, T.; Galan, C.; Pawankar, R.; Murrieta-Aguttes, M. The effects of climate change on respiratory allergy and asthma induced by pollen and mold allergens. Allergy 2020, 75, 2219–2228. [Google Scholar] [CrossRef] [PubMed]
  63. Sikoparija, B.; Skjøth, C.A.; Celenk, S.; Testoni, C.; Abramidze, T.; Alm Kübler, K.; Belmonte, J.; Berger, U.; Bonini, M.; Charalampopoulos, A.; et al. Spatial and temporal variations in airborne Ambrosia pollen in Europe. Aerobiologia 2017, 33, 181–189. [Google Scholar] [CrossRef] [Green Version]
  64. Cecchi, L.; D’Amato, G.; Annesi-Maesano, I. External exposome and allergic respiratory and skin diseases. J. Allergy Clin. Immunol. 2018, 141, 846–857. [Google Scholar] [CrossRef] [Green Version]
  65. Steckling, N.; Gotti, A.; Bose-O’Reilly, S.; Chapizanis, D.; Costopoulou, D.; De Vocht, F.; Garí, M.; Grimalt, J.O.; Heath, E.; Hiscock, R.; et al. Biomarkers of exposure in environment-wide association studies—Opportunities to decode the exposome using human biomonitoring data. Environ. Res. 2018, 164, 597–624. [Google Scholar] [CrossRef]
  66. D’Ovidio, M.C.; Annesi-Maesano, I.; D’Amato, G.; Cecchi, L. Climate change and occupational allergies: An overview on biological pollution, exposure and prevention. Ann. Ist. Super. Sanità 2016, 52, 406–414. [Google Scholar] [CrossRef]
  67. Vandenplas, O.; Godet, J.; Hurdubaea, L.; Rifflart, C.; Suojalehto, H.; Walusiak-Skorupa, J.; Munoz, X.; Sastre, J.; Klusackova, P.; Moore, V.; et al. Severe occupational asthma: Insights from a multicenter European cohort. J. Allergy Clin. Immunol. Pract. 2019, 7, 2309–2318. [Google Scholar] [CrossRef] [PubMed] [Green Version]
  68. Larese Filon, F.; Drusian, A.; Mauro, M.; Negro, C. Laboratory animal allergy reduction from 2001 to 2016: An intervention study. Respir. Med. 2018, 136, 71–76. [Google Scholar] [CrossRef] [PubMed] [Green Version]
  69. Bastl, K.; Bastl, M.; Bergmann, K.C.; Berger, U. How to do a clinical trial? Recommendations from the aerobiological point of view. World Allergy Organ. J. 2019, 12, 100020. [Google Scholar] [CrossRef] [PubMed] [Green Version]
  70. Smith, M.; Berger, U.; Behrendt, H.; Bergmann, K.C. Pollen and pollinosis. Chem. Immunol. Allergy 2014, 100, 228–233. [Google Scholar] [CrossRef]
  71. Pelliccioni, A.; Gherardi, M. Development and validation of an intra-calibration procedure for MiniDISCs measuring ultrafine particles in multi-spatial indoor environments. Atmos. Environ. 2021, 246, 118154. [Google Scholar] [CrossRef]
  72. Bulski, K. Bioaerosols at plants processing materials of plant origin-a review. Environ. Sci. Pollut. Res. Int. 2020, 27, 27507–27514. [Google Scholar] [CrossRef]
Figure 1. Vegetation of the monitoring site: Cupressaceae (a), Oleaceae (b), Pinaceae (c), Poaceae (d), Plantaginaceae (e), and Urticaceae (f).
Sustainability 13 03154 g001
Figure 2. Characterization of the pollen (a) and fungal spores (b) during the summer campaign (20 June–14 August 2016); characterization of the pollen (c) and fungal spores (d) during the winter campaign (26 January–21 February 2017).
Sustainability 13 03154 g002
Figure 3. Dimensional distribution of pollen during the summer campaign (20 June–14 August 2016) (a) and during the winter campaign (26 January–21 February 2017) (b).
Sustainability 13 03154 g003
Figure 4. Mean concentrations of the pollen (a) and fungal spores (b) in relation to the mean occupants during the NWDs and WDs of the summer campaign (26 July–11 August 2016), and the mean concentration of the pollen (c) and fungal spores (d) in relation to the mean occupants during the NWDs and WDs of the winter campaign (26 January–21 February 2017).
Sustainability 13 03154 g004
Figure 5. Trend of pollen and fungal spores with a daily time resolution during the NWDs and WDs in the summer campaign (26 July–11 August 2016) (a) and in the winter campaign (26 January–21 February 2017) (c); trend of Tair, RH, and WS with a daily time resolution during the NWDs and WDs in the summer campaign (26 July–11 August 2016) (b) and in the winter campaign (26 January–21 February 2017) (d).
Sustainability 13 03154 g005
Figure 6. Mean concentration of pollen and fungal spores for a representative day during the NWHs and WHs of the winter campaign (26 January–21 February 2017).
Sustainability 13 03154 g006
Figure 7. Pollen and fungal spore concentrations in relation to closed and open doors (a), and to open and closed windows (b) for a representative day during the WHs of the winter campaign (26 January–21 February 2017).
Sustainability 13 03154 g007
Figure 8. Pollen values calculated by the three MRs’ models.
Sustainability 13 03154 g008
Figure 9. Fungal spores values calculated by the three MRs’ models.
Sustainability 13 03154 g009
Table 1. Example of a spreadsheet developed in order to detect the workers’ presence, behavior, and microclimate factors in indoor workplaces of Monte Porzio Catone during a representative NWD and a representative WD (based on [37]).
A representative NWD
HourDoor
(min)
Window
(min)
Fan
(min)
Occupants
(n)
Tair
(°C)
RH
(%)
WS
(m/s)
07:30ClosedClosedOff019.8540.050
08:00ClosedClosedOff019.8039.940
08:30ClosedClosedOff019.8039.760.001
09:00ClosedClosedOff019.7939.710
09:30ClosedClosedOff019.8039.850.001
10:00ClosedClosedOff019.8040.110
10:30ClosedClosedOff019.8040.270.001
11:00ClosedClosedOff019.7140.580
11:30ClosedClosedOff019.7040.980
12:00ClosedClosedOff019.7041.060
12:30ClosedClosedOff019.6341.210
13:00ClosedClosedOff019.6041.300
13:30ClosedClosedOff019.6041.350
14:00ClosedClosedOff019.6041.440
14:30ClosedClosedOff019.5341.580
15:00ClosedClosedOff019.5041.680
15:30ClosedClosedOff019.5041.820
16:00ClosedClosedOff019.5041.930
16:30ClosedClosedOff019.5042.010
17:00ClosedClosedOff019.4642.140
17:30ClosedClosedOff019.4042.310
18:00ClosedClosedOff019.3542.430
18:30ClosedClosedOff019.3042.490.001
19:00ClosedClosedOff019.2342.430.001
19:30ClosedClosedOff019.2042.370
A Representative WD
HourDoor
(min)
Window
(min)
Fan
(min)
Occupants
(n)
Tair
(°C)
RH
(%)
WS
(m/s)
07:30ClosedClosedOff020.8735.120
08:00ClosedClosedOff020.8935.040
08:30ClosedClosedOff020.9534.660
09:00OpenOpenOff122.0231.460.003
09:30OpenOpenOff122.6131.010
10:00OpenOpenOff123.0831.140
10:30OpenOpenOff022.6232.860.023
11:00OpenOpenOff222.4034.260.064
11:30OpenOpenOff122.1734.620.143
12:00OpenOpenOff122.3033.370.159
12:30OpenOpenOff023.0829.710.059
13:00OpenClosedOff024.1128.050
13:30OpenClosedOff124.3227.450
14:00OpenClosedOff124.4826.180
14:30OpenClosedOff224.6123.790
15:00OpenClosedOff224.9823.660
15:30ClosedClosedOff125.7625.070
16:00OpenClosedOff125.9725.660
16:30OpenClosedOff126.0422.980
17:00OpenClosedOff124.6425.040
17:30ClosedClosedOff024.1927.200.002
18:00ClosedClosedOff023.9628.620
18:30ClosedClosedOff023.4929.890
19:00ClosedClosedOff023.1130.640
19:30ClosedClosedOff022.7631.370
Table 2. Total concentrations (TC), daily averages (DA) (mean value and standard deviations) and percentages (%) of pollen and fungal spores during the NWDs (from Saturday to Sunday) and WDs (from Monday to Friday) of the summer (20 June–14 August 2016) and winter campaigns (26 January–21 February 2017).
NWDs (from Saturday to Sunday)WDs (from Monday to Friday)
NWD
(N Days)
TC
(Particles/m3)
DA
(Particles/m3)
Percentages
(%) *
WD
(N Days)
TC
(Particles/m3)
DA
(Particles/m3)
Percentages
(%) *
Summer16 40
Pollen97.00.6 ± 1.22.01148.428.7 ± 53.198.0
Fungal Spores88.05.5 ± 7.73.36460.1161.5 ± 204.596.7
Winter8 19
Pollen7.00.9 ± 1.214.0104.35.5 ± 8.886.0
Fungal Spores209.426.2 ± 41.038.4797.342.0 ± 39.061.6
(*) Percentage of biocontaminants in field seasonal campaigns calculated on daily average.
Table 3. Average values and standard deviations of the variables Open Door (OD), Occupants (Occ), Open Window (OW), Fan On, Tair, RH, WS, Pollen, and Fungal Spores on 6-h averages.
OD
[0–1]
Occ
[%]
OW
[0–1]
Fan On
[0–1]
Tair
[°C]
RH
[%]
WS
[m/s]
Pollen
[Particles/m3]
Fungal Spores
[Particles/m3]
Mean0.130.154.883.8820.4239.560.001.2011.49
StDev0.250.2916.1515.682.177.190.013.4019.94
Table 4. Pearson cross-correlation coefficients R among the occupants’ behavior, microclimate variables, and the observed pollen and fungal spores.
ODOccOWFan OnTairRHWSPollenFungal Spores
OD1.00
Occ0.931.00
OW0.600.491.00
Fan On0.580.52−0.051.00
Tair0.730.730.330.451.00
RH−0.55−0.58−0.21−0.28−0.811.00
WS0.470.560.440.070.37−0.301.00
Pollen0.330.420.33−0.060.37−0.300.861.00
Fungal Spores0.370.400.29−0.030.35−0.150.580.651.00
Table 5. Coefficients of the three multivariate models and the Pearson correlation (R) for pollen.
MRallMRno_od-TairMRob
Intercept−9.262.490.48
Occ−0.80−0.2211.29
OD (0–1)−0.46//−6.90
OW (0–1)−0.02−0.020.00
Fan On (0–1)−0.04−0.03−0.05
Tair0.43////
RH0.03−0.05//
WS278.04277.86//
R0.890.880.549
Paverage0.320.220.18
Table 6. Coefficients of the three multivariate models and the Pearson correlation (R) for fungal spores.
MRallMRno_od-TairMRob
Intercept−152.89−7.087.14
Occ−14.5625.3119.79
OD (0–1)−50.64//34.70
OW (0–1)−0.40−0.10−0.17
Fan On (0–1)−0.58−0.28−0.56
Tair5.22////
RH1.390.35//
WS939.48845.37//
R0.700.620.50
Paverage0.070.250.22
Publisher’s Note: MDPI stays neutral with regard to jurisdictional claims in published maps and institutional affiliations.

