1. Introduction
Bicycle sharing systems (BSSs) are shared bicycle fleets allowing short-term public use [
1]. Since the late 1990s, when only a handful of bicycle sharing systems existed, the number of BSSs around the world has increased rapidly, growing to almost 3000 active systems by 2020 [
2]. Many cities around the world have introduced BSSs as part of a wider sustainable transport strategy and cycling promotion. The three Southern European island cities of Limassol (Cyprus), Las Palmas de Gran Canaria (Canary Islands, Spain) and the Valletta conurbation (Malta) exhibit characteristics considered to be barriers to cycling, such as hot summers and high humidity, hilliness and a car-oriented culture and infrastructure [
3]. Furthermore, cities in Southern Europe, especially those on islands and the coast, need to provide for the seasonal influx of tourists, especially during the summer months, in addition to daily residents’ movements for work, education and leisure [
4]. Although cycling’s modal share is low thus far in these cities (<1%), bicycle sharing systems and policies promoting cycling have started to emerge here too, and the three cities can be classified as ‘starter’ cycling cities [
3].
Most BSS research has focused on large cities across the globe (e.g., [
5] for a review), but few studies have looked at the dynamics of these schemes in smaller towns and cities [
6]. Rixey [
7] suggested extending the regression analysis of variables influencing BSS use to include a more diverse range of systems in terms of size and context. The aim of this study is to analyze BSS use in a particular context, that of Southern European island cities, as only limited research has focused on the analysis of BSS use using trip data in small- and medium-sized cities in Southern Europe [
8,
9], where first steps are now being taken to promote cycling as a mode of transport, e.g., [
3,
10]. Specifically, in this paper attention is paid to the inclusion of temporal variables in a linear mixed model, to assess the influence of weather variables and tourist numbers on BSS use, as these are expected to show an influence on the usage of the BSS in these cities’ contexts [
11]. Furthermore, the use of stations as an origin or as a destination is taken into account in the linear mixed models, to understand which spatial and temporal factors particularly influence BSS station use as an origin or destination in Limassol, Las Palmas de Gran Canaria and Malta. This analysis provides insights into factors that encourage or inhibit BSS use and can aid the formulation of policy recommendations to optimize system use and guide future extension of the systems to further promote cycling in these ‘starter’ cycling cities for both residents and visitors.
In the second section of this paper, an overview of the literature on this topic is provided. In
Section 3, the case studies are introduced.
Section 4 discusses the methodology and datasets used. In
Section 5, the analysis of the datasets, through bivariate correlation analysis and the constructed linear mixed models, is presented. The results are discussed in
Section 6.
Section 7 concludes the paper.
2. Literature Review
The first experiments with shared public bicycles were the free white bicycles in Amsterdam in the 1960s, and later in the 1990s using coin-based payment systems, for example in Copenhagen [
12]. However, bicycle sharing systems only really became a commonplace mobility service in the twenty-first century, with payment linked to users’ credit cards and access to rentals through digital terminals or mobile apps. These are considered third-generation bicycle sharing systems [
5]. Further innovations, sometimes attributed to a fourth generation of BSSs, include new technological features such as dockless BSSs with GPS-tracked smartbikes, transit card integration and electric bicycles [
13]. Third-generation BSSs, the focus of the analysis in this paper, produce different forms of data [
14,
15]: trip or flow data, containing time varying origin–destination matrices; and point or stock data, with information about the station locations and statuses.
Evidence from a number of cities–Melbourne, Brisbane, Washington DC, Minnesota and London–shows that the average BSS trip duration is between 16 and 22 min [
16,
17]. The pricing structure of most BSSs, often with a flat fee interval (FFI) of 30 min, encourages short journeys [
18]. Average trips per day or trips per day per bicycle (TDB), to account for the system size and number of available bicycles, is used as a metric to compare the performance and usage of bicycle sharing systems across cities [
3,
5]. Round trip journeys, beginning and ending at the same station, are generally associated with leisure and weekend trips [
17]. Casual users tend to make longer trips than subscription members [
19], with the latter more likely to use the BSS for daily trips related to commuting [
5].
Based on previous research into the influence of spatial and temporal factors on BSS use, the following are some key findings. Areas with higher population density, indicating residential areas, are generally considered to be trip origins, whereas areas with higher job density, retail density, tourist attractions and parks and leisure locations generally function as trip attractors [
20]. Evidence from Barcelona and Seville, Spain [
11], and Rethymno (Crete), Greece [
21], show that high BSS use is found in areas with a high land use mix, with many points-of-interest (POIs), including commercial and recreational activities, as well as places of historic interest. BSS use is generally positively correlated with nearby bicycle lanes and paths [
17,
22,
23]. BSS use is generally positively associated with nearby public transport, functioning as a complementary form of mobility [
24,
25], but there are also cities where a substitution effect was found, where the BSS is competing with other forms of public transport [
26]. The spatial coverage or extent of the BSS also influences the usage, as bicycle sharing systems are often geographically limited, focused on the city center and destinations such as university campuses and business districts [
27,
28]. The characteristics of the network, for example the distance between stations and the center of the system (the mean position based on the location of all BSS stations), the distance to other stations and the number of stations within a certain radius, can influence system use, with findings showing higher BSS use at stations closer to the central business district (CBD) and those in proximity to other BSS stations [
7,
23,
29]. Socio-demographic and economic characteristics of the neighborhoods at the station location, such as age and level of education, can also influence the usage of the BSS [
7,
29]. Although in principle, warm and sunny weather has a positive effect on levels of cycling and BSS use, studies showed that temperatures above 30 °C can act as a deterrent and result in a decrease in BSS use [
30,
31]. Although the influence of POIs and tourism destinations within a buffer zone around BSS stations have been assessed in certain contexts, e.g., in case studies of Barcelona and Seville [
11] and Santander (Spain) [
8], the influence of tourism numbers on BSS use has not been evaluated in such analyses thus far.
This study builds on previous research looking at spatial and temporal factors influencing BSS use. Earlier work based on the same datasets includes an analysis of the influence of spatial factors on BSS use in Las Palmas de Gran Canaria [
10] and a descriptive analysis of the influence of spatial factors on the top five most intensely used stations in the BSS, as well as temporal variation in BSS use across the year in Limassol, Las Palmas de Gran Canaria and Malta [
32]. The latter paper describes the spatial datasets used in the analysis in full detail. The results showed that the presence of cycling infrastructure, particularly next to the beach or on promenades in these coastal cities, where elevation is low, showed a positive relationship with BSS use. A higher count of POIs, such as cafés and restaurants, also showed positive associations with BSS use, whereas the presence of university buildings did not influence BSS use, indicating the university community is not a dominant user group in these cities. The presence of public transport hubs (bus stations, ferry landing sites) showed a positive relationship in Las Palmas de Gran Canaria and Malta, but not in Limassol, where the modal share of public transport is very low [
32]. In this paper, the influence of spatial and temporal factors, specifically looking at station use as an origin or destination, is investigated in the specific context of Southern European island cities with high summer temperatures and large numbers of visiting tourists.
3. The Case Studies
This section introduces the three BSSs investigated in this study, located in Limassol (Cyprus), Las Palmas de Gran Canaria (Canary Islands, Spain) and Malta.
Table 1 summarizes some key characteristics of the BSSs, such as the number of stations and bicycles, operating hours and the fee structure, including the flat fee interval (FFI). The land use characteristics and location of BSS stations are presented per city, for Limassol in
Figure 1, Las Palmas de Gran Canaria in
Figure 2 and Malta in
Figure 3. Information on the characteristics of the BSS and operational aspects were obtained through personal communications with the BSS operators and from their respective websites. All three BSSs are dock-based systems with regular bicycles. Although the effect of station capacity on the usage of the BSS (i.e., the availability of bicycles and of free docking spaces) has been highlighted as having a substantial influence on BSS use, e.g., [
33], this was not considered in this analysis as it was not deemed to be as relevant in the case studies presented here. In two out of the three cities (Limassol and Malta), BSS users are permitted to lock bicycles near the BSS station when the docks are full. Daily redistribution of bicycles in all three cities and lower intensity of use than in other BSSs experiencing capacity issues result in very limited issues with completely full or empty stations.
Limassol is the second-largest city in Cyprus, located on the island’s southern coast, with 100,000 inhabitants in the Limassol municipality, and around 200,000 inhabitants living in the greater urban conglomeration [
34]. Limassol is home to the largest port in Cyprus, it is one of the main industrial hubs, and it is also a well-known tourist destination. The campus of the Cyprus University of Technology is located in the city center. The majority of hotels are located towards the eastern end of the city, near Amathus. In 2018, the modal share by private car was 91.8%, by bus 1.8%, on foot 5.7% and by bicycle 0.7% [
35]. Private operator Nextbike Cyprus introduced the BSS in Limassol in 2012, with 170 bicycles and 23 active stations in 2019, which are primarily concentrated in the city center and along the coastal promenade.
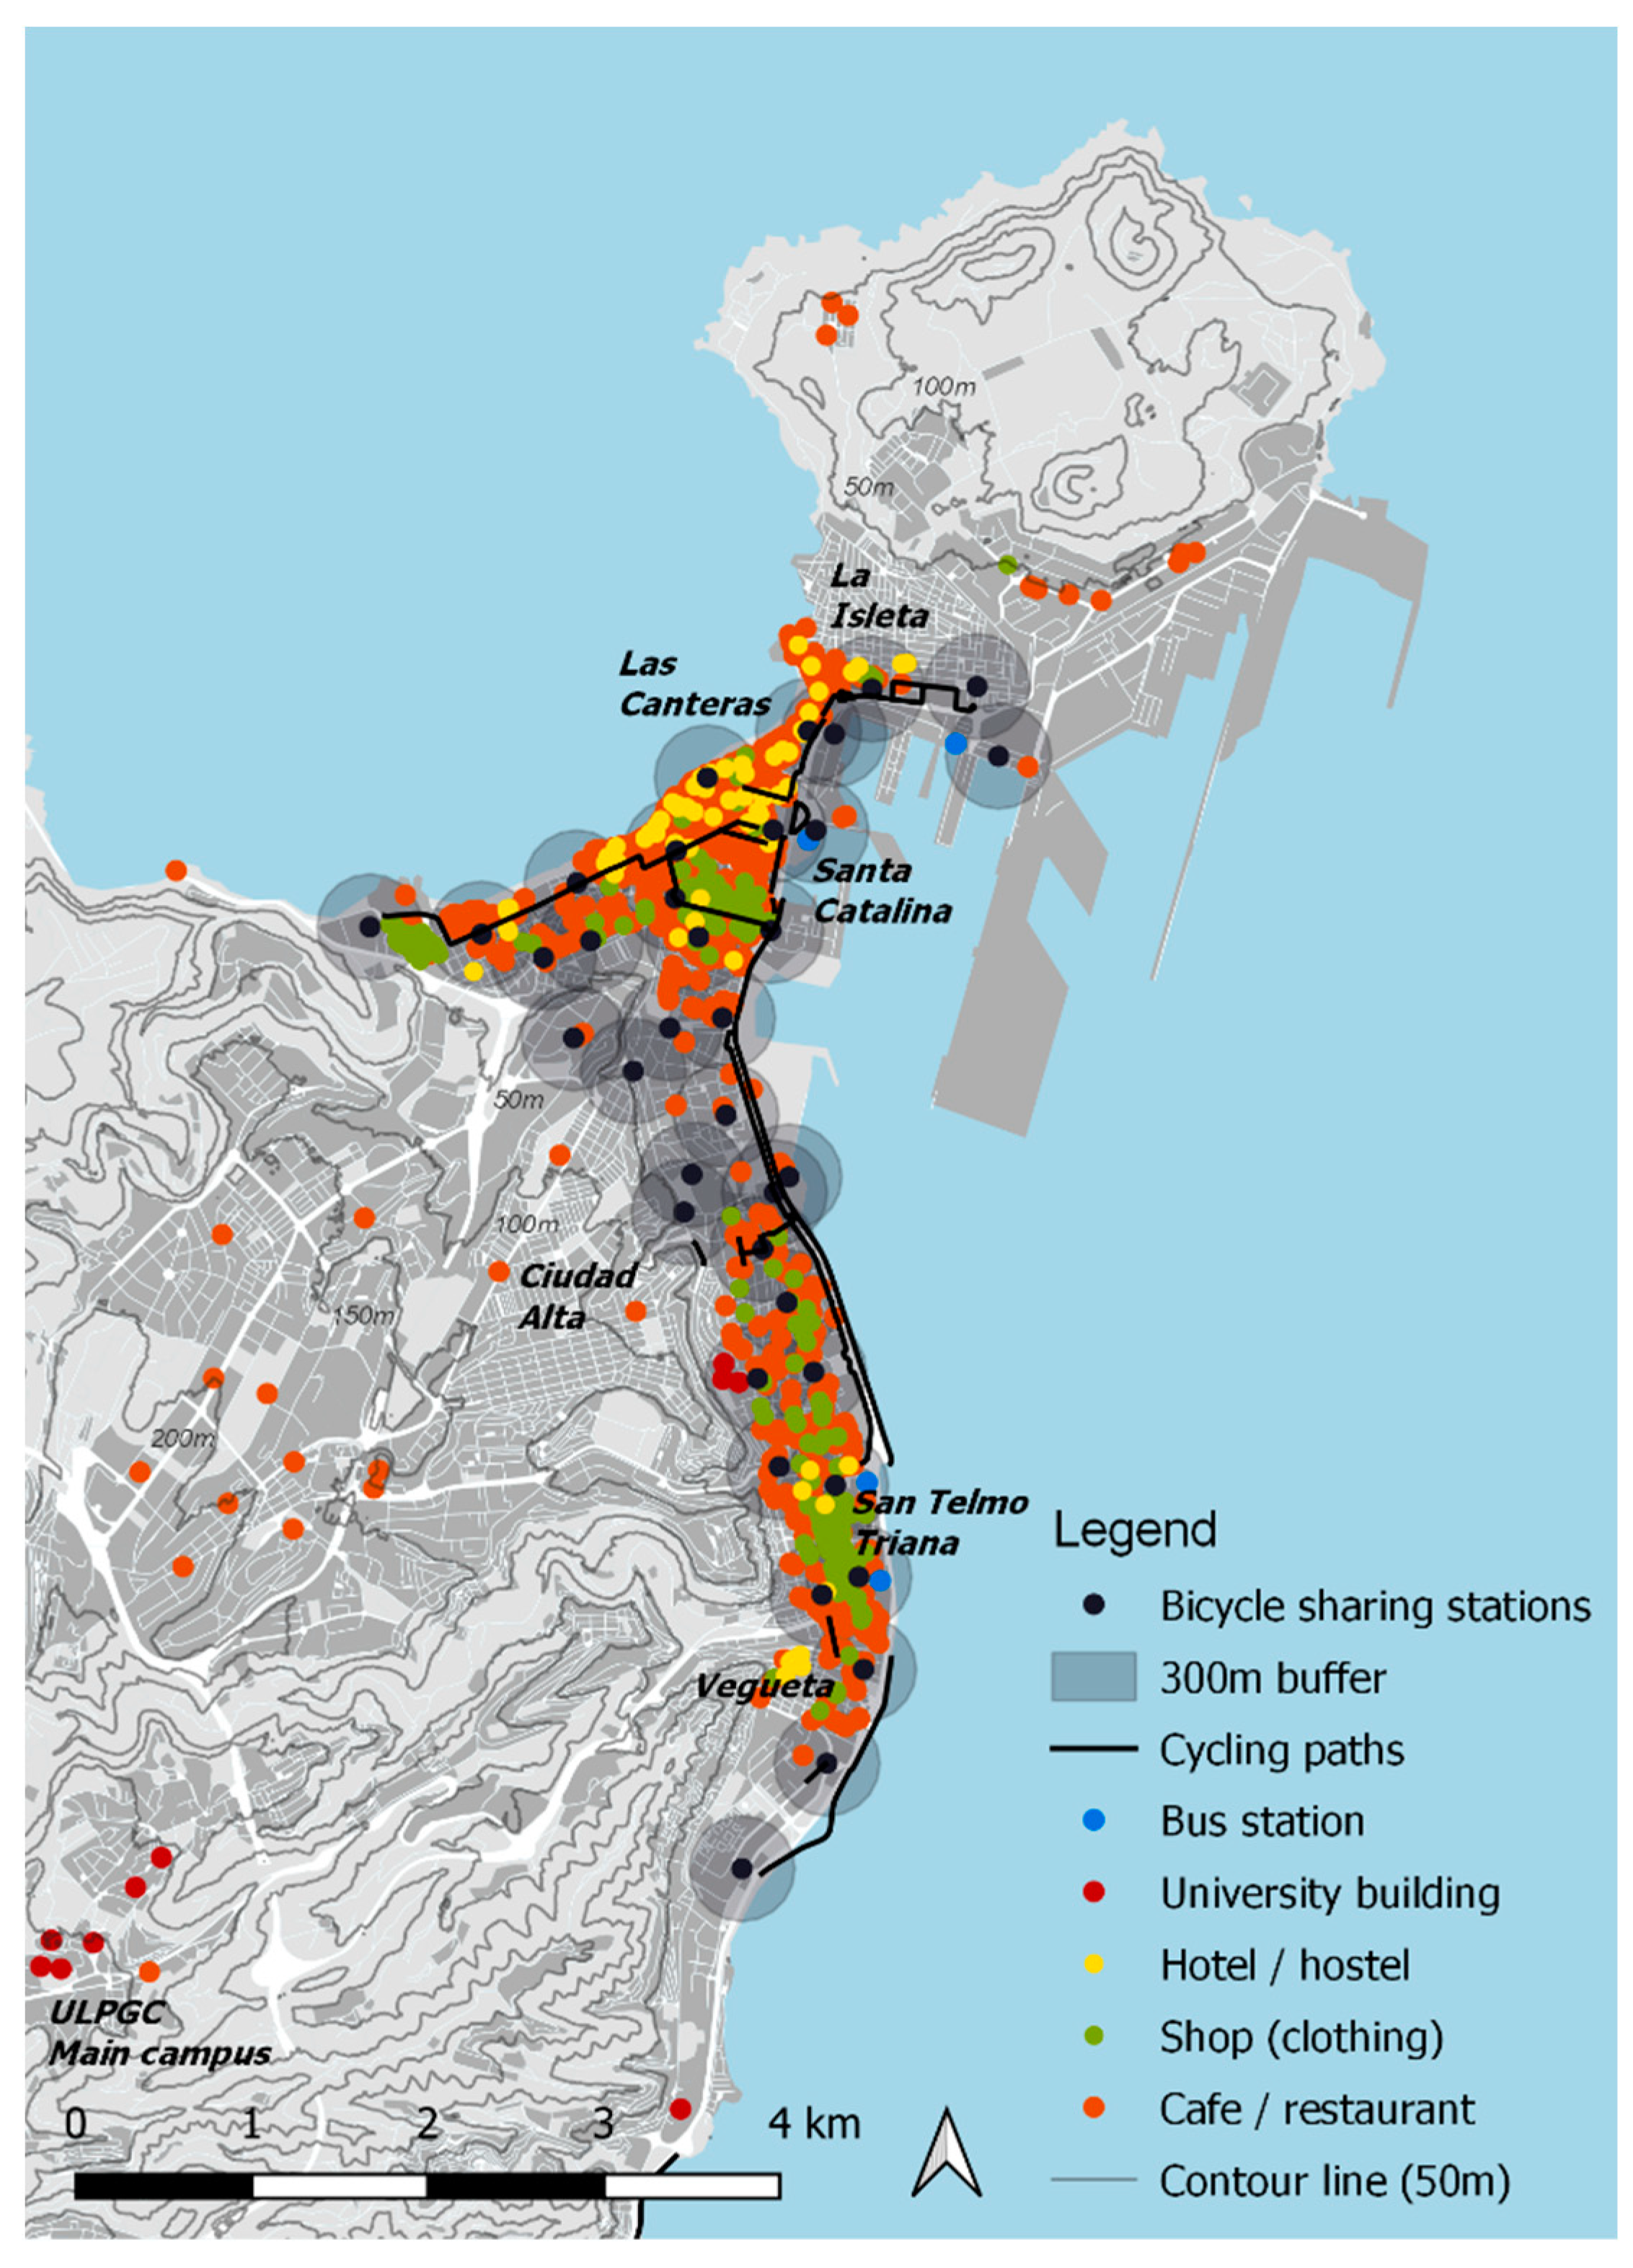
Las Palmas de Gran Canaria is the largest city and capital of Gran Canaria. The city is home to 379,925 inhabitants [
36]. The city has two main city centers: firstly, the area around San Telmo and its bus station and secondly, the area around the Santa Catalina park and bus station. The main port area is located in the northeast of the city. The city has low elevation differences along the coast, but elevation differences of up to 300 m further inland, in the residential neighborhoods in and around Ciudad Alta. The University of Las Palmas de Gran Canaria (ULPGC) is located around 10 km south of the city, in the hills of Tafira. The main touristic area in the city is located close to the northern city center, around Santa Catalina and the Las Canteras beaches. In 2012, the modal share by private car was 63%, by bus 13%, on foot 15% and by bicycle 0.5% [
37]. SAGULPA, the municipal company responsible for parking management, introduced the BSS Sítycleta in April 2018, with around 375 bicycles and 37 stations, all located within the lower part of the city.
The Valletta conurbation in Malta refers to the urban area around the capital city Valletta, encompassing the Northern and Southern Harbor districts, which together are home to a population of 205,768 inhabitants [
38]. The area includes the main tourist and entertainment hub at St Julian’s; residential, commercial and employment centers in Msida, Gżira and Sliema; and the University of Malta in Msida. In 2010, the modal share by private car was 75%, by bus 11%, on foot 7.5% and by bicycle 0.3% [
39]. In Malta, private operator Nextbike Malta introduced a bicycle sharing system in late 2016, with 60 stations and over 400 bicycles in 2019. The majority of the stations are located around the central urban area north of the capital Valletta, but there are other stations around the island, including a cluster in St Paul’s Bay and around the airport.
Figure 1.
BSS stations, cycling paths, points-of-interest (POIs) and elevation in Limassol (drawn by author; adapted from [
40]).
Figure 1.
BSS stations, cycling paths, points-of-interest (POIs) and elevation in Limassol (drawn by author; adapted from [
40]).
Figure 2.
BSS stations, cycling paths, POIs and elevation in Las Palmas de Gran Canaria (drawn by author; adapted from [
10]).
Figure 2.
BSS stations, cycling paths, POIs and elevation in Las Palmas de Gran Canaria (drawn by author; adapted from [
10]).
Figure 3.
BSS stations, cycling paths, POIs and elevation in Malta (drawn by author).
Figure 3.
BSS stations, cycling paths, POIs and elevation in Malta (drawn by author).
4. Methodology and Datasets
Using a one-year dataset of BSS trip data (April 2018–March 2019), including the location of the stations, time and date of bicycle rentals and returns and anonymous user IDs, the datasets were prepared for analysis. Trips under 2 min and over 500 min were removed, as they likely represented a mistake or malfunctioning of the bicycle or registration system [
8,
16]. The datasets consisted of 17,532 trips in the Limassol dataset, 162,871 trips in the Las Palmas de Gran Canaria dataset and 37,306 trips in the Malta dataset.
Two dependent variables were considered in the analysis: the total monthly counts of trip origins (COUNTO) and trip destinations (COUNTD), respectively, at a station location, to see if there is any difference in the factors influencing the frequency of use of a station as a trip origin and as a trip destination. Relevant land use, socio-economic and network variables were identified through the literature review to include as independent variables. Data were collected from secondary sources for the three case-study cities. Data on the location of points-of-interest (POIs), such as bus stations (LU_BUS), shops (LU_SHOP), hotels (LU_TOUR), cafés/restaurants (LU_CAFE) and university buildings (LU_UNI), were extracted from the OpenStreetMap (OSM) dataset [
41]. The value included for these variables was based on the counting of these POIs (e.g., the number of hotels, cafés, etc.) within a 300-m Euclidian distance buffer around the station location, the most commonly used measure for a walkable distance to BSS stations, e.g., [
42]. The distance from a station to the nearest bus station (LU_DISTBUS) and the nearest university building (LU_DISTUNI) was also included. The road network and the location of cycling infrastructure was also obtained from the OSM dataset, as well as from secondary sources for each city: from the Sustainable Urban Mobility Plan of Limassol [
35], from the Bicycle Master Plan for Las Palmas de Gran Canaria [
43] and from the Malta Transport Master Plan 2025 [
39] for Malta. The road network was used to compute the number of nodes within the 300 m buffer around stations (LU_NODES) and the cycling infrastructure was used to calculate the length of the cycling path/lane within the 300-m buffer (LU_LEN_CYC) and the distance from the stations to the nearest cycling path/lane (LU_DIST_CYC). Data on residential, commercial/industrial and park land use, as well as the location of the coastline, were derived from the Urban Atlas (UA) 2012 dataset of the EU’s Copernicus Land Monitoring Service [
44]. The percentage of these different types of land use present within the 300-m buffer were computed as percentages (LU_RES, LU_COM and LU_PARK, respectively). The location of the coastline was used to compute whether a promenade or beach was present within the 300-m buffer around a station as a dummy variable (LU_BEACH) and to compute the distance from a station to the nearest coastline (LU_DISTSEA). Information on elevation at the station locations (ELEV) was obtained from the digital terrain models (DTMs) of Cyprus [
45], the Canary Islands [
46] and Malta [
47]. Socio-economic data, the population density (POP_DENS), percentages of aging population (AGING_POP), foreign population (FORGN_POP), population with a tertiary degree (PERC_EDU3) and the gender quotient (GEND_RATIO) were extracted from the 2011 Population Census of Cyprus, with data on the neighborhood level for Limassol [
48], for Las Palmas de Gran Canaria from statistical data on census tract and the neighborhood level [
49,
50,
51], and for the Valletta conurbation in Malta from the 2011 Population Census of Malta and the 2014 Demographic Review at the local council level [
38,
52]. To account for the influence of the shape and size of the BSS network, the distance of the stations to the center of the BSS was calculated (DIST_MEAN) and the number of BSS stations within a 600-m radius (COUNT_STAT) and 1200-m radius (COUNT_STA2) around the stations was computed to capture the centrality and connectivity of a station within the network. A detailed overview of the spatial dataset was presented in a table with definitions and values for each variable per city in Maas et al. [
32].
Data on tourist arrivals and weather factors were included as temporal variables. The temporal variables were collected on a monthly basis (visitor numbers), or averaged (temperature) or aggregated (rainfall) over the period of a month. Tourism data were collected from the Cyprus national statistical service [
53] for Limassol, from the statistical institute for the Canary Islands [
54] for Las Palmas de Gran Canaria and from the National Statistics Office [
55] of Malta. Since there were no data available specifically for the number of tourists staying in or visiting Limassol, monthly figures of tourist arrivals in the Republic of Cyprus (TOT_TOUR) were used as a proxy for the number of tourists visiting Limassol. Total tourist numbers equated to just under 4 million for all of the Republic of Cyprus in 2018, with around 13% of those visiting Limassol. In Las Palmas de Gran Canaria, around 125,000 tourists stayed in the city. In Malta, in 2018, 2.7 million tourists arrived, with the vast majority of visitors staying in or visiting the Valletta conurbation. Weather variables were extracted from reports of the relevant meteorological institutes to collect values of average monthly maximum temperature (AVG_MAXC) and total monthly precipitation (TOT_RAIN). Weather variables for Limassol were extracted from reports of the Department of Meteorology for the weather station at Limassol New Port [
56], from the Meteorological office at the Las Palmas de Gran Canaria airport [
57] and from the Met Office for Malta [
58]. Average yearly rainfall in Limassol is around 500 mm, in Las Palmas de Gran Canaria around 150 mm, and in Malta around 550 mm. The values for the cities are presented in
Figure 4a (Limassol),
Figure 4b (Las Palmas de Gran Canaria) and
Figure 4c (Malta), with the average maximum temperature (AVG_MAXC) presented in °C (left
y axis) and rainfall (TOT_RAIN) and tourist numbers (TOT_TOUR) expressed as a percentage of the yearly total value (right
y axis). It can be observed that Limassol and Malta show a similar profile, with the highest temperatures, lowest rainfall and highest tourist numbers in the summer months. The strongest contrast between the summer and winter seasons is found in Limassol. In Las Palmas de Gran Canaria, temperature variation is less extreme throughout the year, and tourist numbers are slightly higher in the winter rather than in the summer period, due to the mild winter temperatures in the Canary Islands when it is colder in the rest of Europe. Rainfall is also concentrated in the autumn and winter period.
To incorporate the effect of any system expansion, the BSS operators were asked to indicate if and where stations were added during the one-year period covered by the datasets. In Limassol, there was no change in the number or location of the stations. In Las Palmas de Gran Canaria, one station was added in May 2018, one in September 2018, one in October 2018 and one in February 2019. In Malta, two stations were added in October 2018. Monthly values for the temporal variables for these new stations were added to the dataset from the month of their installation onwards.
Bivariate correlation, using the Pearson correlation coefficient r, was used to understand the strength and direction of the linear relationship between the independent spatial and temporal variables and the dependent variables COUNTO and COUNTD. As the datasets included repeated observations per station (monthly counts of station use as origin and destination; monthly COUNTO and COUNTD), the independence assumption of generalized linear models was not met. Therefore, linear mixed models were employed to estimate the effects of the independent variables on the BSS use and to explain variations in BSS use over time, while accounting for multiple observations per station.
5. Results
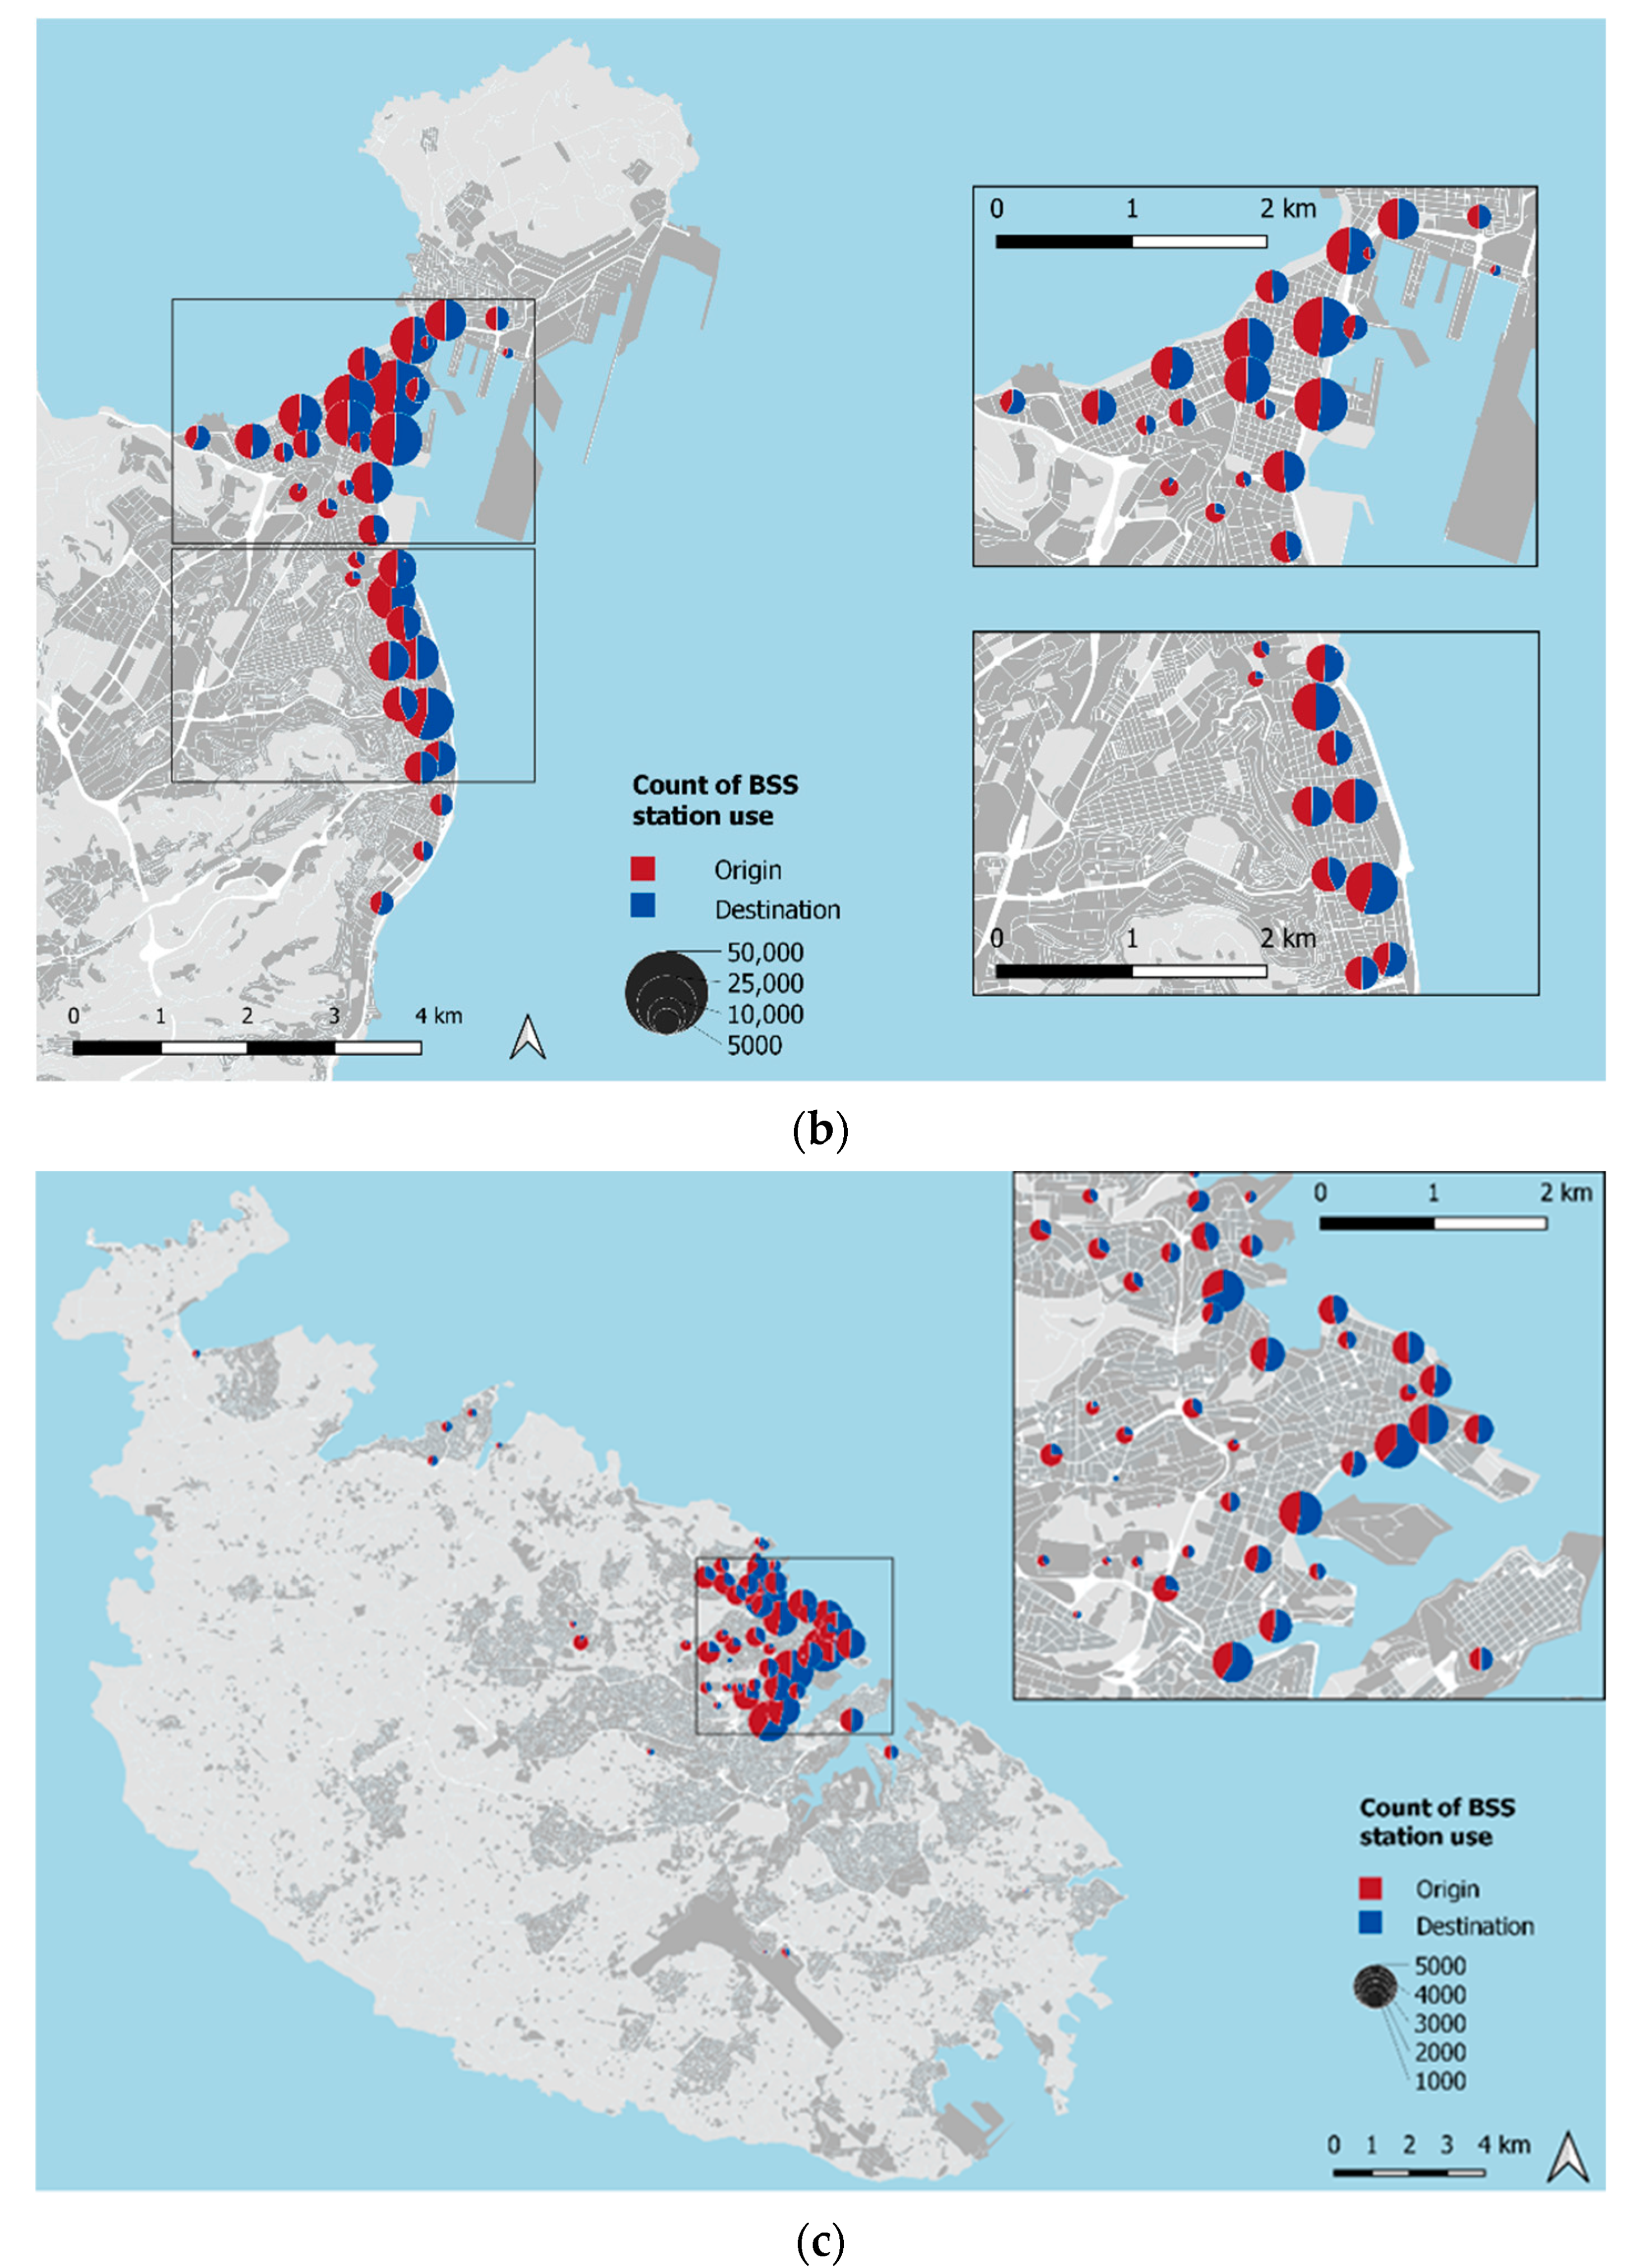
The use of BSS stations as origins and destinations, aggregated over the period of a year, in the three case study cities are shown in
Figure 5a for Limassol,
Figure 5b for Las Palmas de Gran Canaria and
Figure 5c for Malta (A video with monthly use of the BSS stations as origins and destinations, over the period of a year (April 2018–March 2019) can be viewed here:
https://youtu.be/_C-kEFphbBU, 15 November 2019, see
supplementary material). In Limassol, BSS use was visibly concentrated along the promenade, between a string of six stations stretching from the Old Port near the city center and Limassol Marina towards the eastern part of the city. In Las Palmas de Gran Canaria, BSS use was more evenly spread, although two clusters around the two main city centers are evident, with lower BSS use at stations on the periphery of the system. In Malta, BSS use was concentrated in the Northern Harbor area, north of Valletta, especially at the stations located along the coastline, with very limited use of the isolated stations elsewhere on the island. The spatial pattern of BSS use in Malta showed the strongest visible difference between station use as origin and destination, with more stations with dominant use as an origin located further inland, at a higher elevation, and more stations used as a destination located in the low-lying parts of the urban area, near the coastline.
Descriptive statistics, to characterize the BSS use in the cities, are presented in
Table 2. From the number of trips per day per bicycle (TDB), it is evident that the BSS in Las Palmas de Gran Canaria saw a higher magnitude of use than the BSS in Limassol and Malta. Although a TDB of at least 1.0 (representing 1 trip per day per bicycle) has been mentioned as an important psychological minimum of TDB [
59], lower BSS usage rates have been observed in many BSSs, even where schemes have quite a lot of subscribed members [
60,
61]. This can also be observed from the results presented in
Table 2, where there is around a factor of 10 difference in the number of trips in Limassol and Las Palmas de Gran Canaria, whereas there is only a factor of three difference in the number of active users. The shorter median trip durations in Las Palmas de Gran Canaria and Malta indicate that the predominant use was for transport. The high share of round trips and weekend use, as well as the longer median trip duration, indicate that Limassol’s BSS was dominated by leisure use [
32].
Bivariate correlation analysis was used to determine the relationship strength and direction between each dependent variable and independent variable (see
Table 3). Land use, socio-economic, network and temporal variables were included. The correlation analysis, using the Pearson correlation coefficient
r, showed that a number of the independent variables were significantly correlated with BSS use at the 5% or 1% level. Most variables showed the expected relationship, based on results from BSS use in other cities as identified in the literature review, but some variables showed opposite effects for the different case-study cities (e.g., PERC_EDU3, the percentage of population with a tertiary education, and TOT_RAIN, the total rainfall).
From the bivariate correlation analysis, a number of variables showed significant effects with the same direction and similar strength across the three cities. The number of cafés and restaurants (LU_CAFE) within a 300-m buffer around a BSS station showed a positive and significant correlation in all three cities. The presence of the beach or promenade (LU_BEACH) within a 300-m buffer around BSS stations was strongly positively and significantly correlated in all three cities. The distance to the coastline (LU_DISTSEA) showed a similar result, where the negative association indicates that the further away from the coastline, the less BSS use there was. Elevation (ELEV) showed a strong negative association with BSS use, both for origin and destination stations, in all three cities. A stronger negative association was found with the station use as a destination than as an origin in Las Palmas de Gran Canaria and Malta, where elevation differences are greater than in Limassol. Higher population density (POP_DENS) and a higher percentage of foreign population (FORGN_POP) both showed a positive relationship with BSS use in the three cities. The network variables showed similar results for the three cities: a negative relationship with distance (DIST_MEAN); the further away from the center of the BSS, the less use, particularly for station use as an origin, and a positive relationship with the count of other BSS stations within a 1200-m (COUNT_STA2) buffer around the station. Other variables showed mixed results for the cities. The number of shops (LU_SHOP) in the station buffers showed a positive relation with the use of a BSS station as an origin and destination in Las Palmas de Gran Canaria and Malta. In Limassol, however, the association was negative, both for origin and destination use of a station. Cycling infrastructure (LU_LEN_CYCLE) showed a positive effect in the two cities with cycling paths in the city center and near the BSS stations in Limassol and Las Palmas de Gran Canaria. In Malta, however, a negative correlation was observed. This can be explained by the near total absence of cycling paths in the urban area where the BSS is present, with the only cycling infrastructure located outside of the urban area, where BSS usage is low compared to the center of the conurbation. The percentage of the population with a tertiary education (PERC_EDU3) and the percentage of the population over 65 years (AGING_POP) showed a positive relationship in Las Palmas de Gran Canaria and Malta, but a negative association in Limassol. BSS use in Limassol and Malta had a negative relationship with total rainfall (TOT_RAIN), highlighting higher use in the extended summer season. In Las Palmas de Gran Canaria the association with total rainfall was positive. As there is very limited rainfall in Las Palmas de Gran Canaria, this result shows how in this case it does not act as a deterrent, and likely represents months in the year with higher volumes of cycling, because of more cycling for commuting purposes (non-holiday months) and higher visitor numbers.
Certain correlations only showed significance in one or two of the case-study cities. A higher percentage of residential land use (LU_RES) showed a positive association in Malta for station use as an origin and destination, and in Las Palmas de Gran Canaria only for origin use. A higher percentage of industrial/commercial land use (LU_COM) in the buffer around the stations showed a negative association with BSS use in Las Palmas de Gran Canaria and Malta. The percentage of park land use (LU_PARK) showed a positive association in Limassol. The number of hotels (LU_TOUR) in the buffer showed a positive and significant relationship in Las Palmas de Gran Canaria and Malta. Distance to the nearest bus station (LU_DISTBUS) showed a negative relationship with both origin and destination station use in Las Palmas de Gran Canaria and Malta, indicating that the nearer to a bus station, the higher the BSS use. This effect was not observed in Limassol, where the modal share of public transport use is lower. The presence of the university within a 300-m buffer around a station (LU_UNI) showed a significant negative association in both Limassol and Malta, indicating that BSS use in the vicinity of the university campuses was low, contrary to what has been found in other cities, where the university community represents a key BSS user group [
62]. Surprisingly, the distance from the university (LU_DISTUNI) also showed a negative association with BSS use in Limassol and Malta, indicating that the further away from the university, BSS use is lower. This can be explained by the fact that the university campus in both cities is located in or near the city center, and the distance variable is reflecting the association with the city center rather than with the university campus as such. In Las Palmas de Gran Canaria, no significant relationship was present, as the main university campus is located outside of the city.
The count of nodes in the road network (LU_NODES), as an expression of the density of the land use, showed a positive association in Las Palmas de Gran Canaria and Malta, but not in Limassol. This further underlines how the predominant use of BSSs in the former two cities was cycling for transport, in areas with a higher urban density, whereas BSS use in Limassol was characterized more by leisure use, for exercise and for fun, predominantly along the coastline. The quotient of male and female residents at the station locations (GEND_RATIO) showed a significant negative relationship with BSS use in Las Palmas de Gran Canaria, indicating that areas with a higher percentage of male population had lower BSS use. No significant association was found in Limassol or Malta. In terms of temporal variables, the results for Limassol and Malta were similar, but for Las Palmas de Gran Canaria, with a different tourism pattern and less seasonal weather variation, the result was different. A positive relationship was found with the total number of tourists (TOT_TOUR) and the average maximum temperature (AVG_MAXC) for Limassol and Malta, but not for Las Palmas de Gran Canaria.
Correlation plots were created for the spatial variables and for the temporal variables to examine the collinearity between independent variables, to avoid including two or more multi-collinear variables in the different variations of the linear mixed models, before settling on the best model fit. A threshold of ±0.7 was assumed to indicate multi-collinearity [
63]. Multi-collinearity was found between certain variables that both showed a significant association with BSS use (e.g., LU_TOUR and LU_CAFE in Las Palmas de Gran Canaria, and LU_DISTSEA and FORGN_POP in Limassol). In some cases, multi-collinear variables took each other’s place in the COUNTO versus COUNTD models (e.g., LU_DISTSEA and LU_BEACH in Malta). The temporal variables also showed multi-collinearity. In the Limassol dataset there was a strong correlation between TOT_RAIN and both TOT_TOUR and AVG_MAXC, from which only the first variable was retained, as it showed the strongest relationship. In Las Palmas de Gran Canaria, there was a relatively strong correlation between TOT_TOUR and TOT_RAIN (just below the threshold of 0.7), but the former did not show significance in the models when included, and is thus not present in the final models. There was a strong correlation between the total visiting tourists (TOT_TOUR) and the average maximum temperature (AVG_MAXC) in the Malta dataset, and the latter was retained in the models.
Several iterations of the linear mixed models for COUNTO and COUNTD, including only the station numbers (STATION_NU) as a random effect, or both station number and month (MONTH) as random effects, were tested in random intercept models, based on different combinations of the variables that showed the strongest influence and significance in the bivariate correlation analysis. Effort was made to balance the maximum predictive power of the model with a parsimonious design, while ensuring that variables followed the expected direction of influence and were statistically significant at least at or below the 0.05 level. A better model fit was obtained by only including the stations as a random effect. The selected random intercept models were compared to a null model to confirm the significance of the model as a whole (
p < 0.05) and a smaller Akaike information criterion (AIC) value was used to confirm the best model fit. The final linear mixed models, including the normalized coefficient estimates, standard errors and
p-values are presented in
Table 4 for Limassol,
Table 5 for Las Palmas de Gran Canaria and
Table 6 for Malta. The variance and standard deviation of the random effects are reasonable values, and the standard errors of the fixed effects are all relatively small, smaller than the coefficient estimates, which indicate a good model fit.
The linear mixed models for Limassol (
Table 4) showed a strong positive impact of the presence of the beach or promenade in the 300-m buffer around stations (LU_BEACH) on BSS use. The length of cycling infrastructure (LU_LEN_CYC) within the station buffer also had a positive relation with BSS use. The distance from the center of the BSS showed a negative association with BSS use, indicating that most trips took place at the stations closer to the center of the BSS. The count of hotels and hostels within a 300-m buffer around stations (LU_TOUR) showed a negative relation, suggesting that the system is not dominated by use taking place in the area with most tourist accommodation. Total rainfall (TOT_RAIN), the temporal variable that showed the strongest association with BSS use, showed a negative relationship, with more BSS use in months with less rainfall. In the COUNTD model, the variable of the count of shops within a 300-m buffer around the stations is negatively associated with use of the stations as a destination, confirming that BSS use is not positively associated with shopping or running errands, but is used for leisure purposes, away from areas with a higher concentration of shops. The density of the road network (LU_NODES) shows a positive association in the COUNTD model, indicating that trips end more frequently in areas with higher urban density.
The linear mixed models for Las Palmas de Gran Canaria (
Table 5) showed a strong positive association with the length of cycling paths within a 300-m buffer around the stations (LU_LEN_CYC). The gender quotient showed a strong negative association in both the COUNTO and COUNTD models, indicating that a lower percentage of males in the M/F ratio is associated with higher station use. This is contrary to most findings of BSS in other cities, e.g., [
5]. Whether this is indeed due to more frequent female use or capturing another dimension of the neighborhood characteristics is not clear. The temporal variables, the average maximum temperature (AVG_MAXC) and total rainfall (TOT_RAIN), both showed a positive relationship with BSS use. The presence of tourist accommodation within the stations’ buffers (LU_TOUR) showed a positive association in the COUNTO model. As LU_TOUR was highly correlated with LU_CAFE, the count of cafes/restaurants (
r = 0.768), this variable is indicative of areas with leisure and entertainment facilities associated with the use of stations as an origin, especially in the area around Las Canteras and Santa Catalina, which draws both local residents and tourists to enjoy the beach and city life [
10]. The distance from the nearest bus station (LU_DISTBUS) shows a negative association in the COUNTD model, where a longer distance to the bus station is associated with less use of BSS stations, highlighting the positive relationship between BSS use at a station as a destination and public transport use.
The linear mixed models for Malta (
Table 6) show a positive association with the presence of shops in the 300-m buffer around stations (LU_SHOP) and a negative relationship with the distance from the center of the BSS (DIST_MEAN), highlighting the higher use of the BSS in the central urban area, close to facilities for shopping and services. The temporal variables show a positive relationship with the average maximum temperature (AVG_MAXC) and a negative association with total rainfall (TOT_RAIN), with lower BSS use in the winter months, with lower temperatures and more rainfall, and higher BSS use in the extended summer season. A higher percentage of industrial/commercial land use (LU_COM) shows a negative association with use of BSS stations as an origin. LU_COM has a high negative correlation with LU_RES (
r = −0.654), indicating that use is more influenced by residential land use (as also seen in the bivariate correlations between COUNTO/D and LU_RES in
Table 3). The effect of the proximity to the coastline or beach/promenade is present in both models, but captured through two different variables: in the COUNTO model there is negative association with the distance to the coastline (LU_DISTSEA), with lower BSS use further away from the coastline, whereas in the COUNTD model this is included as a positive association with the presence of the beach/promenade within the 300-m buffer around the stations.
A comparative analysis of the variables included in the different models, shows that the distance from the center of the BSS, DIST_MEAN, had a negative association with BSS use in Limassol and Malta. LU_TOUR, the count of hotels, showed a negative association in Limassol, but a positive one in Las Palmas de Gran Canaria (for stations as an origin). The negative association in Limassol can be explained by a predominance of BSS use by local residents, not tourists, as well as the fact that many of the hotels and the main tourist area are located at the eastern end of the city, away from the city center and the main cycling path along the promenade. LU_BEACH (presence of coastline in buffer) shows a positive association in Limassol and Malta (for stations used as a destination). LU_DISTSEA, distance to coastline, captured that same relationship for stations used as an origin in Malta, where a greater distance from the coast was associated with less BSS use. LU_LEN_CYC, the length of cycling paths in the buffer, had a positive relation with BSS use in Limassol and Las Palmas de Gran Canaria. This relationship was not present in the Malta models as there was almost no cycling infrastructure in the urban area. LU_SHOP had a positive relation with BSS use in Malta for station use both as an origin and a destination, where there was more cycling for transport, but a negative association for stations as a destination in Limassol, with more cycling for leisure. The density of the road network (LU_NODES) showed a positive association in Limassol for stations as a destination, indicating that trips ended more frequently in areas with higher urban density. LU_COM, the percentage of commercial/industrial land use, had a negative relation with BSS use in Malta for stations as an origin. The distance from the nearest bus station (LU_DISTBUS) showed a negative association in Las Palmas de Gran Canaria for stations as a destination, highlighting the positive relationship between a shorter distance and public transport use for BSS stations as a destination. The gender quotient (GEND_RATIO) showed a significant negative relationship with BSS use in Las Palmas de Gran Canaria, with less BSS use in locations with a higher percentage of male population. TOT_RAIN, the association with rainfall was negative in Limassol and Malta, but positive in Las Palmas de Gran Canaria, with lower rainfall and therefore no negative effect. Las Palmas de Gran Canaria and Malta’s BSS use models showed a positive association with AVG_MAXC, the average maximum temperature. The temperature variable was not present in the Limassol models as it was highly inversely correlated with rainfall.
6. Discussion
The most intensely used BSS stations as origins and destinations in the three case studies were found close to the beach or promenades in these coastal cities, where elevation is low. The presence of cycling infrastructure, identified as one of the main variables positively influencing BSS use in the literature, e.g., [
17,
22,
23], contributes to the use of BSS stations in Limassol and Las Palmas de Gran Canaria, but not in Malta, where there are no cycling paths in the urban area. The creation of dedicated cycling paths as part of a connected cycling network between residential, employment and entertainment areas could further promote cycling and BSS use in the three cities. To overcome elevation challenges, several strategies can be pursued. The provision of electric bicycles, although more expensive for the operators, can play a role in encouraging uptake among new target groups and for trips to destinations located at higher altitudes. When considering and designing cycling infrastructure and routes, elevation should be taken into account, by planning routes on more gradual slopes and avoiding having to traverse large elevation differences where possible, through the use of bridges, elevators or a special bicycle lift (e.g., the Trampe bicycle lift in Trondheim, Norway). Providing ancillary facilities such as showers and lockers at key destinations can also aid in mitigating the effect of exertion or high temperatures as a barrier to cycling [
64].
This study focused specifically on constructing models for BSS station use as origins and destinations. Although in all three cities, the specific origin and destination model shared certain variables (e.g., the distance from the center of the BSS in Limassol and Malta, the presence of cycling infrastructure in Limassol and Las Palmas de Gran Canaria and the significant weather variables in all cities), we also observed differences between the origin and destination models, highlighting specific factors acting as draws for station use as an origin or as a destination. In Limassol, the presence of shops (clothing) showed a negative association in the destination model, whereas a denser road network showed a positive association. This shows that although trips may end in an urban environment with greater density, the purpose of the BSS trip is not associated with shopping or running errands, but rather with leisure purposes, as also gathered from the descriptive statistics of the BSS use in Limassol. In Las Palmas de Gran Canaria, a positive association was present in the model between station use as an origin and the presence of tourist accommodation in the vicinity. As the BSS is mostly used for transport purposes, and thus not dominated by tourists, this result can be explained by the fact that the tourist accommodations are located in an area with many leisure and entertainment venues, which was also evident from the multi-collinearity between the number of tourist accommodations, and the count of cafes and restaurants in the buffer around BSS stations. There is a clear potential to promote the BSS with visiting tourists, as none of the cities showed significant use of shared bicycles by tourists. Specialized payment options, such as inclusion of shared bicycle rides in a day- or week-pass or a transport smartcard, could enable easier uptake by visitors to the cities.
The distance to the nearest bus station only showed a negative association in the destination model in Las Palmas de Gran Canaria, indicating that the further away an area is from a bus station, the less BSS use is observed for that area as a destination. This result highlights the complementary relationship between BSS use and public transport in Las Palmas de Gran Canaria, particularly as a feeder service to reach the public transport hub. In all three cities, BSS and public transport services can be better integrated, in physical terms through close proximity, as well as by providing integrated payment options (e.g., in a transport smartcard or app) and the provision of transfer information [
65,
66]. In Malta, the percentage of commercial/industrial land use showed a negative association with station use as an origin, indicating that trips were more likely to originate from stations in an environment with less of this type of land use, and inversely with more residential land use. The distance from the sea (for the origin model) and the presence of the coastline (for the destination model) were multi-collinear variables that took each other’s place in the two models, explaining the same effect: a positive association between BSS station use and proximity to the coastline in Malta.
Although the results of the analysis of the trip data provide detailed insights into where BSS use is currently taking place, and how this correlates with spatial and temporal factors, they do not capture differences in travel behavior by individual users and the barriers they may experience, both for frequent users and for non-frequent or potential users. To this end, as part of this research, a survey has been conducted with BSS users in the three case-study cities, to understand their BSS use, and factors that encourage or discourage the cycling behavior, looking at both frequent and non-frequent users. The survey results, including the validation and triangulation of these results from multiple sources of data, will allow for a better understanding of BSS use and cycling behavior in these ‘starter’ cycling cities, and will be published in future work.
A limitation of this study is the quality and comparability of the spatial and temporal data from secondary sources included in the models. Some data were only available at a coarser spatial scale, e.g., at the neighborhood or locality level, rather than the census tract level. This spatial level may be less suitable to adequately capture spatial characteristics that contribute to variations in frequency of station use. Although an effort was made to obtain data at the finest-grain level possible, that was as recent as possible and that was comparable between the three cities, averaging values over a monthly period means some detail was lost. With respect to the temporal variables, the potential negative effect of high summer temperatures, which in summer in Limassol and Malta can reach a daily average high of 35 °C–40 °C, was not captured in the models. Only the positive effect of warmer temperatures was captured in the models, indicating in general that there is more BSS use in warmer months than in colder months. Further work to better understand the effect of temporal variables in the Southern European context could look at this in more detail, using daily values or zooming in on specific days with particularly low or high temperatures. In future work on this topic, other multi-variate regression techniques could be explored, as well as multi-level or nested mixed models.


