Article

Implementation of POLCA Integrated QRM Framework for Optimized Production Performance—A Case Study

1
School of Economics and Finance, Xi’an Jiaotong University, Xi’an 710061, China
2
Department of Industrial Engineering, University of Engineering and Technology, Peshawar 25000, Pakistan
3
Guanghua School of Management, Peking University, Beijing 100000, China
4
Department of Mechanical and Manufacturing Engineering, Institute of Technology, F91 YW50 Sligo, Ireland
5
Department of Mechanical Engineering Technology, University of Technology, Nowshera 24100, Pakistan
6
Department of Engineering Management, University of Engineering and Technology, 19060 Swat, Pakistan
*
Authors to whom correspondence should be addressed.
Sustainability 2021, 13(6), 3452; https://0-doi-org.brum.beds.ac.uk/10.3390/su13063452
Submission received: 2 February 2021 / Revised: 12 March 2021 / Accepted: 15 March 2021 / Published: 20 March 2021

Abstract

:
Quick response manufacturing (QRM) is a relatively new concept that enfolds all the preceding approaches, namely, just in time (JIT), flexible manufacturing, agile manufacturing, and lean production. QRM is compatible with existing materials requirement planning (MRP) systems and can be implemented efficiently. The ideas from QRM have been highly influential in custom-made engineer-to-order and make-to-order (ETO/MTO) high-mix and low-volume production environments. This study investigates the effectiveness of the POLCA (paired cell overlapping loops of cards) integrated QRM framework for reducing lead time. The POLCA integrated QRM approach was implemented in a precise product manufacturing industry. The industry was facing high penalties due to improper planning and uncontrolled lead times. The implementation of QRM with the POLCA framework indicated optimized production scheduling and significant improvement in lead time and work in process (WIP). After implementing the new manufacturing strategy, the performance parameters showed significant improvement in terms of reducing the percentage loss of profit.

1. Introduction

1.1. QRM—A New Manufacturing Paradigm

During the last few years, flexible and cycle time-focused scheduling strategies have attained much attention for their potential to maximize profit in production-based industries. In this context, Suri (2010) [1] introduced quick response manufacturing (QRM) to gain a competitive advantage by tracking faster product deliveries, especially in the case of high product variety. The primary objective of most lean manufacturing tools does not reduce lead time, whereas the QRM philosophy directly emphasizes lead time reduction. QRM is a company-wide strategy that pursues increasing the throughput by reducing the lead times across all operations, covering all aspects of manufacturing, design, planning and control, and supply management. Thus, the QRM approach works on transforming the company into a fully integrated cellular organization. The QRM approach has offered a promising manufacturing paradigm. In the last few years, several companies have implemented QRM strategies and achieved excellent results (Jitpaiboon et al., 2016 [2]; Suri and Rath 2002 [
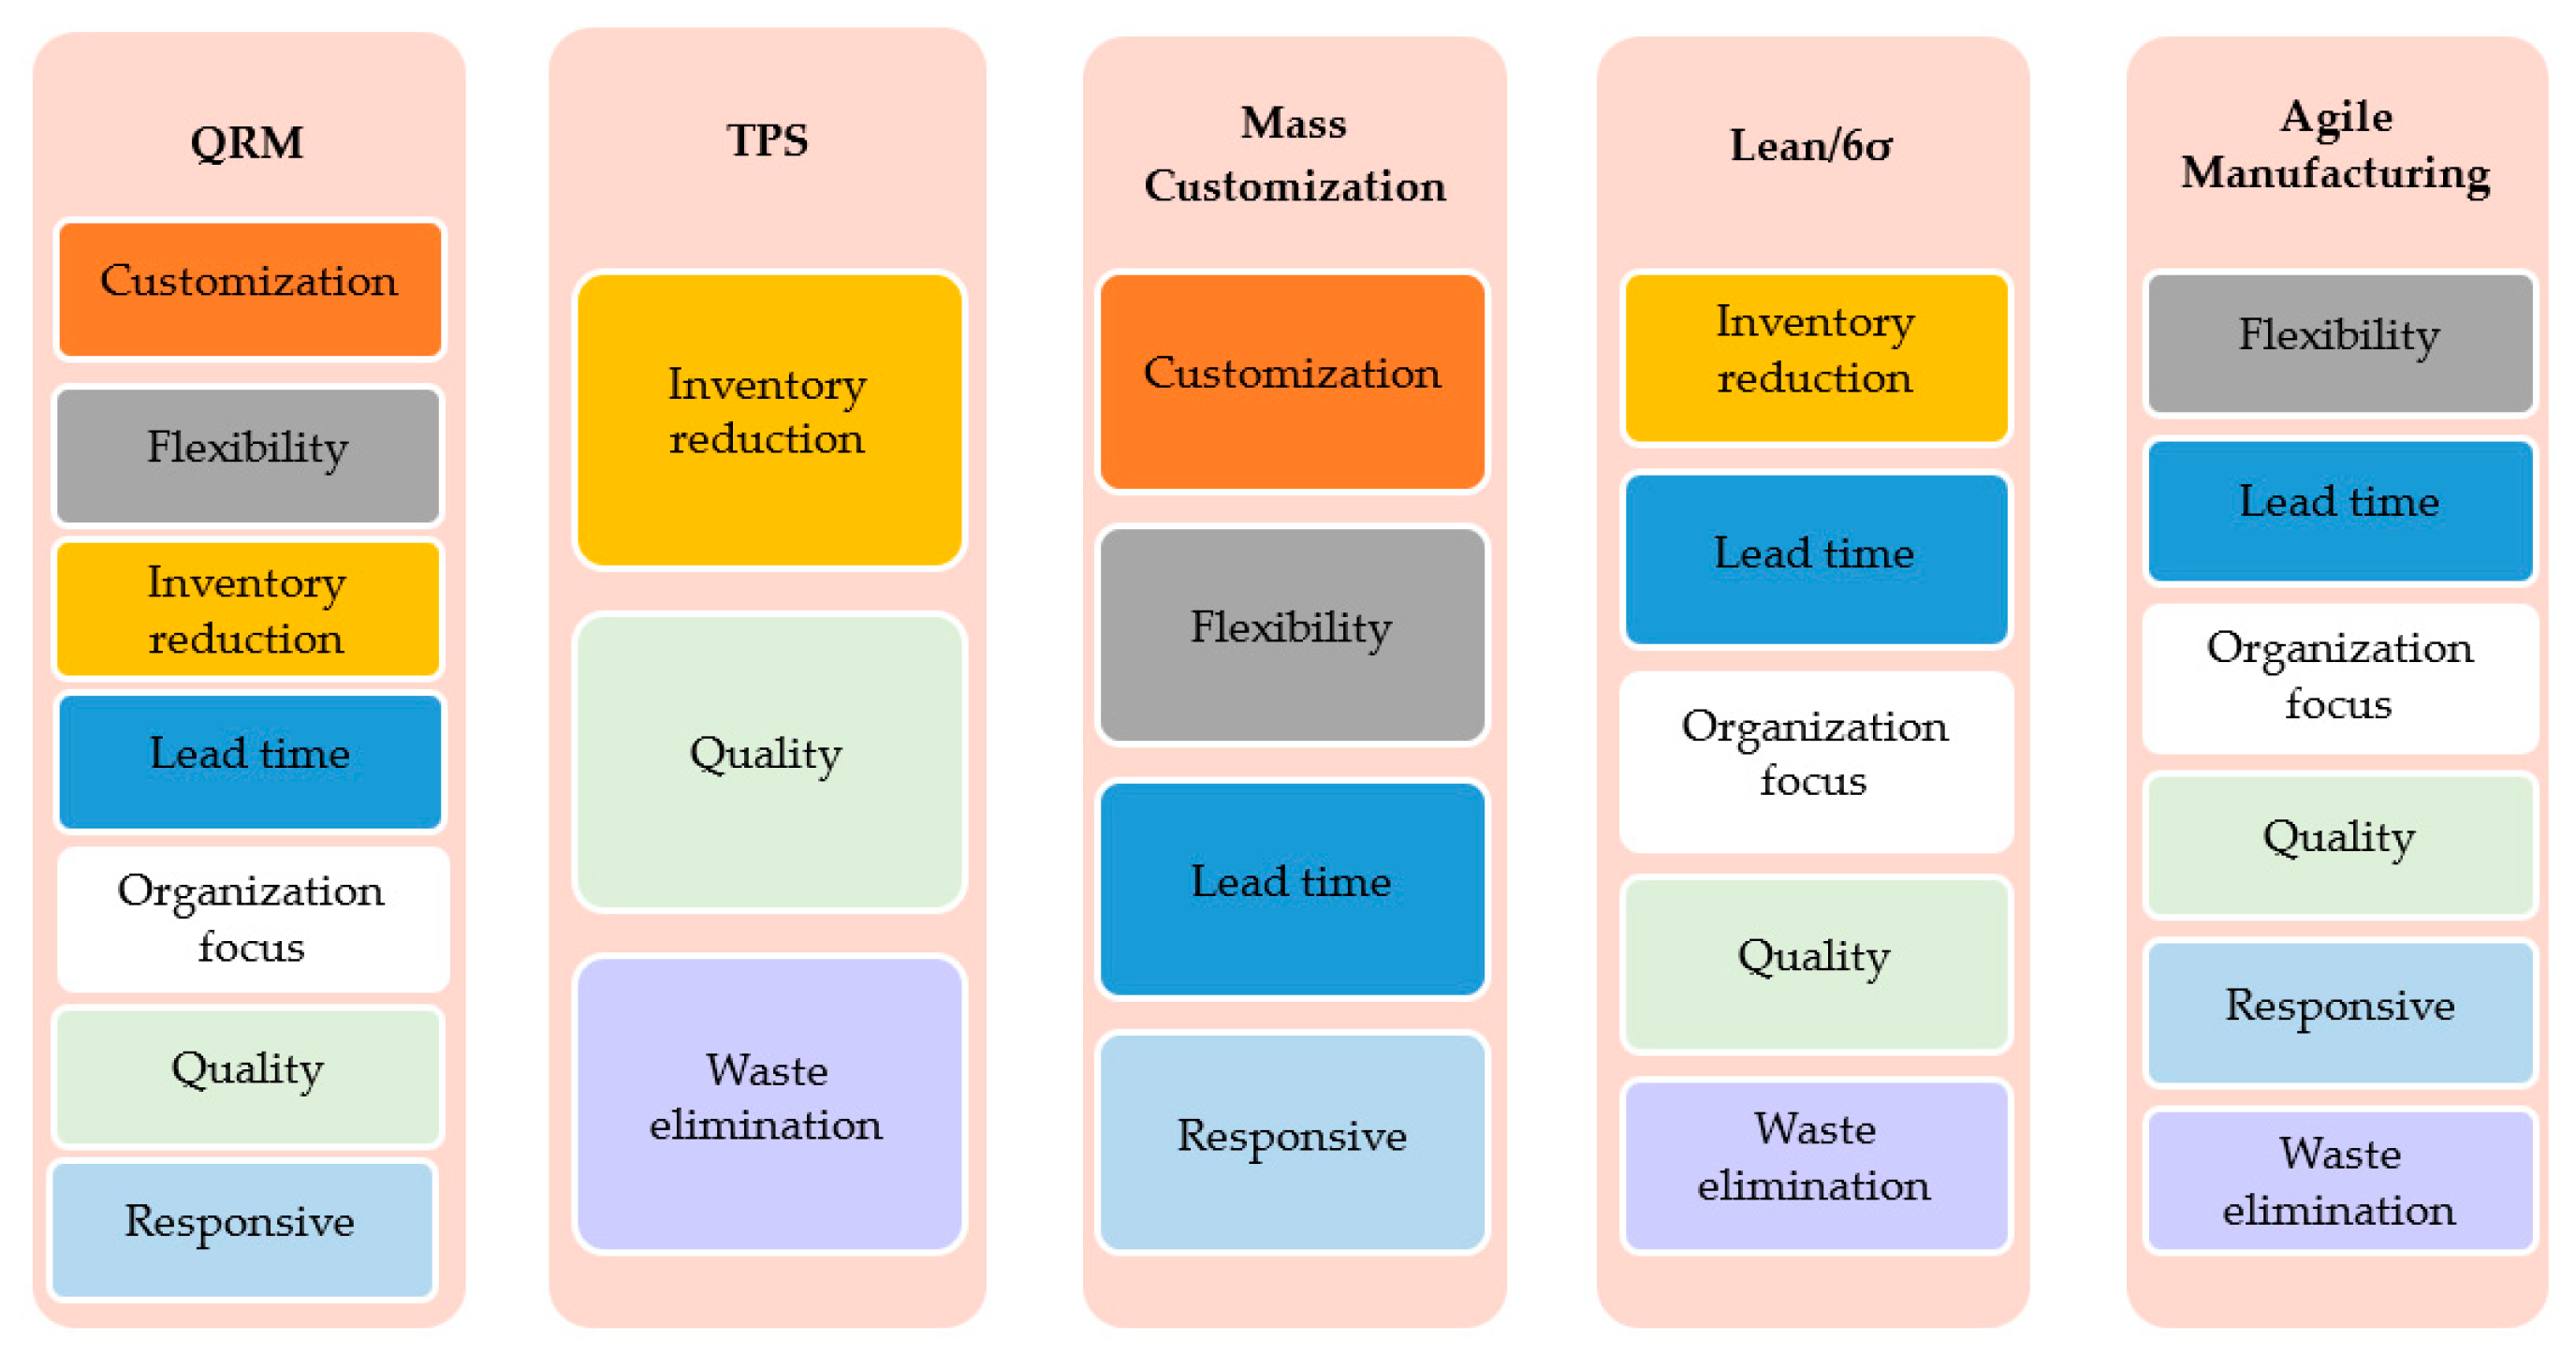
3]). The important outcomes were a reduction in lead times (80–95%), reduction in product cost (15–50%), improved delivery performance (from 40% to 98%), and waste reduction in the form of scrap and rework (more than 80%). A comparison of QRM with the preceding manufacturing and production approaches is presented in Figure 1. From the manufacturing paradigms, QRM appears to be best suited for companies that are involved in Engineer-to-Order (ETO) products [4]. Figure 1 explains that QRM has very much in common with the lean production paradigm [5,6,7], for instance, cross-functional teams, on-demand assembly [8,9], and quality systems. Likewise, QRM also covers all aspects of mass customization [10], agile manufacturing [11], and Toyota production system (TPS) [12] approaches, except for waste elimination. As shown in Figure 1, besides the other performance parameters, QRM mainly emphasizes reducing the lead time.
At present, the implementation and acceptance of QRM is gaining momentum in different industrial sectors. The published literature on QRM mostly covers the description and development of QRM’s principles. For example, Suri’s (2010 [1], 1998 [13]) case studies focused on the implementation of QRM; Fernandes et al. (2012) [14] and Veloso et al. (2011) [15] worked on POLCA (paired cell overlapping loops of cards) system implementation. Likewise, the findings of Chinet et al. (2014) [16], Germs and Riezebos (2010) [17], and Vandaele et al. (2008) [18] on QRM are also important in this regard. In a recent review on lead time reduction within the context of time-based competition and QRM, Godinho et al. (2013) [19] highlighted that only a limited number of publications are available that deal with practical cases for lead time reduction.
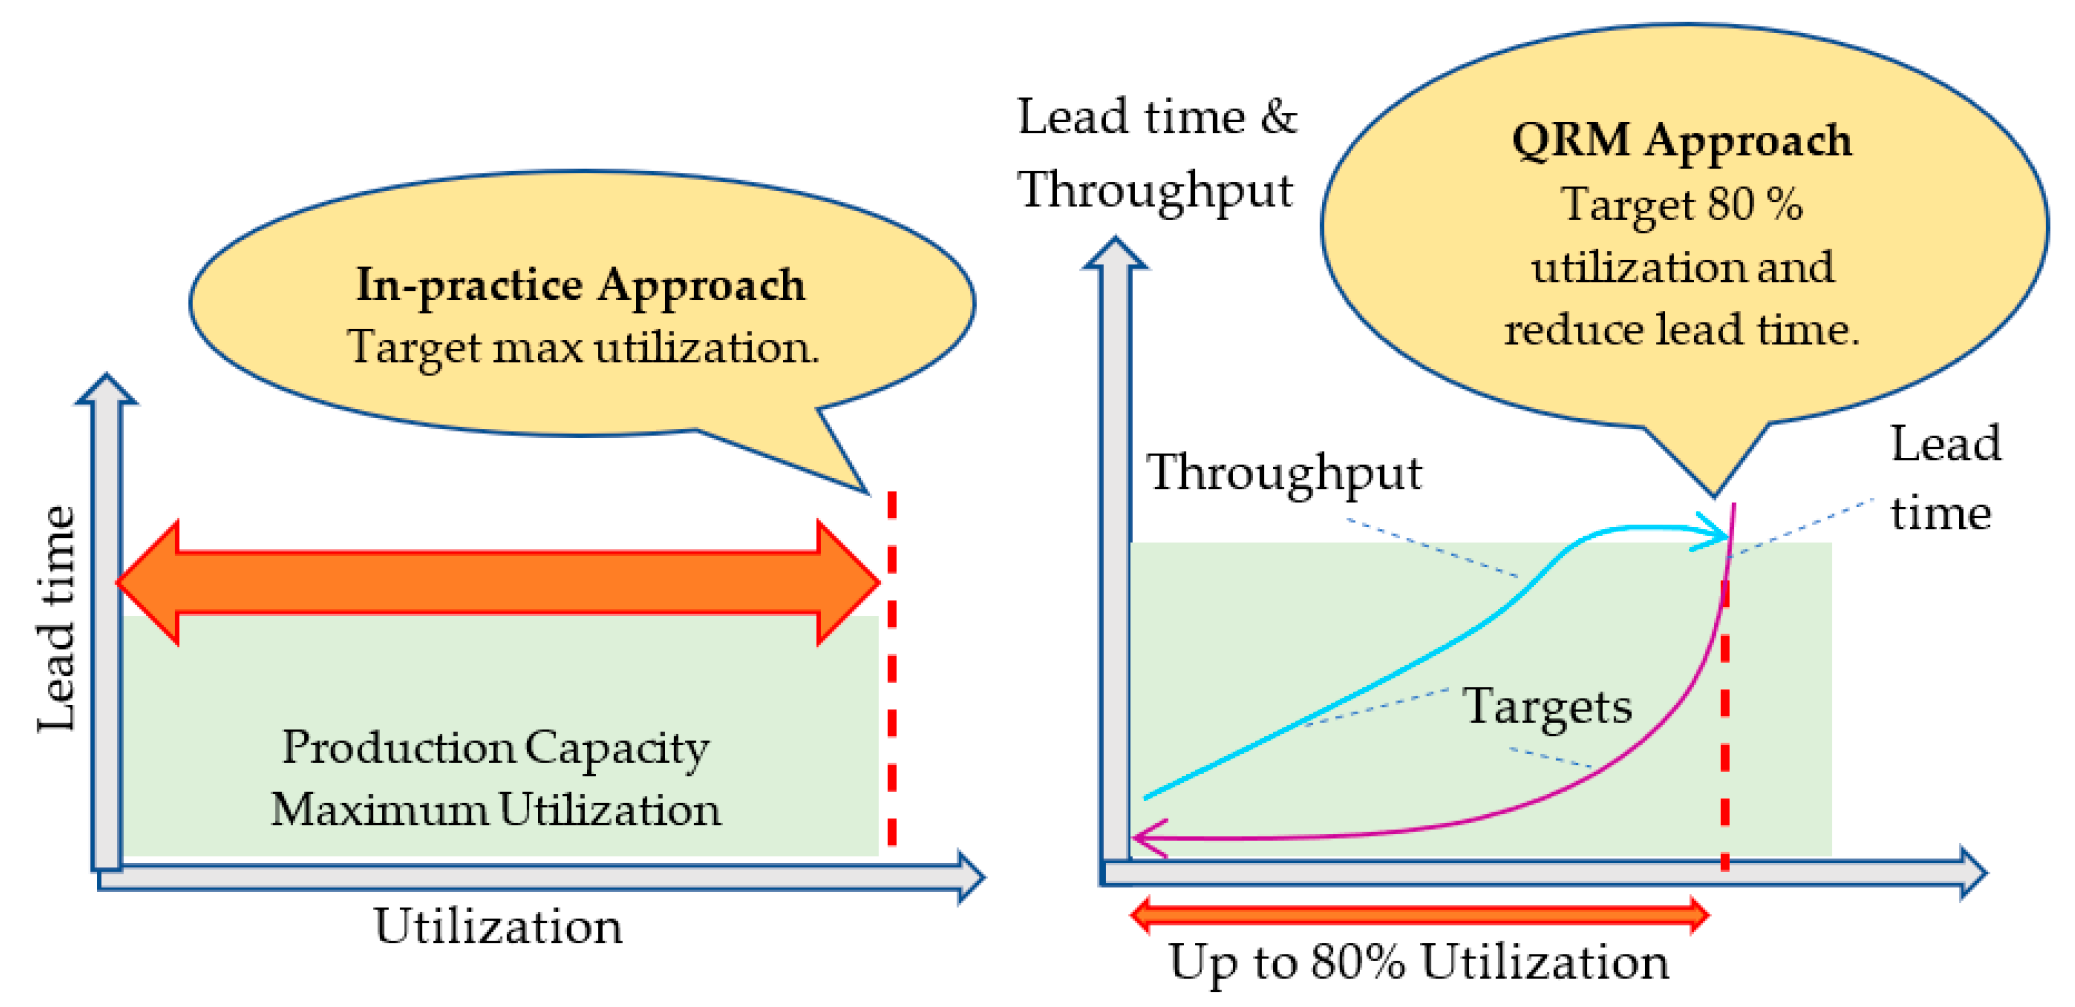
QRM can be categorized into internal and external contexts. Internal context applies to the time-based competition paradigm to reduce lead time, whereas external context means enhancing responsiveness to the customer. The QRM strategy is based on four fundamental principles, including focusing on reducing overall lead time rather than the production time, improvement of the company’s structure to support QRM, a systematic dynamic to adopt, and implementation of the fast-tracked development on the enterprise scale (Markov et al., 2016) [20]. The first principle highlights the importance of the critical production path (CPP) time, including logistic chains of production and supplies. The second principle of QRM provides centralized operation in the form of cells possessing high autonomy under overlapping loops. The third principle interrelates the company’s resources to deliver prompt production volumes. Contrary to the traditional approach, which focuses on 100% utilization of capacity, QRM proposed an underutilization (up to 80%) of production capacity to sustain and react to changes in the internal and external environment of the enterprise. QRM strategy explains that if the resource utilizations approach 100%, it results in increasing lead times and may result in a percent reduction in profit in the form of late delivery penalty costs. This is explained in Figure 2 below.
It is important to highlight that tremendous work has been carried out to implement different manufacturing management techniques (for example, lean manufacturing, just in time, total quality management). None of the research that has been noted presents any specific approach or methodology that focuses on QRM. Several research studies are available that highlight the problem of maximizing revenue and curtailing production delay times by processing the jobs on parallel machines. For instance, Gholami O. et al. [21] applied heuristic algorithms to maximize revenue through the number of jobs processed on parallel machines. Likewise, numerous studies are also available on the assessment of the manufacturing system’s flexibility under different volume-variety scenarios to reduce product delivery delays. For example, Saleem et al. (2018) [22] studied different dimensions of manufacturing operations flexibility to optimize the product delivery targets in computerized production cells. Only a limited number of studies is available on QRM strategy and its implementation. Birkie et al. (2016) [23] worked on understanding dynamism and complexity factors in engineer-to-order and their influence on lean implementation. Manoj et al.’s (2014) [24] work was focused on the application of lean practices in small and medium-sized food enterprises. Bortolotti et al. (2015) [25] highlighted lean implementation through organizational culture and soft lean practice. A similar approach was adopted by Vinodh et al. (2018) [26] to study the lean six sigma barriers with environmental considerations. Garza-Reyes et al. (2015) [27] explored the awareness and adoption of lean manufacturing (LM), lean six sigma (LSS), quick response manufacturing (QRM), and the theory of constraints (TOC) in the Greek engineering sector. Farnoush et al. [28] studied high variety products in a divergent production line of an automotive production company by adopting three different variants of POLCA as well as one type of CONWIP (Constant Work in Progress) control. They used ExtendSim simulation software to analyze throughput, shop floor throughput time, and work in process (WIP). Mabert et al. (2007) [29] studied the developments and events of MRP (Material Requirements Planning) in chronological order and highlighted key contributions by early proponents of this approach for managing the flow of material on the factory floor. This study aims to determine the level of implementation of QRM practices in different organizations in Brazil, the USA, and Europe. To the best of our knowledge, this is the first study that encapsulates the implementation pattern of QRM practices. Ten Hoonte (2012) [30] performed a case study on seven companies in the Netherlands, three in Norway, and one in Austria, aiming to develop a model of QRM maturity that could be used by organizations as a self-assessment tool for identifying improvement opportunities.
Considering the discussion presented in the preceding paragraph, it is evident that most of the industries are using push MRP as their material control strategy, but with the development and research in the field of material control, it is evident that push MRP scheduling has a lot of drawbacks associated with it. For companies where push/MRP and pull/Kanban are not suitable, a hybrid strategy is needed to overcome the problems associated with Push/MRP and Pull/Kanban. The time-based competition (TBC) strategy was introduced by George (1988) [
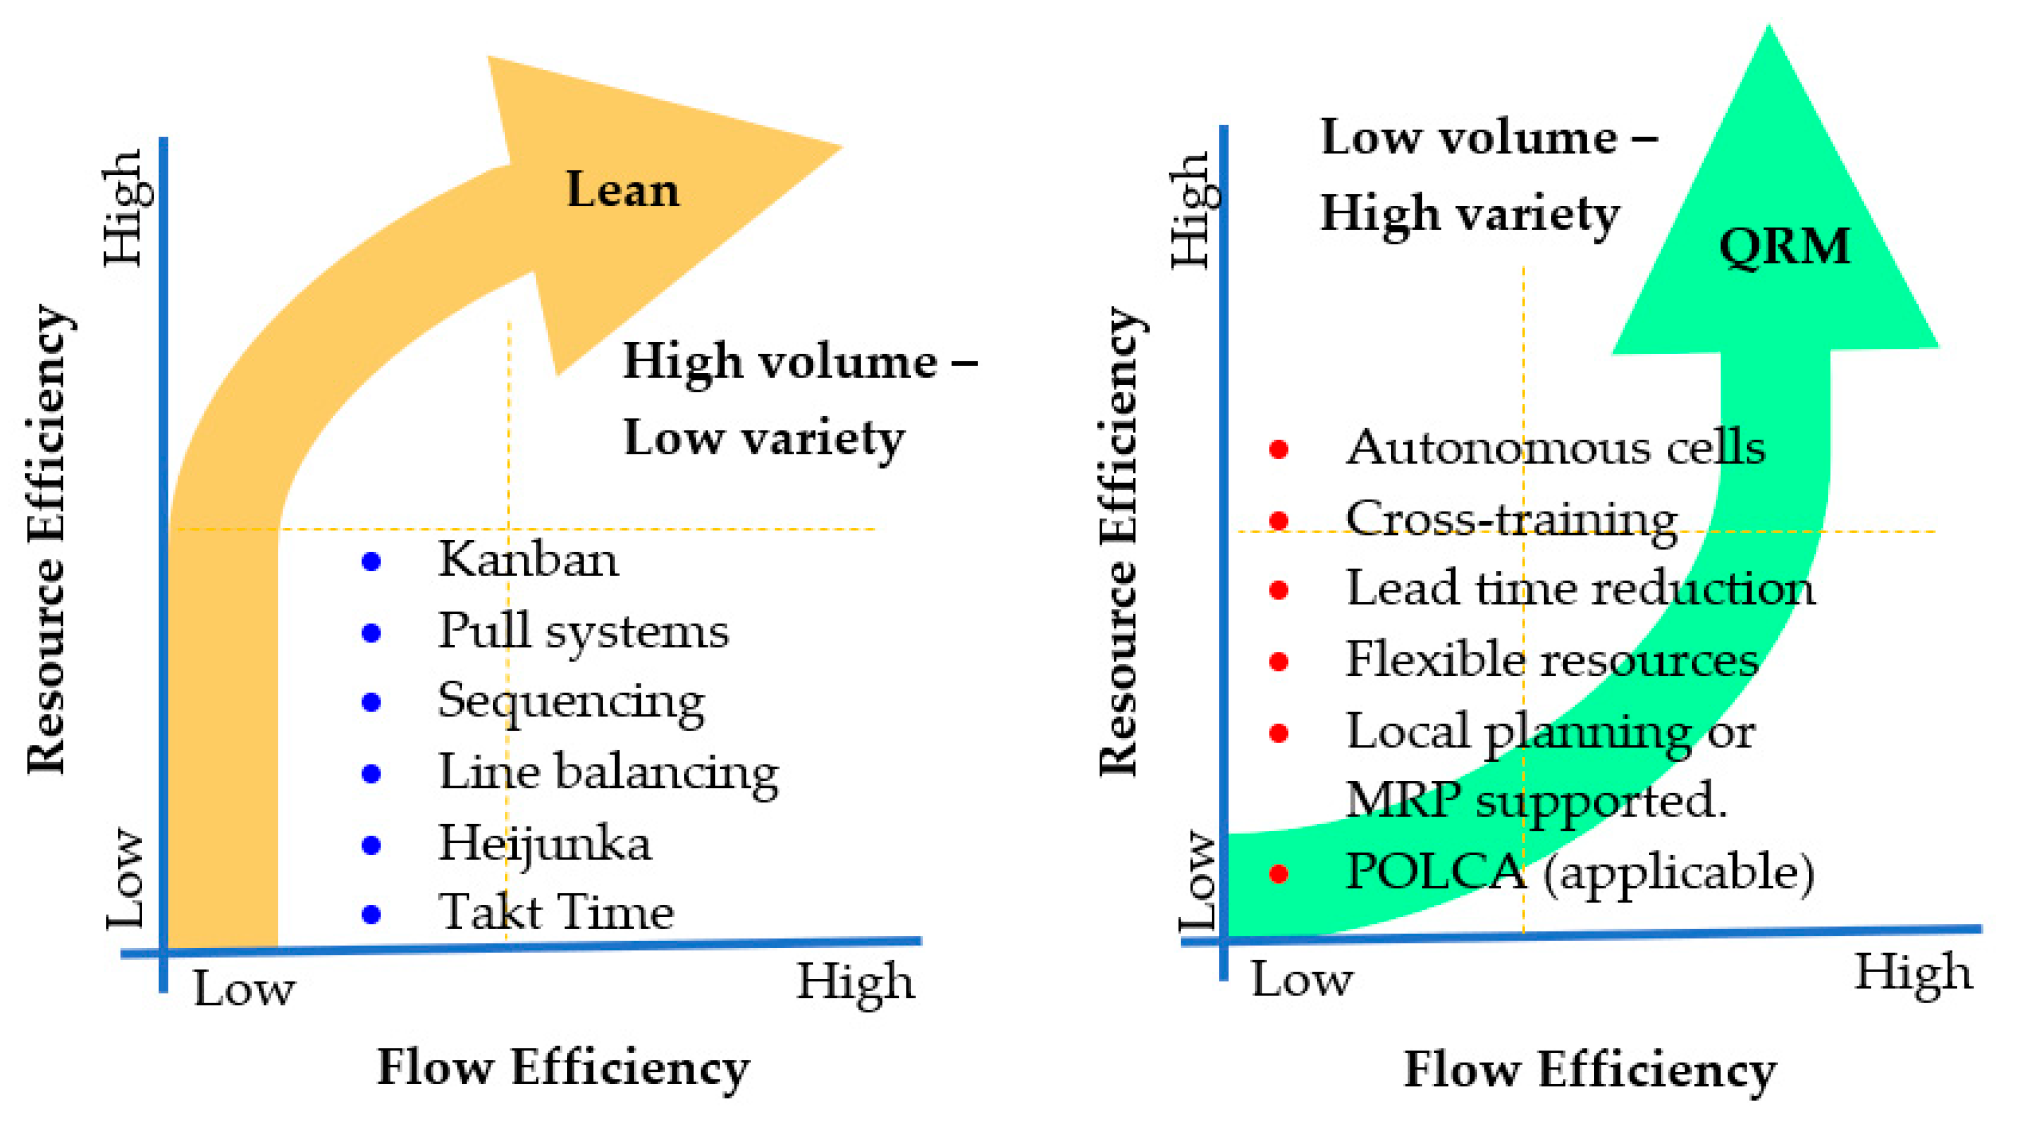
31], who focused on production speed and called it the next source of competitive advantage. Quick response manufacturing (QRM) also supports the application of TBC. The fourth principle of QRM focuses on the implementation of the enterprise QRM concept with suppliers and consumers to reduce the CPP. QRM encourages flow efficiency supported by supplementary capacity (20% unutilized and kept as safety) to keep the job moving, rather than keeping additional inventory and employing pull production systems. This concept is explained in Figure 3 below. QRM strategy proposes that the production system must be designed to cope with some variability. In the preceding paragraphs, it is explained that the statistical figures of companies that implemented QRM have improved substantially in terms of reducing the lead time and increasing the production quality, delivery, and flexibility to improve the profit. In the presented research, a POLCA integrated QRM approach is implemented to explore its potential benefits.

1.2. POLCA and QRM Approach

POLCA is currently gaining a great deal of attention in industrial production control systems for high-mix, low-volume, and custom-made products. POLCA stands for paired cell overlapping loops of cards with authorization. QRM supports the use of POLCA card systems, which is a hybrid push-pull strategy used between cells to reduce lead times. To implement POLCA we need a cellular layout [32,33] and HL/MRP (High Level/Material Requirements Planning) scheduling [34,35], or we can say that they are the prerequisites for implementing POLCA. POLCA uses two cards, unlike Kanban, which only uses one card and neglects whether the downstream station has the available capacity free or not. The card priority is set according to the customers’ order delivery targets, so the upstream operations are forced to their maximum capacities to meet the demands of downstream operations. Since the production is oriented to the customers’ orders, it prevents undue work-in-process (WIP), which results in no unexpected bottlenecks [36]. The main strength of POLCA is that it does not involve complex formulation or simulations and can be integrated with existing MRP and ERP (Enterprise Resource Planning) systems [37,38].
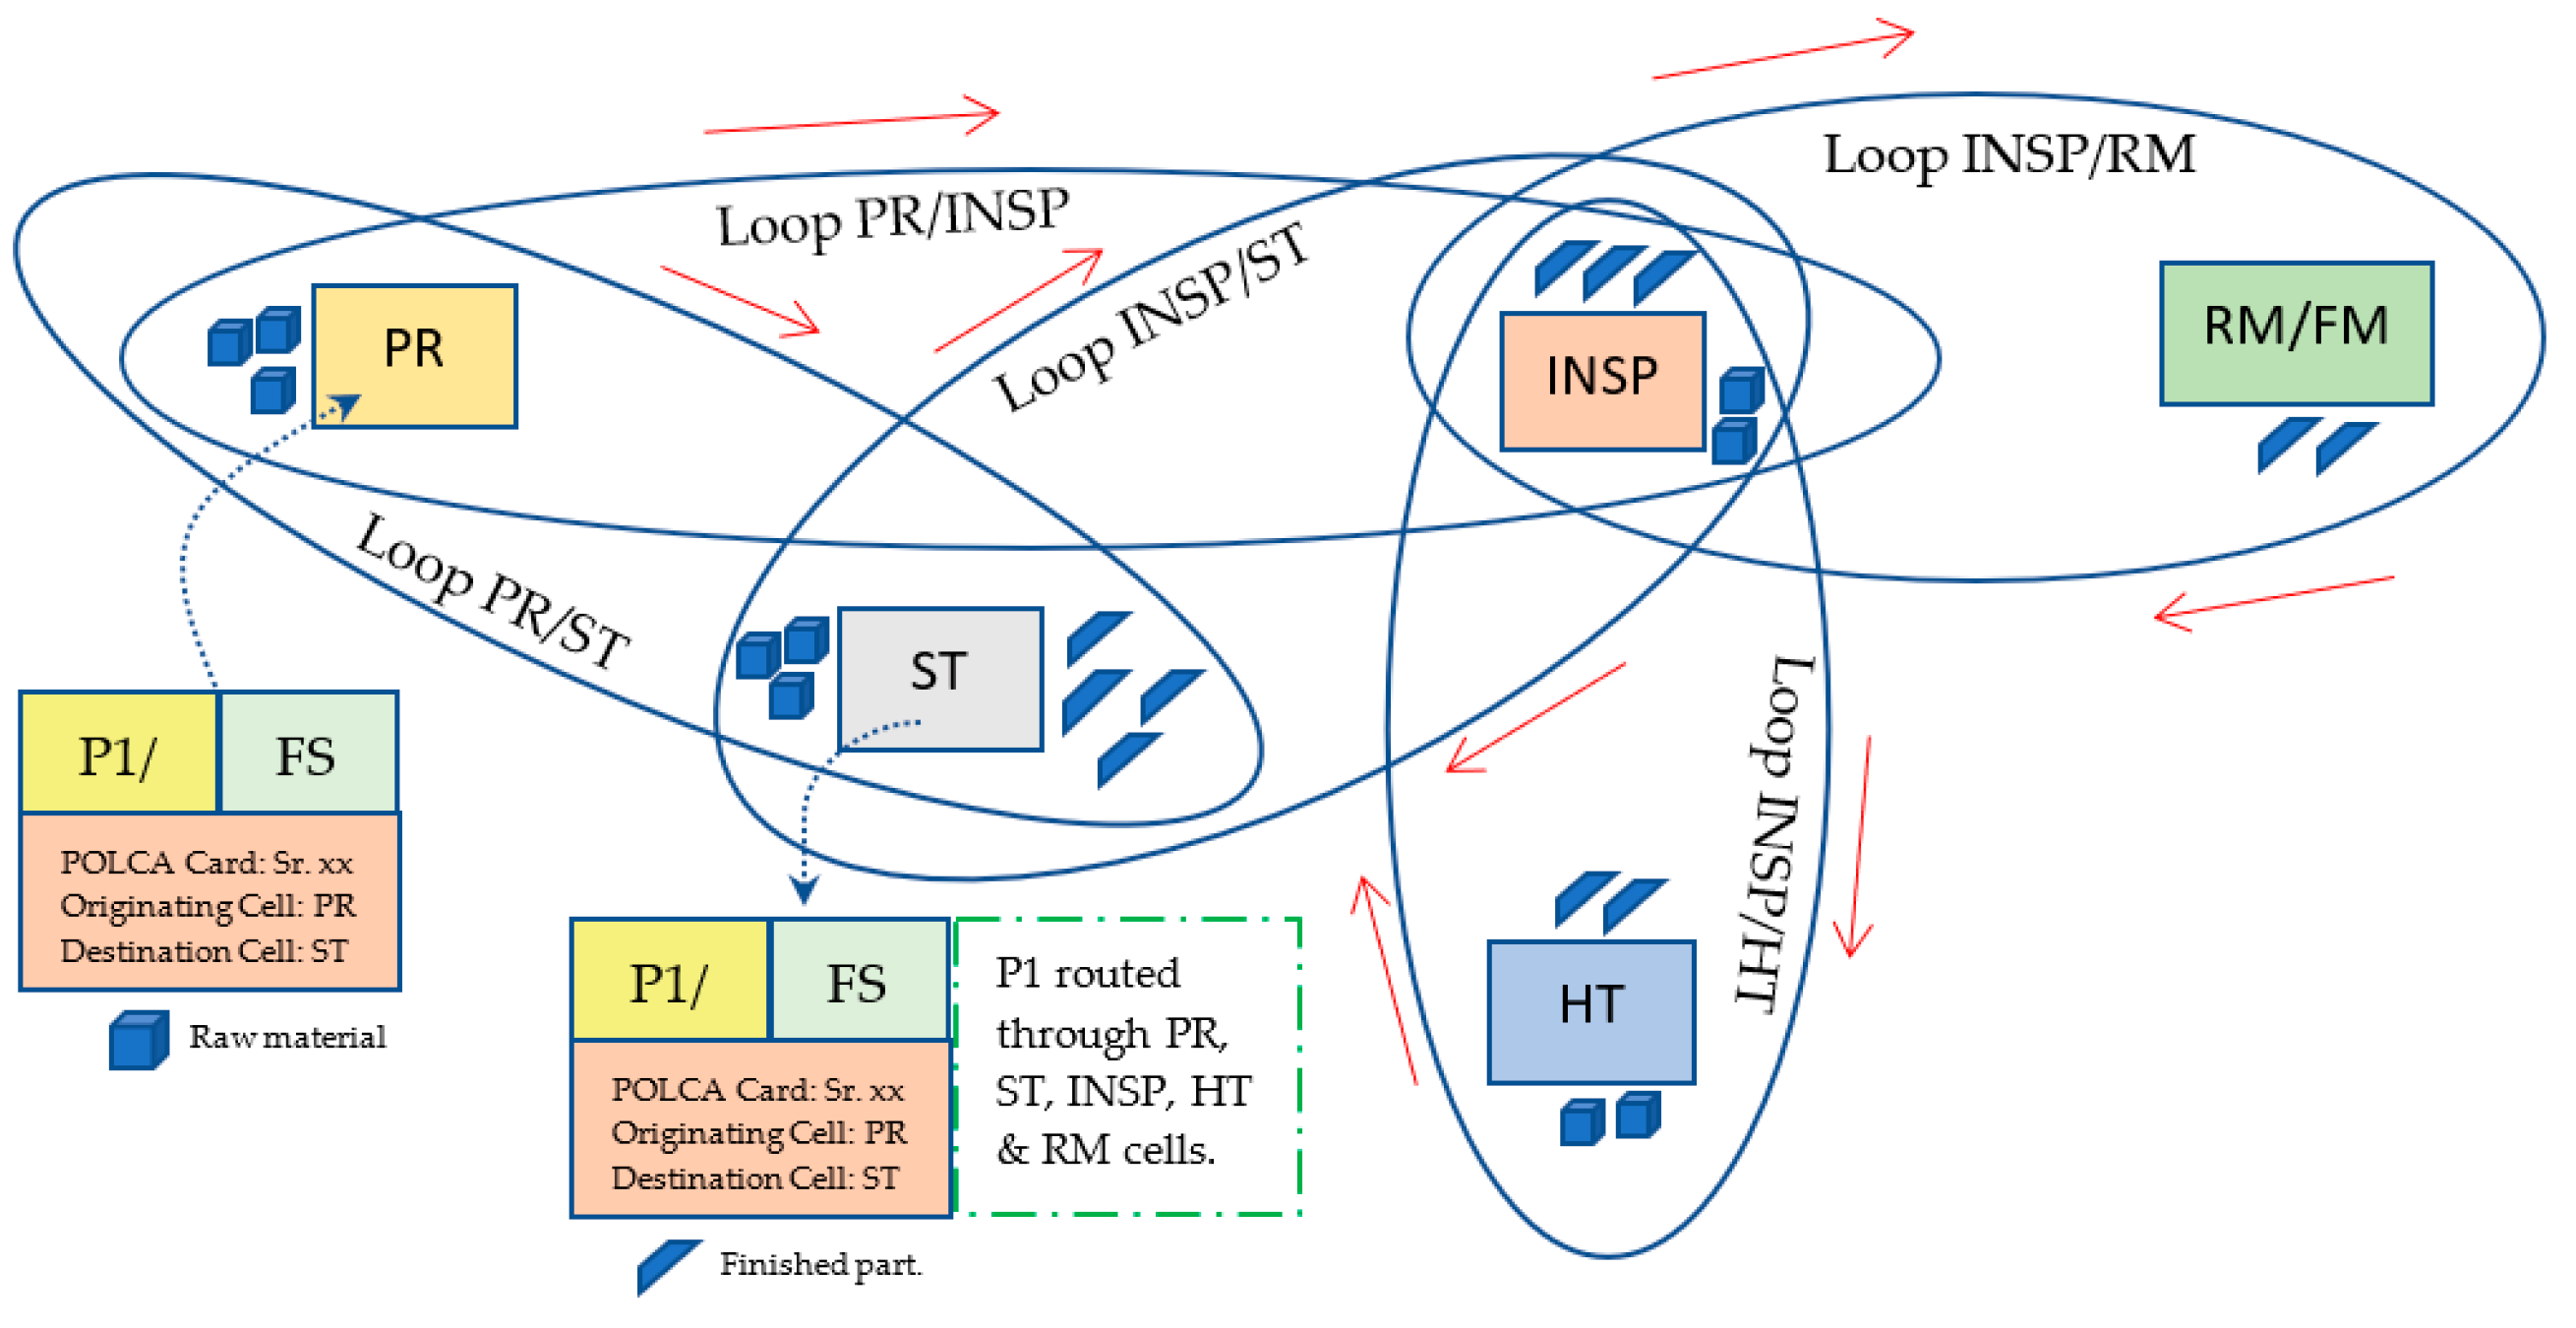
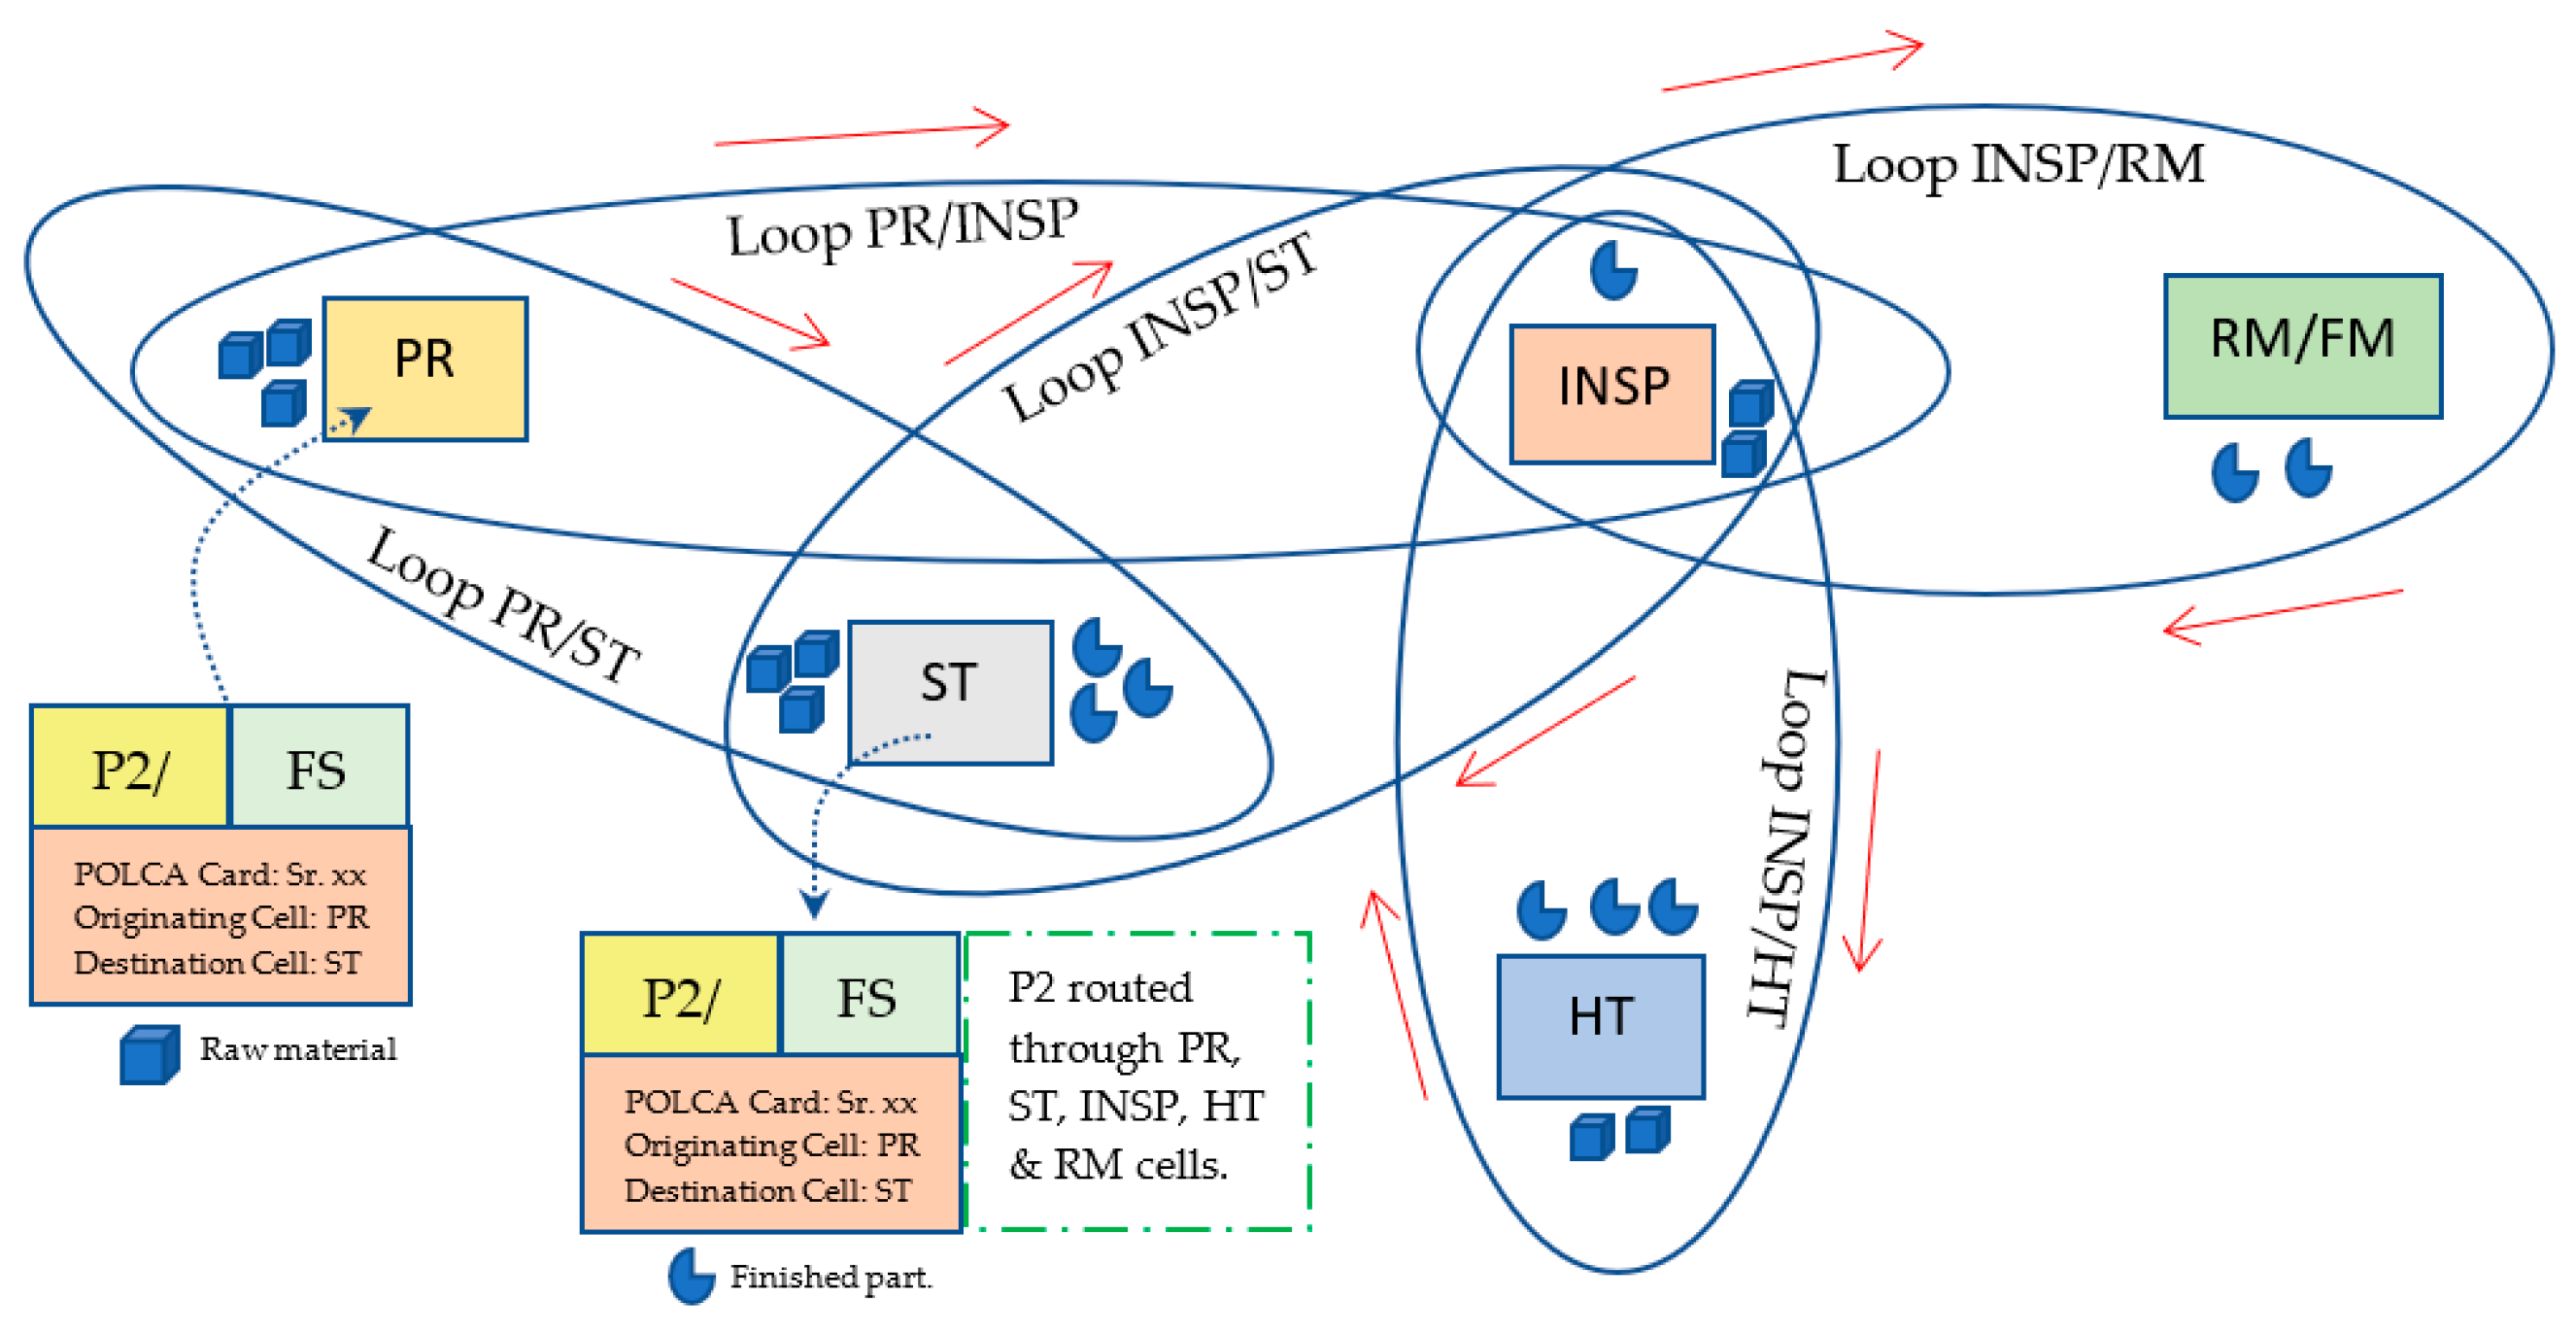
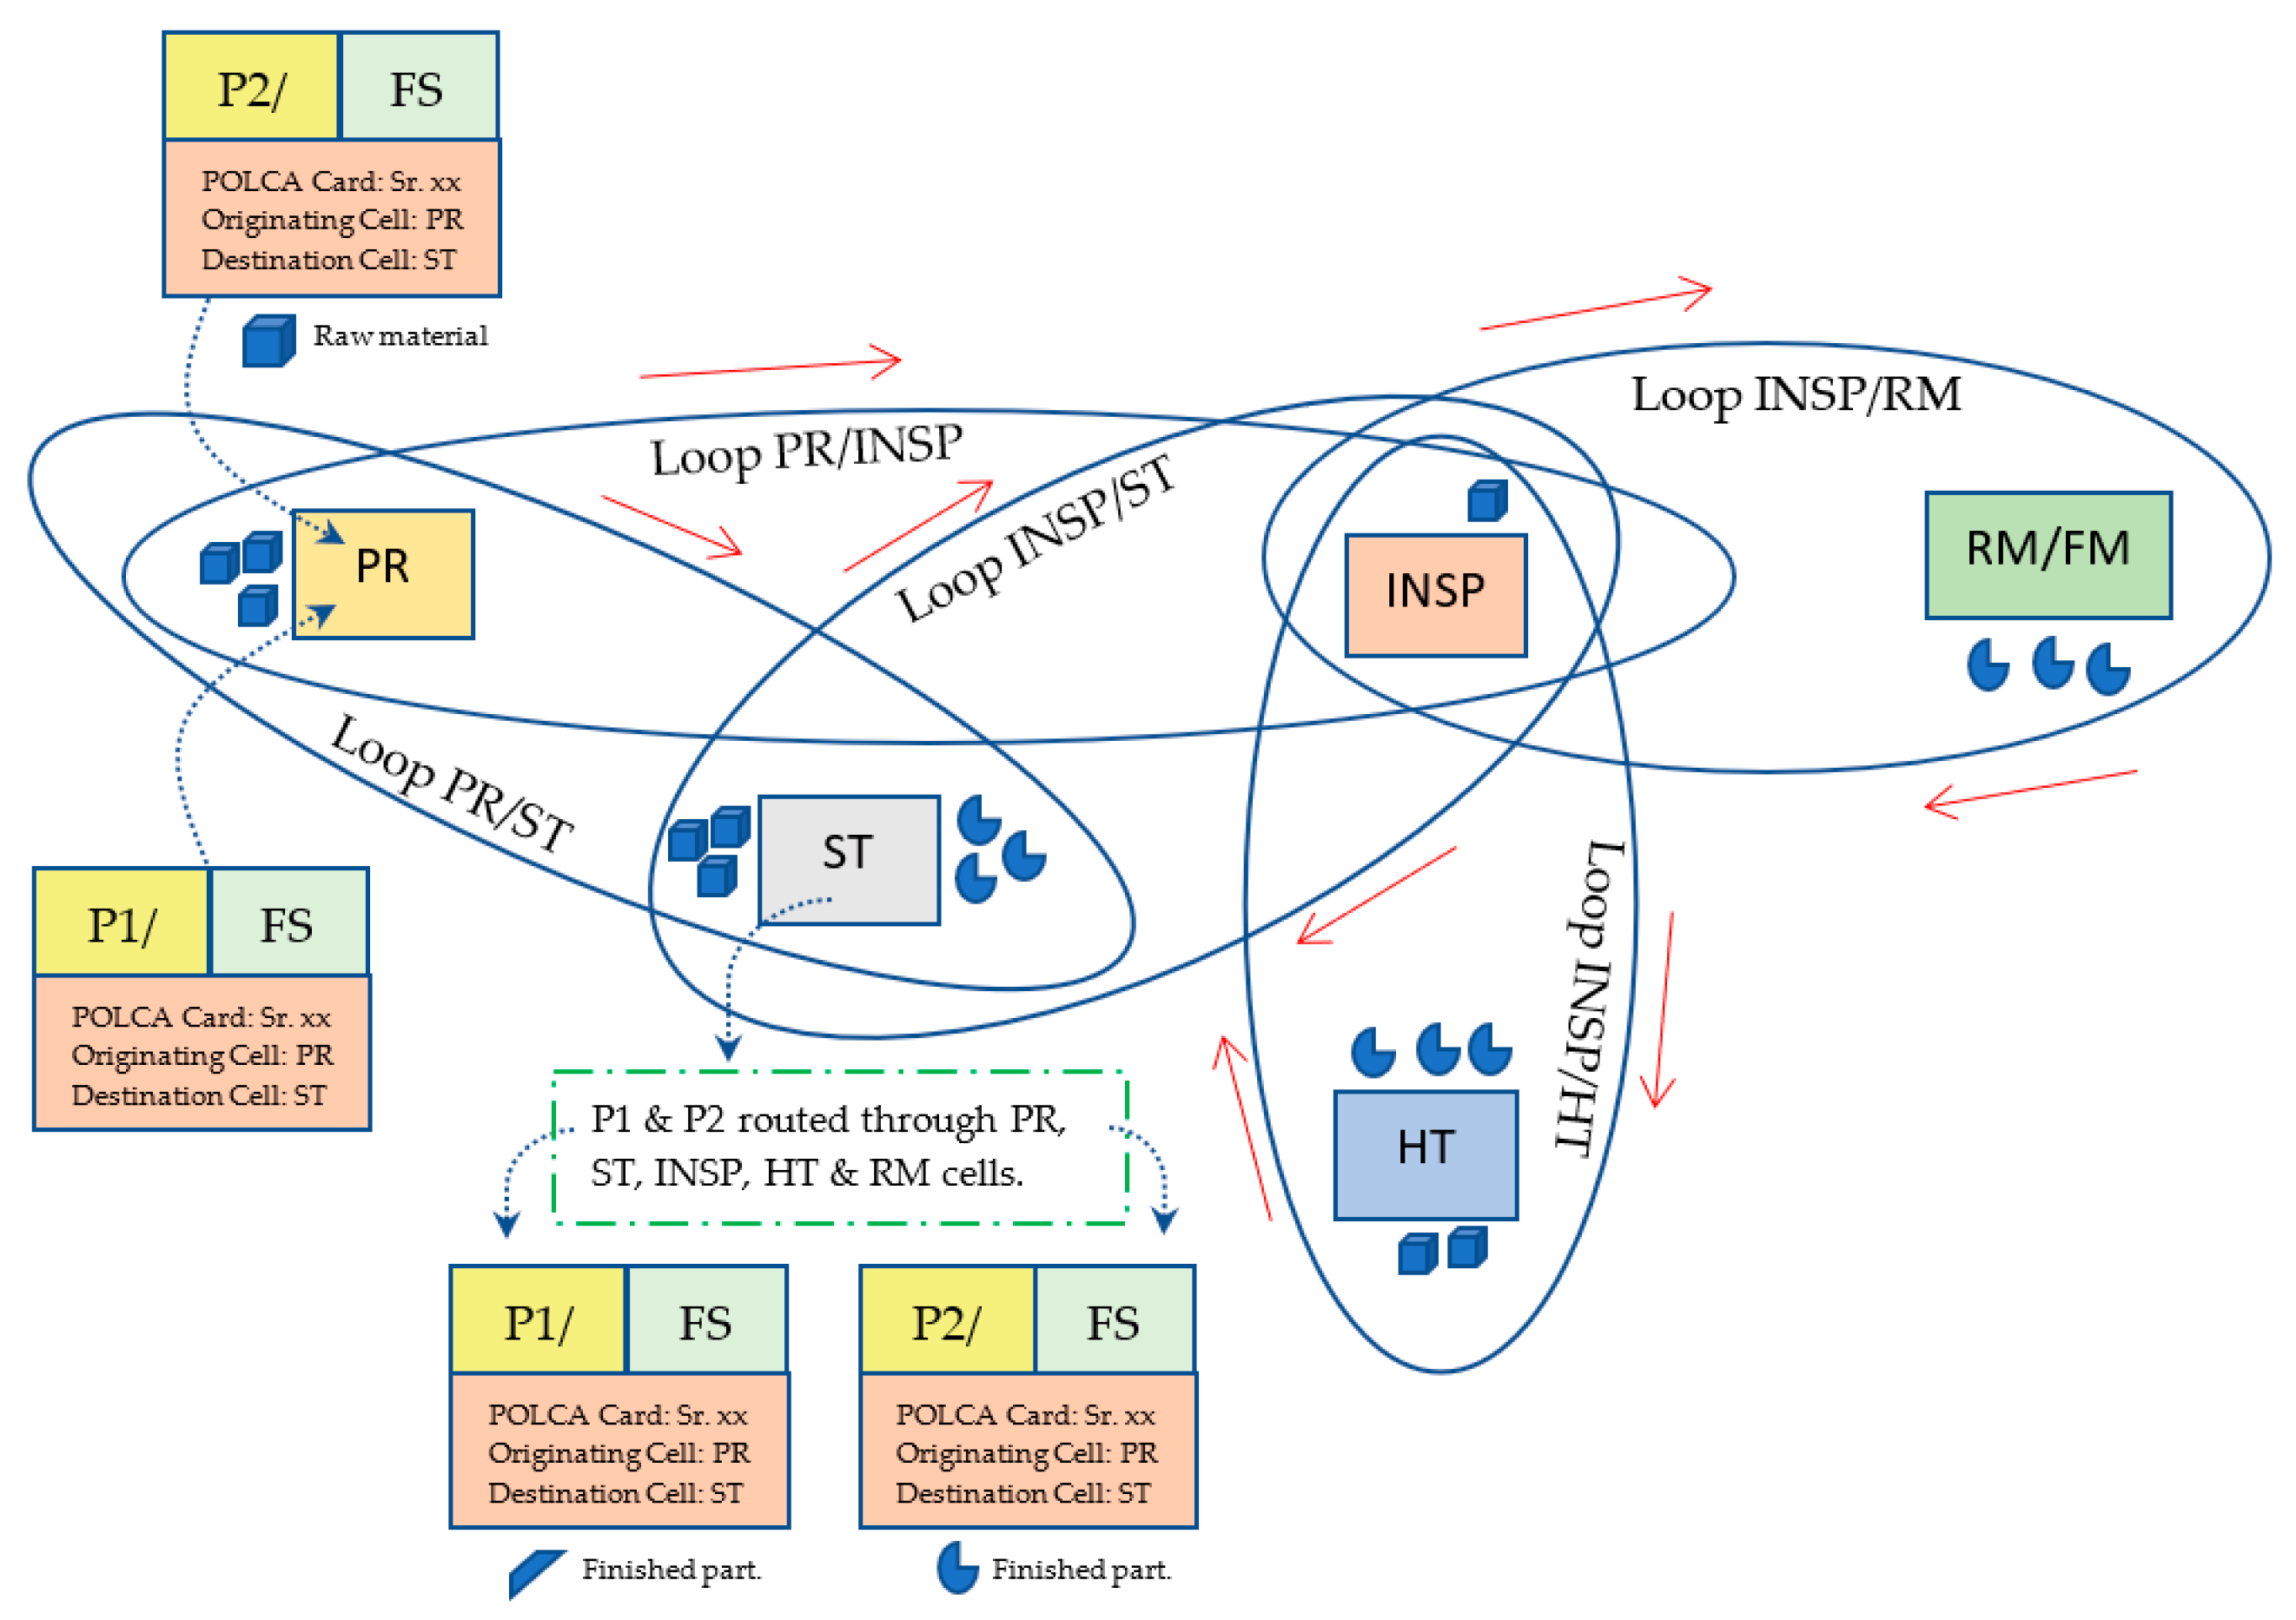
POLCA is well suited for customized parts as the jobs are transferred differently from one machining cell to another. Each pair of machines or cells is looped by means of a POLCA card. POLCA differs from Kanban or CONWIP because the POLCA card system sets the priority of cards according to the order release dates for the different jobs at each cell or machine. For example, a Kanban card signals a supplying workstation regarding the need for replenishment of any specific materials, whereas a POLCA card signals a supplying workstation about the free capacity to be worked on in the form of semi-finished and new parts to start with. No working stations accept jobs without order priority set by the ERP system. The workstations are connected by circulating cards according to the level of the workload. The overlapping terms explain that an intermediate workstation needs two POLCA cards to start production, as that workstation receives parts from two different workstations. According to this concept, POLCA avoids overloading workstations because it checks the work-in-progress at the next processing sections and releases jobs to the receiving workstations if a signal of free capacity is received.
To address the issues (customers’ product delivery dates and overlapping of cards with different workstations) associated with the Pull/Push/Kanban system [39,40,41,42], a paired cell overlapping loops of cards with authorization (POLCA) was introduced by Krishnamurthy et al. (2009) [43] and then extended by Suri (2010) [1]. This was considered one of the integral components of the overall quick response manufacturing (QRM) strategy for a company-wide approach. Suri (2010) [1] explained that scheduling should be done on capacity rather than the need for materials at a specific workstation. Subsequently, several researchers investigated the benefits of the POLCA system. Pieffers and Riezebos (2006) [44] provided a critical description of the main features of POLCA and provided details on the design and a performance analysis of a system operating under POLCA control. Some researchers compared the efficiency of POLCA with other material control systems, such as the workload balancing capability of CONWIP, POLCA, and multiple CONWIP (m-CONWIP) [17]. Likewise, Bhatewara et al. (2010) [45] investigated POLCA and GPOLCA (Generic POLCA) material control strategies and concluded that GPOLCA has lower WIP than POLCA to attain the same throughput on the shop floor. Braglia et al. (2013) [46] suggested a simulation-driven genetic algorithm as a legitimate supporting tool to increase POLCA’s capability.

2. Research Methodology and Approach—Case Study

2.1. Realization of POLCA Integrated QRM Strategy

A precision parts manufacturing industry in Pakistan that is dealing with ETO products was targeted. The company manufactures a wide variety of highly precise electronic components with tight delivery schedules. Numerous state-of-the-art technologies along with advanced automation system applications are the main strengths of the company. Currently, the organization is using the Push/MRP scheduling system for the management of all development, production, and after-sales service activities. However, due to the high variety of products and a very tight delivery schedule, the development and delivery schedule needs frequent adjustment. According to the statistical estimates, 55% of the company products are not delivered on time to customers, which results in a total financial loss of USD 2.08 Million per year. The company is striving to overcome this loss in profit by analyzing the existing delays in terms of overtime, warranty claims, and outsourcing at a higher cost, etc. To investigate the prospects and advantages of POLCA integrated QRM strategy in the company, a framework was developed and executed considering the strengths and limitations of the selected manufacturing setup. This is explained in Figure 4. MRP scheduling is a prerequisite for implementing QRM. It is also important to set realistic performance indicators, i.e., reducing the lead time by considering demand and delivery.
The company manufactures a wide variety of products. In this study, only two products were selected and the POLCA integrated QRM approach was implemented within the existing production layout. Products A and B require different processing steps. The processing sequences of products A and B are shown in Figure 5 and Figure 6, respectively. LT represents the lead time, ALT is the actual lead time during manufacturing, and CLT is the calculated lead time for a product to be manufactured from start to end without any stoppage or delay (it is calculated from the part’s process sheets, including machine setup time and material handling time). CHR is the calculated production hours (it is the summation of the minimum production time that a product can take on every machine during the production process), AHR is the actual production hours (including all the delays and breakdowns), and Qty stands for quantity.

2.2. Research Questions

The implementation of the POLCA integrated QRM strategy was based on two main research questions:
How can the POLCA and QRM-based production processes be implemented while keeping the necessary elements intact to promise short delivery times?
How can optimum scheduling of production orders with POLCA be ensured to minimize late delivery and penalty costs after initiating a QRM-based production process?
Based on these research questions, the outcomes and analysis of the implemented strategy are discussed in the following sections.

2.3. Inputs for QRM—Aggregate Production Planning (APP)

The company follows an aggregate production plan (APP) covering 2 to 12 months. The APP of products A and B include the forecasted demand, HR (Human Resources) requirements, inventory requirement, time for demanding raw materials, machinery and equipment requirements, and finance requirement. The summarized cost estimates based on APP for products A and B are shown in Table 1 and Table 2, respectively.
From Table 1, it is evident that the cost (in PKR) for the constant workforce is minimal. Since the company uses a constant workforce and varying inventory, firing the workforce is inappropriate. Considering this, to meet the production targets, an overtime strategy is in practice. The summarized calculated (cost estimates) aggregate production plan for product B is given in Table 2.
From Table 2 we drew the conclusion that the cost of keeping a constant workforce, varying the inventory, and the workforce shortage technique is most suitable for product B due to the minimum associated cost. However, because of the company’s strategic objectives, the overtime choice was adopted to meet the production targets.

2.4. Inputs for QRM—Material Requirement Planning (MRP)

The MRP schedule maintained by the company for product A and all its assemblies is shown in Table 3. In this research, the authors considered the demand of 4 months starting from January and scheduled the order placement and release data of product A. In Table 3, the number of units of every assembly required for product A is mentioned along with the receipt and release dates of each order. The days on which orders were not received or released are not mentioned due to space limitations. The summarized MRP schedule of product B is presented in Table 4. The next section analyzes the scheduling procedure and evaluates the current performance.

2.5. Inputs for QRM-Analysis of Selected Products

As explained earlier in Section 1, QRM focuses on the reduction of work in process (WIP) and helps with managerial decisions to obtain the targets on the set lead time. In this study, the analysis was carried out considering the major indicators as production lead time, average delivery time, average WIP, and total loss in monetary value of the concerned products.

2.5.1. Analysis of Product A

The analysis in terms of demand and delivery schedule data for product A is illustrated in Figure 7. It is shown that for lot 1, a quantity of 105 was supposed to be delivered on the 19th day, according to lead time starting from raising requisition (RP) but this was delayed until the 57th day due to work in process and clustered queues. Similarly, other respective lots also delayed accumulatively. Figure 7 explains the overall delays and variation in the data.
With the help of the above data, the performance indicators were calculated, including the delay cost and percentage of loss in profit for product A. The performance indicators are summarized in Table 5. Note that the delay cost/day/unit was 297. The overall profit of the company against each lot is not shown here. Table 3 only shows the percentage of the profit lost by the company due to the delay in order delivery. The calculated and actual lead time were 17 and 88 days, respectively. It shows a huge difference and the inadequacy of the current methodology, which currently is in practice by the company.

2.5.2. Analysis of Product B

The current demand and delivery schedule for product B is shown in Figure 8. Figure 8 shows the variation in the actual and calculated delivery dates.
Following the same steps, the performance indicators of product B were calculated. In this case, the product was not penalized on day basis, instead, a lump sum amount of PKR 321,989 was imposed for each late delivery. The overall profit of the company against each lot is not shown here. Table 6 shows only the average loss in profit due to a delay in order delivery of product B. The high percentage of loss in profit depicts that the company is not using a suitable methodology for the manufacturing of product B. The actual and calculated lead times of product B were 24 and 77 days, respectively. Such a great difference between the calculated and actual lead time shows that the current company methodology needs a drastic change to improve the current setup and recover the percent loss in profit.

2.6. Implementation of POLCA Integrated QRM

From the above analysis, the company’s current methodology is not good enough to cope with reducing the delivery delays. The high variety and complex products result in the need for a new methodology to overcome the delayed deliveries and profit losses. Therefore, POLCA cards implemented under the umbrella of quick response manufacturing were considered to meet job target dates. The strategy implemented is explained in Figure 4. Cell formation is also a prerequisite to implement QRM in any organization. To carry out POLCA integrated QRM, the following steps are required:
(a)
Cell formation.
(b)
The calculation of POLCA cards; and
(c)
A layout plan, POLCA card overlapping loops, and the implementation of QRM.

2.6.1. Cell Formation

A cellular layout was proposed in which similar processes are grouped together in a cell. For example, the inspection activity taking place after every process can be grouped together as a central inspection and storage cell. The abbreviations of the operations involved in the manufacturing of different products by the company are detailed in Table 7. The cell formation was based on the ranked clustering technique (ROC). The cells formed after applying ROC are presented in Table A1 (Appendix A), given in the Appendix A. For a better understanding, the optimized cell formation is shown in Figure 9.

2.6.2. POLCA Card Calculation

The POLCA card strategy was used to control the material movement, reduce the lead time, and improve the delivery performance of the company’s products. The number of POLCA cards of each paired loop plays a key role in POLCA implementation. AB is the total number (round to integer value) of cards needed for the loop between any two processes A and B; NUM(A, B) is the number of jobs through the A–B loop within a given time period; LT(A) and LT(B) are the lead time at process A and B, respectively, including waiting time to initiate processing at process A (in days); MT(AB) is the transfer time (movement time) from A to B (in days); RT(BA) is the POLCA card return time from B to A; and D is the number of days. According to Suri (2010) [1], the following equation can be applied to calculate the number of POLCA cards over a particular time in days:
A B = L T ( A ) + M T ( A B ) + L T ( B ) + R T ( B A ) . N U M ( A , B ) D ( 1 + S )
A POLCA card resembles a domino, with the supplying workstation (SW) on one side and the receiving workstation (RW) on the other side. In this case, therefore, station SW needs a POLCA-card SW/RW to start with this specific order. To simplify the calculations, LTA and LTB are the estimated average lead time (in days) for the two cells in a POLCA loop over the length of the planning period D (in days). NUMA/B is the total number of jobs (measured in terms of the quantity) that go from cell A to cell B during the planning period. The number of POLCA cards (NA/B) in the POLCA loop going from cell A to cell B is given by
N A / B = [ L T A +   L T B ] × [ N U M A , B / D ]
For instance, the POLCA card for purchasing material (PR) to store (ST) is calculated as
NA/B = [5 + 0] × [1/5]
NA/B = 1
Small products are placed in bins and a POLCA card is attached to each bin. Bin size is decided based on the dimensions and units of each type of product. The number of bins is based on demand, size, and other factors. For simplification, a general formula is used to calculate the number of bins:
Number of bins = Demand/POLCA card
Number of bins = 518/1 = 518
This means that one POLCA card is needed to meet the demand of 518 products in five days and 518 bins. However, considering a greater lead time for a product, more POLCA cards are to be floated in the streamlined operations (referring to Figure 3, QRM has a margin of 20% unutilized production), keeping in view the available resources and customer delivery dates. The calculations of POLCA cards based on the lead time of product A are shown in Table 8. The total actual lead time for the manufacturing of the front shape of product 1 (P1) is 7 days. The allocated lead time provides us an estimate of how much we reduced our lead time, which was 4.73 days.
The respective number of POLCA cards for each of the over-looped paired cells for P1 and P2 front shape manufacturing are shown in Table 8 and Table 9, respectively. The paired loop analysis for FS P1 is shown in Figure 10. The system initiates with an order released by the ERP system. For example, as shown in Figure 10 and Figure 11, the PR station receives a POLCA card, then pre-production activities commence at ST as step 1. Next, the unfinished part is routed with either a P1/FS card or a P2/FS card to INSP for material testing before the actual machining operations. The priority of the card for P1 or P2 is followed by the customer order delivery date. After inspection, the material is sent to the next processing cells, HT, RM, and FM. The part tracks back to the INSP with the relevant card in semi-finished or finished states. After passing the INSP station, the products are handed over to the ST station and subsequently delivered to the customers.
The POLCA card is closed and kept for the record for any future data analysis and customer complaints. Therefore, the two types of POLCA cards are needed for PR supplying to receiving ST workstations. The paired loops for FS P2 are shown in Figure 11.
As the front shape and end shapes for both products are the same, the number of POLCA cards for each is routed simultaneously to reduce the lead time over the complete processing sequence; however, the cards are prioritized according to the customers’ delivery dates. The actual lead time of front shape (FS) for both P1 and P2 is 14.4 days, which was reduced to 5.23 days. In Table 10, the allocated time shows the greater value of time in days which was observed for manufacturing of the front shape (FS) either for P1 or P2. This allocated time becomes the demand accomplishing horizon and POLCA cards are calculated respectively for each process. This is explained in Table 10. The paired loop analysis for the FS manufacturing of P1 and P2 by simultaneously routing POLCA cards is shown in Figure 12.

2.6.3. Analysis after POLCA Card Implementation

After calculating basic inputs for implementing the POLCA integrated QRM strategy on the existing setup, the POLCA card implementation was executed and significant reduction in lead time was achieved. A comparison of pre- and post-implementation of this strategy is presented in Figure 13.
After implementing POLCA cards in the current system (Table 11), the “delay in days” was reduced to 1 day for lot number A1-05/1-2015 or even zero for the lot at serial numbers 2 and 3. This clearly demonstrates the benefit of the POLCA integrated QRM strategy in this case.

3. Economic Analysis of POLCA Integrated QRM

Post QRM analysis was carried out to verify the improvements attained in terms of lead time and net profit loss. The same criteria were applied for production lead time, average delivery time, average WIP, and total production loss of the selected products. The results of the analysis in terms of demand and delivery data for Product A are given in Figure 14. It is shown that for lot 1, according to the lead time from the MRP schedule, the quantity of 50 was delayed only by one day. Similarly, a drastic improvement in on-time delivery was noted for product A.
With the help of the above data, the performance indicators, including delay cost and percentage of loss in profit, were calculated were product A. These are shown in Table 12. It can be clearly observed that the percentage of profit loss due to a delay was reduced significantly to 0.3% (averaged estimated), which was originally more than 40 percent (Table 6). This depicts the effectiveness of the POLCA integrated QRM strategy. The actual and calculated lead times for product A were 19 and 17 days, respectively. Similarly, the current demand and delivery dates of product B are shown in Figure 15. It can be analyzed that the variation was greatly after applying the POLCA integrated QRM approach. The profit loss for product B was also reduced to a great extent, which is shown in Table 13. Considering these performance parameters, it can be concluded that the POLCA integrated QRM is a better choice by the company for the manufacturing of products A and B. The actual and calculated lead times of product B were 77 and 24 days, respectively.
With the help of the calculated data, the performance indicators, including delay cost and percentage of loss in profit, were analyzed for product B. These are shown in Table 13. The percentage of profit loss due to a delay in product B was significantly reduced.

4. Conclusions

This paper explained the advantages of the POLCA integrated QRM framework, which is grounded on exploiting the variability and system dynamics by implementing a case study. The findings of the research and its methodology directly contribute to the knowledge in the field of manufacturing product management. The main contributions of the presented research are:
  • At present, the implementation and acceptance of QRM and POLCA are gaining momentum in different industrial sectors. To the best of our knowledge, this is the first study that encapsulates the implementation of POLCA integrated QRM practices. The proposed strategy will support SME (small and medium-sized enterprises) administrators to comprehend the impact that utilization can be improved by reducing the lead-time by implementing POLCA cards in the QRM environment.
  • The published literature on QRM mostly covers the description and development of QRM’s principles. None of the research that has been noted on manufacturing management strategies presents any specific approach or methodology that focuses on QRM and the integration of POLCA as a case study. This research identified POLCA integrated QRM as an innovative framework and a promising approach. By implementing a case study, it was determined that QRM can be used by organizations as a self-assessment tool to identify improvement opportunities by reducing lead time.
  • This research also contributes to advancing the knowledge of QRM and POLCA. This knowledge covers various process parameters, theoretical perceptions, and insights into QRM and POLCA strategies by comparing them with other existing production management approaches, for example, the drawbacks associated with Push/MRP and Pull/Kanban, and limitations of lean manufacturing, etc.
  • After implementing POLCA integrated QRM, the company’s statistical figures improved substantially in terms of reducing the lead time and increasing the production quality, delivery, and flexibility to improve the profit. This shows that the QRM concept provides improvement opportunities for ETO products by integrating real-time information flow from production activities. This knowledge motivates the implementation of the innovative POLCA integrated approach presented in this research.
  • The case study also evaluated that companies can implement POLCA and QRM approaches by keeping their existing production elements intact to promise short delivery times. Moreover, optimum utilization can be achieved without compromising the critical capacity of actual machining, inspection, and assembly operations. These motivating factors provide an urge to adopt the new hybrid approaches for production management activities to reduce the overall lead time.
The implemented case study shows that the company’s product delivery delay was reduced considerably, from 74.5 days to 1 for product A and from 77 days to 1 for product B. The delay was also totally reduced to zero for some lots, for example, product A lot number A1-05/1-2015 and product B lot numbers A1-01-15 and A1-04-15. This clearly demonstrated the benefit of the POLCA integrated QRM strategy. By reducing the delivery delays (focusing on lead time), the percent of total profit loss was significantly reduced to 0.3% (averaged estimated), which was originally more than 40% before the implementation of the POLCA integrated QRM strategy. In this research, only two products were selected for analysis due to time constraints. For future research, the scope of work can be extended by including more products to get a better comprehension of the implemented strategy and its impact on the overall performance.

Author Contributions

Conceptualization, Q.S.K.; Formal analysis, M.A.; Methodology, S.A., A.R.B.; Supervision, W.W. and H.L.; writing—original draft, R.K., W.S., W.W. and H.L. All authors have read and agreed to the published version of the manuscript.

Funding

This research received no external funding.

Institutional Review Board Statement

Not applicable.

Informed Consent Statement

Not applicable.

Data Availability Statement

Data will be available on demand.

Conflicts of Interest

The authors declare no conflict of interest.

Appendix A

Table A1. Cell formation after ROC.
ProcessesProduct(s)ProductCell
FSTSGFEDCBAFSTSC-1CB-1BA-1
RRA and B11111111111111111
STA and B11111111111111111
PRA and B11111111111111111
STA and B11111111111111111
HTA and B22000000022200002
RMA and B33000000033000003
FMA and B33000000033000003
DSA and B00400044000044404
JSA and B00044000000400004
WA and B00500005000050505
ICA and B00660056000060606
FCA and B00660666000066606
IRM INSP (1)A and B77777777777777777
HT INSP (2)A and B77000000077700007
RM and FM INSP (3)A and B77000000077000007
Final RM/FM INSPA and B77000000077000007
DS INSP (4)B00000000000700007
INSP W (5)B00000000000700007
IC INSP (6)A and B00760077000070707
INSP R, W, F (8)A and B00070000000700007
INSP LT (9)A and B00000000700700007
ET INSP (10)A and B00007000000000007
(11)A and B00000700000000007
Fill and F INSP (12)A and B00000070000077007
T and G INSP (13)A and B00000000700000077
P INSP (14)A and B00000000700000077
I.INSP (15)A and B00000000700000077
PKG. INSP (16)A and B00000000700000077
RB00000000000800008
WB00000000000800008
FA and B00080000000800008
LTB00000000900900009
ETA0000100000000000010
PosA0000011000000000011
FillingA and B00000012000001200012
FB0000000000000120012
TA and B00000000130000001313
GA and B00000000130000001313
PA and B00000000140000001414
F.IA and B00000000150000001515
PKGA and B00000000160000001616

References

  1. Suri, R. It’s about Time, the Competitive Advantage of Quick Response Manufacturin; Productivity Press Taylor and Francis: Thames, UK, 2010; ISBN 9781439805954. [Google Scholar]
  2. Jitpaiboon, T.; Gu, Q.; Truong, D. Evolution of competitive priorities towards performance improvement: A meta-analysis. Int. J. Prod. Res. 2016, 54, 7400–7420. [Google Scholar] [CrossRef]
  3. Suri, R.; Rath, F. Proceedings of the QRM 2002: The Third Annual Conference on Quick Response Manufacturing; Center for Quick Response Manufacturing: Madison, WI, USA, 2002. [Google Scholar]
  4. Stevenson, M.; Hendry, L.C.; Kingsman, B.G. A review of production planning and control: The applicability of key concepts to the make-to-order industry. Int. J. Prod. Res. 2005, 43, 869–898. [Google Scholar] [CrossRef]
  5. Chavez, R.; Yu, W.; Jacobs, M.; Fynes, B.; Wiengarten, F.; Lecuna, A. Internal lean practices and performance: The role of technological turbulence. Int. J. Prod. Econ. 2015, 160, 157–171. [Google Scholar] [CrossRef] [Green Version]
  6. Godinho Filho, M.; Ganga, G.M.D.; Gunasekaran, A. Lean manufacturing in Brazilian small and medium enterprises: Implementation and effect on performance. Int. J. Prod. Res. 2016, 54, 7523–7545. [Google Scholar] [CrossRef]
  7. Bevilacqua, M.; Ciarapica, F.E.; Paciarotti, C. Implementing lean information management: The case study of an automotive company. Prod. Plan. Control 2015, 26, 753–768. [Google Scholar] [CrossRef]
  8. Jamal, A.; Sarker, B.R.; Mondal, S. Optimal manufacturing batch size with rework process at a single-stage production system. Comput. Ind. Eng. 2004, 47, 77–89. [Google Scholar] [CrossRef]
  9. Sarkar, B.; Cárdenas-Barrón, L.E.; Sarkar, M.; Singgih, M.L. An economic production quantity model with random defective rate, rework process and backorders for a single stage production system. J. Manuf. Syst. 2014, 33, 423–435. [Google Scholar] [CrossRef]
  10. Godinho Filho, M.; Marchesini, A.G.; Riezebos, J.; Vandaele, N.; Ganga, G.M.D. The application of Quick Response Manufacturing practices in Brazil, Europe, and the USA: An exploratory study. Int. J. Prod. Econ. 2017, 193, 437–448. [Google Scholar] [CrossRef]
  11. Elmaraghy, H.A. Flexible and reconfigurable manufacturing systems paradigms. Int. J. Flex. Manuf. Syst. 2005, 17, 261–276. [Google Scholar] [CrossRef]
  12. Womack, J.P.; Jones, D.T. Beyond Toyota: How to root out waste and pursue perfection. Harv. Bus. Rev. 1996, 74, 140–158. [Google Scholar]
  13. Suri, R. Quick Response Manufacturing: A Companywide Approach to Reducing Lead Times; CRC Press: Boca Raton, FL, USA, 1998. [Google Scholar]
  14. Flavio, C.F.; Eduardo, G.; Moacir, G.F.; Fábio, M.S. Proposal of a Method to Achieve Responsive 41 Manufacturing in the Footwear Industry: Implementation and Assessment through Research-Action. Gestão Produção 2012, 19, 509–529. [Google Scholar] [CrossRef] [Green Version]
  15. Saes, E.V.; Godinho Filho, M. Quick Response manufacturing approach in a school supply company: Proposal and analysis of expected results. Gestão Produção 2011, 18, 525–540. [Google Scholar] [CrossRef] [Green Version]
  16. Chinet, F.S.; Godinho Filho, M. POLCA System: Literature Review, Classification, and Analysis. Gestão Produção 2014, 21, 532–542. [Google Scholar] [CrossRef]
  17. Germs, R.; Riezebos, J. Workload balancing capability of pull systems in MTO production. Int. J. Prod. Res. 2009, 48, 2345–2360. [Google Scholar] [CrossRef]
  18. Vandaele, N.; Inneke, V.N.; Diederick, C.; Rony, C. Load-Based POLCA: An Integrated Material Control System for Multiproduct, Multi-machine Job Shops. J. Manuf. Serv. Oper. Manag. 2008, 10, 181–197. [Google Scholar] [CrossRef]
  19. Godinho Filho, M.; Saes, E.V. From Time-Based Competition (TBC) to Quick Response Manufacturing (QRM): The Evolution of Research Aimed at Lead Time Reduction. Int. J. Adv. Manuf. Technol. 2013, 64, 1177–1191. [Google Scholar] [CrossRef]
  20. Markov, D.A.; Markova, N.A. Quick Response Manufacturing as a Concept of an Enterprise Competitiveness Increase. In Social and Economic Sciences Series; Bulletin of the Perm National Research Polytechnical University: Perm, Russia, 2016; Volume 2, pp. 181–193. [Google Scholar]
  21. Gholami, O.; Sotskov, Y.N.; Werner, F.; Zatsiupo, A.S. Heuristic algorithms to maximize revenue and the number of jobs processed on parallel machines. Autom. Remote Control. 2019, 80, 297–316. [Google Scholar] [CrossRef]
  22. Saleem, W.; Ijaz, H.; Alzahrani, A.; Rubaiee, S.; Khan, M.A. Assessment of Optimal Production through Assembly Line-Balancing and Product-Mix Flexibility. Int. J. Eng. Technol. 2018, 7, 32–36. [Google Scholar]
  23. Birkie, S.E.; Trucco, P. Understanding dynamism and complexity factors in engineer-to-order and their influence on lean implementation strategy. Prod. Plan. Control 2016, 27, 345–359. [Google Scholar] [CrossRef]
  24. Manoj, D.; Dirk, V.G.; Maneesh, K.; Adrienn, M.; Xavier, G. Application of lean practices in small and medium-sized food enterprises. Br. Food J. 2014, 116, 125–141. [Google Scholar]
  25. Bortolotti, T.; Boscari, S.; Danese, P. Successful lean implementation: Organizational culture and soft lean practices. Int. J. Prod. Econ. 2015, 160, 182–201. [Google Scholar] [CrossRef] [Green Version]
  26. Vinodh, S.; Asokan, P. ISM and Fuzzy MICMAC application for analysis of Lean Six Sigma barriers with environmental considerations. Int. J. Lean Six Sigma 2018. [Google Scholar] [CrossRef]
  27. Garza-Reyes, J.A. Lean and green–a systematic review of the state of the art literature. J. Clean. Prod. 2015, 102, 18–29. [Google Scholar] [CrossRef] [Green Version]
  28. Farnoush, A.; Wiktorsson, M. POLCA and CONWIP performance in a divergent production line: An automotive case study. J. Manag. Control 2013, 24, 159–186. [Google Scholar] [CrossRef]
  29. Mabert, V.A. The early road to material requirements planning. J. Oper. Manag. 2007, 25, 346–356. [Google Scholar] [CrossRef]
  30. Ten Hoonte, J.D. A Quick Response Manufacturing Maturity Model & GAP Analysis: Multiple-Case Study on the QRM Concept Implementation and Importance Developing a Customized Improvement Guide. Master’s Thesis, Faculty of Economics and Business, University of Groningen, Groningen, The Netherlands, 2012. [Google Scholar]
  31. George, S. Time—The Next Source of Competitive Advantage. Harv. Bus. Rev. 1988, 66, 41–51. [Google Scholar]
  32. Qazi, S.K.; Muhammad, A.; Shahid, M.; Mirza, J.; Abdur, R.B.; Imran, K.; Jabir, M.; Sunghwan, K. Hybrid Particle Swarm Algorithm for Products’ Scheduling Problem in Cellular Manufacturing System. Symmetry 2019, 11, 729. [Google Scholar] [CrossRef] [Green Version]
  33. Qazi, S.K.; Muhammad, A.; Mudassar, R.; Mirza, J.; Shahid, M. Hybrid particle swarm algorithm for scheduling in cellular manufacturing system–A case study. J. Engg. Appl. Sci. 2019, 38, 2019. [Google Scholar]
  34. Joseph, O. Material Requirements Planning; McGraw-Hill: New York, NY, USA, 1975. [Google Scholar]
  35. Kahl, S. Utilizing Use: The Effect of Customer Learning and Evaluation on Technology and Industry Evolution; MIT: Cambridge, MA, USA, 2006; Available online: http://web.mit.edu/iandeseminar/Papers/Fall2006/Kahl.pdf (accessed on 18 March 2021).
  36. Vollmann, T.E. Manufacturing Planning and Control for Supply Chain Management; McGraw-Hill: New York, NY, USA, 2005. [Google Scholar]
  37. Fleischmann, B.; Meyr, H.; Wagner, M. Advanced planning. In Supply Chain Management and Advanced Planning; Springer: Berlin/Heidelberg, Germany, 2005; pp. 81–106. [Google Scholar]
  38. Wei, W.; Liu, A.; Lu, S.C.Y.; Wuest, T. Product Requirement Modeling and Optimization Method Based on Product Configuration Design. Procedia Cirp 2015, 36, 1–5. [Google Scholar] [CrossRef] [Green Version]
  39. Spearman, M.L.; Zazanis, M.A. Push and pull production systems: Issues and comparisons. Oper. Res. 1992, 40, 521–532. [Google Scholar] [CrossRef]
  40. Matson, J.E.; Matson, J.O. Just-in-time implementation issues among automotive suppliers in the southern USA. Supply Chain Manag. Int. J. 2007, 12, 432–443. [Google Scholar] [CrossRef]
  41. Alcaraz, J.L.G.; Maldonado, A.A.; Iniesta, A.A.; Robles, G.C.; Hernández, G.A. A systematic review/survey for JIT implementation: Mexican maquiladoras as case study. Comput. Ind. 2014, 65, 761–773. [Google Scholar] [CrossRef]
  42. Cardenas-Barrón, L.E. Economic production quantity with rework process at a single-stage manufacturing system with planned backorders. Comput. Ind. Eng. 2009, 57, 1105–1113. [Google Scholar] [CrossRef]
  43. Krishnamurthy, A.; Suri, R. Planning and implementing POLCA: A card-based control system for high variety or custom engineered products. Prod. Plan. Control 2009, 20, 596–610. [Google Scholar] [CrossRef]
  44. Pieffers, J.; Jan, R. Polca as an Innovative Material Management System; Technical Report; Faculty of Business Administration, University of Groningen: Groningen, The Netherlands, 2006; Available online: https://www.rug.nl/staff/j.riezebos/Polca_Materiaalbeheersing.pdf (accessed on 18 March 2021). (In Dutch)
  45. Bhatewara, V. Analysis of POLCA and GPOLCA Material Control Strategies. Master’s Thesis, Department Mechanical Engineering, University of Pune, Pune, India, 2010. [Google Scholar]
  46. Braglia, M.; Castellano, D.; Frosolini, M. Optimization of POLCA-controlled production systems with a simulation-driven genetic algorithm. Int. J. Adv. Manuf. Technol. 2013, 70, 385–395. [Google Scholar] [CrossRef]
Figure 1. The advantage of Quick Response Manufacturing (QRM) over other manufacturing paradigms.
Sustainability 13 03452 g001
Figure 2. QRM theory vs. cost-based push production strategy.
Sustainability 13 03452 g002
Figure 3. Flow and resource efficiency (QRM vs. Lean).
Sustainability 13 03452 g003
Figure 4. Research methodology implementing the POLCA (Paired Cell Overlapping Loops of Cards) integrated QRM strategy.
Sustainability 13 03452 g004
Figure 5. Processing sequence and production time of product A.
Sustainability 13 03452 g005
Figure 6. Processing sequence and production time of product B.
Sustainability 13 03452 g006
Figure 7. Variation in data of product A.
Sustainability 13 03452 g007
Figure 8. Variation plot for product B.
Sustainability 13 03452 g008
Figure 9. Optimized cell formation based on ROC (Ranked Clustering Technique).
Sustainability 13 03452 g009
Figure 10. Paired-loop analysis of FS P1 (P1/FS POLCA card routing).
Sustainability 13 03452 g010
Figure 11. Paired-loop analysis of FS P2 (P2/FS POLCA card routing).
Sustainability 13 03452 g011
Figure 12. Paired-loop analysis of FS P1 and P2 (P1/FS and P2/FS POLCA card routing).
Sustainability 13 03452 g012
Figure 13. Lead time in days (pre- and post-implementation of POLCA integrated QRM).
Sustainability 13 03452 g013
Figure 14. Demand and delivery date of product A after QRM.
Sustainability 13 03452 g014
Figure 15. Demand vs. delivery for product B.
Sustainability 13 03452 g015
Table 1. Aggregate production plan for product A.
Summary
Plan DescriptionHiringLayoffSub-ContractShift TimeOvertimeShortageExcess InventoryTotal Cost
Exact production; vary workforce560,0001,640,000N/A9,642,404N/AN/AN/A11,842,404
Constant workforce; vary inventoryN/AN/AN/A9,596,160N/A16,21870,1529,682,530
Constant workforce; subcontractN/AN/A4,523,0699,596,160N/AN/AN/A14,119,229
Constant work force; overtimeN/AN/AN/A9,996,00048,436N/AN/A10,044,436
Table 2. Aggregate production plan for product B.
Plan DescriptionHiringLayoffSub-ContractShift TimeOvertimeShortageExcess InventoryTotal Cost
Exact production; vary workforce1,000,0003,200,000N/A43,168,285N/AN/AN/A47,368,285
Constant workforce; vary inventoryN/AN/AN/A32,135,040N/A113,20122,72132,270,962
Constant workforce; subcontractN/AN/A48,572,94132,135,040N/AN/AN/A80,707,981
Constant workforce; overtimeN/AN/AN/A33,474,000250,327N/AN/A33,724,327
Table 3. MRP (Material Requirements Planning) of product A.
Month Month 1Month 2Month 3Month 4Total
Weeks 234234234234
Days 911121314161921333536373840434554565758596164667880818283858890
Product ARequired 110 150 150 120530
Order 105 150 150 120 525
Assembly BRequired 105 150 150 120 525
Order 102 150 150 120 522
Assembly CRequired 102 150 150 120 522
Order 100 150 150 120 520
Assembly DRequired 100 150 150 120 520
Order 99 150 150 120 519
Assembly ERequired 99 150 150 120 519
Order 99 150 150 120 519
Assembly FRequired 98 150 150 120 518
Order 98 150 150 120 518
Assembly GRequired 98 150 150 120 518
Order98 150 150 120 518
Table 4. MRP of product B.
MonthMonth 1Month 2Month 3Month 4Total
Weeks13 13 234234
Days21012141921263436384345475557596466717981838890
Product A-1Required 50 89 125 78342
Order 48 89 125 78 340
Assembly BRequired 48 89 125 78 340
Order 43 89 125 78 335
Assembly B-1Required 43 89 125 78 335
Order 40 89 125 78 332
Assembly CRequired 40 89 125 78 332
Order 38 89 125 78 330
Assembly C-1Required 38 89 125 78 330
Order3 89 125 78 329
Table 5. Delay and profit loss of product A.
SrLot NumberQuantityDelay in DaysTotal Delay Cost% Loss in Profit
1P1-01-15105571,779,18232.1%
2P1-02-15150893,964,95050.2%
3P1-03-15150813,611,87345.7%
4P1-04-15120712,532,77040.0%
Average 74.511,627,11042.0%
Table 6. Delay and profit loss of product B.
SrLot NumberQuantityDelay in DaysTotal Delay Cost% Loss in Profit
1P2-01-1550592,944,59233.3%
2P2-02-1589726,396,25440.6%
3P2-03-1512510112,601,85756.9%
4P2-04-1578765,917,13442.8%
Average 7726,285,72843.4%
Table 7. Abbreviations of production processes involved in the company.
ProcessShort KeyProcessShort Key
Raising requisitionRRFittingFT
StoreSTEarthlingET
PurchasingPRPositioningP
Initial and final inspectionIFMold/die settingDS
Rough machiningRMFillingFill
Jig settingJSFoamingF
RollingRWindingW
WeldingWLCuttingC
Leak testLTTurningT
GrindingGPaintingP
PackagingPKGHeat treatmentHT
Initial inspectionI.INSPFinal inspectionF.INSP
InspectionINSPInitial curingIC
Final machiningFMFinal curingFC
Initial rough machiningIRMPolishingPos
Table 8. POLCA card for front shape of product 1 (FS P1).
Front Shape Data P1
S #Process fromProcess toLead Time Process 1 (Days)Lead Time Process 2 (Days)Allocated Time (Days)Demand Qty/PeriodNumber of POLCA CardsNo. of Bins
1PurchasingStore5055181518
2PurchasingInspection5335182324
3InspectionHT31.20.986254
4HTInspection1.211.286102
5InspectionR&F machining13.80.886325
6Rough & Finish machiningInspection3.810.886325
7InspectionStore100.70681
7 4.73
Table 9. POLCA cards for FS P2.
Front Shape Data P2
S #Process fromProcess toLead Time Process 1 (Days)Lead Time Process 2 (Days)Allocated Time (Days)Demand Qty/PeriodNumber of POLCA CardsNo. of BinsAverage Allocated Time
1PurchasingStore50534213425.00
2PurchasingInspection53334222143.00
3InspectionHT31.41.1741541.17
4HTInspection1.411.374721.37
5InspectionR&F machining140.8842260.88
6R&F machiningInspection411.0041951.00
7InspectionStore100.804510.80
7.4 5.22 5.23
Table 10. Front shape MNF P1 and P2.
Front Shape MNF P1 and P2
SrProcess fromProcess toLead Time Process 1 (Days)Lead Time Process 2 (Days)Allocated Time (Days)Demand Qty/PeriodNumber of POLCA CardsNo. of Bins
1PurchasingStore5058601860
2PurchasingInspection5338602538
3InspectionHT31.41.1710374
4HTInspection1.411.3710172
5InspectionR&F machining140.8810556
6Rough & Finish machiningInspection411.0010495
7InspectionStore100.8010121
Total14.45.23
Table 11. Post-POLCA delays.
Sr NumberLot NumberDemand QtyDue Date Start DateMNF DateDelay in Days
1A1-05/1-2015506-May-151-May-157-May-151
2A1-05/2-20155314-May-158-May-1514-May-150
3A1-05/3-20154720-May-1515-May-1521-May-151
4A1-05/4-20155028-May-1522-May-1528-May-150
Table 12. Profit loss detail of product A after POLCA integrated QRM.
Product A
Sr NumberLot NumberQuantityDelay in DaysTotal Delay CostLost in Profit MNF% Loss in Profit
1A1-05/1-201550114,86414,8640.6%
2A1-05/2-2015530000.0%
3A1-05/3-201547114,26914,2690.5%
4A1-05/4-2015500000.0%
Average 0.529,72729,7270.3%
Table 13. Loss of profit of product B after the POLCA integrated QRM strategy.
Sr. NumberLot NumberQuantityDelay in DaysTotal Delay CostLost in Profit Due to Delay in MNF% Loss in Profit
1A1-01-15210000%
2A1-02-15201623762370.5%
3A1-03-15191564356430.5%
4A1-04-15230000%
Average830.5594059400.3%
Publisher’s Note: MDPI stays neutral with regard to jurisdictional claims in published maps and institutional affiliations.

