
Neighborhood Built Environments, Walking, and Self-Rated Health among Low-Income Older Adults in St. Paul, Minnesota

Asia Research Institute, National University of Singapore, Singapore 119260, Singapore
Sustainability 2021, 13(6), 3501; https://0-doi-org.brum.beds.ac.uk/10.3390/su13063501
Submission received: 27 January 2021
/
Revised: 9 March 2021
/
Accepted: 12 March 2021
/
Published: 22 March 2021
(This article belongs to the Special Issue Human Lifestyles and Behaviors. Sustainable Environments for Better Health, Quality of Life and Wellbeing)
Abstract
:There have been few studies exploring the relationship between objective and perceived neighborhood built environments, sustainable neighborhood walking behaviors, and the self-rated health of older, low-income adults. This study examined the association between objective neighborhood environments (i.e., neighborhood heterogeneity categorized by Walk Scores or levels of traffic accidents within a 400 or 800 m radius buffer measured by geographic information systems) and perceived neighborhood environments, through two conceptual frameworks (i.e., an ecological model of health behavior/aging) for walking outcomes (walking choice, walking 3+ days, and walking 150+ min a week) and the self-rated health of older adults living in subsidized housing (N = 130, Mage = 74.9 ± 8.3) in St. Paul, Minnesota. The primary analysis is composed of logistic regression models. Key findings indicated that highly walkable neighborhoods also had a higher level of traffic accidents. Thus, the neighborhoods with higher Walk Scores or a higher level of traffic accidents in separate models became negative predictors for all three walking outcomes, with statistical significance. However, other associations with perceived neighborhood environments resulted in different walking outcomes: accessibility to destinations (+) for walking 3+ days a week and 150+ min a week; safety, comfort, and convenience (+) for walking choice and walking 150+ minutes a week; and physical and social disorder (−) for walking 150+ min a week. Self-rated health had no relationship to objective measures but positive relationships to perceptions of safety, comfort and convenience of neighborhood environments, and every walking outcome in each model. The results of this study should be confirmed in a longitudinal study with a larger sample size covering a wider geographical area.
1. Introduction
As the percentage of older populations increases around the world, the ratio of the aging population in the United States is also projected to increase, from 21.5% in 2017 to 27.8% in 2050 [1]. Recently, health care issues for older adults have become prioritized concerns. Older adults are likely to be the least active group among all age groups [2]. Thus, “active aging” has become a key issue for healthy living [3]. The concept of “active aging” has been introduced by the World Health Organization and is defined as “the process of optimizing opportunities for health, participation and security in order to enhance quality of life as people age” [4] (p. 12). Along with “active aging”, the term “age-friendly cities” suggests safe and barrier-free physical environments for older adults to avoid physical health problems and to reduce social isolation and depression [4] through out-of-home mobility (e.g., walking).
It is recommended that older American adults engage in moderate-intensity physical activities for more than 150 minutes per week [5]. This is the equivalent of 30 min of physical activity for five days or more per week [6]. Adults who have mobility issues are also advised to perform physical activity for three or more days per week for balance improvement and fall prevention [7]. According to the National Health and Nutrition Examination Survey (NHANES), only 12.3% of older adults in the United States perform ambulatory physical activity (walking or running) for more than 150 min per week based on accelerometer counts, which are objective measures of physical activity [8]. This small ratio of physical activity is likely related to unsupportive built environments (e.g., uneven sidewalks, numerous traffic accidents, or limited destinations) or mobility limitations of older adults. Light-intensity physical activity (e.g., walking 3+ days per week), which does not meet the recommended guidelines, supports the physical and mental health of older adults [9], but it has often been overlooked [10].
As the most common physical activity, free and available to all, walking is easily performed in the neighborhood regardless of income level [11,12]. It is easily integrated into older adults’ daily routines, such as walking to shops and restaurants [13], requires minimal equipment, and the intensity is self-adjustable [10]. However, increases in age and physical limitations of older adults can become important barriers to walking [14]. Their life spaces are more likely to shrink to just home and the immediate neighborhood [15,16]. Accordingly, understanding older adults’ immediate neighborhood environment and its influence is important for supporting the active aging of older adults and maintaining their health status. Specifically, socioeconomically disadvantaged individuals tend to walk for longer periods of time and more frequently compared to advantaged individuals for transport walking [17,18,19] in their neighborhoods, since they have more limited ability to afford a car or take public transportation [20]. Thus, understanding of the neighborhood built environments and physical limitations for this group in particular is an important link to their health status.
There are two conceptual frameworks explaining the relationship between older adults’ behaviors/physical competency and their environments. The first framework is an ecological model of aging suggested by Lawton. The balance between environmental pressure (e.g., characteristics or barriers of built environments) and competence (capability) of the individuals results in healthy and successful aging through person–environment interactions [21]. Competency of individuals means the ability to be active in their built environments. This is relevant to understanding older adults who have physical or mobility limitations. The second framework is an ecological model of health behaviors suggested by Sallis and colleagues [22]. This framework explains how “active living” “incorporates exercise, recreational activities, household and occupational activities, and active transportation” [23] (p. 298). Active living is relevant to (1) intrapersonal (demographical, biological, psychological, and family situations), (2) perceived environments (safety, attractiveness, comfort, accessibility, and convenience), (3) behavioral domains (active transport and recreation, household and occupational activities), (4) behavioral setting (e.g., neighborhoods: walkability, traffic, pedestrian facilities), and (5) policy (health care policy) [23].
In this study, as a type of physical activity, walking is defined as the sum of walking for both transport and recreational purposes (i.e., total walking) in neighborhoods. Neighborhood built environments incorporate urban design features, land use mix, and transportation infrastructure [24]. These characteristics are objectively assessed and subjectively perceived, as they relate to walking behaviors. As a land use index, walkability is commonly studied to explain walking behaviors of older adults [10,25,26]. Walkability is concomitant with both transport walking and total walking, according to systematic reviews of older adults’ walking [27]. Cheng et al. (2021) [28] argued that spatially heterogeneous built environments impact walking behaviors among older adults. However, exploring the association between land use and walking behaviors, which is commonly measured by walkability/Walk Scores, does not provide potentially essential information on spatial distribution. Thus, other measures such as the number of pedestrian-involved traffic accidents have been used to find nuanced differences in walkability/Walk Scores [29,30]. Although a limited number of studies have looked at average numbers of traffic collisions, they have found that a higher average number of traffic accidents in a neighborhood discouraged older adults from walking for transport and recreation in the U.S. [31]. A broader concept such as the objective and perceived safety from traffic has been more commonly utilized than the average number of traffic accidents at intersections. In particular, perceptions of safety from traffic have been used more frequently than objective measures [32]. Perceived neighborhood characteristics such as diversity of land use mix, accessibility to destinations, and walking amenities are also associated with walkability, including utilitarian walking [27,33]. Some infrastructural features and safety-related characteristics in neighborhood environments (e.g., attractiveness, safety from traffic and crime, pedestrian infrastructure, green spaces and parks, no physical barriers) have positive influences on the walking behaviors of older adults [34]. The measurements of these features have relied on both objective data and the perceptions of older adults. However, the perceptions of older adults are the more frequently used measurement method. Higher perceptions of personal safety, safety from traffic and crime, pedestrian infrastructures supporting comfortable walking, and neighborhood aesthetics all encourage more walking by older adults [35,36,37,38,39,40,41]. On the other hand, negative perceptions of neighborhood environments (i.e., perceived physical or social disorder) discourage total walking by the elderly [42].
There are a great many published papers on neighborhood built environments (in particular, measuring the perceptions of these environments), older adults’ walking, and their self-rated health. However, there is a limited body of literature concentrating on low-income older adults [43]. In particular, there are few studies measuring the relationship between objective measures of built environments (i.e., spatial heterogeneity classified by Walk Scores or traffic accidents at intersections in the areas of the participants’ housing) and walking outcomes among low-income older adults in the United States. To shed light on these gaps, the overarching aim of this study was to explore the associations between physical limitations, objective and perceived neighborhood built environments, walking behaviors, and the self-rated health of low-income seniors. Two research questions were identified:
1. Do objective and perceived neighborhood built environments influence low-income older adults’ walking? Objective neighborhood environments (i.e., spatial differences represented by levels of Walk Scores or traffic accidents at intersections) and seniors’ perceptions of neighborhoods—such as accessibility to destinations; safety, comfort, and convenience; and physical and social disorder—are likely to influence older adults’ walking. To capture the nuanced spatial differences by housing location, either the level of Walk Scores or the level of car accidents at intersections within radius buffers was utilized as a method to categorize each housing location.
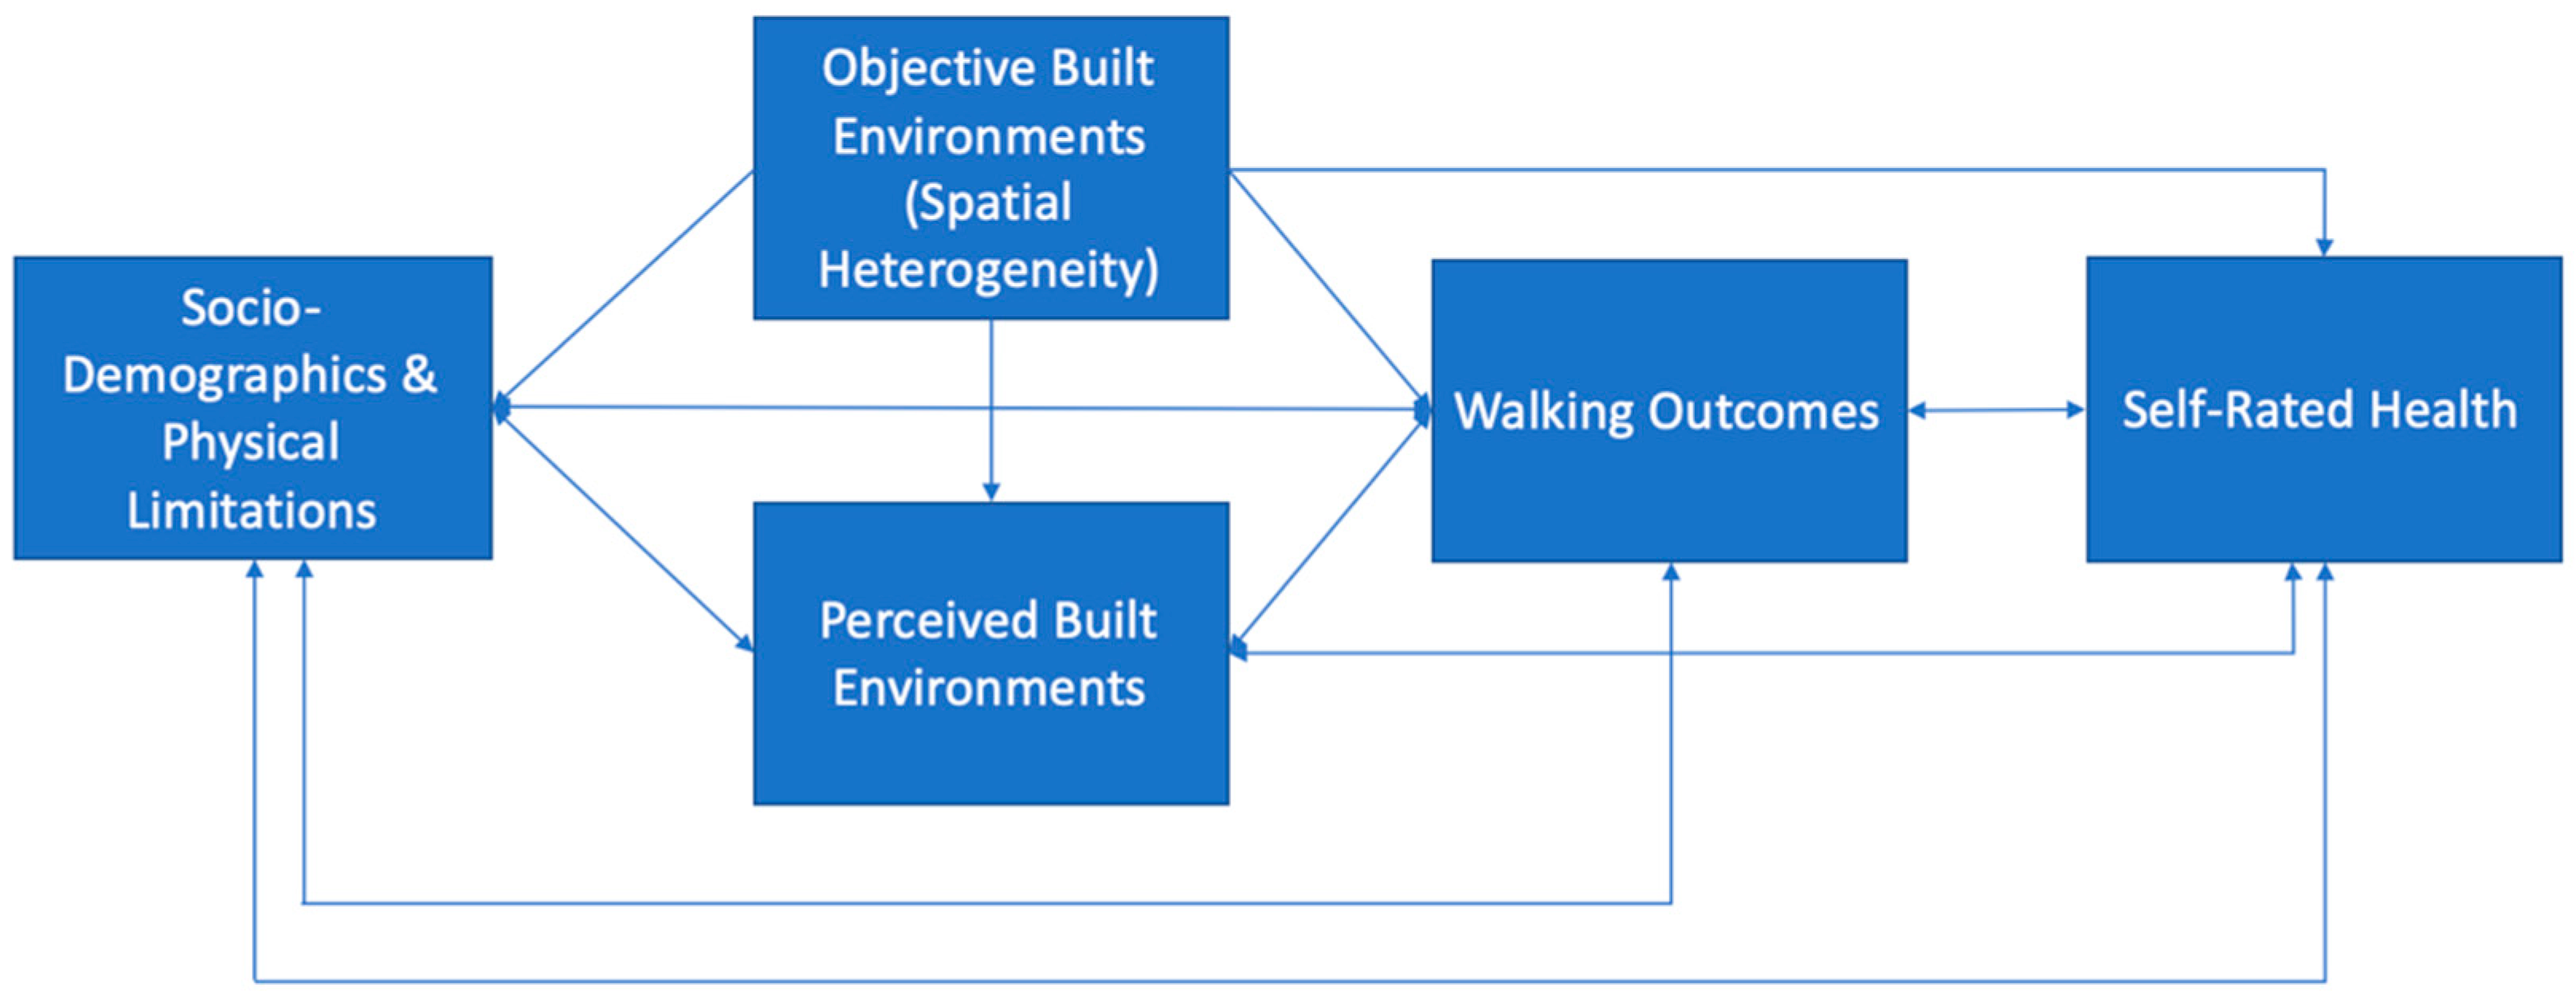
2. Do objective and perceived neighborhood environments and low-income older adults’ walking correspond to their self-rated health? The author anticipated that the objective and perceived neighborhood environments as well as different types of individual walking behaviors (i.e., walking choices, walking 3+ days a week or walking 150+ minutes per week) were associated with self-rated health. All of the models in this research were adjusted by covariates such as sociodemographics and physical limitations. The conceptual framework for this study is demonstrated in Figure 1.
2. Methods
2.1. Sampling and Data Collection Procedure
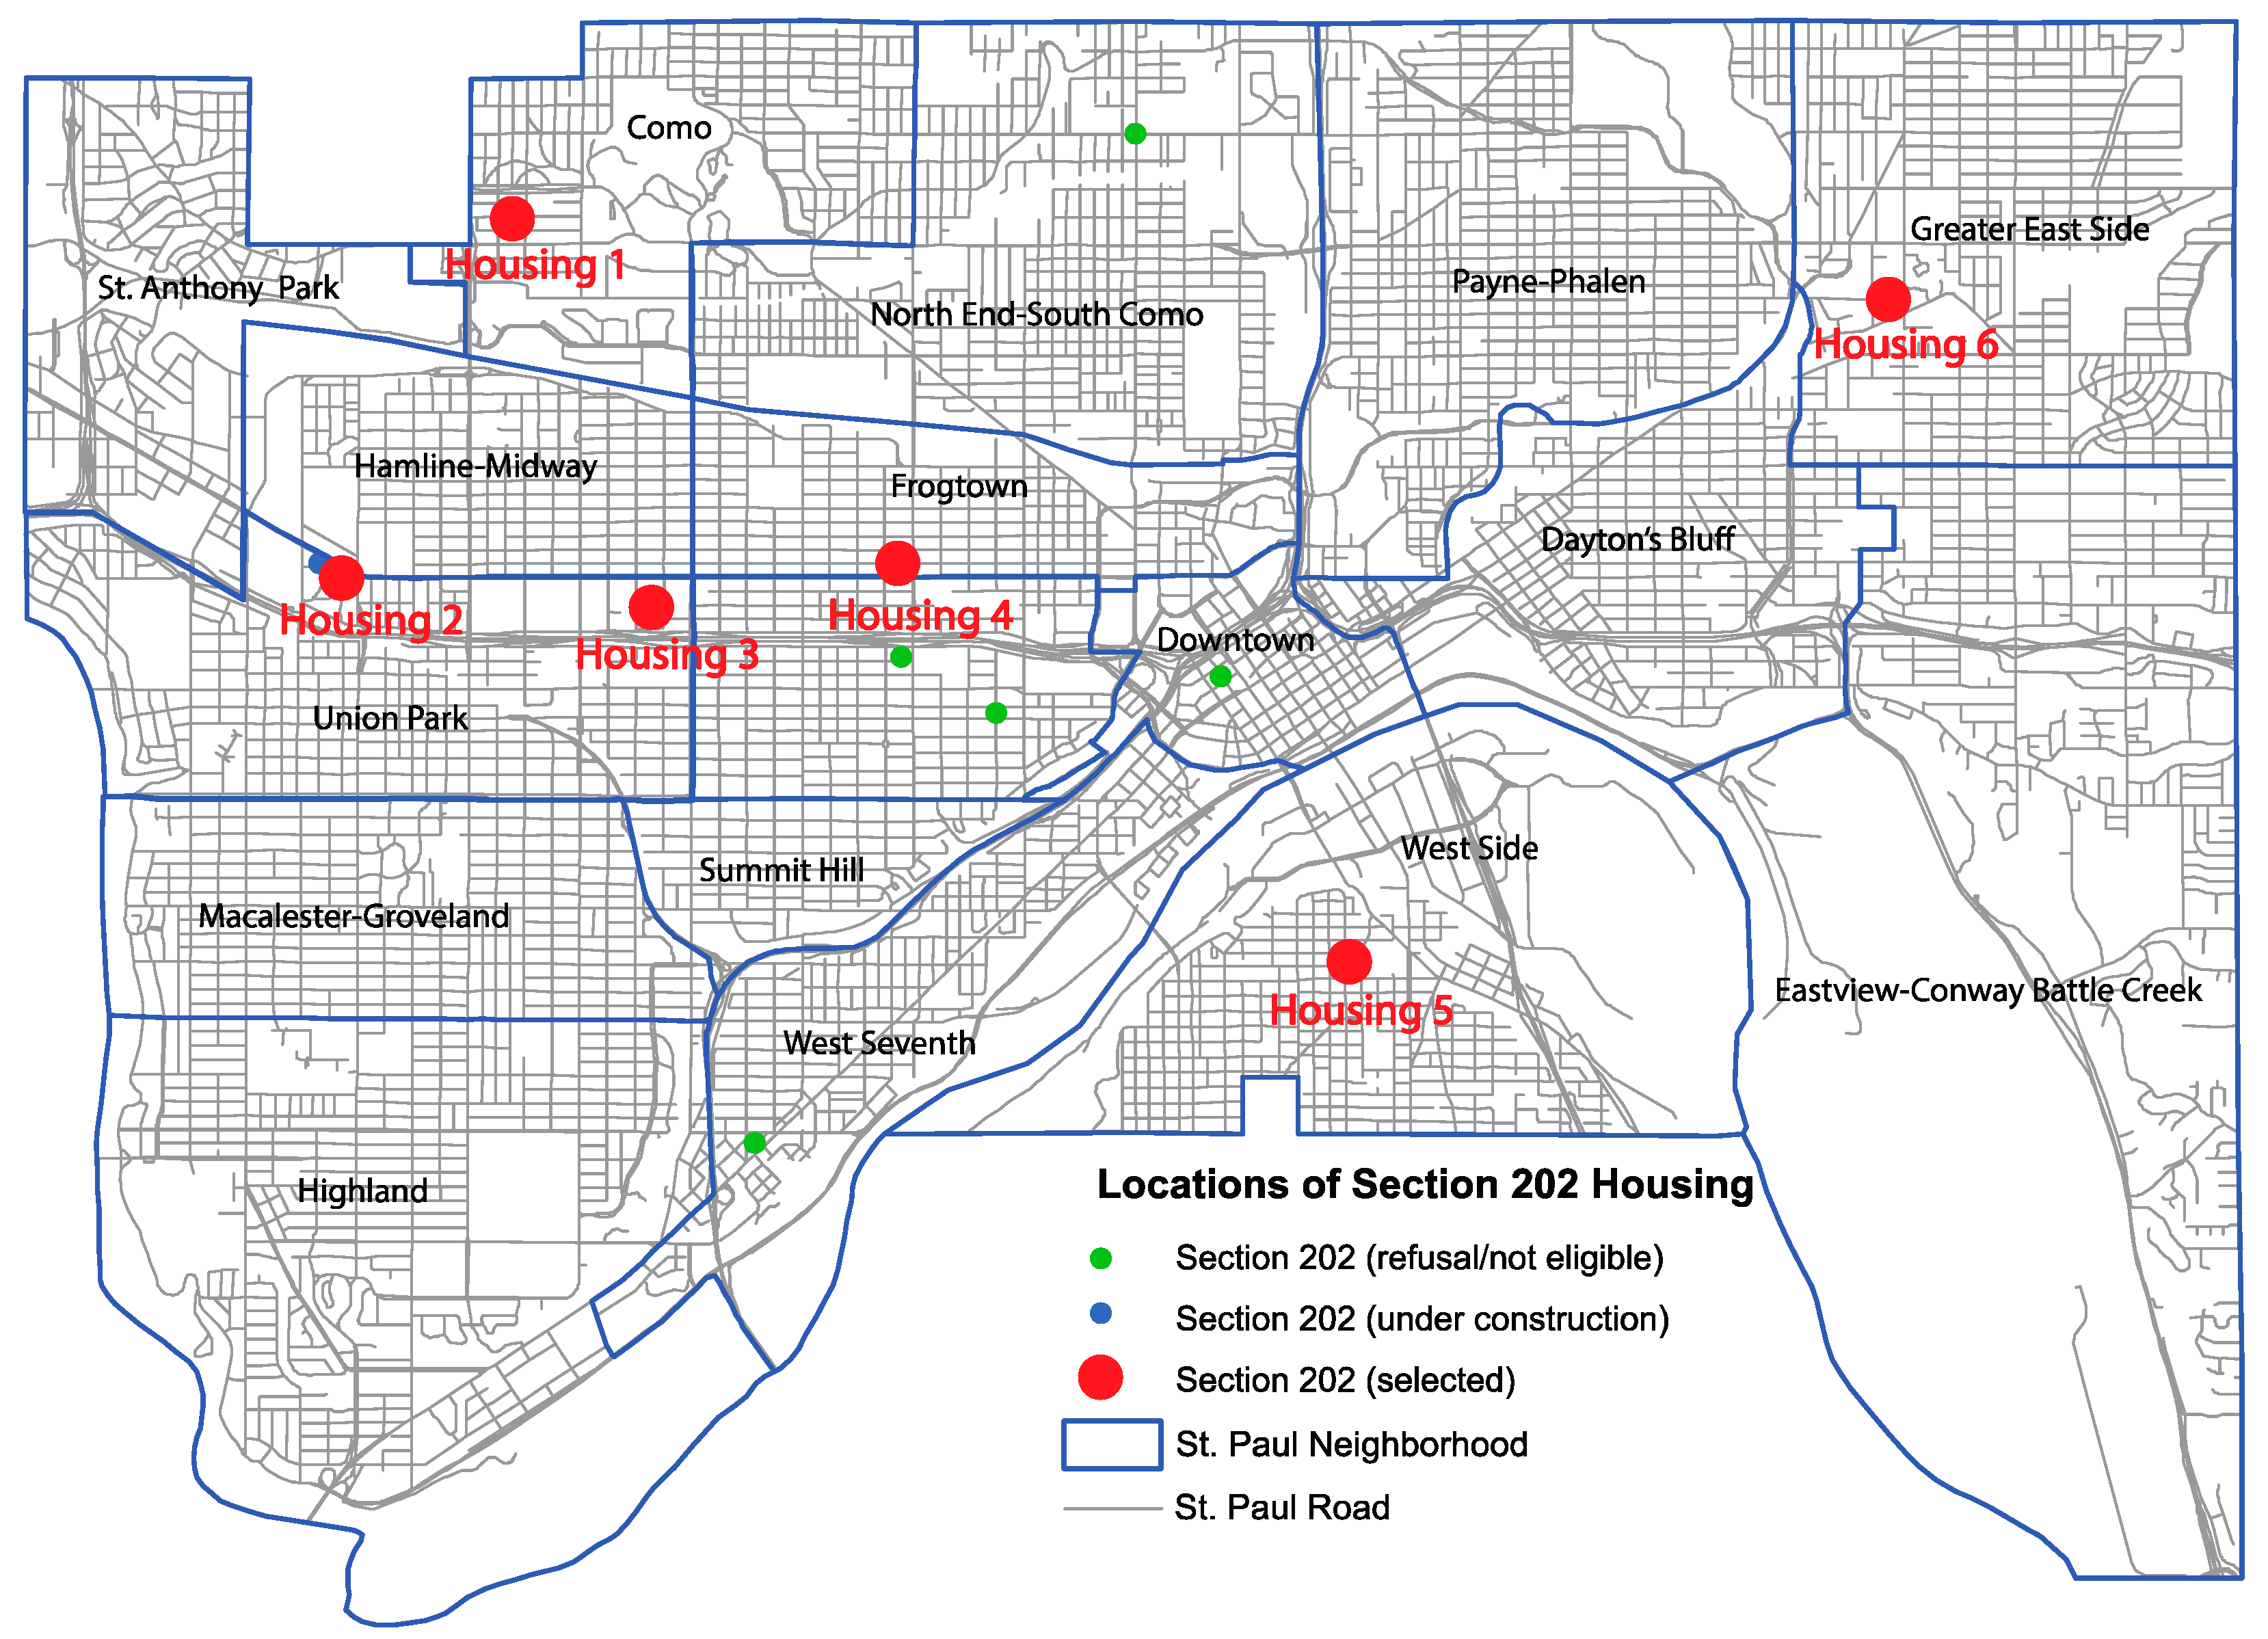
The author conducted a cross-sectional study of low-income older adults who were living in Section 202 Supportive Housing for the Elderly with Section 8 rental assistance in St. Paul, which is the capital city of Minnesota, USA. Under the Section 202 program, the U.S. Department of Housing and Urban Development (HUD) offers supportive housing programs with rental assistance, where residents who are low-income older adults or disabled pay only 30% of their income for rent [44]. HUD defines low-income households as a group whose income is at or below 80 percent of the area median income [45]. Nonprofit (religious, occupational, and fraternal) organizations with the ability to raise funds for housing construction from their group members participate in the Section 202 program, earning interest-rate subsidies for loans from HUD [46]. There were eleven Section 202 housing properties in operation in St. Paul identified during the time of data collection and one housing property that was being built (see Figure 2).
To recruit low-income seniors 60 years old or older, all eleven Section 202 housing managers in St. Paul were contacted by phone and email. The author tried to obtain agreements from all the housing managers through multiple contacts. However, five Section 202 housing properties were eliminated since the housing managers/company committee members refused to participate, or it was discovered that the majority of the residents were disabled or could not properly respond to the survey questionnaire. Finally, only six housing managers agreed to cooperate in this study. The identified low-income households available for this study were 410 in total. Through the cooperation of the six housing managers, flyers recruiting research participants were posted on bulletin boards. Prior to contacting Section 202 housing managers, a cross-sectional, self-administered survey questionnaire was constructed to extract data; questions were adapted from relevant literature reviews. After obtaining Institutional Research Board (IRB) approval from the University of Minnesota, twelve pilot tests were implemented with the cooperation of the St. Paul Public Housing Authority, to check understanding and to measure the time required by low-income older adults to fill out the survey questionnaire. After the pilot tests, the survey questionnaire was revised to improve the understanding of older adults. The consent forms and survey questionnaires were distributed to individual mail boxes, in front of resident’s doors, or during resident meetings. In cases where the housing properties were occupied by mixed income groups, the housing managers screened for only older residents who were residing in subsidized rental units. Reminder cards were also placed in mailboxes or at the doors of the residents two weeks later to increase the response rate. Four hundred and ten survey questionnaire packages were distributed in total and 156 participants returned their responses. Among returned survey questionnaires, 24 were deemed invalid in the initial screening of the collected data, missing one or two sections or marked with the same number for an entire section of the survey questionnaire. Thus, a total of 132 usable survey questionnaires were counted for the response rate (i.e., 32.2%).
2.2. Measures and Instruments
2.2.1. Sociodemographic Characteristics
To collect sociodemographic characteristics, five questions were requested of research participants. Participants self-reported their ages, which were then categorized into three groups: 60 to 69 years old, 70 to 79 years old, and 80 years old or more. Other sociodemographic characteristics included sex (responses were dichotomized into “male = 0” or “female = 1”), race (responses were dichotomized into “white = 0” or “others = 1”), and educational attainment (responses were dichotomized into “up to high school = 0” or “some college or higher = 1”). In addition to these questions, car ownership information was obtained from the respondents and the responses were dichotomized into “no = 0” and “yes = 1”. Income was not measured in this survey questionnaire because all of the respondents were low income, residing in subsidized rental units meeting the Section 202 Housing eligibility.
2.2.2. Physical Limitations
As a proxy of physical limitations, walking aid use has been investigated. Older adults with mobility limitations walk for less duration compared to older adults with no mobility limitations [47]. Walking is challenging for people with mobility disabilities [48]. Thus, older adults using walking aids are less likely to walk in their neighborhoods. Self-reported walking aid use was measured using two variables: (1) use of cane or walker, and (2) use of wheelchair. These two variables were combined into one factor after summation: any type of walking aid use (“no = 0” vs. “yes = 1”).
2.2.3. Objective Neighborhood Built Environments
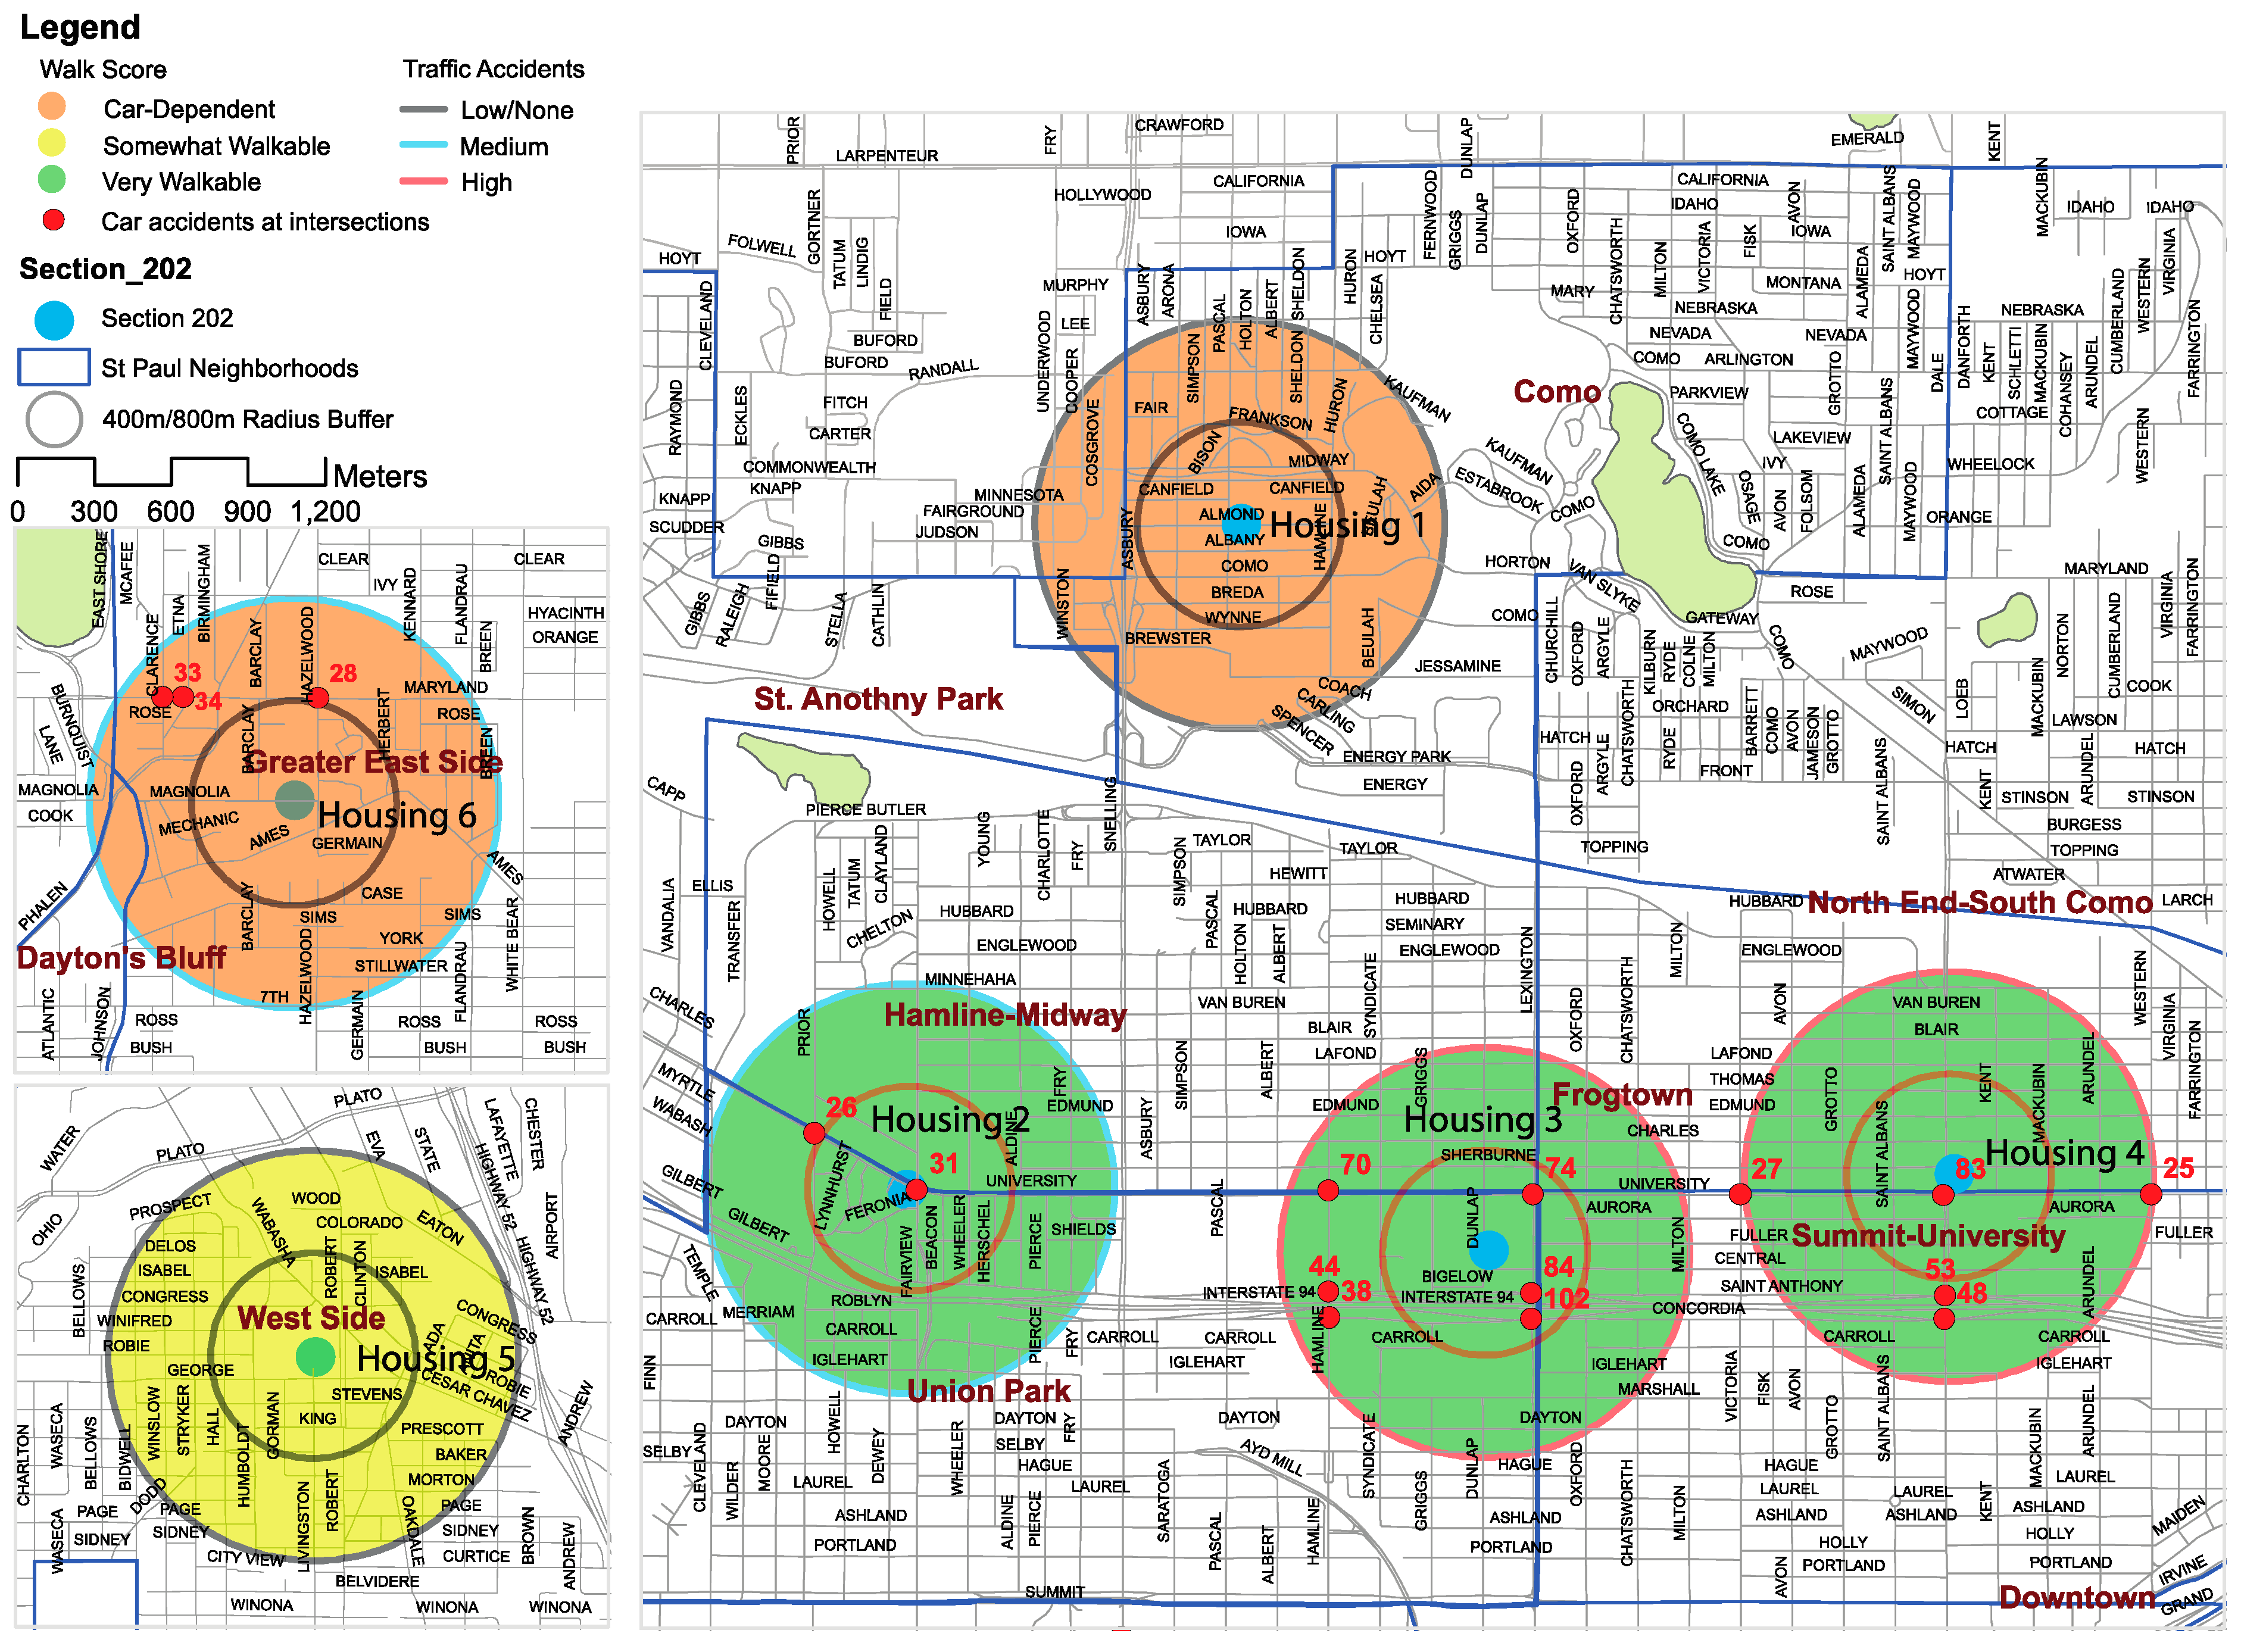
To understand the nuanced spatial differences of the selected neighborhood built environments by housing locations, two objective measures were utilized in this study: Walk Scores (i.e., walkability) and level of traffic accidents at intersections within a 400 m radius buffer (hereafter, RB) and 800 m RB as a proxy for pedestrian-involved traffic collisions. First, Walk Scores were measured using walkscore.com. Measures of walkability have relied on diverse metrics in previous studies. Thus, the comparisons across studies have been challenging. Walk Score is a publicly available walking index measuring walkability, with growing global coverage including the United States, Canada, and Japan [26,49,50]. Multiple researchers have proved the validity between Walk Score and walkability indices such as street connectivity, population density, access to public transit provisions, perceived crime environments, objectively measured crime, and perceived neighborhood environments [49,50,51,52]. Multiple cross-sectional [26,53,54] and longitudinal [55] studies have reported that Walk Scores are related to walking or sedentary behaviors. Walk Scores are computed based on walking routes to nearby destinations such as grocery stores, retail, coffee shops, and restaurants from identified addresses [20]. The maximum distance from the designated address is 30 minutes by foot. Walk Score measures pedestrian friendliness through analysis of road metrics (e.g., intersection density and block length) and population density. The data incorporates Open Street Map, Google, Fractural, Great Schools, Localeze, the U.S. Census, and additional places provided by Walk Score users. As a free and quick proxy of neighborhood measures for density and accessibility to amenities nearby [50], walkscore.com provides a numerical value from 0 to 100 points as well as five categorical values, from “very car-dependent” to “walker’s paradise”. The specific categories and ranges are very car-dependent (0–24), car-dependent (25–49), somewhat walkable (50–69), very walkable (70–89), and walker’s paradise (90–100) [56]. In this study, the six selected housing properties fell into three categories: car-dependent, somewhat walkable, and very walkable. Three selected properties are located on or very near the arterial roads of St. Paul, with abundant retail stores. The three other properties are more secluded from the main traffic roads, with fewer destinations. The neighborhoods around the first three housing properties (Housing 2, 3, and 4) were categorized as “very walkable”. Other neighborhoods were categorized as “car-dependent” (Housing 1 and 6) and “somewhat walkable” (Housing 5) neighborhoods by walkscore.com (see Figure 3).
Second, the traffic accident data were downloaded from the St. Paul government website. According to the findings of Lee at al. (2013) [31], the average number of traffic accidents within a 400 m buffer is likely to decrease walking of older adults for transport and recreation. However, healthy older adults are likely to walk beyond a 400 m RB in their neighborhoods. Studies have found that the perceptions of neighborhood amenities within an 800 m RB are positively associated with older adults’ walking in the U.S. and Canada [34,57]. Thus, it was hypothesized that traffic accidents within a 400 and 800 m RB are also likely to deter older adults’ walking behaviors. For this reason, the levels of traffic accidents within 400 and 800 m RBs were identified in this study. The data, which were sums of the previous three years of traffic accidents at each intersection, were spatially integrated into a geographical information system (GIS). Within 400 m RBs, there were no car accidents at three of the properties (i.e., Housing 1, 5, and 6), but Housing 6 had 28 accidents just outside of the 400 m RB. There were traffic accidents at intersections near three housing properties (i.e., Housing 2, 3, and 4) within the 400 m RB. Thus, this variable was classified as (1) low/no accidents (Housing 1, 5, and 6) and (2) high/presence of accidents (Housing 2, 3, and 4). This classification within a 400 m RB conformed to the Walk Score classification (i.e, “car-dependent/somewhat walkable” vs. “very walkable”). There were no car accidents within an 800 m RB near Housing 1 and Housing 5, and there were 60 and 95 traffic accidents near Housing 2 and 6, respectively, on high traffic volume roads. There were 412 and 236 traffic accidents near Housing 3 and 4. The intersections with the most frequent vehicle accidents were very close to these selected housing properties (Housing 3 and 4). Thus, the author categorized traffic accidents by housing locations as (1) low/none (Housing 1 and 5), (2) medium (Housing 2 and 6), and (3) high (Housing 3 and 4) for an 800 m RB (see Figure 3).
2.2.4. Perceived Neighborhood Built Environments
The perceived neighborhood built environments of older adults were measured by twenty variables in three categories: (1) accessibility to destinations (nine items); (2) characteristics for safety, comfort, and convenience (eight items); and (3) social and physical disorder, which are associated with negative safety perceptions (three items). Nine destinations were evaluated for perceptions of accessibility: (1) places for grocery shopping; (2) convenience stores or food vendors; (3) restaurants or coffee shops; (4) retail stores (e.g., clothing and beauty shops); (5) public institutions (e.g., post offices and police stations); (6) health facilities (e.g., clinics, hospitals, and pharmacies); (7) community facilities (e.g., community centers and libraries); (8) religious institutions (e.g., churches and mosques); and (9) recreational facilities (e.g., museums and movie theaters). The eight variables for perceived safety, comfort, and convenience were (1) enough lighting; (2) continuous sidewalk; (3) sidewalk maintenance; (4) benches on the streets; (5) enough trees along the street; (6) many people walking; (7) safety during the day; and (8) attractiveness and maintenance of buildings. Questions for perception of social and physical disorder included (1) stray dogs, gangs, or strangers on the street; (2) abandoned houses, vacant lots, or graffiti on buildings in the neighborhood; and (3) abandoned cars, litter, trash, or broken windows in the neighborhood. All questions were measured with a five-point Likert scale from strongly disagree (1) to strongly agree (5). Standardized summed factor scores were computed to reduce the number of variables.
2.2.5. Walking Behaviors
Because neighborhood environments may be related to different walking behaviors, two types of self-reported walking behaviors were measured as dependent variables in this study: (1) walking days per week and (2) amount of time spent walking without considering walking purposes in the neighborhood (i.e., walking in winter and summer). The respondents were asked to report the number of days and amount of walking time in their neighborhoods for the last seven consecutive days. However, this was highly likely to be impacted by weather conditions since this survey questionnaire was distributed at the end of the snow season (March to early May) in Minnesota. Thus, the respondents were additionally asked to recall the typical number of days and amount of time they spent walking per week in summer based on their current walking. Walking in winter was asked to get a sense of how the responses for summer and winter differ in their walking time and frequency. Neighborhood walking in this study means walking with a minimum duration of ten minutes per day in the neighborhood; walking days were measured from zero to seven days per week regardless of the frequency of walking outside per day. It was found, through the pilot test, that recalling the exact amount of time spent walking weekly, especially in summer rather than the past seven days, using a continuous value (minutes/week) was difficult for older adults. Thus, the amount of time spent walking weekly was instead categorized into three levels: less than one hour (<60 min); one hour to less than two and half hours (60 min ≤ T < 150 min); and two and a half hours or more (≥150 min). Observing the World Health Organization (WHO) physical activity guidelines, walking outcomes were divided into three dependent variables: (1) walking choice (i.e., “zero days of walking = 0” or “one or more days of walking =1”), (2) walking three days or more per week (i.e., “up to two days of walking = 0” vs. “three or more days of walking = 1”), and (3) walking 150 min or more per week (i.e., “less than two and half hours = 0” and “two and half hours or more = 1”).
2.2.6. Self-Rated Health
Older adult’s self-rated health status is likely to be associated with their neighborhood environments and walking behaviors [58,59]. Thus, this was measured using a five-point Likert scale from very poor (1) to excellent (5). However, the respondents only used four points on the scale, from “very poor” to “good”; no one answered “excellent”. Thus, the measurement was dichotomized into two: (1) “very poor to poor = 0” and (2) “average to good = 1”.
2.3. Data Analysis
To examine the association between neighborhood built environments and walking behaviors adjusting for covariates, the author fitted multivariable logistic regression models. Four dependent variables were utilized (i.e., three types of walking behaviors and self-rated health) for the analysis. Before the regression analysis, the procedures for screening outliers were performed eliminating two responses out of 132. One respondent’s age was under 60 years. One other respondent marked that she or he walked more than one hour per week in the neighborhood, but she or he also marked that she or he never walked at least ten minutes per week in the neighborhood. This is a contradictory result; thus, the respondent was omitted in the analysis, leaving 130 responses. Among respondents integrated into the analysis, some answers (less than 3.5%) were missing, so a multiple imputation with chained equations (MICE) approach was performed to impute the missing data with R Studio Version 1.1.463. Rubin’s rule was used for the combined estimates and variances. The author used descriptive statistics for the summary of categorical data using counts and percentages, and continuous data using means and standard deviations (SD) with the output of multiple imputations. Chi-squared tests were performed to examine whether there were significant differences between genders across all variables. This was also summarized in Table 1.
“Internal consistency” of the perceived neighborhood built environments was evaluated using Cronbach’s alpha for correlation. If the lowest value is over 0.65, the reliability is considered acceptable or satisfactory [60]. All Cronbach’s alpha scores were over 0.65, so the internal consistency was acceptable. To reduce the numbers of factors for perceived neighborhood built environments, factor analysis with varimax rotation was utilized. Three factors were identified (i.e., (1) accessibility to destinations; (2) safety, comfort, and convenience; and (3) physical and social disorder). The detailed results of Cronbach’s alpha score and factor analysis are illustrated in Table A1. The correlations between objective and perceived neighborhood built environments were calculated to predetermine multicollinearity effects (see Table A2). According to Cohen’s guidelines, if the correlation is over 0.5, it is identified as a strong relationship [61]. Walk Scores and traffic accidents at intersections within 400 or 800 m RBs showed a strong association (r = 0.894, p < 0.001; r = 0.621, p < 0.001). Other variables showed weak associations at r < 0.3. The individual observations of living in the same neighborhood environment are not completely independent [62]. To verify whether aggregated observations (i.e., housing locations classified by Walk Scores or traffic accidents at intersections within 400 or 800 m RBs) would lead to significant improvement of the models, comparison analyses between the perception models (neither Walk Scores nor traffic accidents included) and the full models (either Walk Scores or traffic accidents incorporated) were performed. In addition, the full models with either Walk Scores or traffic accidents were compared to check which classification by neighborhood spatial differences better explained the dependent variables calculating Akaike information criterion (AIC), Bayesian information criterion (BIC), and pseudo R2. Binary logistic regression models (glm function with “binomial” family) were harnessed for the analysis of the relationship between objective (either Walk Scores or traffic accidents at intersections within a 400 or 800 m RB) and perceived neighborhood built environments, and four dependent variables separately. All models were drawn after being adjusted for covariates (i.e., age, gender, race, education, car ownership, and physical limitations). Peduzzi et al. argued that ten to fifteen observations per predictor meets the minimum sample size for stable estimation for a logistic regression model [63,64]. This study meets the minimum sample size. Yet, the small sample size was a challenge for stable analysis. Thus, stepwise eliminations for all models were used to remove variables for better model fits; the removal criterion was a p-value greater than 0.1.
3. Results
3.1. Sample Characteristics
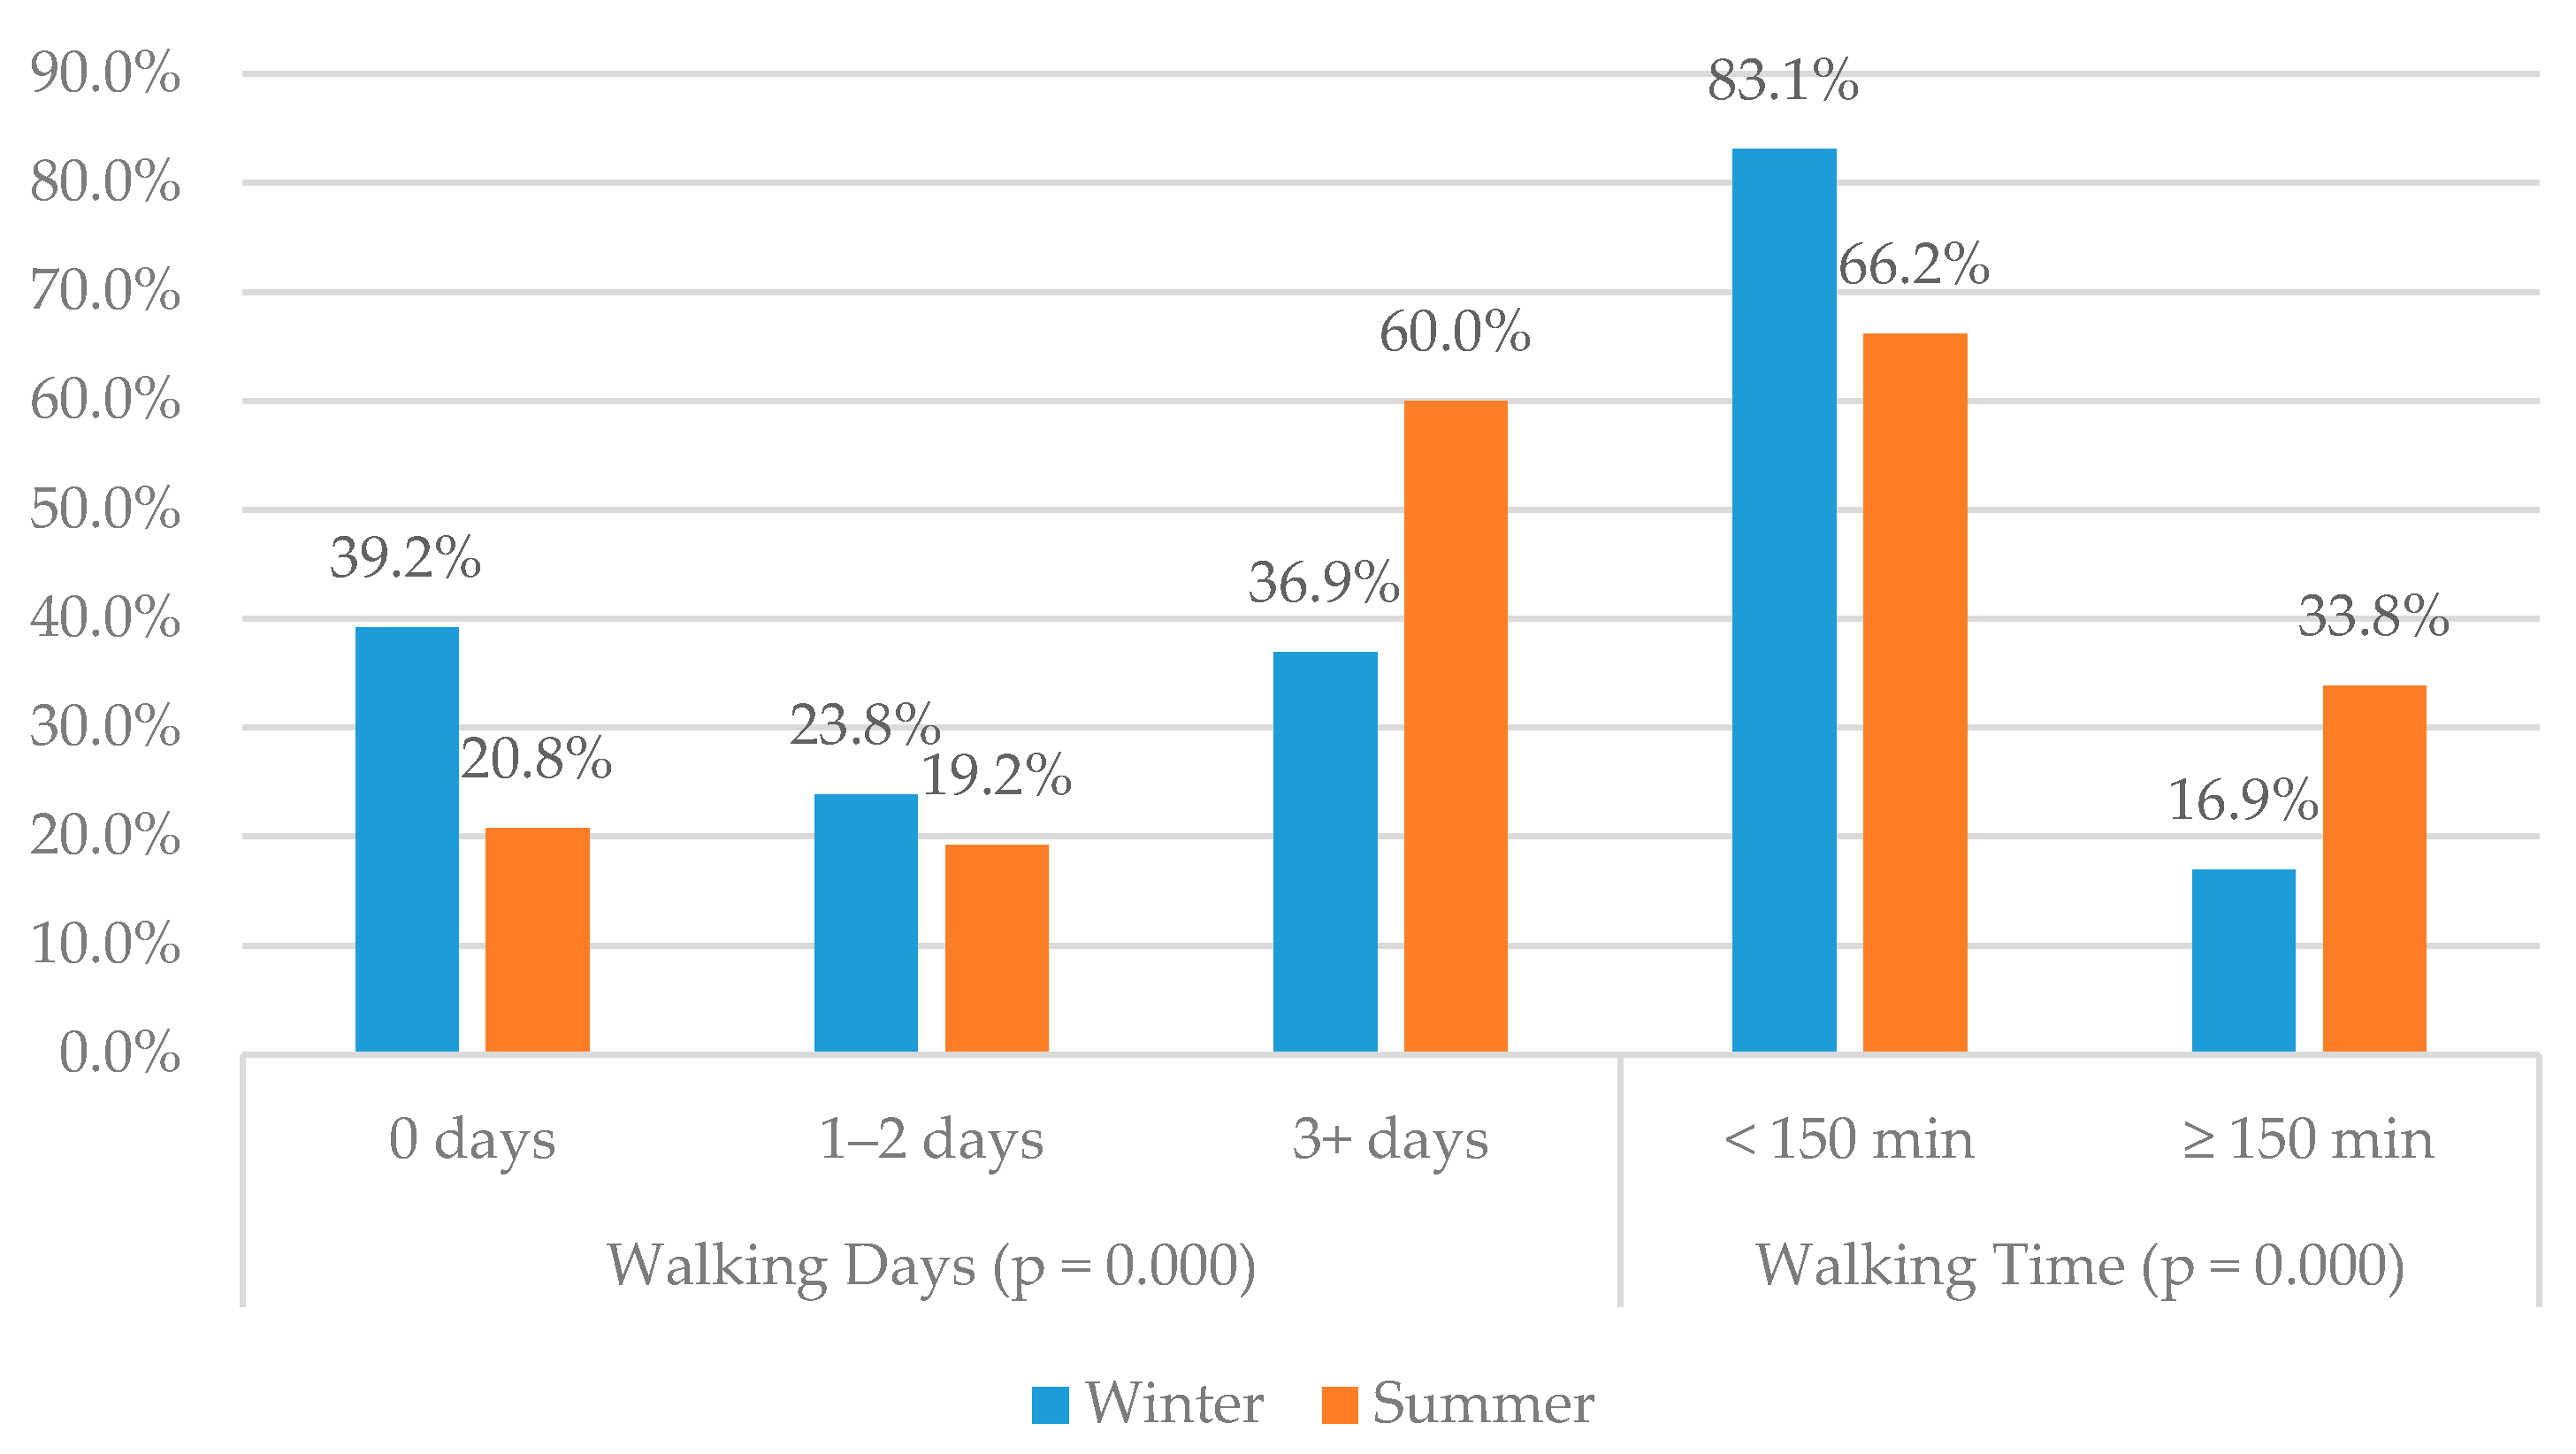
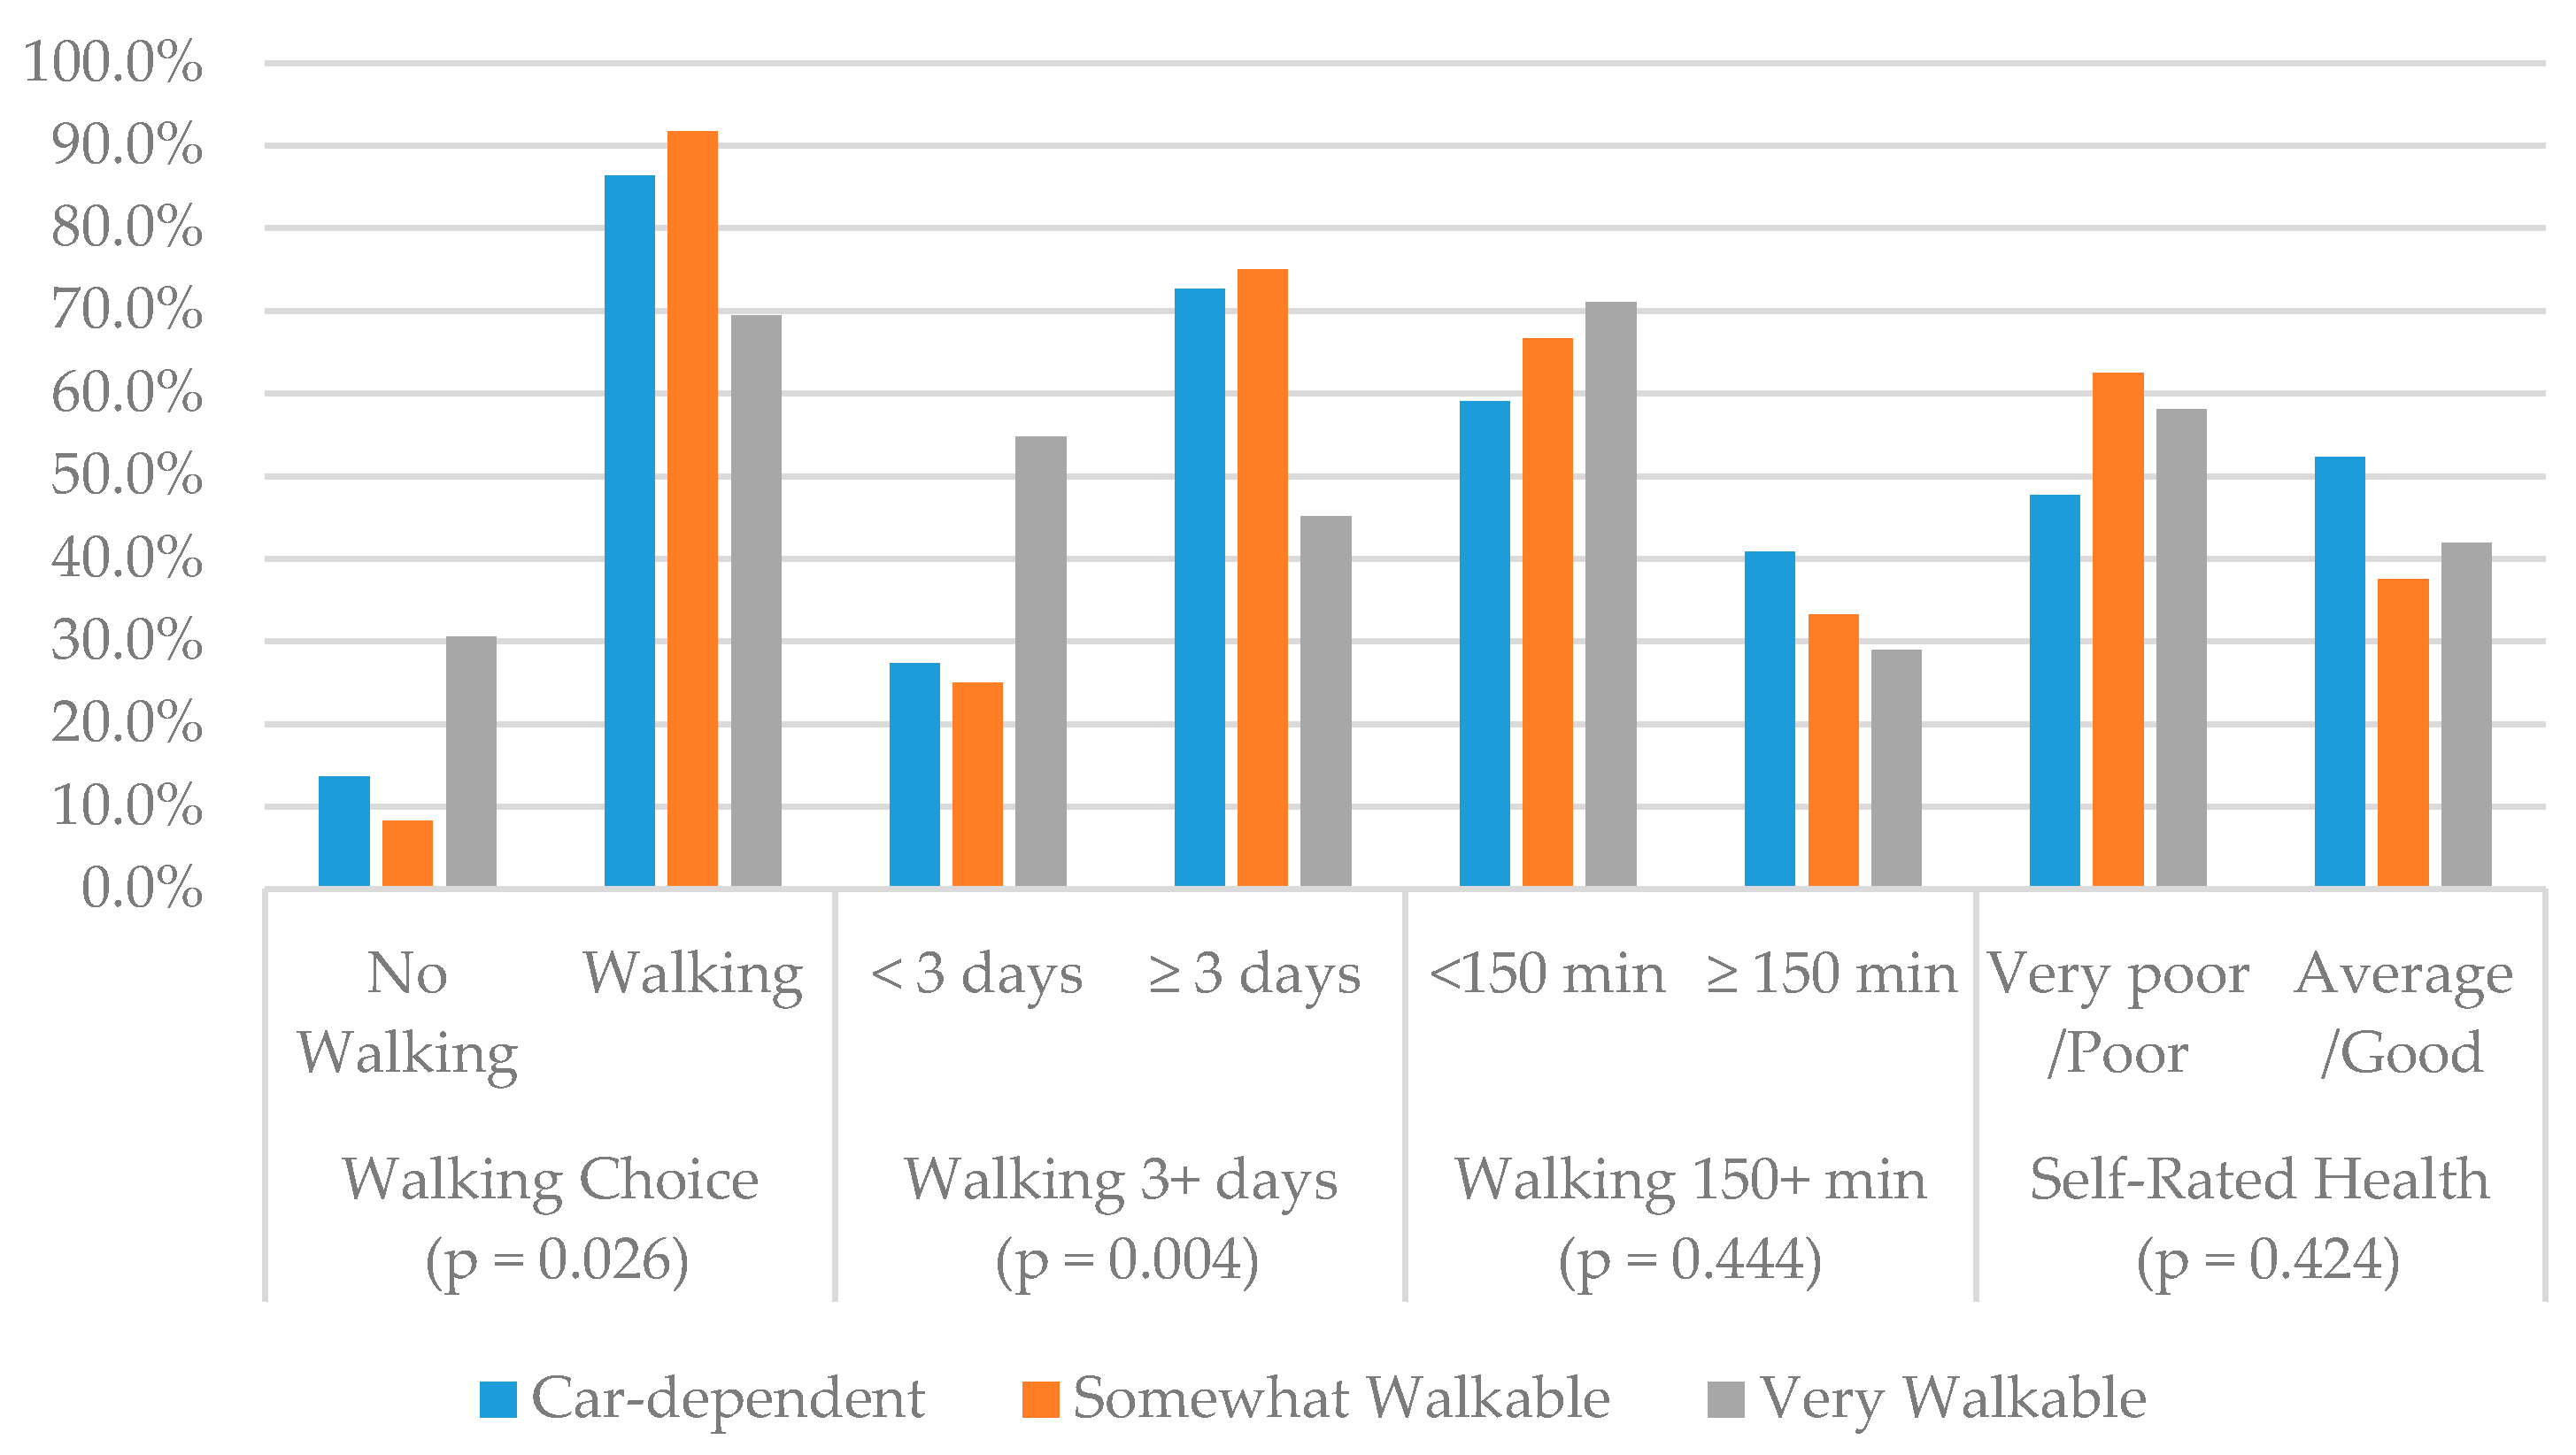
Table 1 illustrates the descriptive statistics for sociodemographic and physical limitations, objectively measured neighborhood environments (i.e., spatial difference by Walk Scores and traffic accidents at a 400 and 800 m RB), average summed neighborhood built environments perceived, and four dependent variables. The data of 130 older adults (73.8% female) in total who were 74.9 ± 8.3 years old in mean age were analyzed. Among all the variables, there was no group difference between men and women except for one dependent variable (walking vs. no walking) that showed a group difference at p < 0.025; a higher percentage of men chose more active behaviors than women. In Figure 4, walking days and time differences per week by season are compared. Older adults were more active in summer than winter (p = 0.000). In particular, the ratio of older adults who did not walk at all almost doubled in winter (39.2%) compared to in summer (20.8%). Walking 3+ days and 150+ minutes weekly in summer was also much higher than winter walking. These data sets were compared to how different the recalled walking in summer was from walking in winter, which are both subjective measures. Figure 5 illustrates the group differences for walking behaviors and self-rated health by neighborhood Walk Scores. There were no group differences for walking 150 min or more per week and self-rated health in this comparison by Walk Scores. However, there were group differences for walking choice (p = 0.026) and walking three days or more (p = 0.004) per week. In particular, older adults walked less in very walkable neighborhoods for all types of walking with or without statistical significance.
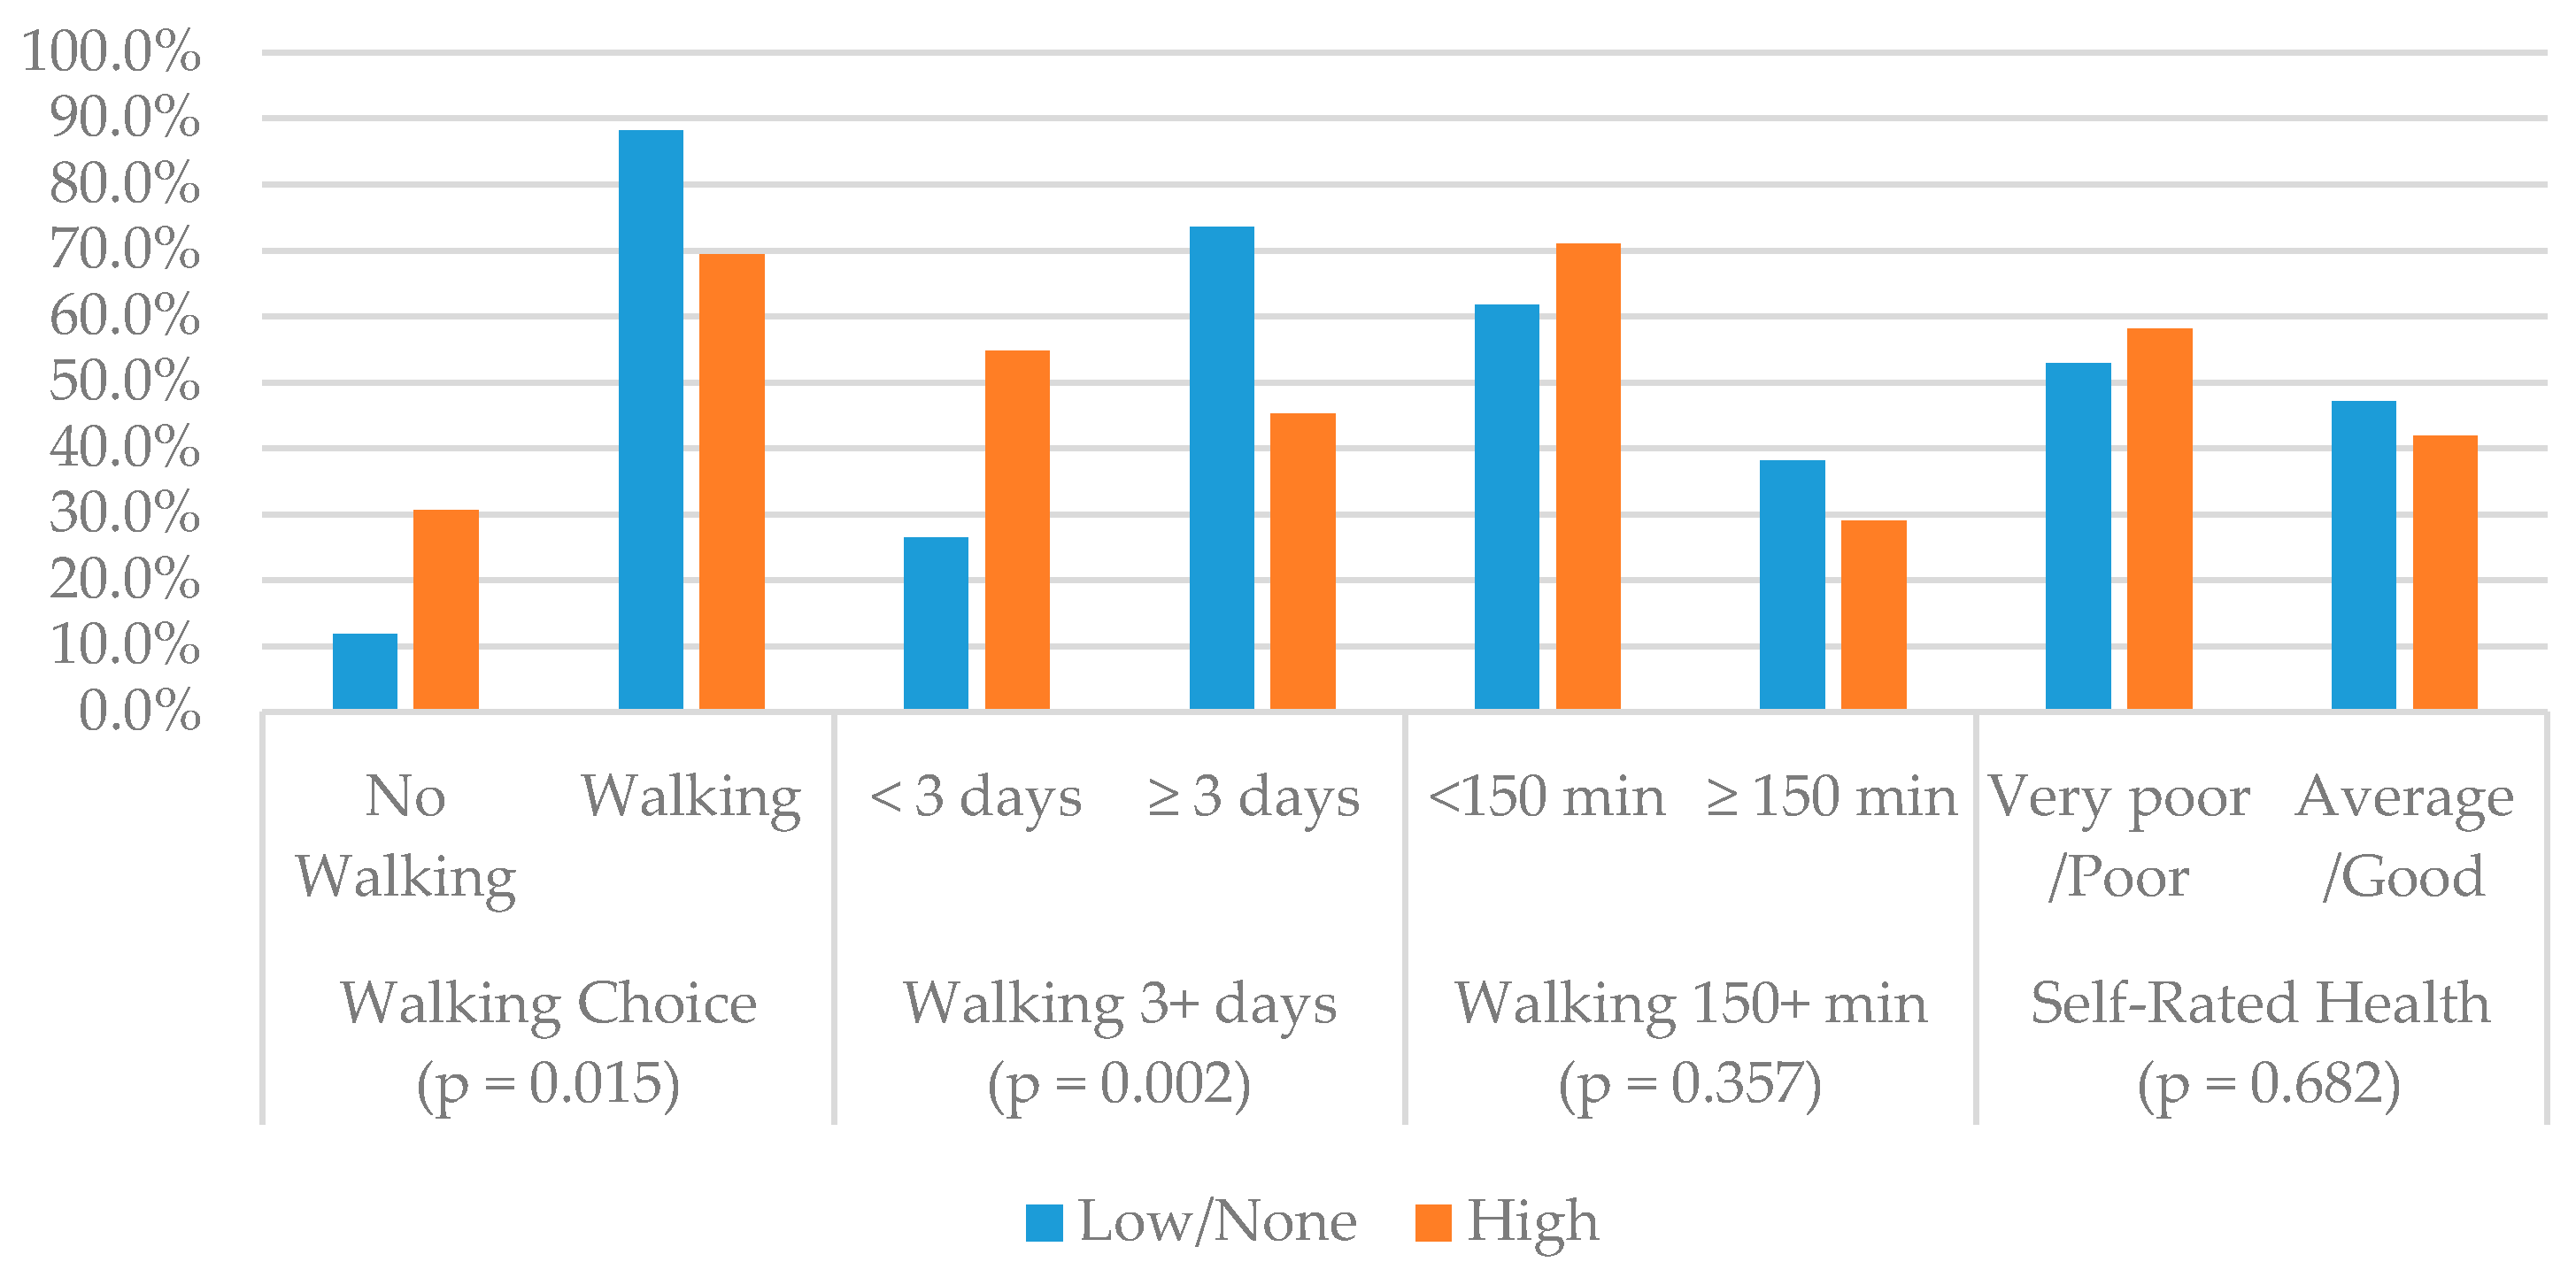
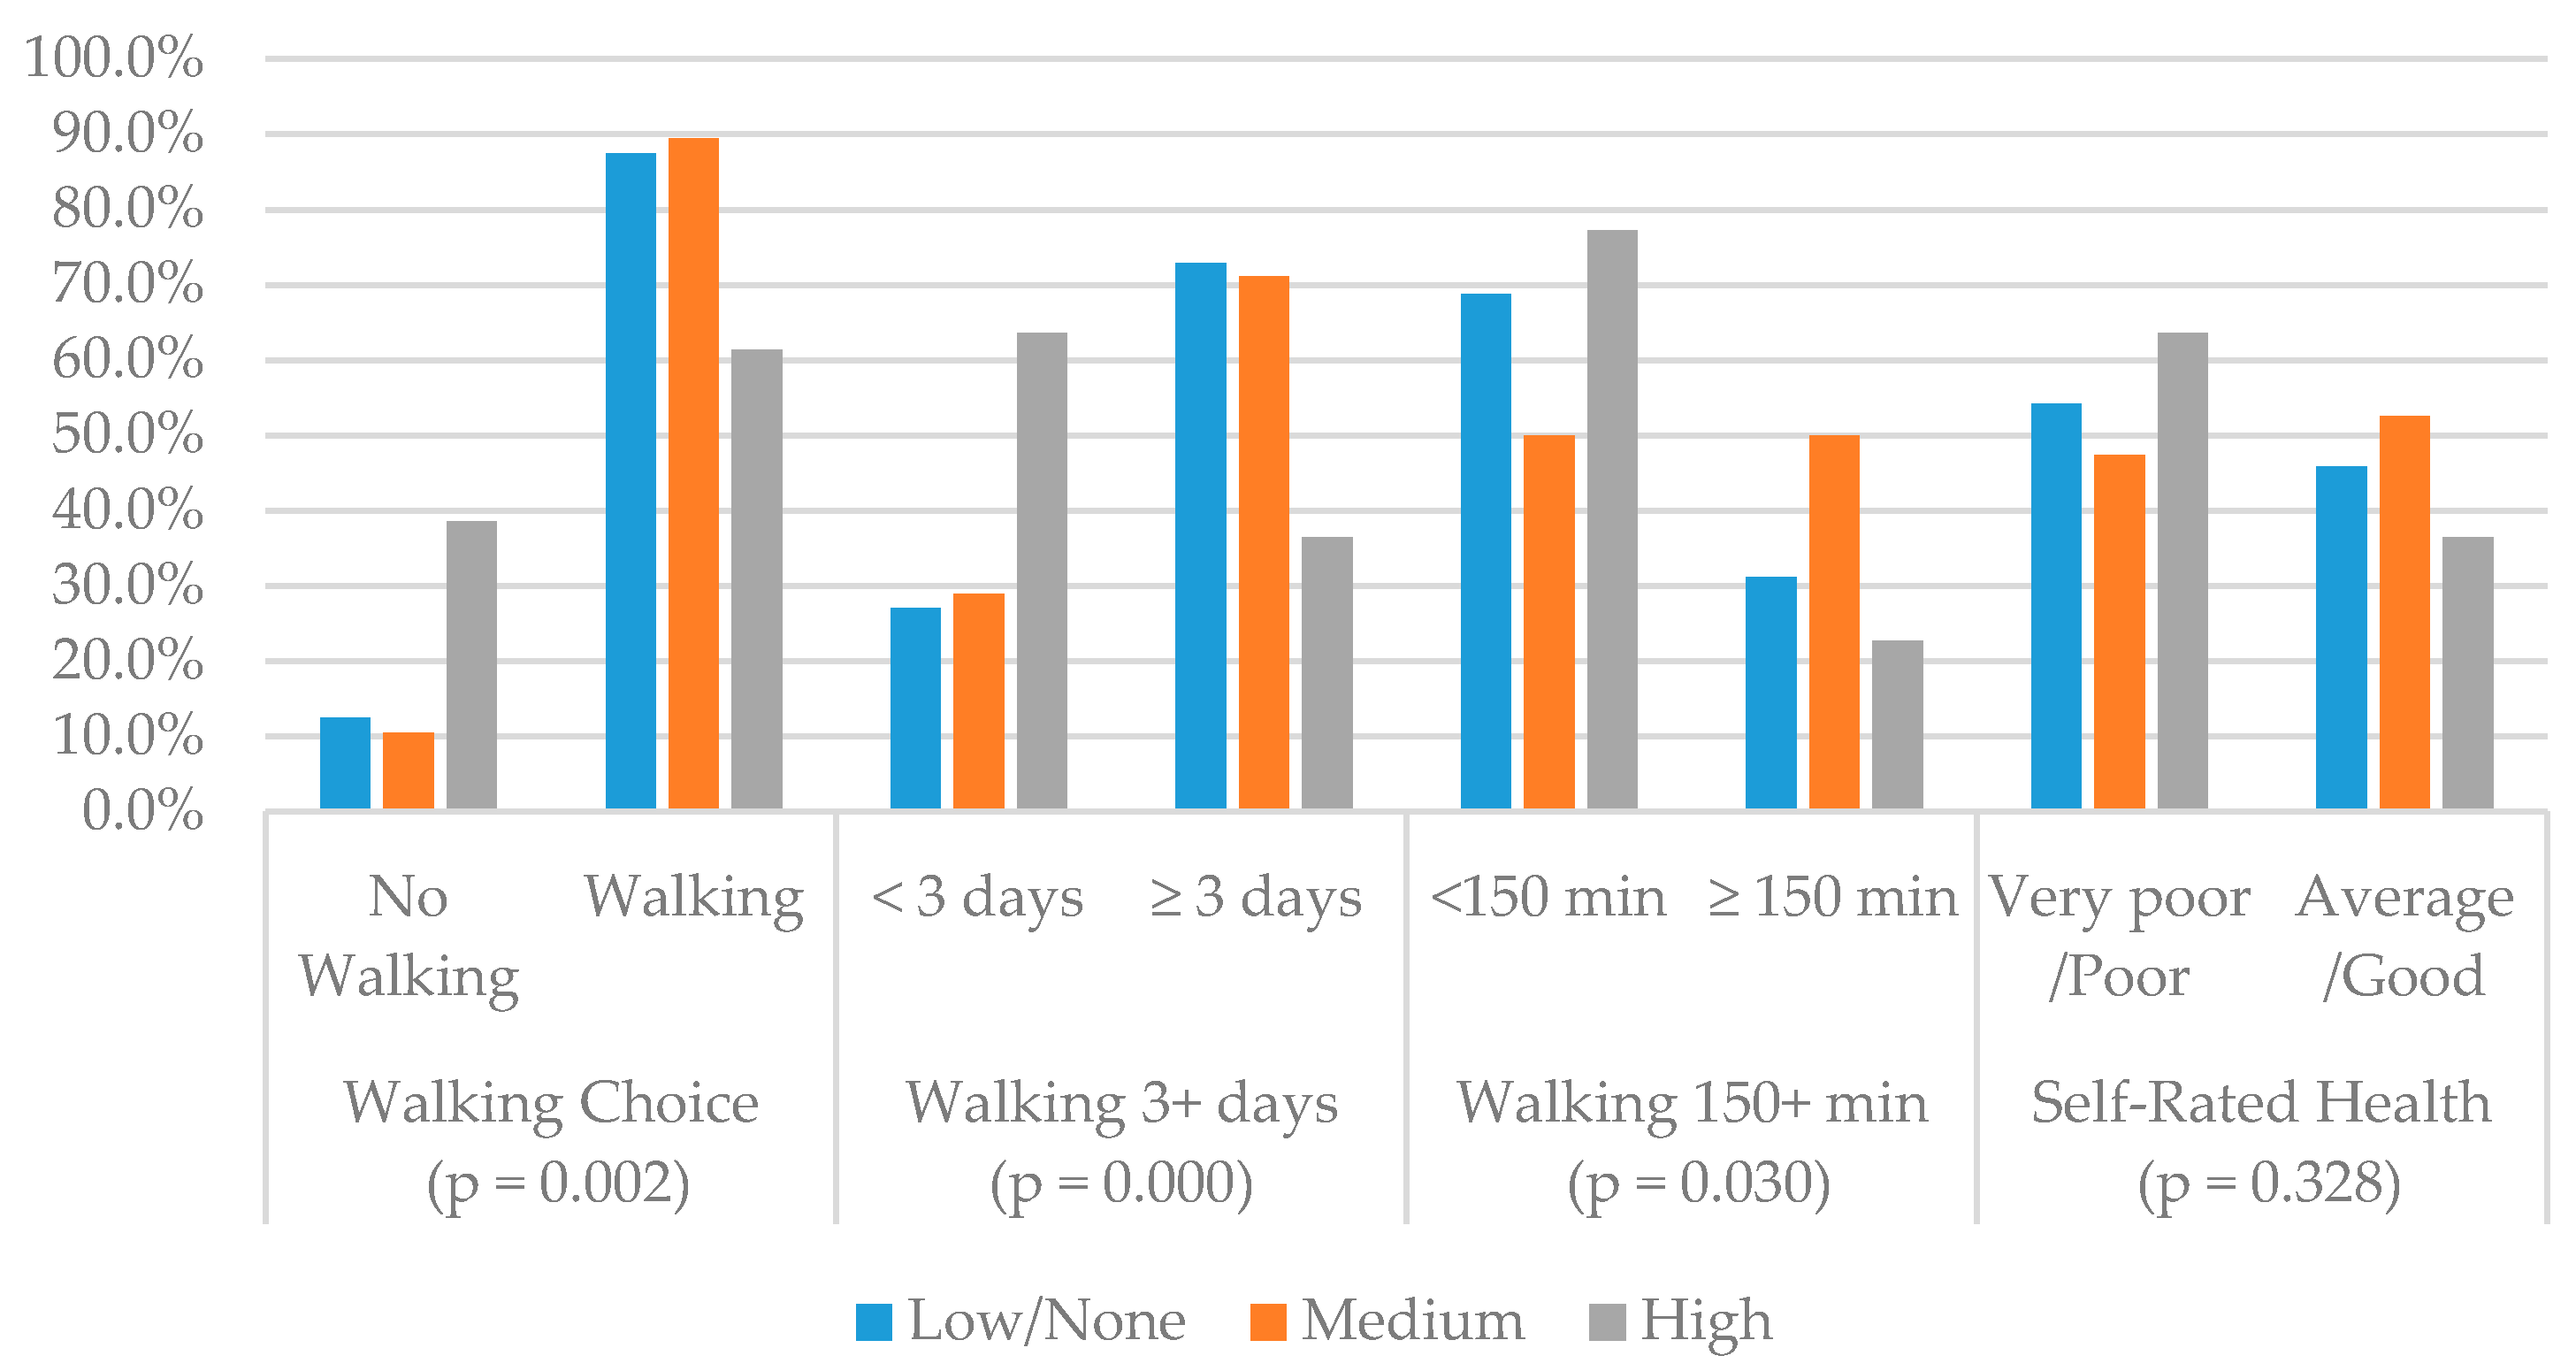
Figure 6 shows that walking behaviors (i.e., walking choice and walking 3+ days) differ by presence of car accidents within a 400 m RB. However, no association was found between walking 150+ minutes per week and self-rated health. Figure 7 demonstrates the group differences for three types of walking behaviors and self-rated health by the level of traffic accidents at intersections within an 800 m RB. All walking behaviors showed group differences by level of traffic accidents at p < 0.05 without controlling variables. Walking levels were lower in the areas with high numbers of traffic accidents. There were no group differences for self-rated health (p = 0.328) in relation to traffic accidents.
3.2. Walking Outcome Models
In the comparison of the perception models and full models, all full models (with either Walk Scores or traffic accidents within a 400 or 800 m RB) led to significantly improved fits over the perception models at p < 0.1 or less, after applying stepwise eliminations for all model comparisons (see Table A3). All three types of final walking outcome models (i.e., Walk Score models, traffic accidents within 400 and 800 m RB models) were compared in Table A4 to see which classification of neighborhoods fit best. The traffic accidents with 800 m RB models fit best, showing negative associations between walking outcomes and a higher level of traffic accidents within an 800 m RB comparing AIC, BIC, and pseudo R2 across all walking outcomes. Although Walk Score models and traffic accidents within 400 m RB models were not fitted best, the neighborhoods with higher Walk Scores compared to car-dependent neighborhoods were also negatively related to all three walking outcomes with or without statistical significance. The neighborhoods with high traffic accidents at intersections within a 400 m RB were negatively associated with older adult’s walking compared to the neighborhoods with low/no accidents within the buffer. Thus, all models under Section 3.2 are explained by the traffic accidents within 800 m RB models, which are the best fit in this study (Table 2).
3.2.1. Walking Choice (No Sedentary Behavior)
Multivariable analysis results for walking choice measures can be seen in Table 2. Neighborhoods with a medium level of traffic accidents (OR = 0.134; p = 0.001) were negatively associated with choice of walking compared to neighborhoods with no traffic accidents, but neighborhoods with high numbers of traffic accidents (OR = 0.556; p = 0.295) did not have statistically significant associations with the choice of walking after controlling for covariates. Among the neighborhood perceptions, neighborhood characteristics for safety, comfort, and convenience (OR = 1.810; p = 0.036) were positively related to avoidance of sedentary behaviors (choice of walking). Among covariates, female (OR = 0.143; p = 0.028) and mobility aid users (OR = 0.089; p = 0.003) tended not to choose walking compared to male and nonusers of mobility aids, but other races (OR = 6.184; p = 0.013) compared to whites were more likely to walk in their neighborhoods.
3.2.2. Walking Three or More Days per Week (Light-Intensity Physical Activity)
Findings regarding walking 3+ days per week are illustrated in Table 2. Walking 3+ days was negatively related to the neighborhoods with higher traffic accidents within an 800 m RB compared to low/no accidents in the neighborhoods (medium traffic accidents: OR = 0.156, p = 0.000; high traffic accidents: OR = 0.448; p = 0.045). If older adults had a higher perception of accessibility to destination (OR = 2.571; p = 0.000), the likelihood of choosing to walk three or more days per week increased 2.5 times. In this model, if older adults were better educated, with some college education or higher (OR = 2.116; p = 0.082), they were more likely to choose to walk 3+ days per week, but mobility aid users (OR = 0.178; p = 0.032) tended not to walk, with a negative association.
3.2.3. Walking 150 Minutes or More per Week (Enough Physical Activity)
Findings regarding walking 150+ minutes per week are shown in Table 2. Neighborhoods with medium or high numbers of traffic accidents (OR = 0.387; p = 0.075 and OR = 0.344; p = 0.028) had a significantly negative relationship to walking outcomes of older adults, compared to neighborhoods with low/no car accidents. Walking more than 150 min per week was positively associated with the perception of higher accessibility to destination (OR = 2.887; p = 0.000) and higher safety, comfort, and convenience (OR = 1.570; p = 0.073). Moreover, a negative interaction between perception of neighborhood physical and social disorder (OR = 0.549; p = 0.027) and walking 150+ minutes per week was found. As with the walking 3+ days model, higher educational level (OR = 2.924; p = 0.022) was positively related and mobility aid device use was negatively related to walking 150+ minutes per week. In addition to these, older age (OR = 0.489, p = 0.094; OR = 0.423, p = 0.030) and car ownership (OR = 0.350, p = 0.038) lowered the likelihood of walking that meets physical activity recommendations.
3.3. Self-Rated Health
Table 3 shows the predictors of higher self-rated health (i.e., average or above). Comparing three different models, the model using walking 150+ minutes (pseudo R2: 0.140) better explains self-rated health status compared to the other two models (pseudo R2 for walking choice: 0.100; pseudo R2 for walking 3+ days: 0.130) through the comparison of AIC, BIC, and pseudo R2. The spatial differences of neighborhoods (objective measures) were not associated with self-rated health. However, better perceptions of neighborhood built environments (i.e., safety, comfort, and convenience: OR = 1.531, p = 0.040) and longer time spent walking (i.e., walking 150+ minutes: OR = 2.741; p = 0.001) were associated with better self-rated health. Older age (70–79: OR = 2.060, p = 0.040; 80+: OR = 2.200, p = 0.028) and car ownership (OR = 2.737; p = 0.022) were also associated with better health perceptions across the models. These odds ratios for age and car ownership were calculated with the model using walking 150+ minutes.
4. Discussion
This research has contributed to a limited body of literature exploring the relationship between perceptions and objective measures (spatial heterogeneity) of neighborhood built environments, walking behaviors (walking choice, 3+ days walking per week, and 150+ min walking per week models), and self-rated health for older, low-income adults. In particular, this study concentrated on neighborhood heterogeneity categorized by Walk Scores or traffic accidents at intersections within 400 or 800 m RB. To the author’s best knowledge, there are a very limited number of peer-reviewed papers published dealing with Walk Scores and older adults’ walking behaviors (excluding the samples combining middle age and older adults), especially in the U.S. context. Given the potentially deteriorating physical condition of older adults, it is imperative that neighborhood built environments promote physical activity. This study reported the walking outcomes of low-income older adults, but due to a dearth of research on walking behaviors of older low-income populations in the U.S., a direct comparison between this research and others was not available. Nevertheless, when comparing walking outcomes of older adults and ignoring income level, almost 20% of research participants perceived that they typically walk zero days per week for at least ten minutes or more in their neighborhoods. This ratio of older adults with sedentary behaviors (no walking) was slightly higher than older adults living in other American states such as California [25], Texas [38], and Oregon [65], where the ratio of older adults choosing not to walk ranged from 12% to 15%. In this study, 60% of respondents reported that they typically walk 3+ days per week in their neighborhoods. This ratio is almost the same as the ratio (59.55%) of adults aged 60 or over who walked 3+ days per week in two counties (Bell and Brazos) in Central Texas [38]. Almost 34% of older adults reported that they typically walk 150 min or more per week in their neighborhoods in this study. This ratio is in the same range as older adults living in other states such as Massachusetts, California, Texas, Illinois, and North Carolina (ranging from 23% to 38%) [38,66,67]. This ratio might be inflated by over-reporting biases, because respondents only relied on their memories, not on objective behavior measures [68]. Nevertheless, the ratio of older adults meeting physical activity recommendation guidelines in this study was much smaller than the ratio in the Canadian sample for low-income older adults (i.e., 61.3%) [26]. These results may be associated with differences in built environments, traffic accident patterns, or preference for walking of older adults.
In this study, the objective measurements (spatial heterogeneity) and perceptions of the neighborhood environments were associated with walking outcomes of older adults: neighborhoods with higher Walk Scores had negative associations with walking outcomes. Somewhat walkable neighborhoods had significantly negative associations with all types of walking. Very walkable neighborhoods also had negative associations, without significance (i.e., walking choice and walking 150+ min models) or with significance at p < 0.1 (i.e., 3+ days walking model). The findings of this research are inconsistent with other studies. For example, a Canadian study for older adults [26] and an Australian study of transport walking of adults (not older adults) [69] found that higher Walk Scores had positive associations with total and transport walking in neighborhoods. In the Canadian study, “walker’s paradise” neighborhoods showed a three times higher odds ratio compared to “car-dependent” neighborhoods [26]. An international study from a lower income country (i.e., Czech Republic) also found that a highly walkable administrative boundary led to higher walking levels for transport, but the subjects of this study ranged from healthy young adults to older adults [70]. Towne et al. (2016) reported that higher Walk Scores (car-dependent vs. somewhat walkable or higher) had positive associations with total walking of middle-aged and older adults in the U.S. cities with peri-urban characteristics [71]. However, Tuckel et al. (2015) reported that higher Walk Scores were not associated with total walking but positively associated with walking choice for American adults [72]. Only a Taiwanese study is consistent with this study, reporting that higher Walk Scores had a positive association with sedentary behaviors (i.e., no walking) [54]. The only U.S. study exploring the association between Walk Scores and older adults’ walking was inconsistent with this study, reporting that Walk Scores were not associated with walking choices of older adults in Rochester, Minnesota. However, this study had a small sample (N = 53) and was conducted without other environmental variables [73]. It is likely that the discrepancy is because of different age groups, walking purposes, or different built environmental characteristics (e.g., walker’s paradise), which were not included in this study. In addition, built environmental characteristics, which are not reflected in Walk Scores, may lead to different findings. For instance, Walk Scores may not accurately reflect the neighborhood attributes in terms of landscape diversity, sidewalk availability, and other walking barriers and facilitators [51,71].
The neighborhoods with higher Walk Scores showed higher levels of traffic accidents at intersections within 400 and 800 m RB in this study. This finding is confirmed by previous studies which showed that compact neighborhoods along with a number of accessible destinations (i.e., neighborhoods with higher Walk Scores) were likely to have more traffic accidents in the car-oriented U.S. urban context [31,74]. In this study, three housing properties which are located in very walkable neighborhoods also had high numbers of traffic accidents, even within 400 m RB. The neighborhoods with traffic accidents within 400 and 800 m RB were consistently and negatively associated with all three types of walking behaviors compared to the neighborhoods with no vehicle accidents at intersections within the buffer. Moreover, mobility aid users had a decreased likelihood of walking across all three walking outcome models. Their reduced mobility or disability [71] and greater fear of car accidents at intersections in the neighborhoods likely interact with the objective number of traffic accidents, reducing the likelihood of any types of walking [71,75]. Selecting a safe place to cross a road is especially challenging for older adults with physical impairments and reduced ability to reach a safe pedestrian crossing far away [76]. Older adults may have a problem crossing wide streets or busy intersections since they may have difficulty in rapidly scanning traffic approaching from diverse directions at the same time [77]. They also may have a fear that drivers will fail to see them at crosswalks, especially on high traffic volume roads [75]. This study measured spatial heterogeneity in neighborhoods as Walk Scores or traffic accidents at intersections within 400 or 800 m RB. However, this classification may not be accurate since this study only included six neighborhoods, failing to capture spatial variations. Thus, studies covering wider geographical boundaries are advised in the future.
As shown in other studies, perceived neighborhood built environments relate to older adults’ walking behaviors. Higher perceptions of accessible neighborhood destinations are not significant in avoiding sedentary behaviors. In contrast, walking with longer duration (150+ minutes per week) or higher frequency (3+ days per week) is more related to higher perceptions of accessibility to destinations [41,66,78,79,80] and/or safety, comfort, and convenience of neighborhood built environments [35,36,40,41,71,81]. Perceptions of physical and social disorder in neighborhoods was a significantly negative factor for walking that met physical activity guidelines [82] but not for the walking choice and walking 3+ days per week models. The perceptions of physical or social disorder may include negative perceptions of neighborhood safety, aesthetics, and quality of neighborhood infrastructures and be linked to low levels of walking [83]. Based on the findings from this study, sedentary older adults may benefit little from the modification of built environments in the neighborhoods, with some food and commercial destinations promoting walking behaviors [84].
A higher perception of safety, comfort, and convenience of neighborhood environments is a predictor of better self-rated health status linked to increased neighborhood walking of older adults. To be more specific, walking longer and more frequently correlates with better self-rated health status in this study, and this was consistent with Kerr et al.’s study (2012) [59]. Nonetheless, the author cannot conclude that there is a direct causal effect. Rather, healthy older adults may walk with higher frequency and duration. However, it is likely that regular walking, meeting or approaching physical activity guidelines in safe and comfortable neighborhoods, may promote health status or prevent deterioration of health compared to sedentary behaviors. A previous study argued that households with lower socioeconomic status at the individual level tended to perceive their neighborhood environments as unsafe and unattractive, which led to lower levels of neighborhood walking and self-rated health [85,86]. A limited body of longitudinal research shows that older adults’ walking declines less in safer and more walkable neighborhood environments [87]. More longitudinal research is required to investigate long-term neighborhood effects on walking and health outcomes of older adults in low-income neighborhoods.
Although this study contributes to the literature on low-income older adults and their neighborhood environments, there are some limitations. The primary limitation of this study is the small sample size. This study may have failed to “detect associations, and the cross-sectional design… makes the establishment of causal links methodologically difficult” [20] (p. 8). To overcome limitations of the small sample size through reducing the number of variables, this study used a stepwise elimination procedure in the final models. Such automation could be problematic, leading to “bias in parameter estimation, inconsistencies among model selection algorithms, an inherent (but often overlooked) problem of multiple hypothesis testing, and an inappropriate focus or reliance on a single best model” [88] (p. 1182). The second limitation is that the algorithm utilized (e.g., stepwise), the number of candidate parameters, and the order of parameters entered or deleted can affect the selected model. This issue is more sensitive when the predictors are correlated. It is likely to lead to false positive results, leading to the inflation of the probability of Type I errors. Along with sample size, this study’s findings from multiple imputations need to be interpreted carefully since a primary concern of multiple imputations with MICE is that no theoretical justification is as applicable as other imputation approaches: “Fitting a series of conditional distributions, as is done using the series of regression models, may not be consistent with a proper joint distribution” [89] (p. 47). Moreover, there are no standard imputation strategies present. For instance, clustering is not automatically included by the MICE procedures although clustering is important for both imputing missing data and data analysis [89]. The third limitation is that this sample is a purposive sample with nonprobability. The purposive sampling is likely to possess a nonresponse bias [90]. Using nonprobability sampling may lead to wrong results through standard statistical inference assuming probability sampling based on nonprobability as well [91]. Nevertheless, this sample included all the approachable Section 202 housing residents in St. Paul, Minnesota. The walking behavior differences by spatially heterogeneous housing locations without insufficient clusters might miss other environmental characteristics that were not considered in this study, rather than objective measures of Walk Scores or traffic accidents. Thus, future studies representing broader urban or metropolitan contexts in Minnesota are needed, with a larger probability sample. Last, this study mainly investigated the relationship between perceived neighborhood built environments and walking behaviors rather than neighborhood social environments, such as social cohesion and social networks. This study also did not deal with factors such as accessibility to public spaces (e.g., parks or physical activity facilities) in the neighborhoods, which are likely to be associated with older adults’ walking. These variables need to be examined as well in the future.
5. Conclusions
This study enriches the present knowledge of the influence of perceived and objective neighborhood built environments (i.e., neighborhood spatial heterogeneity classified by Walk Scores/traffic accidents) on the walking levels and self-rated health of low-income older adults, controlling for covariates such as sociodemographic characteristics and physical limitations, in the context of the United States. Walk Scores have been used as a proxy to measure neighborhood built environments. Its globally standardized indices measure neighborhood walkability. In this study, the neighborhoods with a higher Walk Score correlated with negative outcomes for walking for low-income older adults. The effect on walking of the neighborhood classification by Walk Scores and traffic accidents within a 400 m RB was weaker than the effect of the neighborhood classification by traffic accidents at intersections within a 800 m RB (i.e., in St. Paul, Minnesota, with its automobile-oriented urban environments). The neighborhoods with higher Walk Scores had higher traffic accidents at intersections within both 400 and 800 m RB as well. However, this needs to be compared with a wider area of Minnesota. The neighborhood heterogeneity was not associated with self-rated health. However, low-income older adults were likely to walk more when their safety, such as safety from traffic, crime, or falls, was guaranteed, and in neighborhoods with more accessible destinations within walking distance. The higher perceptions of safety, comfort, and convenience and higher walking outcomes were associated with self-rated health. Thus, understanding spatially heterogeneous neighborhood environments, perceptions of neighborhood built environments for safety, comfort, and convenience and accessibility to destinations, and self-rated health as well as physical limitations offer important implications for policy makers, urban planners, and public health providers regarding sustainable urban design/planning and neighborhood-based physical activities of low-income older adults [92].
Funding
This research received no external funding.
Institutional Review Board Statement
This study was approved by the Institute Review Board (IRB) of the University of Minnesota.
Informed Consent Statement
Written informed consents were obtained from all research subjects involved in this study.
Data Availability Statement
Data not available due to privacy/ethical restrictions.
Acknowledgments
The author thanks the six housing managers in Section 202 housing in St. Paul, Minnesota, for their cooperation in the data collection. The author is also thankful to the reviewers for their valuable comments. This research was partially supported through a Research Fellowship from the Asia Research Institute, National University of Singapore.
Conflicts of Interest
The author declares no conflict of interest.
Appendix A

Table A1.
Descriptive statistics of each variable, the results of factor analysis, and Cronbach’s alpha scores.
Table A1.
Descriptive statistics of each variable, the results of factor analysis, and Cronbach’s alpha scores.
| All (N = 130) | Accessibility to Destinations | Safety, Comfort, and Convenience | Physical and Social Disorder | Cronbach’s Alpha | |
|---|---|---|---|---|---|
| In my neighborhood, it is easy for me to walk from home to | |||||
| Places for grocery shopping | 2.95 ± 1.80 | 0.767 | 0.878 | ||
| Places where you can buy snacks or drinks such as convenience stores or food vendors | 3.35 ± 1.62 | 0.773 | |||
| Restaurants or coffee shops | 3.06 ± 1.65 | 0.728 | |||
| Retail stores such as clothing, beauty shops, or others | 2.55 ± 1.72 | 0.764 | |||
| Public institutions such as the post office, police station, or courthouse | 2.12 ± 1.42 | 0.664 | |||
| Health related facilities such as hospitals, clinics, or pharmacies | 2.57 ± 1.59 | 0.694 | |||
| Community center, libraries, or banks | 2.99 ± 1.64 | 0.565 | |||
| My preferred religious institution such as a church, temple, or mosque | 2.84 ± 1.65 | 0.429 | |||
| Recreational facilities such as museums, auditoriums, concert halls, or theaters | 1.96 ± 1.33 | 0.535 | |||
| In my neighborhood, | |||||
| There is enough lighting | 3.50 ± 1.43 | 0.379 | 0.748 | ||
| There are continuous sidewalks on most of the streets | 3.93 ± 1.37 | 0.584 | |||
| Sidewalks are well-maintained (even, with no or few cracks) | 3.46 ± 1.45 | 0.492 | |||
| There are benches or other places to rest along the streets | 2.72 ± 1.55 | 0.557 | |||
| There are enough trees along most of the streets | 3.46 ± 1.48 | 0.603 | |||
| There are many people walking | 3.39 ± 1.23 | 0.568 | |||
| It is safe to walk during the day | 3.98 ± 1.28 | 0.627 | |||
| There are many buildings that are attractive and well-maintained | 3.32 ± 1.42 | 0.539 | |||
| There are stray dogs, gangs, or strangers | 2.42 ± 1.47 | 0.452 | 0.697 | ||
| There are many abandoned houses, vacant lots, or graffiti on buildings or walls | 2.29 ± 1.41 | 0.717 | |||
| There are abandoned cars, litter, trash, or broken windows | 2.04 ± 1.36 | 0.806 | |||
| Sum of Squared loadings | 4.176 | 2.591 | 1.698 | ||
| Proportion Var | 0.209 | 0.130 | 0.085 | ||
| Cumulative Var | 0.209 | 0.338 | 0.423 |
Table A2.
Correlation between objective and subjective neighborhood built environments.
| Kendall’s Rank Correlation | Accessibility to Destinations | Safety, Comfort, and Convenience | Physical and Social Disorder | Traffic Accidents within 400 m RB | Traffic Accidents within 800 m RB |
|---|---|---|---|---|---|
| Walk Score | 0.158 * | −0.072 | 0.152 | 0.894 *** | 0.621 *** |
| Traffic Accidents within 400 m RB | 0.207 *** | −0.105 | 0.116 | 1.000 | 0.793 *** |
| Traffic Accidents within 800 m RB | 0.251 *** | −0.191 *** | 0.047 | 0.793 *** | 1.000 |
Note: * p < 0.05; *** p < 0.001.
Table A3.
Model comparison between models with only neighborhood perception variables and models with both objective (spatial heterogeneity in neighborhood) and perception variables.
Table A3.
Model comparison between models with only neighborhood perception variables and models with both objective (spatial heterogeneity in neighborhood) and perception variables.
| Model Comparison | Deviance (p-Value) | ||
|---|---|---|---|
| Walking Choice a | Walking 3+ Days b | Walking 150+ Min. c | |
| Perception Model vs. Walk Score Model | 9.846 ** | 18.101 *** | 5.319 † |
| Perception Model vs. Traffic Accidents within 400 m RB Model | 9.824 ** | 18.019 *** | 4.862 * |
| Perception Model vs. Traffic Accidents within 800 m RB Model | 16.140 *** | 26.914 *** | 10.831 ** |
Note: † p < 0.1; * p < 0.05; ** p < 0.01; *** p < 0.001. All models with objective neighborhood measures fit better than perception models at p < 0.1 or less. Perception models: a Walking Choice ~ Sex + Race + Mobility Aid Use + Safety, Comfort, and Convenience; b Walking 3+ days ~ Education + Mobility Aid Use + Accessibility to Destination; c Walking 150+ minutes ~ Age + Education + Car Ownership + Mobility Aid Use + Accessibility to Destination + Safety, Comfort, and Convenience + Physical and Social Disorder.
Table A4.
Model comparison between Walk Scores, traffic accidents within 400 m RB and traffic accidents within 800 m RB.
Table A4.
Model comparison between Walk Scores, traffic accidents within 400 m RB and traffic accidents within 800 m RB.
| N = 130 | Walking Choice | Walking 3+ Days | Walking 150+ Min. | ||||||
|---|---|---|---|---|---|---|---|---|---|
| Coefficient (95% CI) | Coefficient (95% CI) | Coefficient (95% CI) | |||||||
| Walk Score | Traffic Accidents within 400 m RB | Traffic Accidents within 800 m RB | Walk Score | Traffic Accidents within 400 m RB | Traffic Accidents within 800 m RB | Walk Score | Traffic Accidents within 400 m RB | Traffic Accidents within 800 m RB | |
| Sociodemographic Characteristics | |||||||||
| Intercept | 3.289 *** (1.803, 5.356) | 2.989 *** (1.542, 5.022) | 2.708 ** (1.185, 4.777) | 0.557 * (0.014, 1.131) | 0.241 (−0.290, 0.780) | 0.325 † (−0.226, 0.889) | −0.756 * (−1.446, −0.112) | −0.895 ** (−1.603, −0.246) | −0.976 ** (−1.713, −0.303) |
| Age (70–79) | - | - | - | - | - | - | −0.707 † (−1.544, 0.077) | −0.694 † (−1.527, 0.087) | −0.715 † (−1.587, 0.104) |
| Age (80+) | - | - | - | - | - | - | −0.796 * (−1.567, −0.065) | −0.781 * (−1.548, −0.051) | −0.860 * (−1.670, −0.101) |
| Sex (Female) | −1.941 * (−3.920, −0.503) | −1.944 * (−3.923, −0.507) | −1.945 * (−3.998, −0.412) | - | - | - | - | - | - |
| Race (Others) | 0.958 † (−0.132, 2.128) | 0.957 † (−0.133, 2.128) | 1.822 * (0.468, 3.402) | - | - | - | - | - | - |
| Education (Some College or Higher) | - | - | - | 0.741 † (−0.065, 1.589) | 0.743 † (−0.063, 1.590) | 0.7496 † (−0.080, 1.619) | 1.005 * (0.142, 1.916) | 0.991 * (0.131, 1.898) | 1.073 * (0.178, 2.031) |
| Car Ownership (Yes) | - | - | - | - | - | - | −1.251 * (−2.265, −0.317) | −1.226 * (−2.233, −0.295) | −1.049 * (−2.081, −0.086) |
| Physical Limitations | |||||||||
| Mobility Aid Use (Yes) | −2.388 ** (−4.105, −0.865) | −2.3973 ** (−4.109, −0.881) | −2.417 ** (−4.136, −0.904) | −1.673 * (−3.359, −0.223) | −1.694 * (−3.378, −0.240) | −1.7261 * (−3.459, −0.225) | −2.183 † (−5.273, −0.181) | −2.130 † (−5.219, −0.139) | −2.136 † (−5.221, −0.124) |
| Objective Neighborhood Built Envioronments (Neighborhood Heterogeneity) | |||||||||
| Walk Score (Somewhat Walkable) | −1.187 ** (−2.159, −0.342) | - | - | −1.227 *** (−1.957, −0.564) | - | - | −0.835 * (−1.609, −0.116) | - | - |
| (Very Walkable) | −0.795 (−2.395, 0.413) | - | - | −0.851 † (−1.812, 0.007) | - | - | −0.151 (−1.031, 0.748) | - | - |
| Traffic Accidents within 400 m RB (High) | - | −1.2162 ** (−2.086, −0.441) | - | - | −1.269 *** (−1.936, −0.662) | - | - | −0.731 * (−1.435, −0.079) | - |
| Traffic Accidents within 800 m RB (Medium) | - | - | −2.012 *** (−3.305, −0.909) | - | - | −1.8567 *** (−2.747, −1.067) | - | - | −0.950 * (−1.833, −0.123) |
| (High) | - | - | −0.587 (−1.792, 0.451) | - | - | −0.8031 * (−1.630, −0.047) | - | - | −1.067 * (−1.939, −0.255) |
| Perceived Neighborhood Built Environments | |||||||||
| Accessibility to Destinations | - | - | - | 0.690 ** (0.257, 1.165) | 0.686 ** (0.254, 1.161) | 0.9442 *** (0.450, 1.508) | 0.896 *** (0.396, 1.467) | 0.905 *** (0.407, 1.474) | 1.060 *** (0.515, 1.701) |
| Safety, Comfort, and Convenience | 0.684 ** (0.182, 1.227) | 0.6856 ** (0.186, 1.228) | 0.593 * (0.050, 1.171) | - | - | - | 0.444 † (−0.006, 0.924) | 0.430† (−0.016, 0.908) | 0.451 † (−0.030, 0.968) |
| Physical and Social Disorder | - | - | - | - | - | - | −0.465 † (−0.984, 0.008) | −0.479 † (−0.994, −0.012) | −0.599 * (−1.163, −0.095) |
| AIC | 111.64 | 109.66 | 105.34 | 159.03 | 157.11 | 150.22 | 154.08 | 152.53 | 148.56 |
| BIC | 131.71 | 126.87 | 125.42 | 176.24 | 171.45 | 167.42 | 185.62 | 181.21 | 180.11 |
| pseudo R2 (McFadden) | 0.265 | 0.265 | 0.312 | 0.157 | 0.159 | 0.207 | 0.206 | 0.204 | 0.239 |
Reference: Age (60–69); Sex (Male), Race (White), Education (High school graduate or below), Car Ownership (No), Mobility Aid User (No), Traffic Accidents within 400 or 800 m RB (Low/None), and Walk Score (Car-dependent). A stepwise elimination procedure was applied in both directions; † p < 0.1; * p < 0.05; ** p < 0.01; *** p < 0.001. Neighborhoods with traffic accidents within a 400 m RB (levels: low/none and high) have the same classification of Walk Scores (two levels: car-dependent/somewhat walkable and very walkable).
References
- United Nations. World Population Prospects: The 2017 Revision; United Nations: New York, NY, USA, 2017. [Google Scholar]
- Nelson, M.E.; Rejeski, W.J.; Blair, S.N.; Duncan, P.W.; Judge, J.O.; King, A.C.; Macera, C.A.; Castaneda-Sceppa, C. Physical activity and public health in older adults: Recommendation from the American College of Sports Medicine and the American Heart Association. Circulation 2007, 116, 1094–1105. [Google Scholar] [CrossRef] [Green Version]
- Zheng, Z.; Yang, L. Neighborhood environment, lifestyle, and health of older adults: Comparison of age groups based on ecological model of aging. Sustainability 2019, 11, 2077. [Google Scholar] [CrossRef] [Green Version]
- World Health Organization. Active Ageing: A Policy Framework; WHO: Marid, Spain, 2002. [Google Scholar]
- U.S. Department of Health and Human Services. Physical Activity Guidelines for Americans, 2nd ed.; U.S. Department of Health and Human Services: Washington, DC, USA, 2018.
- Sparling, P.B.; Howard, B.J.; Dunstan, D.W.; Owen, N. Recommendations for physical activity in older adults. BMJ Br. Med. J. 2015, 350, h100. [Google Scholar] [CrossRef] [Green Version]
- World Health Organization. Global Recommendations on Physical Activity for Health. 2011. Available online: https://www.who.int/dietphysicalactivity/physical-activity-recommendations-65years.pdf (accessed on 16 March 2021).
- Zenko, Z.; Willis, E.A.; White, D.A. Proportion of adults meeting the 2018 physical activity guidelines for Americans according to accelerometers. Front. Public Health 2019, 7, 135. [Google Scholar] [CrossRef] [PubMed] [Green Version]
- Buman, M.P.; Hekler, E.B.; Haskell, W.L.; Pruitt, L.; Conway, T.L.; Cain, K.L.; Sallis, J.F.; Saelens, B.E.; Frank, L.D.; King, A.C. Objective light-intensity physical activity associations with rated health in older adults. Am. J. Epidemiol. 2010, 172, 1155–1165. [Google Scholar] [CrossRef] [PubMed] [Green Version]
- Chudyk, A.M.; McKay, H.A.; Winters, M.; Sims-Gould, J.; Ashe, M.C. Neighborhood walkability, physical activity, and walking for transportation: A cross-sectional study of older adults living on low income. BMC Geriatr. 2017, 17, 82. [Google Scholar] [CrossRef] [PubMed]
- Patel, A.V.; Hildebrand, J.S.; Leach, C.R.; Campbell, P.T.; Doyle, C.; Shuval, K.; Wang, Y.; Gapstur, S.M. Walking in relation to mortality in a large prospective cohort of older U.S. adults. Am. J. Prev. Med. 2018, 54, 10–19. [Google Scholar] [CrossRef]
- Chudyk, A.M.; Sims-Gould, J.; Ashe, M.C.; Winters, M.; McKay, H.A. Walk the talk: Characterizing mobility in older adults living on low income. Can. J. Aging 2017, 36, 141–158. [Google Scholar] [CrossRef] [PubMed]
- Van Cauwenberg, J.; Clarys, P.; De Bourdeaudhuij, I.; Van Holle, V.; Verte, D.; De Witte, N.; De Donder, L.; Buffel, T.; Dury, S.; Deforche, B. Physical environmental factors related to walking and cycling in older adults: The Belgian aging studies. BMC Public Health 2012, 12, 142. [Google Scholar] [CrossRef] [Green Version]
- Brawley, L.R.; Rejeski, W.J.; King, A.C. Promoting physical activity for older adults: The challenges for changing behavior. Am. J. Prev. Med. 2003, 25, 172–183. [Google Scholar] [CrossRef]
- King, D. Neighborhood and individual factors in activity in older adults: Results from the neighborhood and senior health study. J. Aging Phys. Act. 2008, 16, 144–170. [Google Scholar] [CrossRef]
- Van Holle, V.; Van Cauwenberg, J.; De Bourdeaudhuij, I.; Deforche, B.; Van de Weghe, N.; Van Dyck, D. Interactions between neighborhood social environment and walkability to explain Belgian older adults’ physical activity and sedentary time. Int. J. Environ. Res. Public Health 2016, 13, 569. [Google Scholar] [CrossRef] [Green Version]
- Cerin, E.; Leslie, E.; Owen, N. Explaining socio-economic status differences in walking for transport: An ecological analysis of individual, social and environmental factors. Soc. Sci. Med. 2009, 68, 1013–1020. [Google Scholar] [CrossRef] [PubMed]
- Owen, N.; Cerin, E.; Leslie, E.; duToit, L.; Coffee, N.; Frank, L.D.; Bauman, A.E.; Hugo, G.; Saelens, B.E.; Sallis, J.F. Neighborhood walkability and the walking behavior of Australian adults. Am. J. Prev. Med. 2007, 33, 387–395. [Google Scholar] [CrossRef]
- Turrell, G.; Haynes, M.; Wilson, L.-A.; Giles-Corti, B. Can the built environment reduce health inequalities? A study of neighbourhood socioeconomic disadvantage and walking for transport. Health Place 2013, 19, 89–98. [Google Scholar] [CrossRef]
- Engel, L.; Chudyk, A.M.; Ashe, M.C.; McKay, H.A.; Whitehurst, D.G.T.; Bryan, S. Older adults’ quality of life—Exploring the role of the built environment and social cohesion in community-dwelling seniors on low income. Soc. Sci. Med. 2016, 164, 1–11. [Google Scholar] [CrossRef]
- Lawton, M.P. Environment and aging: Theory revisited. In Environment and Aging Theory: A Focus on Aging; Scheidt, R.J., Windley, P.G., Eds.; Greenwood Press: Westport, CT, USA, 1998; pp. 1–31. [Google Scholar]
- Sallis, J.F.; Owen, N.; Fisher, E.B. Ecological models of health behavior. In Health Behavior and Health Education: Theory, Research, and Practice, 3rd ed.; Glanz, K., Rimer, B.K., Lewis, F.M., Eds.; Jossey-Bass: San Francisco, CA, USA, 2002; pp. 465–485. [Google Scholar]
- Sallis, J.F.; Cervero, R.B.; Ascher, W.; Henderson, K.A.; Kraft, M.K.; Kerr, J. An ecological approach to creating active living communities. Annu. Rev. Public Health 2006, 27, 297–322. [Google Scholar] [CrossRef] [Green Version]
- Handy, S.L.; Boarnet, M.G.; Ewing, R.; Killingsworth, R.E. How the built environment affects physical activity: Views from urban planning. Am. J. Prev. Med. 2002, 23, 64–73. [Google Scholar] [CrossRef]
- Kerr, J.; Norman, G.; Millstein, R.; Adams, M.A.; Morgan, C.; Langer, R.D.; Allison, M. Neighborhood environment and physical activity among older women: Findings from the San Diego Cohort of the Women’s Health Initiative. J. Phys. Act. Health 2014, 11, 1070–1077. [Google Scholar] [CrossRef] [PubMed]
- Winters, M.; Barnes, R.; Venners, S.; Ste-Marie, N.; McKay, H.; Sims-Gould, J.; Ashe, M.C. Older adults’ outdoor walking and the built environment: Does income matter? BMC Public Health 2015, 15, 876. [Google Scholar] [CrossRef] [Green Version]
- Yun, H.Y. Environmental factors associated with older adult’s walking behaviors: A systematic review of quantitative studies. Sustainability 2019, 11, 3253. [Google Scholar] [CrossRef] [Green Version]
- Cheng, L.; Shi, K.; De Vos, J.; Cao, M.; Witlox, F. Examining the spatially heterogeneous effects of the built environment on walking among older adults. Transp. Policy 2021, 100, 21–30. [Google Scholar] [CrossRef]
- Chen, P.; Zhou, J. Effects of the built environment on automobile-involved pedestrian crash frequency and risk. J. Transp. Health 2016, 3, 448–456. [Google Scholar] [CrossRef] [Green Version]
- Ding, C.; Chen, P.; Jiao, J. Non-linear effects of the built environment on automobile-involved pedestrian crash frequency: A machine learning approach. Accid. Anal. Prev. 2018, 112, 116–126. [Google Scholar] [CrossRef] [PubMed]
- Lee, J.S.; Zegras, P.C.; Ben-Joseph, E. Safely active mobility for urban baby boomers: The role of neighborhood design. Accid. Anal. Prev. 2013, 61, 153–166. [Google Scholar] [CrossRef]
- Won, J.; Lee, C.; Forjuoh, S.N.; Ory, M.G. Neighborhood safety factors associated with older adults’ health-related outcomes: A systematic literature review. Soc. Sci. Med. 2016, 165, 177–186. [Google Scholar] [CrossRef]
- Barnett, D.W.; Barnett, A.; Nathan, A.; Van Cauwenberg, J.; Cerin, E. Built environmental correlates of older adults’ total physical activity and walking: A systematic review and meta-analysis. Int. J. Behav. Nutr. Phys. Act. 2017, 14, 103. [Google Scholar] [CrossRef] [Green Version]
- Wang, Z.; Lee, C. Site and neighborhood environments for walking among older adults. Health Place 2010, 16, 1268–1279. [Google Scholar] [CrossRef] [PubMed]
- Gómez, L.F.; Parra, D.C.; Buchner, D.; Brownson, R.; Sarmiento, O.; Pinzón, J.D.; Ardila, M.; Moreno, J.; Serrato, M.; Lobelo, F. Built environment attributes and walking patterns among the elderly population in Bogotá. Am. J. Prev. Med. 2010, 38, 592–599. [Google Scholar] [CrossRef] [PubMed]
- Lee, H.-S.; Park, E.-Y. Associations of neighborhood environment and walking in Korean elderly women: A comparison between urban and rural dwellers. Asian Women 2015, 31, 1–21. [Google Scholar] [CrossRef]
- Li, Y.; Kao, D.; Dinh, T.Q. Correlates of neighborhood environment with walking among older Asian Americans. J. Aging Health 2015, 27, 17–34. [Google Scholar] [CrossRef]
- Ory, M.G.; Towne, J.S.D.; Won, J.; Forjuoh, S.N.; Lee, C. Social and environmental predictors of walking among older adults. BMC Geriatr. 2016, 16, 155. [Google Scholar] [CrossRef] [PubMed] [Green Version]
- Zandieh, R.; Flacke, J.; Martínez-Martín, J.A.; Jones, P.; Van Maarseveen, M. Do inequalities in neighborhood walkability drive disparities in older adults’ outdoor walking? Int. J. Environ. Res. Public Health 2017, 14, 740. [Google Scholar] [CrossRef] [PubMed] [Green Version]
- Tsunoda, K.; Tsuji, T.; Kitano, N.; Mitsuishi, Y.; Yoon, J.-Y.; Yoon, J.; Okura, T. Associations of physical activity with neighborhood environments and transportation modes in older Japanese adults. Prev. Med. 2012, 55, 113–118. [Google Scholar] [CrossRef] [Green Version]
- Inoue, S.; Ohya, Y.; Odagiri, Y.; Takamiya, T.; Kamada, M.; Okada, S.; Oka, K.; Kitabatake, Y.; Nakaya, T.; Sallis, J.F.; et al. Perceived neighborhood environment and walking for specific purposes among elderly Japanese. J. Epidemiol. 2011, 21, 481–490. [Google Scholar] [CrossRef] [Green Version]
- de Leon, C.F.M.; Cagney, K.A.; Bienias, J.L.; Barnes, L.L.; Skarupski, K.A.; Scherr, P.A.; Evans, D.A. Neighborhood social cohesion and disorder in relation to walking in community-dwelling older adults A multilevel analysis. J. Aging Health 2009, 21, 155–171. [Google Scholar] [CrossRef] [Green Version]
- Hughes, S.L.; Leith, K.H.; Marquez, D.X.; Moni, G.; Nguyen, H.Q.; Desai, P.; Jones, D.L. Physical activity and older adults: Expert consensus for a new research agenda. Gerontology 2011, 51, 822–832. [Google Scholar] [CrossRef] [PubMed] [Green Version]
- Sparrow, R. Heard from HUD: Mixed-Finance Section 202 and Section 811 Housing. J. Afford. Hous. Community Dev. Law 2004, 13, 171–175. [Google Scholar]
- Perl, L. Section 202 and Other HUD Rental Housing Programs for Low-Income Elderly Residents; Congressional Research Service: Washington, DC, USA, 2010. [Google Scholar]
- Schwartz, A.F. Housing Policy in the United States, 2nd ed.; Routledge: New York, NY, USA, 2010. [Google Scholar]
- Gallagher, N.A.; Clarke, P.J.; Ronis, D.L.; Cherry, C.L.; Nyquist, L.; Gretebeck, K.A. Influences on neighborhood walking in older adults. Res. Gerontol. Nurs. 2012, 5, 238–250. [Google Scholar] [CrossRef] [Green Version]
- Omura, J.D.; Hyde, E.T.; Whitfield, G.P.; Hollis, N.D.; Fulton, J.E.; Carlson, S.A. Differences in perceived neighborhood environmental supports and barriers for walking between US adults with and without a disability. Prev. Med. 2020, 134, 106065. [Google Scholar] [CrossRef] [PubMed]
- Koohsari, M.J.; Sugiyama, T.; Hanibuchi, T.; Shibata, A.; Ishii, K.; Liao, Y.; Oka, K. Validity of Walk Score® as a measure of neighborhood walkability in Japan. Prev. Med. Rep. 2018, 9, 114–117. [Google Scholar] [CrossRef] [PubMed]
- Carr, L.J.P.; Dunsiger, S.I.P.; Marcus, B.H.P. Walk Score™ as a global estimate of neighborhood walkability. Am. J. Prev. Med. 2010, 39, 460–463. [Google Scholar] [CrossRef] [PubMed] [Green Version]
- Lo, B.K.; Graham, M.L.; Folta, S.C.; Paul, L.C.; Strogatz, D.; Nelson, M.E.; Parry, S.A.; Carfagno, M.E.; Wing, D.; Higgins, M.; et al. Examining the associations between Walk Score, perceived built environment, and physical activity behaviors among women participating in a community-randomized lifestyle change intervention trial: Strong hearts, healthy communities. Int. J. Environ. Res. Public Health 2019, 16, 849. [Google Scholar] [CrossRef] [Green Version]
- Duncan, D.T.; Aldstadt, J.; Whalen, J.; Melly, S.J.; Gortmaker, S.L. Validation of Walk Score for estimating neighborhood walkability: An analysis of four US metropolitan areas. Int. J. Environ. Res. Public Health 2011, 8, 4160–4179. [Google Scholar] [CrossRef]
- Hirsch, J.A.; Winters, M.; Clarke, P.J.; Ste-Marie, N.; McKay, H.A. The influence of walkability on broader mobility for Canadian middle aged and older adults: An examination of Walk Score™ and the mobility over varied environments scale (MOVES). Prev. Med. 2016, 95, S60–S67. [Google Scholar] [CrossRef] [Green Version]
- Liao, Y.; Huang, P.-H.; Hsiang, C.-Y.; Huang, J.-H.; Hsueh, M.-C.; Park, J.-H. Associations of older Taiwanese adults’ personal attributes and perceptions of the neighborhood environment concerning walking for recreation and transportation. Int. J. Environ. Res. Public Health 2017, 14, 1594. [Google Scholar] [CrossRef] [Green Version]
- Hirsch, J.A.; Diez Roux, A.V.; Moore, K.A.; Evenson, K.R.; Rodriguez, D.A. Change in walking and body mass index following residential relocation: The multi-ethnic study of atherosclerosis. Am. J. Public Health 2014, 104, e49–e56. [Google Scholar] [CrossRef]
- Frank, L.D. Enhancing Walk Score’s Ability to Predict Physical Activity and Active Transportation. 2013. Available online: https://activelivingresearch.org/sites/activelivingresearch.org/files/2013_Bike-WalkScore_Frank.pdf (accessed on 16 March 2021).
- Bigonnesse, C.; Beaulieu, M.; Garon, S. Meaning of home in later life as a concept to understand older adults’ housing needs: Results from the 7 age-friendly cities pilot project in Québec. J. Hous. Elder. 2014, 28, 357–382. [Google Scholar] [CrossRef]
- Kerr, J.; Marshall, S.; Godbole, S.; Neukam, S.; Crist, K.; Wasilenko, K.; Golshan, S.; Buchner, D. The relationship between outdoor activity and health in older adults using GPS. Int. J. Environ. Res. Public Health 2012, 9, 4615–4625. [Google Scholar] [CrossRef] [Green Version]
- Kerr, J.; Sallis, J.F.; Saelens, B.E.; Cain, K.L.; Conway, T.L.; Frank, L.D.; King, A.C. Outdoor physical activity and self rated health in older adults living in two regions of the U.S. Int. J. Behav. Nutr. Phys. Act. 2012, 9, 89. [Google Scholar] [CrossRef] [Green Version]
- Bonett, D.G.; Wright, T.A. Cronbach’s alpha reliability: Interval estimation, hypothesis testing, and sample size planning. J. Organ. Behav. 2015, 36, 3–15. [Google Scholar] [CrossRef]
- Cohen, J. Statistical Power Analysis for the Behavioral Sciences; Revised Edition; Academic Press: New York, NY, USA, 1977. [Google Scholar]
- Maas, C.J.M.; Hox, J.J. Sufficient sample sizes for multilevel modeling. Methodology 2005, 1, 86–92. [Google Scholar] [CrossRef] [Green Version]
- Concato, J.; Peduzzi, P.; Holford, T.R.; Feinstein, A.R. Importance of events per independent variable in proportional hazards analysis I. Background, goals, and general strategy. J. Clin. Epidemiol. 1995, 48, 1495–1501. [Google Scholar] [CrossRef]
- Peduzzi, P.; Concato, J.; Kemper, E.; Holford, T.R.; Feinstein, A.R. A simulation study of the number of events per variable in logistic regression analysis. J. Clin. Epidemiol. 1996, 49, 1373–1379. [Google Scholar] [CrossRef]
- Michael, Y.; Beard, T.; Choi, D.; Farquhar, S.; Carlson, N. Measuring the influence of built neighborhood environments on walking in older adults. J. Aging Phys. Act. 2006, 14, 302–312. [Google Scholar] [CrossRef] [Green Version]
- Troped, P.J.; Starnes, H.A.; Puett, R.C.; Tamura, K.; Cromley, E.K.; James, P.; Ben-Joseph, E.; Melly, S.J.; Laden, F. Relationships between the built environment and walking and weight status among older women in three US States. J. Aging Phys. Act. 2014, 22, 114–125. [Google Scholar] [CrossRef] [Green Version]
- Satariano, W.A.; Ivey, S.L.; Kurtovich, E.; Kealey, M.; Hubbard, A.E.; Bayles, C.M.; Bryant, L.L.; Hunter, R.H.; Prohaska, T.R. Lower-body function, neighborhoods, and walking in an older population. Am. J. Prev. Med. 2010, 38, 419–428. [Google Scholar] [CrossRef]
- Van Dyck, D.; Cardon, G.; Deforche, B.; De Bourdeaudhuij, I. IPAQ interview version: Convergent validity with accelerometers and comparison of physical activity and sedentary time levels with the self-administered version. J. Sports Med. Phys. Fit. 2015, 55, 776–786. [Google Scholar]
- Cole, R.; Dunn, P.; Hunter, I.; Owen, N.; Sugiyama, T. Walk Score and Australian adults’ home-based walking for transport. Health Place 2015, 35, 60–65. [Google Scholar] [CrossRef] [PubMed]
- Rubín, L.; Mitáš, J.; Dygrýn, J.; Šmída, J.; Gábor, L.; Pátek, A. Active commuting of the inhabitants of Liberec city in low and high walkability areas. Acta Gymnica 2015, 45, 195–202. [Google Scholar] [CrossRef] [Green Version]
- Towne, S.D., Jr.; Won, J.; Lee, S.; Ory, M.G.; Forjuoh, S.N.; Wang, S.; Lee, C. Using Walk Score™ and neighborhood perceptions to assess walking among middle-aged and older adults. J. Community Health 2016, 41, 977–988. [Google Scholar] [CrossRef]
- Tuckel, P.; Milczarski, W. Walk ScoreTM, perceived neighborhood walkability, and walking in the US. Am. J. Health Behav. 2015, 39, 242–256. [Google Scholar] [CrossRef] [PubMed]
- Takahashi, P.Y.; Baker, M.A.; Cha, S.; Targonski, P.V. A cross-sectional survey of the relationship between walking, biking, and the built environment for adults aged over 70 years. Risk Manag. Healthc. Policy 2012, 5, 35–41. [Google Scholar] [CrossRef] [PubMed] [Green Version]
- Moudon, A.V.; Lin, L.; Jiao, J.; Hurvitz, P.; Reeves, P. The risk of pedestrian injury and fatality in collisions with motor vehicles, a social ecological study of state routes and city streets in King County, Washington. Accid. Anal. Prev. 2011, 43, 11–24. [Google Scholar] [CrossRef]
- Rosenberg, D.E.; Huang, D.L.; Simonovich, S.D.; Belza, B. Outdoor built environment barriers and facilitators to activity among midlife and older adults with mobility disabilities. Gerontology 2013, 53, 268–279. [Google Scholar] [CrossRef] [PubMed] [Green Version]
- Tournier, I.; Dommes, A.; Cavallo, V. Review of safety and mobility issues among older pedestrians. Accid. Anal. Prev. 2016, 91, 24–35. [Google Scholar] [CrossRef] [PubMed]
- Bernhoft, I.M.; Carstensen, G. Preferences and behaviour of pedestrians and cyclists by age and gender. Transp. Res. Part F Traffic Psychol. Behav. 2008, 11, 83–95. [Google Scholar] [CrossRef]
- Winters, M.; Voss, C.; Ashe, M.C.; Gutteridge, K.; McKay, H.; Sims-Gould, J. Where do they go and how do they get there? Older adults’ travel behaviour in a highly walkable environment. Soc. Sci. Med. 2015, 133, 304–312. [Google Scholar] [CrossRef]
- Salvador, E.P.; Reis, R.S.; Florindo, A.A. Practice of walking and its association with perceived environment among elderly Brazilians living in a region of low socioeconomic level. Int. J. Behav. Nutr. Phys. Act. 2010, 7, 67. [Google Scholar] [CrossRef] [PubMed]
- Patterson, P.K.; Chapman, N.J. Urban form and older residents’ service use, walking, driving, quality of life, and neighborhood satisfaction. Am. J. Health Promot. 2004, 1, 45–52. [Google Scholar] [CrossRef]
- Sugiyama, T.; Thompson, C.W.; Alves, S. Associations between neighborhood open space attributes and quality of life for older people in Britain. Environ. Behav. 2008, 41, 3–21. [Google Scholar] [CrossRef]
- Mooney, S.J.; Joshi, S.; Cerda, M.; Kennedy, G.J.; Beard, J.R.; Rundle, A.G. Contextual correlates of physical activity among older adults: A Neighborhood Environment-Wide Association Study (NE-WAS). Cancer Epidemiol. Biomark. Prev. 2017, 26, 495–504. [Google Scholar] [CrossRef] [Green Version]
- Zandieh, R.; Martinez Martin, J.; Flacke, J.; Jones, P.; van Maarseveen, M.F.A.M. Older adults’ outdoor walking: Inequalities in neighbourhood safety, pedestrian infrastructure and aesthetics. Int. J. Environ. Res. Public Health 2016, 13, 1–24. [Google Scholar] [CrossRef] [Green Version]
- Nathan, A.; Pereira, G.; Foster, S.; Hooper, P.; Saarloos, D.; Giles-Corti, B. Access to commercial destinations within the neighbourhood and walking among Australian older adults. Int. J. Behav. Nutr. Phys. Act. 2012, 9, 133. [Google Scholar] [CrossRef] [PubMed] [Green Version]
- Kamphuis, C.B.M.; Mackenbach, J.P.; Giskes, K.; Huisman, M.; Brug, J.; van Lenthe, F.J. Why do poor people perceive poor neighbourhoods? The role of objective neighbourhood features and psychosocial factors. Health Place 2010, 16, 744–754. [Google Scholar] [CrossRef]
- Meyer, O.L.; Castro-Schilo, L.; Aguilar-Gaxiola, S. Determinants of mental health and self-rated health: A model of socioeconomic status, neighborhood safety, and physical activity. Am. J. Public Health 2014, 104, 1734–1741. [Google Scholar] [CrossRef]
- Li, F.; Fisher, K.J.; Brownson, R.C. A multilevel analysis of change in neighborhood walking activity in older adults. J. Aging Phys. Act. 2005, 13, 145–159. [Google Scholar] [CrossRef]
- Whittingham, M.J.; Stephens, P.A.; Bradbury, R.B.; Freckleton, R.P. Why do we still use stepwise modelling in ecology and behaviour? J. Anim. Ecol. 2006, 75, 1182–1189. [Google Scholar] [CrossRef] [PubMed]
- Azur, M.J.; Stuart, E.A.; Frangakis, C.; Leaf, P.J. Multiple imputation by chained equations: What is it and how does it work?: Multiple imputation by chained equations. Int. J. Methods Psychiatr. Res. 2011, 20, 40–49. [Google Scholar] [CrossRef]
- Frankfort-Nachmias, C.; Nachmias, D. Research Methods in the Social Sciences, 7th ed.; Worth Publishers: New York, NY, USA, 2008. [Google Scholar]
- Vehovar, V.; Toepoel, V.; Steinmetz, S. Non-probability sampling. In The SAGE Handbook of Survey Methodology; Wolf, C., Joye, D., Smith, T.W., Fu, Y.-C., Eds.; SAGE: London, UK, 2016; pp. 329–345. [Google Scholar]
- Troped, P.J.; Tamura, K.; McDonough, M.H.; Starnes, H.A.; James, P.; Ben-Joseph, E.; Cromley, E.; Puett, R.; Melly, S.J.; Laden, F. Direct and indirect associations between the built environment and leisure and utilitarian walking in older women. Ann. Behav. Med. 2017, 51, 282–291. [Google Scholar] [CrossRef] [Green Version]
Figure 1.
Conceptual framework for this study. This framework was produced by the author.

Figure 2.
The locations of Section 202 housing in St. Paul, Minnesota. This map was produced by the author.
Figure 2.
The locations of Section 202 housing in St. Paul, Minnesota. This map was produced by the author.

Figure 3.
Traffic accidents at intersections within 400 m and 800 m radius buffers (RBs) and Walk Scores. This map was produced by the author.
Figure 3.
Traffic accidents at intersections within 400 m and 800 m radius buffers (RBs) and Walk Scores. This map was produced by the author.

Figure 4.
Group differences between winter and summer for walking days and walking time per week.

Figure 5.
Group differences for walking outcomes and self-rated health by Walk Scores.

Figure 6.
Group differences for walking outcomes, and self-rated health by traffic accidents at intersections within a 400 m RB.
Figure 6.
Group differences for walking outcomes, and self-rated health by traffic accidents at intersections within a 400 m RB.

Figure 7.
Group differences for walking outcomes, and self-rated health by traffic accidents at intersections within an 800 m RB.
Figure 7.
Group differences for walking outcomes, and self-rated health by traffic accidents at intersections within an 800 m RB.

Table 1.
Descriptive statistics for selected characteristics by gender.
| All (N = 130) | Male (N = 34) | Female (N = 96) | p-Value | |
|---|---|---|---|---|
| Sociodemographic Characteristics | ||||
| Age | 0.427 | |||
| 60–69 | 45 (34.6%) | 11 (32.4%) | 34 (35.4%) | |
| 70–79 | 46 (35.4%) | 15 (44.1%) | 31 (32.3%) | |
| 80 or Above | 39 (30.0%) | 8 (23.5%) | 31 (32.3%) | |
| Race | 0.278 | |||
| White | 62 (47.7%) | 13 (38.2%) | 49 (51.0%) | |
| Others | 68 (52.3%) | 21 (61.8%) | 47 (49.0%) | |
| Education | 0.522 | |||
| High School or Less | 73 (56.2%) | 17 (50.0%) | 56 (58.3%) | |
| Some College or Higher | 57 (43.8%) | 17 (50.0%) | 40 (41.7%) | |
| Households | 0.237 | |||
| Living with Someone Else | 14 (10.8%) | 6 (17.6%) | 8 (8.3%) | |
| Alone | 116 (89.2%) | 28 (82.4%) | 88 (91.7%) | |
| Car Ownership | 1.000 | |||
| No | 86 (66.2%) | 22 (64.7%) | 64 (66.7%) | |
| Yes | 44 (33.8%) | 12 (35.3%) | 32 (33.3%) | |
| Physical Limitations | ||||
| Mobility Aids Use | 0.727 | |||
| No | 119 (91.5%) | 32 (94.1%) | 87 (90.6%) | |
| Yes | 11 (8.5%) | 2 (5.9%) | 9 (9.4%) | |
| Objective Neighborhood Built Environments (Spatial Heterogeneity) | ||||
| Walk Score | 0.308 | |||
| Car-dependent | 44 (33.8%) | 8 (23.5%) | 36 (37.5%) | |
| Somewhat Walkable | 24 (18.5%) | 8 (23.5%) | 16 (16.7%) | |
| Very Walkable | 62 (47.7%) | 18 (52.9%) | 44 (45.8%) | |
| Traffic Accidents within 400 m RB | 0.680 | |||
| Low/None | 68 (52.3%) | 16 (47.1%) | 52 (54.2%) | |
| High | 62 (47.7%) | 18 (52.9%) | 44 (45.8%) | |
| Traffic Accidents within 800 m RB | 0.366 | |||
| Low/None | 48 (36.9%) | 10 (29.4%) | 38 (39.6%) | |
| Medium | 38 (29.2%) | 13 (38.2%) | 25 (26.0%) | |
| High | 44 (33.8%) | 11 (32.4%) | 33 (34.4%) | |
| Perceived Neighborhood Built Environments (Average of Summed Scores) | ||||
| Accessibility to Destinations | 2.7 ± 1.1 | 2.9 ± 1.0 | 2.7 ± 1.2 | 0.399 |
| Safety, Comfort, and Convenience | 3.0 ± 0.8 | 3.0 ± 0.7 | 3.0 ± 0.8 | 0.623 |
| Physical and Social Disorder | 2.2 ± 1.1 | 2.3 ± 1.0 | 2.2 ± 1.2 | 0.609 |
| Dependent Variables | ||||
| Walking Choice | 0.025 | |||
| No Walking | 27 (20.8%) | 2 (5.9%) | 25 (26.0%) | |
| Walking | 103 (79.2%) | 32 (94.1%) | 71 (74.0%) | |
| Walking 3+ Days | 0.392 | |||
| Less than 3 Days | 52 (40.0%) | 11 (32.4%) | 41 (42.7%) | |
| 3 Days or More | 78 (60.0%) | 23 (67.6%) | 55 (57.3%) | |
| Walking 150+ Minutes | 0.207 | |||
| <150 min | 86 (66.2%) | 19 (55.9%) | 67 (69.8%) | |
| ≥150 min | 44 (33.8%) | 15 (44.1%) | 29 (30.2%) | |
| Self-rated Health | 1.000 | |||
| Very Poor/Poor | 72 (55.4%) | 19 (55.9%) | 53 (55.2%) | |
| Average/Good | 58 (44.6%) | 15 (44.1%) | 43 (44.8%) | |
Note: Because the sample size is small, subgroup analysis by gender was not performed.
Table 2.
Logistic regression models for walking outcomes by traffic accidents within 800 m RB.
N = 130 | Walking Choice | Walking 3+ Days | Walking 150+ Min. |
|---|---|---|---|
| Coefficient (95% CI) | Coefficient (95% CI) | Coefficient (95% CI) | |
| Sociodemographic Characteristics | |||
| Intercept | 2.708 ** (1.185, 4.777) | 0.325 † (−0.226, 0.889) | −0.976 ** (−1.713, −0.303) |
| Age (70–79) | - | - | −0.715 † (−1.587, 0.104) |
| Age (80+) | - | - | −0.860 * (−1.670, −0.101) |
| Sex (Female) | −1.945 * (−3.998, −0.412) | - | - |
| Race (Others) | 1.822 * (0.468, 3.402) | - | - |
| Education (Some College or Higher) | - | 0.7496 † (−0.080, 1.619) | 1.073 * (0.178, 2.031) |
| Car Ownership (Yes) | - | - | −1.049 * (−2.081, −0.086) |
| Physical Limitations | |||
| Mobility Aid Use (Yes) | −2.417 ** (−4.136, −0.904) | −1.7261 * (−3.459, −0.225) | −2.136 † (−5.221, −0.124) |
| Objective Neighborhood Built Environments | |||
| Traffic Accidents within 800 m RB (Medium) | −2.012 *** (−3.305, −0.909) | −1.8567 *** (−2.747, −1.067) | −0.950 * (−1.833, −0.123) |
| Traffic Accidents within 800 m RB (High) | −0.587 (−1.792, 0.451) | −0.8031 * (−1.630, −0.047) | −1.067 * (−1.939, −0.255) |
| Perceived Neighborhood Built Environments | |||
| Accessibility to Destinations | - | 0.9442 *** (0.450, 1.508) | 1.060 *** (0.515, 1.701) |
| Safety, Comfort, and Convenience | 0.593 * (0.050, 1.171) | - | 0.451 † (−0.030, 0.968) |
| Physical and Social Disorder | - | - | −0.599 * (−1.163, −0.095) |
| AIC | 105.34 | 150.22 | 148.56 |
| BIC | 125.42 | 167.42 | 180.11 |
| pseudo R2 (McFadden) | 0.312 | 0.207 | 0.239 |
Reference: Age (60–69), Sex (Male), Race (White), Education (High school graduate or below), Car Ownership (No), Mobility Aid User (No), Traffic Accidents (Low/None), and Walk Score (Car-dependent). A stepwise elimination procedure was applied in both directions; † p < 0.1; * p < 0.05; ** p < 0.01; *** p < 0.001; AIC: Akaike Information Criterion; BIC: Bayesian Information Criterion.
Table 3.
Logistic regression models for self-rated health by walking outcomes.
| N = 130 | Coefficient (95% CI) | Coefficient (95% CI) | Coefficient (95% CI) |
|---|---|---|---|
| Sociodemographic Characteristics | |||
| Intercept | −1.318 ** (−2.374, −0.376) | −1.270 *** (−2.054, −0.562) | −0.325 (−0.811, 0.151) |
| Age (70–79) | 0.535 (−0.116, 1.209) | 0.561 † (−0.098, 1.242) | 0.723 * (0.047, 1.434) |
| Age (80+) | 0.6541 † (−0.000, 1.342) | 0.675 † (0.004, 1.383) | 0.789 * (0.105, 1.518) |
| Car Ownership (Yes) | 0.804 † (−0.006, 1.646) | 0.851 * (0.026, 1.710) | 1.007 * (0.161, 1.899) |
| Perceived Neighborhood Built Environments | |||
| Safety, Comfort, and Convenience | 0.376 † (–0.015, 0.790) | 0.435 * (0.036, 0.858) | 0.426 * (0.028, 0.847) |
| Walking Outcomes | |||
| Walking Choice | 1.043 * (0.056, 2.122) | - | - |
| Walking 3+ days | - | 1.240 ** (0.447, 2.083) | - |
| Walking 150+ minutes | - | - | 1.008 ** (0.414, 1.643) |
| AIC | 172.77 | 167.46 | 165.72 |
| BIC | 189.97 | 184.67 | 182.92 |
| pseudo R2 (McFadden) | 0.100 | 0.130 | 0.140 |
Reference: Age (60–69) and Car Ownership (No). Age; Sex; Race; Education; Car Ownership; Mobility Aid Use; Traffic Accidents or Walk Score; Accessibility to Destination; Safety, Comfort, and Convenience; Physical and Social Disorder, and Walking Choice/Walking 3+ days/Walking 150+ min were added and then stepwise elimination procedures were applied in both directions for the final models; † p < 0.1; * p < 0.05; ** p < 0.01; *** p < 0.001.
Publisher’s Note: MDPI stays neutral with regard to jurisdictional claims in published maps and institutional affiliations. |
© 2021 by the author. Licensee MDPI, Basel, Switzerland. This article is an open access article distributed under the terms and conditions of the Creative Commons Attribution (CC BY) license (http://creativecommons.org/licenses/by/4.0/).
Share and Cite
MDPI and ACS Style
Yun, H.Y. Neighborhood Built Environments, Walking, and Self-Rated Health among Low-Income Older Adults in St. Paul, Minnesota. Sustainability 2021, 13, 3501. https://0-doi-org.brum.beds.ac.uk/10.3390/su13063501
AMA Style
Yun HY. Neighborhood Built Environments, Walking, and Self-Rated Health among Low-Income Older Adults in St. Paul, Minnesota. Sustainability. 2021; 13(6):3501. https://0-doi-org.brum.beds.ac.uk/10.3390/su13063501
Chicago/Turabian StyleYun, Hae Young. 2021. "Neighborhood Built Environments, Walking, and Self-Rated Health among Low-Income Older Adults in St. Paul, Minnesota" Sustainability 13, no. 6: 3501. https://0-doi-org.brum.beds.ac.uk/10.3390/su13063501
Note that from the first issue of 2016, this journal uses article numbers instead of page numbers. See further details here.