1. Introduction
The topic of energy efficiency in industry is rising to the top of the agendas of the European Union (EU) and Member States, primarily for environmental (need to reduce greenhouse gas emissions) and economic (i.e., unstable energy prices and reliability of supply) arguments [
1,
2].
The Energy Efficiency Directive 2012/27/EU (EED) is a solid cornerstone of Europe’s energy legislation. It includes a balanced set of binding measures planned to help the EU reach its 20% energy efficiency target by 2020. The EED establishes a common framework of measures for the promotion of energy efficiency (EE) to ensure the achievement of the European targets and to pave the way for further EE improvements beyond 2020. The Italian Government transposed the EED in 2014 (by issuing the Legislative Decree no. 102/2014, recently updated by Legislative Decree no. 73/2020), also extending the obligation to a specific group of energy-intensive enterprises (mostly small and medium enterprises, SME). The ENEA (Italian National Agency for New Technologies, Energy, and the Sustainable Economic Development) was appointed to manage the obligation of EED Article 8 [
3], which is dedicated to energy audits, a tool used to assess the existing energy consumption and identify the whole range of opportunities to save energy.
In the EED, energy audit (EA) is defined as a systematic procedure aimed at obtaining adequate knowledge on the existing energy consumption profile of a building or group of buildings, an industrial or commercial operation, or installation for private or public service, identifying and quantifying cost-effective energy savings opportunities, and reporting the findings.
According to Article 8 of Legislative Decree 102/14, two categories of companies, namely large enterprises and energy-intensive enterprises, have been targeted as obliged to carry out energy audits on their sites, first by the 5 December 2015, and then at least every four years.
Obliged enterprises that do not carry out an energy audit observing Annex II of the EED within the above-mentioned deadlines will be subject to administrative monetary penalties. According to Article 8 of the Italian Legislative Decree 102/2014 implementing the Energy Efficiency Directive, as of 31 December 2019, ENEA received 11,172 energy audits of production sites, related to 6434 companies [
4].
Over 53% of the audits were carried out on sites related to the manufacturing sector and over 14% in trade. A total of 70% of the audits collected by ENEA are equipped with specific monitoring of energy consumption.
Despite relevant efforts having been deployed in terms of both innovation technologies and regulatory frameworks in enabling it, the full potential for energy efficiency in the industrial sector remains significant.
According to [
5], in 2011, industry was the largest heat-consuming sector (79 EJ), accounting for 46% of the world total thermal energy demand. Based on recent IEA Outlooks [
6,
7], however, the industrial heat makes up two-thirds of industrial energy demand and 20% of global energy consumption.
In Italy, in 2018 [
8], about 2234 ktoe of heat was consumed by industry, representing 53% of the national heat demand, 7% of the total national energy need, and 17.5% of the industry energy need. Most of the required heat comes from the direct combustion of fuels, with natural gas as the main supplier followed by petroleum and coal products. The electricity consumption of the Italian industrial sector, according to [
9], with reference to 2018, was equal to 126.4 10
9 kWh, representing about 42% of the national electricity request.
Within the framework of the described scenario, the reduction in energy consumption in the industrial sector, together with the increment of the efficiency of energy generation technologies, are fundamental aspects to meet the EU targets. The industrial sector offers tremendous opportunity for low-cost energy savings and carbon reductions through energy efficiency improvements.
In this context, cogeneration, or combined heat and power (CHP) (i.e., the combined generation of electricity and useful heat from a single primary energy source), still plays a significant role while maintaining long-term prospects in the global energy markets, primarily due to its numerous operational, environmental, and economic benefits. Since the 1970s, cogeneration has been used to improve the efficiency of production systems, both in the industrial and civil fields. In Italy, industry is the sector that invested the most in cogeneration technologies in the past decades. The higher value of the electricity price paid by Italian industries compared to other EU members was one of the main drivers toward the diffusion of CHP. Indeed, the sum of investments in energy efficiency in 2018 in Italy was about 7.1 billion €, of which about 7% (about 480 M€) was in cogeneration technologies [
10]. The industrial sector has contributed for 443 million € of investments in CHP technologies.
According to the latest annual report on cogeneration [
11], the total number of CHP units installed in Italy is equal to 1737, more than 89% of which are represented by internal combustion engine (ICE) units. The overall installed generation capacity is equal to 13,233 MW. The annual gross electricity generation with CHP units equals 58,722 GWh/y, while useful heat generation reached 36,076 GWh/y. Natural gas is the main source, with about 119,000 GWh/y of primary energy supplied.
Application of CHP technologies in the industrial sector is preferred in manufacturing processes that require a significant amount of electricity and heat simultaneously, throughout the whole year. In this respect, the ceramic tile production is one among the industrial processes where energy efficiency management is crucial, given the high energy demand necessary for the production cycle (covered, at the present, for about 70% by natural gas), and the incidence of the energy item on the final production cost, close to 20%.
In 2016, Confindustria Ceramica, the association of Italian ceramics, conducted research on thermal efficiency strategies developed to optimize the energy consumption of the ceramic tiles industry [
12]. The research analyzed a sample of 64 production sites covering 59.6% of national production. A first energy saving solution, started in the early 1980s, was the recovery of the indirect cooling air of kilns to the dryers. In 2016, this strategy concerned 43.2% of vertical dryers and 35.2% of horizontal dryers. The second and most effective energy efficiency strategy was the introduction of the CHP units in the 90s, and their diffusion had another strong impulse around 2008 (see
Figure 1), thanks to the establishment in Italy of the TEE (“Titoli di Efficienza Energetica”). The TEE is a mechanism introduced by D.M. 24 April 2001 to incentivize the implementation of energy efficiency interventions that comply with the national energy savings targets (2001/77/CE). The most adopted configuration provides for the spray dryer as the thermal user for the CHP plant, while the prime movers are gas turbines and internal combustion engines. The study reported in [
12] also highlighted that most parts of the CHP units with gas turbine technology was closer to their end life (17.4 years compared to a hypothetical end life of 24 years) than CHP units with an internal combustion engine (eight years compared to a hypothetical end life of 20 years). This means that this latter technology has generally been installed more frequently since 2008.
In 2019, the ceramic tile industries located in Italy comprised 135 [
13], of which 54 were equipped with a spray dryer. Within the latter, 28 were provided with a CHP unit, helping to satisfy both the electrical and thermal request of the production process.
The literature on cogeneration in industrial applications is exhaustive: most relevant examples can be found in [
14,
15,
16,
17,
18,
19,
20,
21,
22,
23,
24,
25]. In detail, performance assessment and optimal scheduling of a CHP power plant for industrial applications can be found in [
14,
15,
16,
17,
18]. Description and energy analysis of specific applications of CHP to industrial processes have been reported in [
20,
21,
22,
23,
24] for the food processing industry, in [
21] for cement production, in [
25] for the textile industry, and finally in [
19] for the chemical and pulp mill industry.
In contrast, studies dealing with the specific application of cogeneration in ceramic tiles factories, according to the authors’ knowledge, are limited. Caglayana et al. [
26,
27,
28] presented an energy, exergy, and sustainability analysis of a CHP gas turbine applied in the ceramic sector. The main results of their studies showed that the utilization of the gas turbine (GT) unit could provide 0.1115 m
3/s and 0.0732 m
3/s of natural gas savings for the ground and wall tile dryers, respectively. Moreover, their results highlight that the most efficient components are the air compressor and combustion chamber, while the minimum energy efficiencies were obtained for the wall tile dryer (8%) and ground tile dryer (8%) components. Yoru et al. [
29] presented an energy and exergy analysis on a CHP system installed into a ceramic plant consisting of three GT units. Results claim that the exergy efficiency was inversely proportional to the ambient temperature: the rise of ambient temperature at the compressor inlet adversely affected the efficiency of the system. The energy and exergy efficiencies of the cogeneration system were calculated as 82% and 35%, respectively.
More strategies on how the EU ceramic sector is following energy efficiency policies and environmental concerns can be found in [
30,
31,
32,
33,
34,
35,
36].
In particular, different technological options to reach the EU 2020 and 2050 greenhouse gas (GHG) emissions objectives were compared in [
34] using the LCA methodology on 25 different technological scenarios of the life cycle of porcelain stone tiles. The GHG emissions’ objectives, considering only the ceramic tile production stage, can be achieved by modifying the product design (removal of the glaze and reduction of the thickness of the ceramic body) or by electrifying 50% of the thermal processes through renewable sources.
A more efficient and sustainable production appears to be the only option for a long-term prospective of manufacturing industries. Efforts required by the traditional industry should be directed toward implementing measures that concurrently guarantee a global energy savings and a reduction in the environmental impacts.
In the aforementioned context, ENEA launched a two-year research project in collaboration with the University of Bologna, Centro Ceramico, and Confindustria Ceramica with the aim of delineating the current status of cogeneration in the Italian ceramic tile sector. The final purpose of the project is to define the energetic and environmental benefits associated with the application of CHP systems to the ceramics industry. This paper summarizes the results of the first-year research activities, which focused on outlining the average characteristics of the prime movers installed, and quantifying the contribution of CHP thermal energy, supporting the spray dryer section. Starting from the analysis of the energy audits of ceramic companies collected by ENEA, a detailed assessment of the CHP units’ specific characteristics was realized by integrating these data with information directly requested from ceramic companies.
The study’s outcomes provide for an overview of the current situation, and can be used by industrial developers as guidelines for the selection and design of CHP units as well as by law-making bodies as a reference for energy efficiency programs including incentives policy.
The rest of this manuscript is organized as follows. In
Section 2, a synthetic description of the ceramic tile production process is presented, and emphasis is given to the detailed explanation of the spray dryer technology. Thermal integration with the CHP units, contributing to satisfy the heat consumption of the dryer unit, is presented with schematic layouts of the integrated system. The research method, data collection, and energetic performance indexes, ad hoc defined for the purpose of this analysis, are outlined in
Section 3.
Section 4 presents and discusses the main results of the study. Finally, in
Section 5, the conclusions of the study are highlighted along with the future steps of the project.
2. Description of the Ceramic Tile Process
Ceramic tile production plants have been totally revolutionized to improve productivity and decrease energy consumption as a reaction to the energy crisis of 1974 [
37].
Ceramic tiles are the result of a process that is strongly influenced by the raw materials and firing temperature: as a function of these two parameters, different types of tiles can be obtained (porcelain tile, monoporosa, single-firing tile, double-firing tile, etc.).
The production process (
Figure 2) generally starts with the storage and the preparation phase of the raw materials, consisting of two main operations: wet grinding and water content adjustment [
38]. Wet grinding technology, which uses a continuous or discontinuous drum mill, can reduce particle size, dust pollution, and provides a good homogenization [
39]. Subsequently, the aqueous suspension (“slip”, with a water content of ≅30%) obtained from the wet grinding is dried and transformed into spherical granules by way of the operation called spray drying.
Spray-dried granules (still containing ≅5–6% of water) are then shaped by discontinuous or continuous pressing in order to obtain the tiles, which are further dried to remove the remaining water through a process of surface evaporation and interstitial diffusion, which takes place homogeneously in the vertical or horizontal rapid dryers. After the glazing and decoration phases, currently mainly performed by digital printing, firing takes place in roller kilns 70 ÷ 100 m long. In kilns, the tiles are exposed to increasing temperature until they reach the maximum temperature zone around 1000–1200 °C, then they are quickly cooled. After cooling, tiles can be treated by several mechanical processes such as cutting, grinding, lapping, and polishing, after which they are sorted and packed.
The production process above described is a single firing process and is mainly used for the production of monoporosa and porcelain tiles.
A double firing process was also adopted in the past. In this case, glazing and decoration occurred after a first firing step at about 1000–1100 °C, which is needed to fire only ceramic tile bodies. The second firing was necessary to fire only the glaze, and it was generally carried out at lower temperature as a function of the type of glaze (≅700 °C).
Table 1 and
Table 2 summarize the energy consumption according to the phase of the production process and the type of product, respectively.
2.1. The Spray Dryer Technology
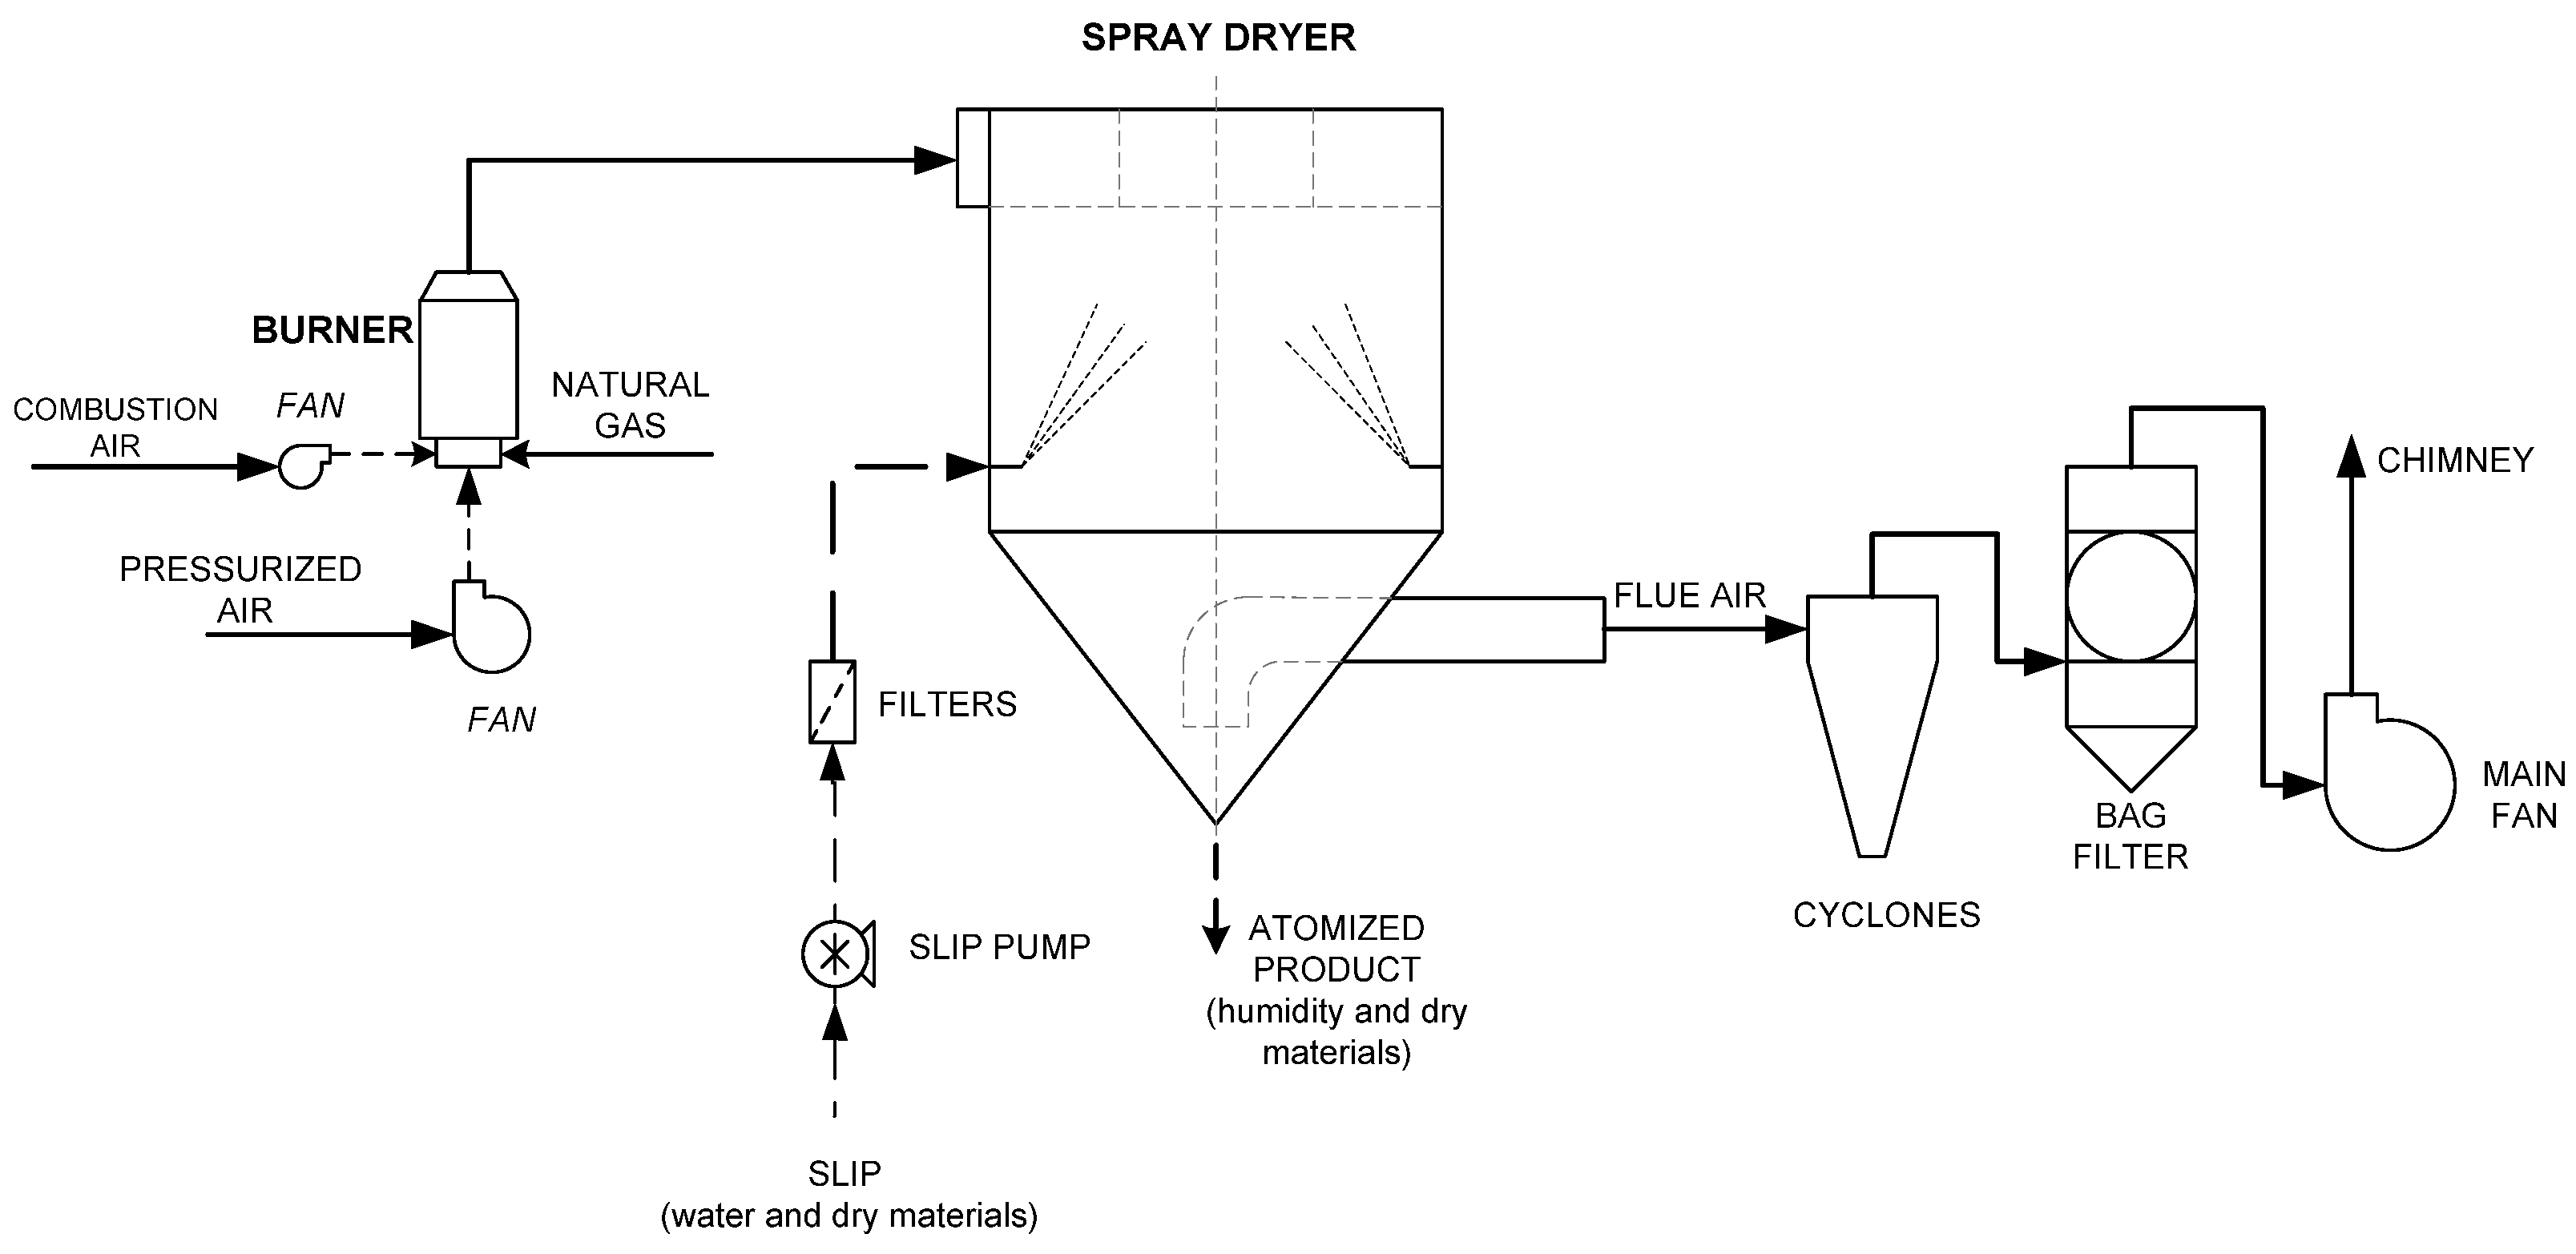
The spray dryer apparatus, as shown in
Figure 3, essentially consists of a cylindrical chamber, where a heat exchange is promoted between the slip and a hot air flow with a temperature of about 500 °C. The slip is finely sprayed upward via nozzles in the form of droplets, while the hot air is directed tangentially downward to impose a spiral motion. Thanks to the heat exchange process, an immediate evaporation and consequent hardening of the external side of the droplet take place, and simultaneously, the water vapor in the interior leaves the droplet through its rear, which collapses inward, forming the characteristic hollow sphere appearance [
38,
39].
The application of spray dryers in the ceramic tile industry has optimized the shaping process, assuring a high degree of compactness in the formed product. Spray-dried powders have a tailored particle size distribution (mainly concentrated in the 125–500 µm range) and a moisture content of ≅5–6%. The spray-dried powder optimally fills the press molds by the spherical shape of the granules, which improves its floatability and compaction. Furthermore, spray drying promotes the agglomeration of fine powders (<125 µm), avoiding de-airing problems during pressing [
39].
The hot air flow in the spray dryer is usually generated by the combustion of natural gas and ambient air into a burner section (see
Figure 3). At this stage, CHP units are usually installed, exploiting the gas turbine and internal combustion engine technologies.
As visible in
Figure 3, the flue air stream, before being discharged into the atmosphere, is forced to pass through a gas cleaning section typically composed of cyclones and bag filters for dust removal.
In a large part of Italian installations, energy efficiency solutions are adopted to supply part of the heat required by the spray dryer. The study in [
12] reports that over a sample of 71 spray dryers, 18% of them made use of heat recovery from kilns, 44% used CHP units, 4% used both systems, and 34% did not use any solution.
2.2. Cogeneration System Supporting the Dryer Process
Gas turbines (GTs) and internal combustion engines (ICEs) are the two CHP technologies currently installed in the ceramic tiles industry [
12]. In both types of prime movers, the electrical energy generated by the CHP unit is used to fully or partially satisfy the electricity demand of the ceramic tile production process. The heat rejected by the prime mover (PM) is used to support the spray dryer process with the direct use of exhaust gases.
Simplified layouts of GTs and ICEs thermally integrated with a spray-dryer are presented in
Figure 4 and
Figure 5, respectively.
In both configurations, the CHP units’ exhaust gases are heated up until the optimal process operating temperature (i.e., typically in the range 500–600 °C), thanks to an afterburner. The main difference between the arrangements lies in the amount of fresh air that is added into the process. Exploiting exhaust coming from a GT unit allows for the use of a small fraction of fresh air coming from ambient and pressurized by means of a fan (“pressurized air” in
Figure 4). The streams are mixed, as in
Figure 4, before entering the after-burner. If the mass flow of the exhaust is sufficient to support the drying process, the air mass flow could eventually be unnecessary. Conversely, the direct use of ICEs exhausted gases require a more significant amount of fresh air. Thus, as visible in
Figure 5, both streams named “combustion air” and “pressurized air” are used in this configuration. The pressurized air stream is mixed with the ICE exhausted one and post combustion takes place, also introducing the combustion air inside the after-burner component.
This difference between the CHP spray dryer setup was mainly due to two reasons: (i) the different mass flow of GT and ICE exhaust gases discharged for a given electrical size, and (ii) the different concentration of oxygen in the exhaust. For the same electric size of the CHP unit, ICEs are characterized by a lower amount of thermal power discharged with the exhaust, both in terms of mass flow rate and temperature, due to the higher conversion efficiency compared to GTs, and to the fraction of low-temperature heat discharged to the engine coolant. In addition, GT exhausted gases are typically characterized by an oxygen concentration within 18–19% vol. dry, while the ICE typical oxygen concentration is lower, in between 14–15% vol. dry.
The last difference lies, as indicated in
Figure 5, in the possibility of preheating the pressurized air stream exploiting the low-grade heat coming from the ICE water cooling circuit. As visible in
Figure 5, a heat exchanger is placed upstream of the fan component to increase the temperature of the pressurized air stream exploiting the engine’s cooling water heat. Typical air temperature increase is in the range 40–50 °C.
3. Methodology and Performance Indexes
In the ceramic sector, 197 energy audits carried out from 143 companies were collected by ENEA in December 2019 [
4]. A total of 103 EAs from 68 companies referred to the tile ceramic process and have been analyzed to check the CHP presence in the industrial process. The total number of production sites including a CHP system was found equal to be 28.
Starting from the analysis EA collected by ENEA, a detailed assessment of the CHP units’ specific characteristics was realized by integrating those data with information directly requested from the ceramic companies. For this purpose, a questionnaire was sent to all the ceramic tile industries equipped with CHP units and located in the tile district, containing the following specific macro-requests:
- -
type and model of the CHP unit installed;
- -
annual consumption of natural gas feeding the CHP unit and annual generated electricity;
- -
annual operating hours of the CHP unit;
- -
annual consumption of natural gas feeding the after-burner section;
- -
annual amount of slip input to the dryer section and dried products generated;
- -
annual operating hours of the dryer unit; and
- -
annual electricity consumption of the ceramic tile production process.
In response to that, this study analyzed the annual operating data collected from ten CHP installations. The energetic analysis of the dryer process and of the CHP system was accomplished by introducing the following ad hoc-defined performance indexes:
CHP natural gas primary energy input, Qin,CHP, calculated as the product of annual natural gas volume flow input to the CHP unit and lower heating value, assumed equal to 8250 kcal/Sm3.
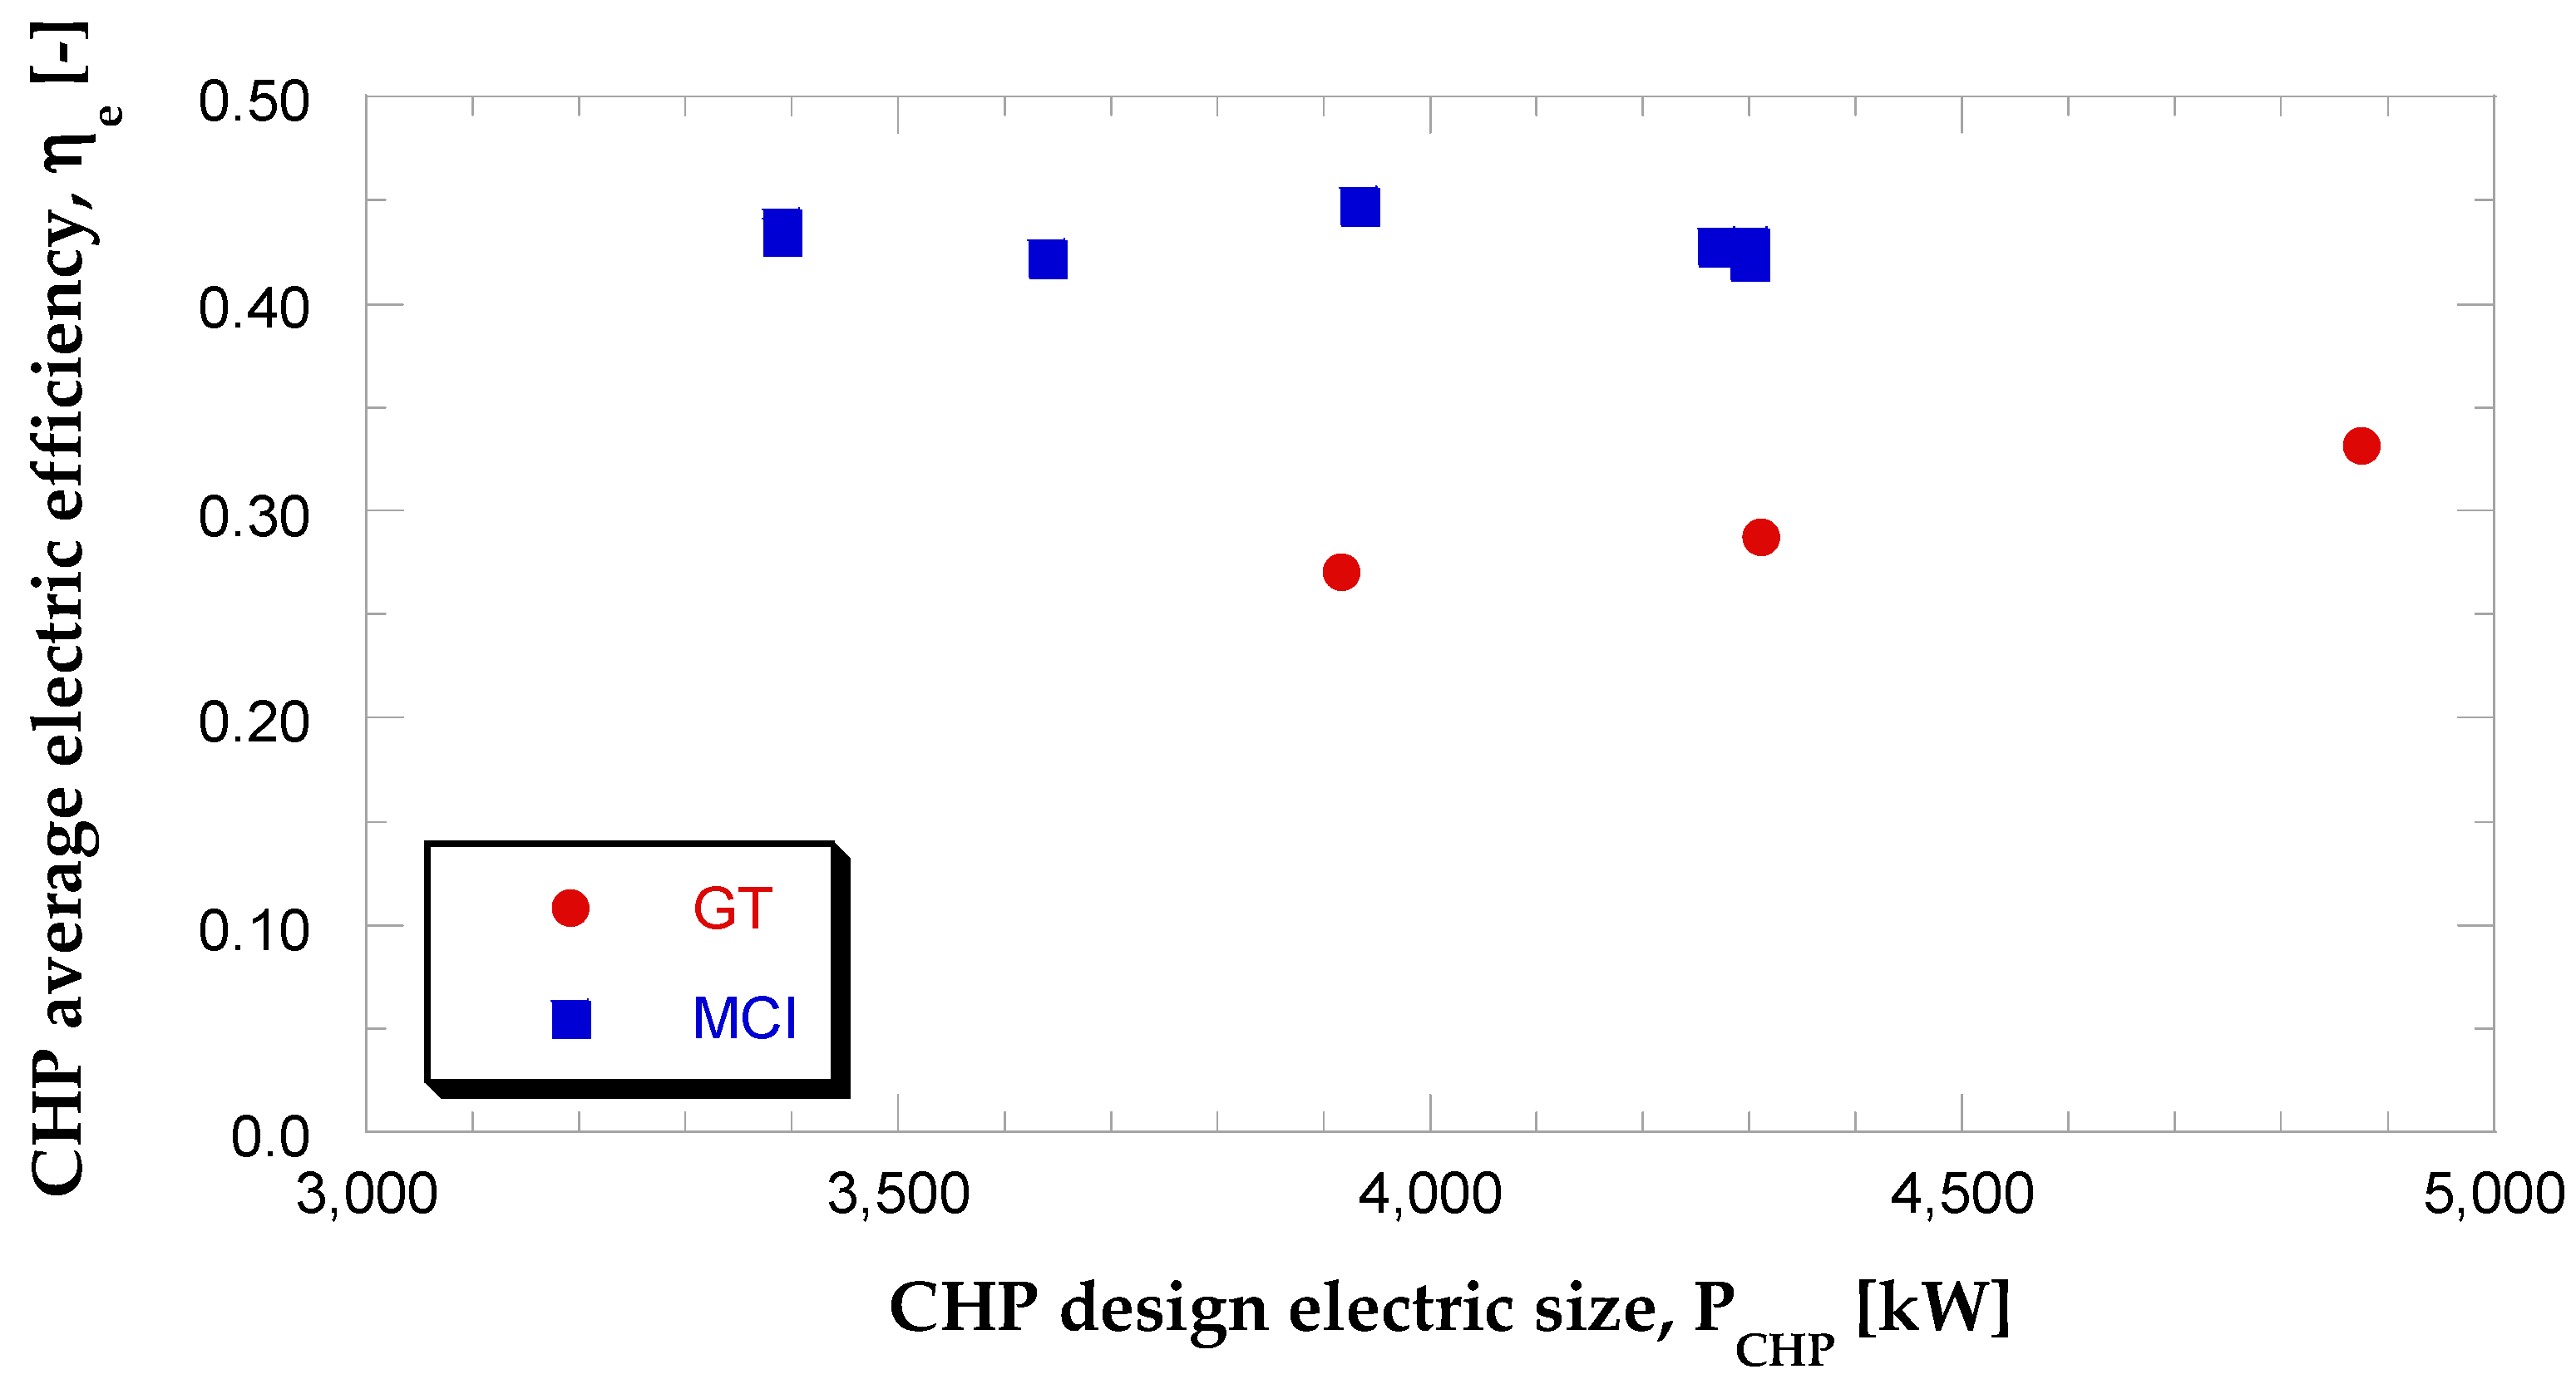
CHP average electric efficiency, , defined as the ratio between annual generated electrical energy, ECHP, and primary energy input, Qin,CHP.
Ratio of produced to consumed electrical energy, δ. This index helps to assess the design and the main target of the CHP unit. A value of δ equal to 1 means that all the energy generated by the CHP unit is used to satisfy the electricity consumption required by the production process. Values higher or lower than 1 mean, respectively, that a surplus or a deficit of electricity occurs compared to the production process needs.
Thermal energy discharged by the CHP unit, Q
gas,CHP. This variable accounts for the thermal energy discharged with PM exhaust gases, available to the thermal user. It has been evaluated, indirectly, based on following equations, according to the definition reported in [
41]:
For the internal combustion engine:
where
and
in Equations (1) and (2) represent, respectively, the combustion chamber, auxiliaries, electric conversion, and gear box efficiencies. Conversion efficiency values have been assumed equal to the ones reported in
Table 3. Coefficient
, only included in Equation (2), accounts for the fraction of discharged thermal energy (i.e., primary energy not converted into electricity) available in the high temperature heat circuit (i.e., with exhaust gases). The value of coefficient
, dependent on the ICE model, was assumed according to the manufacturers’ specifications. Assumed values were in the range 0.74–0.78.
To quantify the real amount of heat input to the spray dryer with PM exhaust gases, the quantity Qgas,CHP was corrected with a factor representing the ratio between the annual operating hours of the spray dryer unit and annual operating hours of the CHP system.
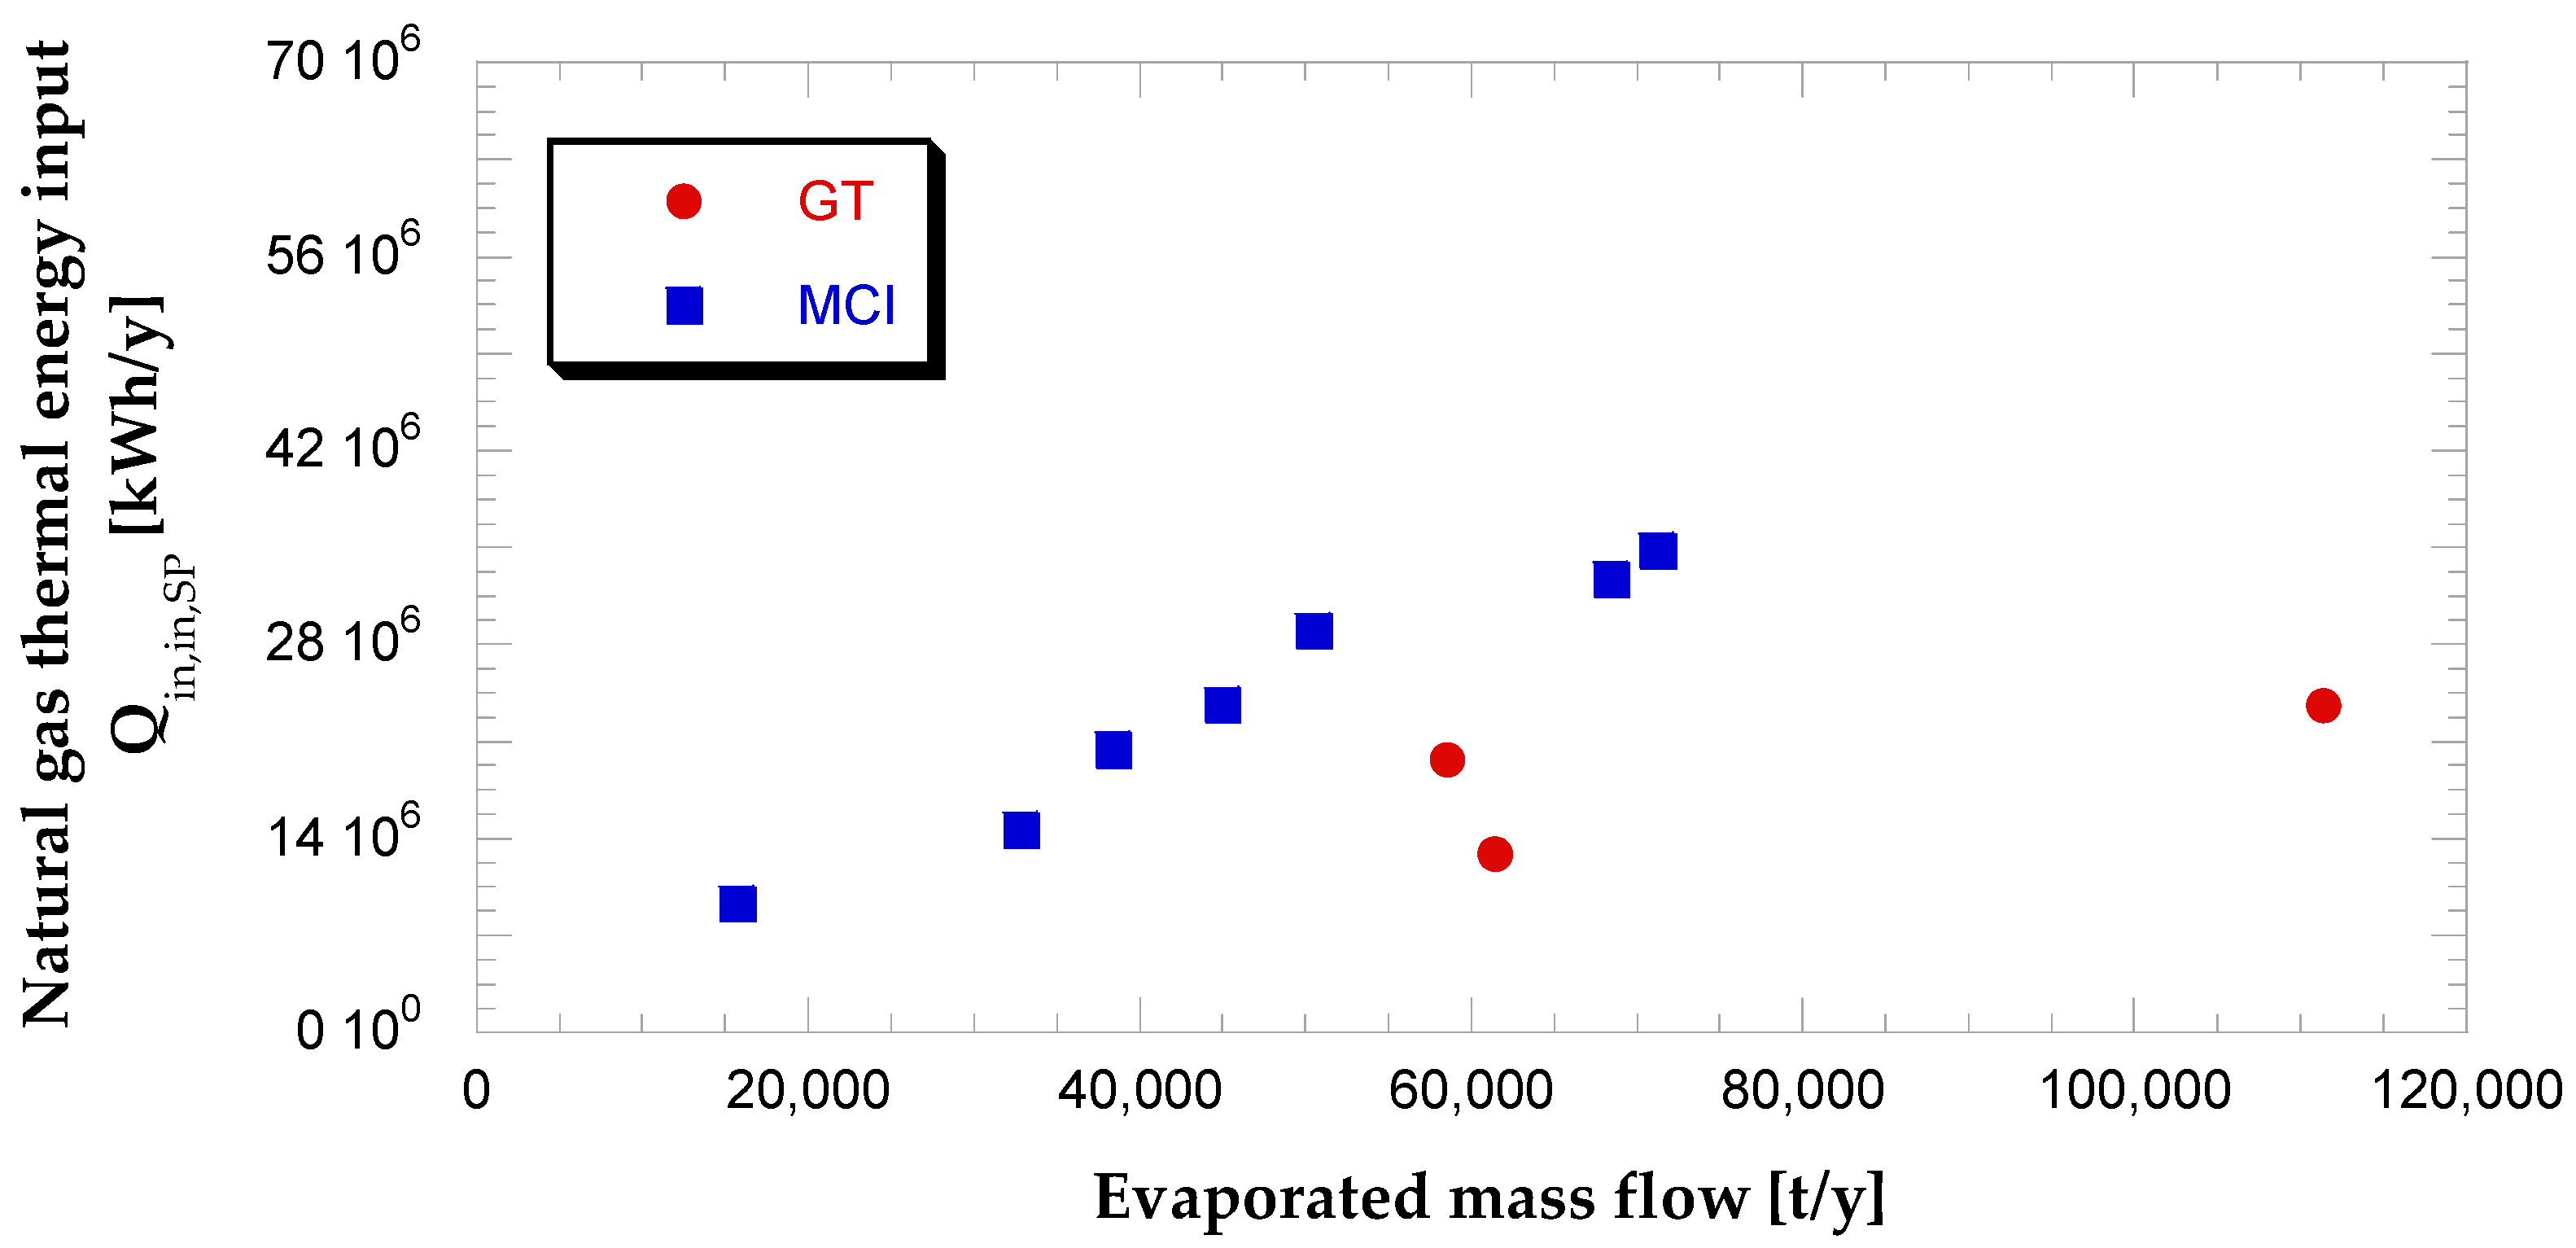
Thermal energy input to the dryer with natural gas, Qin,SP, calculated as the product of annual natural gas volume flow input to the after-burner and lower heating value equal to 8250 kcal/Sm3.
Total heat consumption of the dryer, QTOT. This variable accounts for the total heat input to the spray dryer component obtained by adding the two main thermal contributions Qin,SP and Qgas,CHP. It must be pointed out that the heat requested to heat up and vaporize the water content in the slip represents the main contribution (typical values are in the range 70–80%) to the total process need. Minor contributions are represented by the heat necessary to heat up the combustion and/or the pressurized air streams, the heat absorbed by the solid matter, and the heat dissipated through the dryer walls as the process is not adiabatic.
Fraction of total heat consumption of the spray dryer covered with CHP discharged heat, Λ.
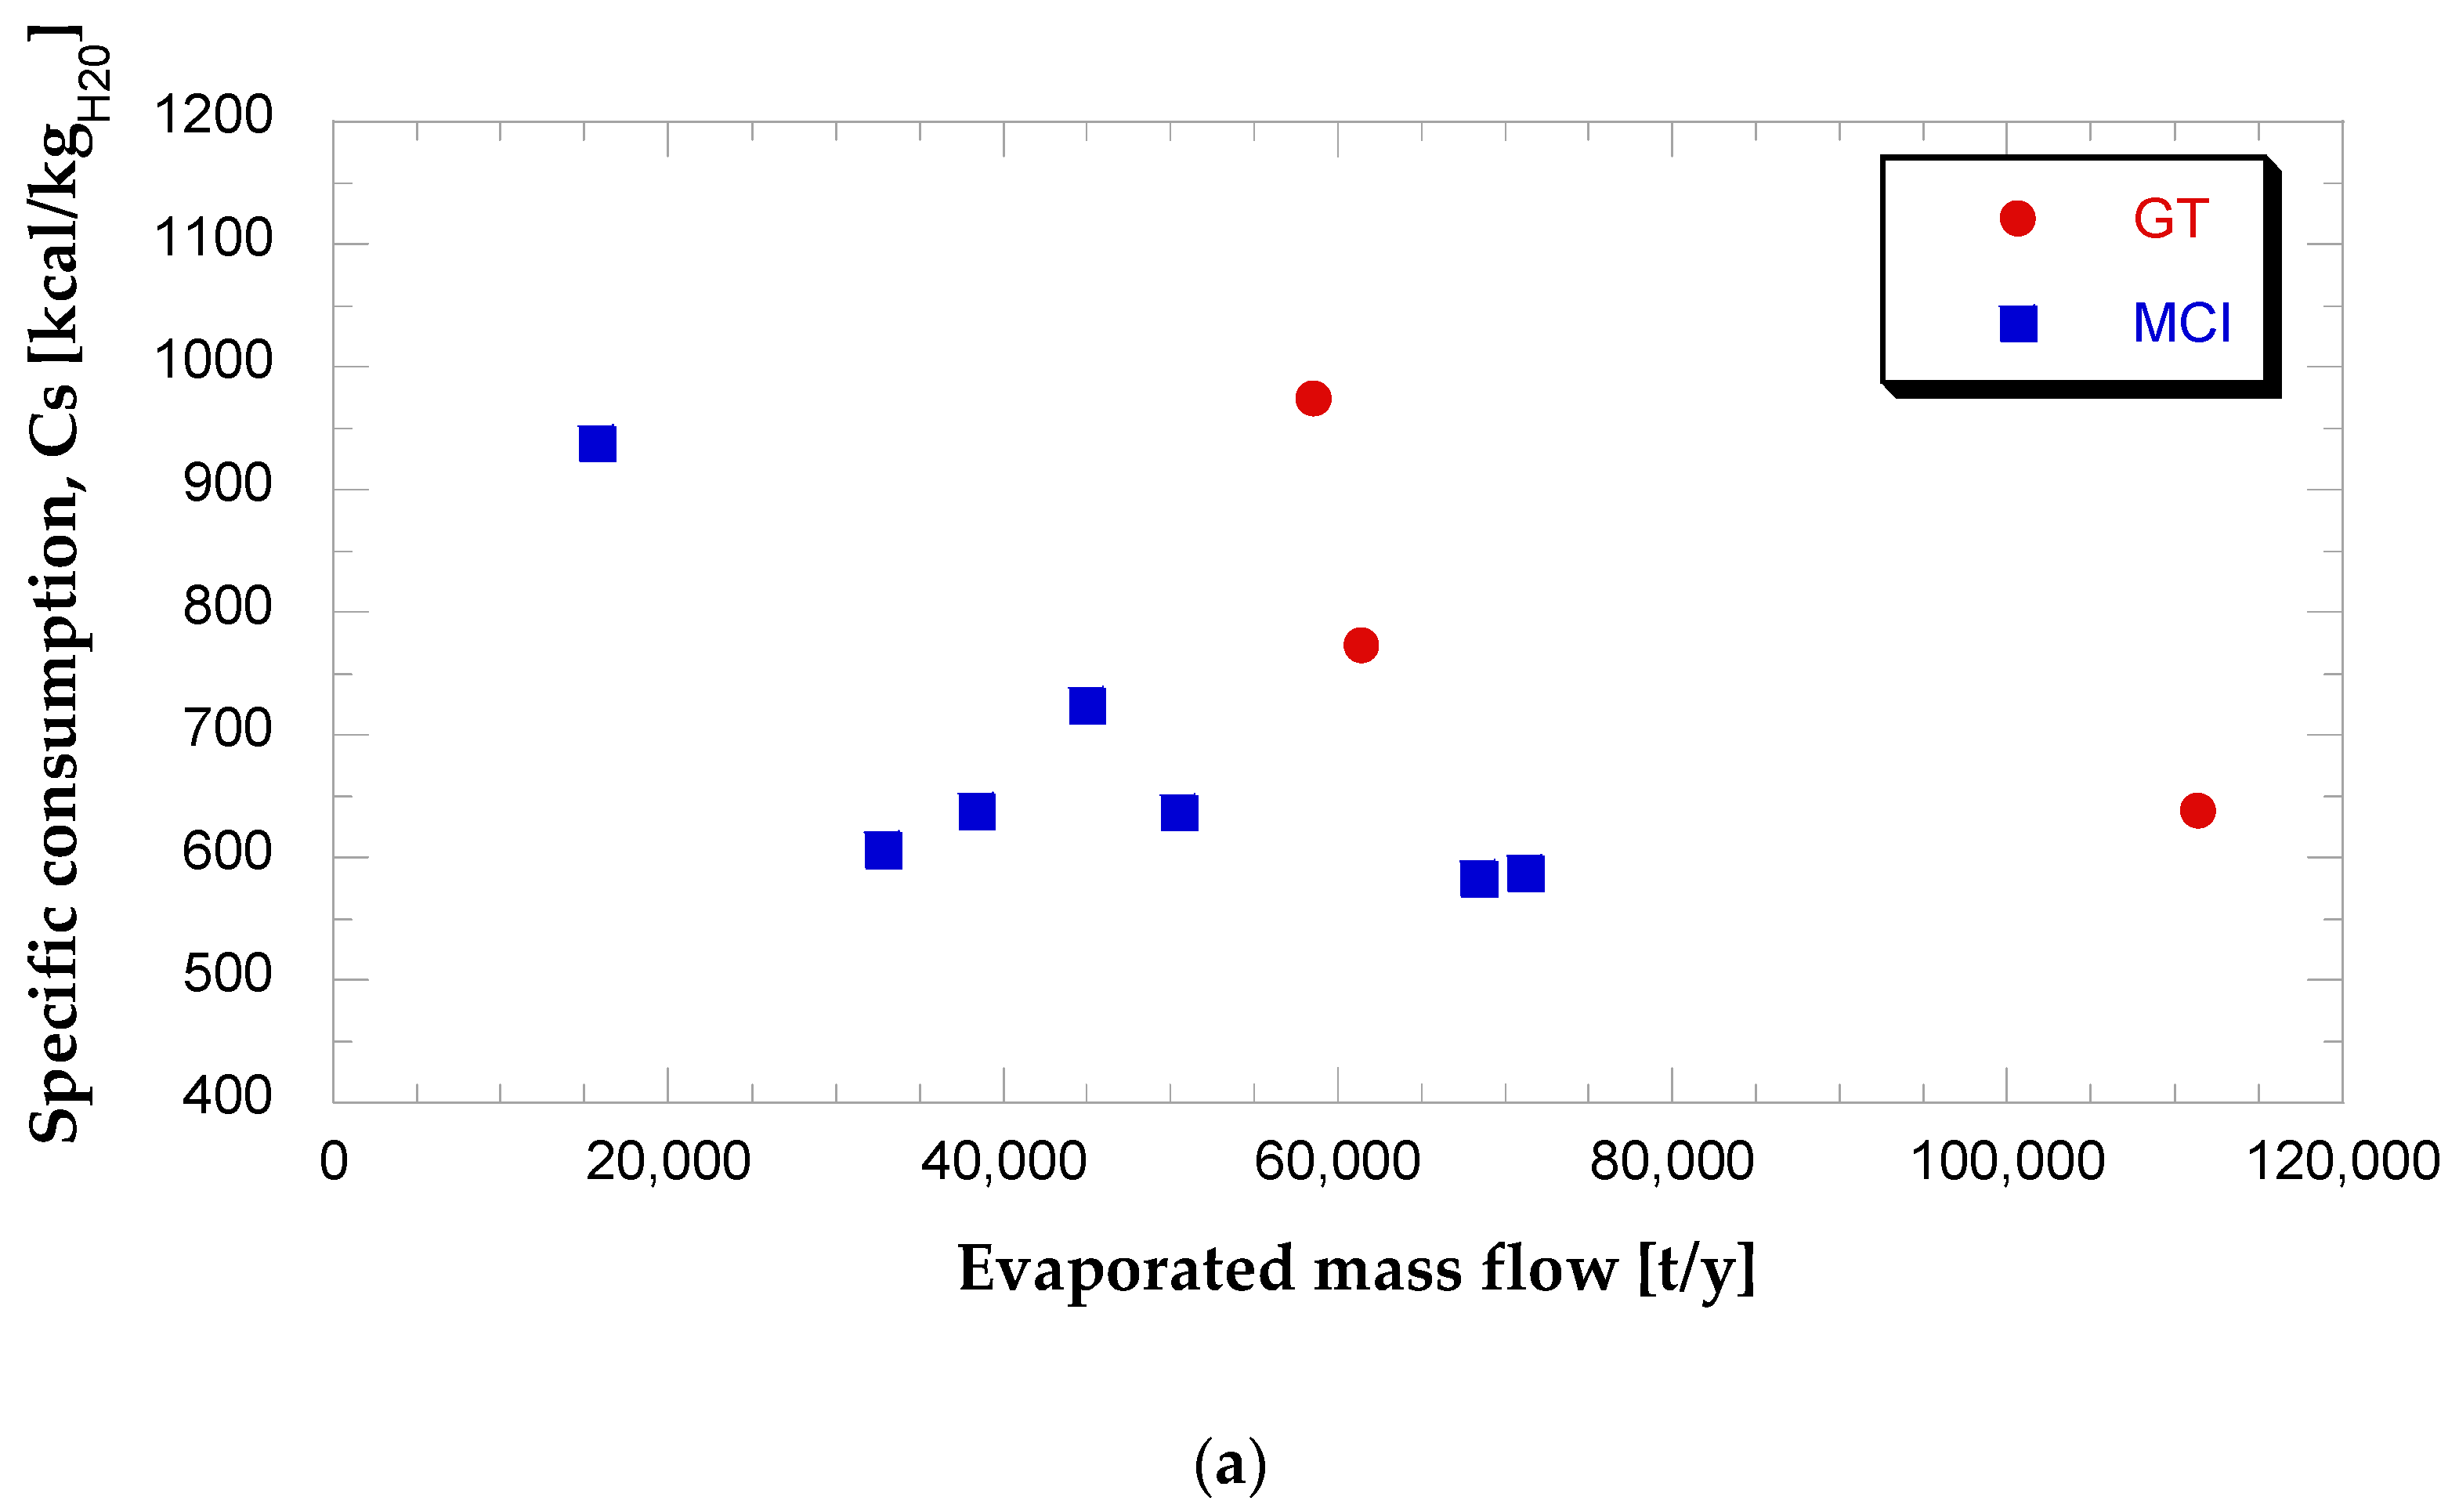
Spray dryer specific consumption, C
s. This parameter is calculated as the ratio between Q
TOT and annual amount of evaporated water,
, according to Equation (4):
The parameter Cs defines the amount of thermal energy requested by the process for unit mass of evaporated water, and it is normally expressed in kcal/kg H2O. Alternatively, the specific consumption can also be expressed with reference to kg of dried product produced.


 ,
, 


